Published: Dec 30, 2022 by Isaac Johnson
Early this week we covered setup. Today we’ll dive into Serverless monitoring of GCP Cloud Run and AWS Lambda use NodeJS examples.
We’ll look at monitoring via browsers/apps using Agentless (JavaScript). We’ll cover monitoring of Hosts (Infrastructure) and then wrap by looking at how we remove the agent from Kubernetes (which was one of our tests we set out to check at the start).
Serverless
We’ll dig into two cloud providers for Serverless; Google Cloud and Amazon.
GCP Cloud Run
We’ll pick up on our GCP Cloud Run function we developed in a blog entry from March.
We can the existing functions
builder@DESKTOP-QADGF36:~/Workspaces/idj-cloudrun$ cat index.js
const express = require('express')
const app = express()
const port = parseInt(process.env.PORT) || 8080;

const procName = process.env.NAME || 'local';

app.get('/', (req, res) => {
          res.send(`Hello World!!! - from ${procName}`)
})

app.listen(port, () => {
          console.log(`Example app listening on port ${port}`)
})

// will need for tests later
module.exports = {
        app
};
We’ll now add the Dynatrace NodeJS module (as described here)
builder@DESKTOP-QADGF36:~/Workspaces/idj-cloudrun$ nvm list | head -n4
->     v10.22.1
      v12.22.11
       v14.18.1
        v17.6.0
builder@DESKTOP-QADGF36:~/Workspaces/idj-cloudrun$ npm install --save @dynatrace/opentelemetry-gcf

> protobufjs@7.0.0 postinstall /home/builder/Workspaces/idj-cloudrun/node_modules/protobufjs
> node scripts/postinstall

npm WARN notsup Unsupported engine for protobufjs@7.0.0: wanted: {"node":">=12.0.0"} (current: {"node":"10.22.1","npm":"6.14.6"})
npm WARN notsup Not compatible with your version of node/npm: protobufjs@7.0.0
npm WARN @opentelemetry/sdk-trace-base@1.0.1 requires a peer of @opentelemetry/api@>=1.0.0 <1.1.0 but none is installed. You must install peer dependencies yourself.
npm WARN @opentelemetry/resources@1.0.1 requires a peer of @opentelemetry/api@>=1.0.0 <1.1.0 but none is installed. You must install peer dependencies yourself.
npm WARN @opentelemetry/core@1.0.1 requires a peer of @opentelemetry/api@>=1.0.0 <1.1.0 but none is installed. You must install peer dependencies yourself.
npm WARN idj-cloudrun@1.0.0 No repository field.

+ @dynatrace/opentelemetry-gcf@1.255.2
added 42 packages from 67 contributors and audited 92 packages in 21.257s

3 packages are looking for funding
  run `npm fund` for details

found 0 vulnerabilities
We’ll add the Otel specific modules next
builder@DESKTOP-QADGF36:~/Workspaces/idj-cloudrun$ npm install --save @opentelemetry/sdk-trace-node @opentelemetry/semantic-conventions
npm WARN notsup Unsupported engine for @opentelemetry/sdk-trace-node@1.8.0: wanted: {"node":">=14"} (current: {"node":"10.22.1","npm":"6.14.6"})
npm WARN notsup Not compatible with your version of node/npm: @opentelemetry/sdk-trace-node@1.8.0
npm WARN notsup Unsupported engine for @opentelemetry/semantic-conventions@1.8.0: wanted: {"node":">=14"} (current: {"node":"10.22.1","npm":"6.14.6"})
npm WARN notsup Not compatible with your version of node/npm: @opentelemetry/semantic-conventions@1.8.0
npm WARN notsup Unsupported engine for @opentelemetry/sdk-trace-base@1.8.0: wanted: {"node":">=14"} (current: {"node":"10.22.1","npm":"6.14.6"})
npm WARN notsup Not compatible with your version of node/npm: @opentelemetry/sdk-trace-base@1.8.0
npm WARN notsup Unsupported engine for @opentelemetry/propagator-jaeger@1.8.0: wanted: {"node":">=14"} (current: {"node":"10.22.1","npm":"6.14.6"})
npm WARN notsup Not compatible with your version of node/npm: @opentelemetry/propagator-jaeger@1.8.0
npm WARN notsup Unsupported engine for @opentelemetry/context-async-hooks@1.8.0: wanted: {"node":">=14"} (current: {"node":"10.22.1","npm":"6.14.6"})
npm WARN notsup Not compatible with your version of node/npm: @opentelemetry/context-async-hooks@1.8.0
npm WARN notsup Unsupported engine for @opentelemetry/propagator-b3@1.8.0: wanted: {"node":">=14"} (current: {"node":"10.22.1","npm":"6.14.6"})
npm WARN notsup Not compatible with your version of node/npm: @opentelemetry/propagator-b3@1.8.0
npm WARN notsup Unsupported engine for @opentelemetry/core@1.8.0: wanted: {"node":">=14"} (current: {"node":"10.22.1","npm":"6.14.6"})
npm WARN notsup Not compatible with your version of node/npm: @opentelemetry/core@1.8.0
npm WARN notsup Unsupported engine for @opentelemetry/core@1.8.0: wanted: {"node":">=14"} (current: {"node":"10.22.1","npm":"6.14.6"})
npm WARN notsup Not compatible with your version of node/npm: @opentelemetry/core@1.8.0
npm WARN notsup Unsupported engine for @opentelemetry/core@1.8.0: wanted: {"node":">=14"} (current: {"node":"10.22.1","npm":"6.14.6"})
npm WARN notsup Not compatible with your version of node/npm: @opentelemetry/core@1.8.0
npm WARN notsup Unsupported engine for @opentelemetry/resources@1.8.0: wanted: {"node":">=14"} (current: {"node":"10.22.1","npm":"6.14.6"})
npm WARN notsup Not compatible with your version of node/npm: @opentelemetry/resources@1.8.0
npm WARN @opentelemetry/core@1.0.1 requires a peer of @opentelemetry/api@>=1.0.0 <1.1.0 but none is installed. You must install peer dependencies yourself.
npm WARN @opentelemetry/resources@1.0.1 requires a peer of @opentelemetry/api@>=1.0.0 <1.1.0 but none is installed. You must install peer dependencies yourself.
npm WARN @opentelemetry/sdk-trace-base@1.0.1 requires a peer of @opentelemetry/api@>=1.0.0 <1.1.0 but none is installed. You must install peer dependencies yourself.
npm WARN idj-cloudrun@1.0.0 No repository field.

+ @opentelemetry/sdk-trace-node@1.8.0
+ @opentelemetry/semantic-conventions@1.8.0
added 12 packages from 1 contributor, updated 1 package and audited 105 packages in 6.645s

3 packages are looking for funding
  run `npm fund` for details

found 0 vulnerabilities
I’ll now add in the Otel trace collection
$ cat index.js
const express = require('express')
const app = express()
const port = parseInt(process.env.PORT) || 8080;

const { Resource } = require('@opentelemetry/resources');
const { NodeTracerProvider } = require('@opentelemetry/sdk-trace-node');
const { SemanticResourceAttributes } = require('@opentelemetry/semantic-conventions');
const { DtSpanExporter, DtSpanProcessor, DtTextMapPropagator, DtSampler } = require('@dynatrace/opentelemetry-core');

const provider = new NodeTracerProvider({
  resource: new Resource({
    [SemanticResourceAttributes.SERVICE_NAME]: "Freshbrewed CloudRun",
  }),
  sampler: new DtSampler()
});

const processor = new DtSpanProcessor(new DtSpanExporter());
provider.addSpanProcessor(processor);
provider.register({
  propagator: new DtTextMapPropagator()
});

const procName = process.env.NAME || 'local';

app.get('/', (req, res) => {
          async function handler(req, res) {
                await startActiveHttpSpan(req, async (span) => {
                  let error;
                  try {
                        console.log(`Request being processed on port ${port}`)
                  } catch (e) {
                        error = e;
                  }

                  // status should be set before span ends
                  res.status(error != null ? 500 : 200);
                  await endHttpSpanAndFlush(span, res, error);
                  res.send(`Hello World!!! - from ${procName}`)
                });
          }
})

app.listen(port, () => {
          console.log(`Example app listening on port ${port}`)
})

// will need for tests later
module.exports = {
        app
};
Back in Dynatrace, we will need some env vars for this to work.
Go to “Deploy Dynatrace” usually linked from the landing page
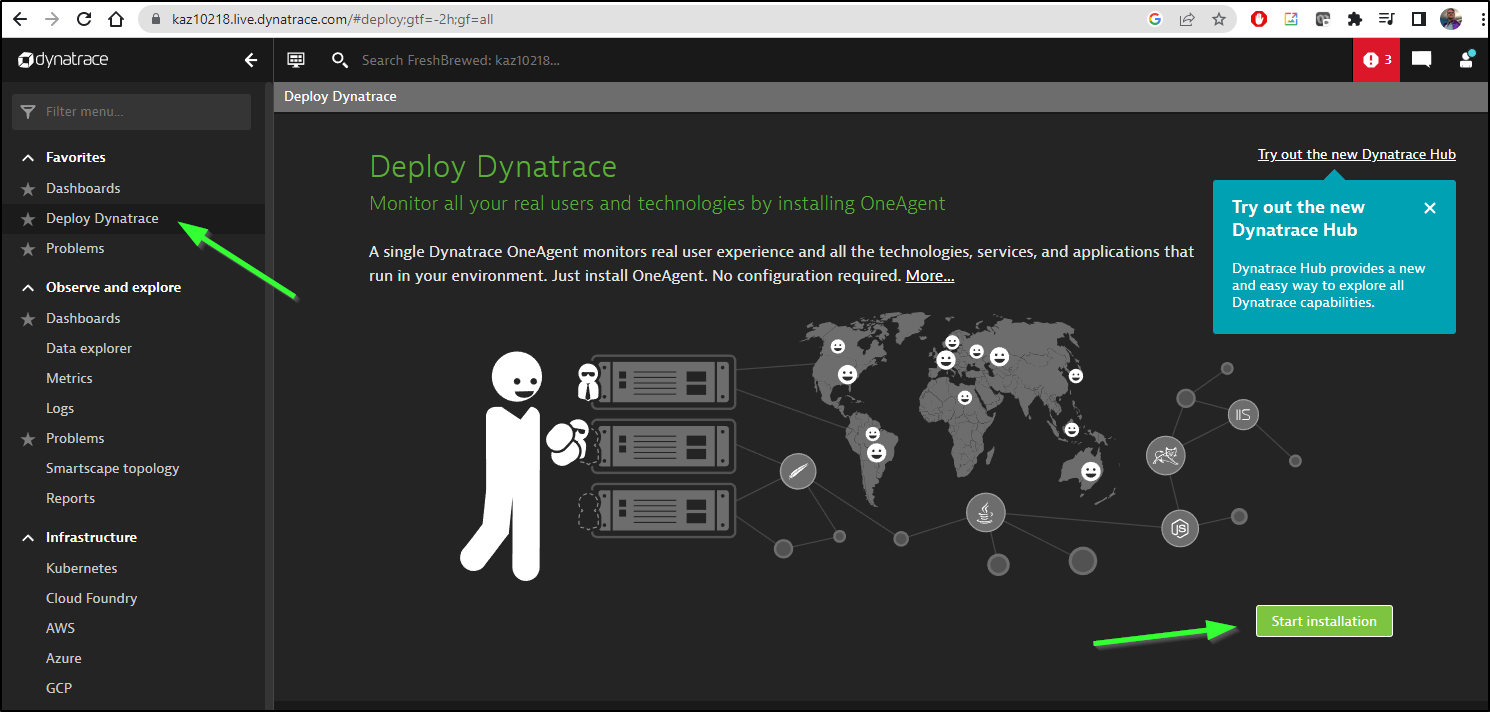
From there we can choose “Google Cloud Function”
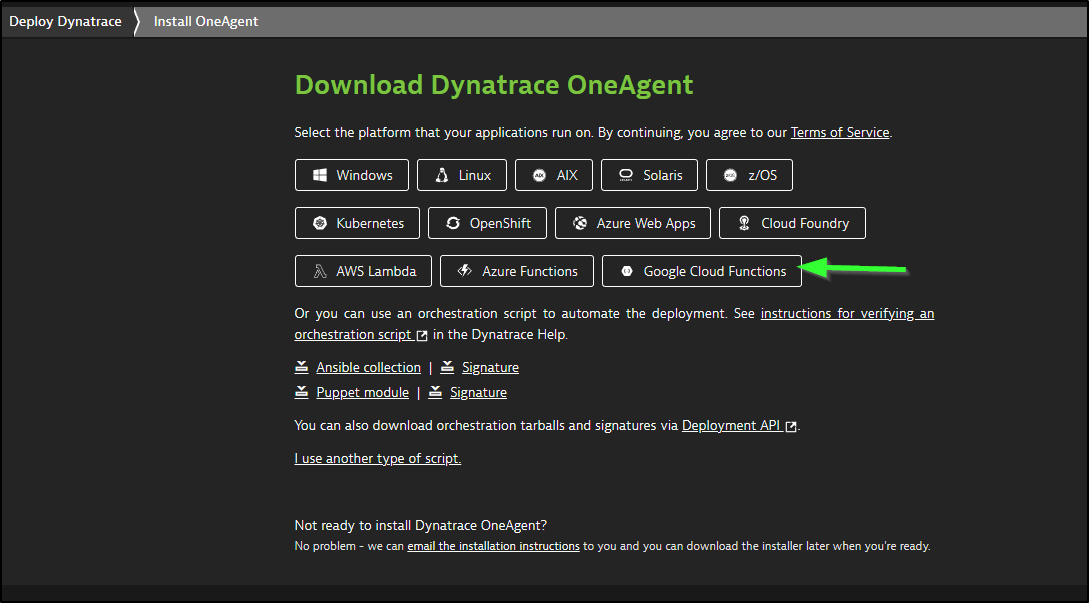
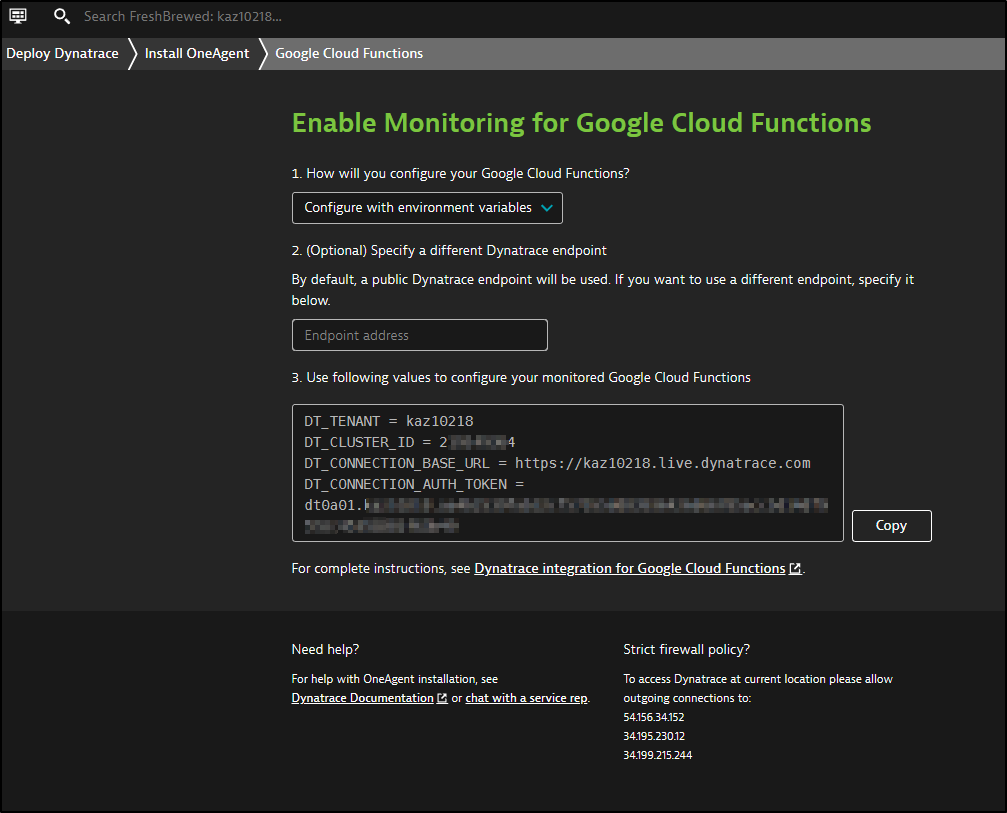
We will then get the Env Vars we need to set
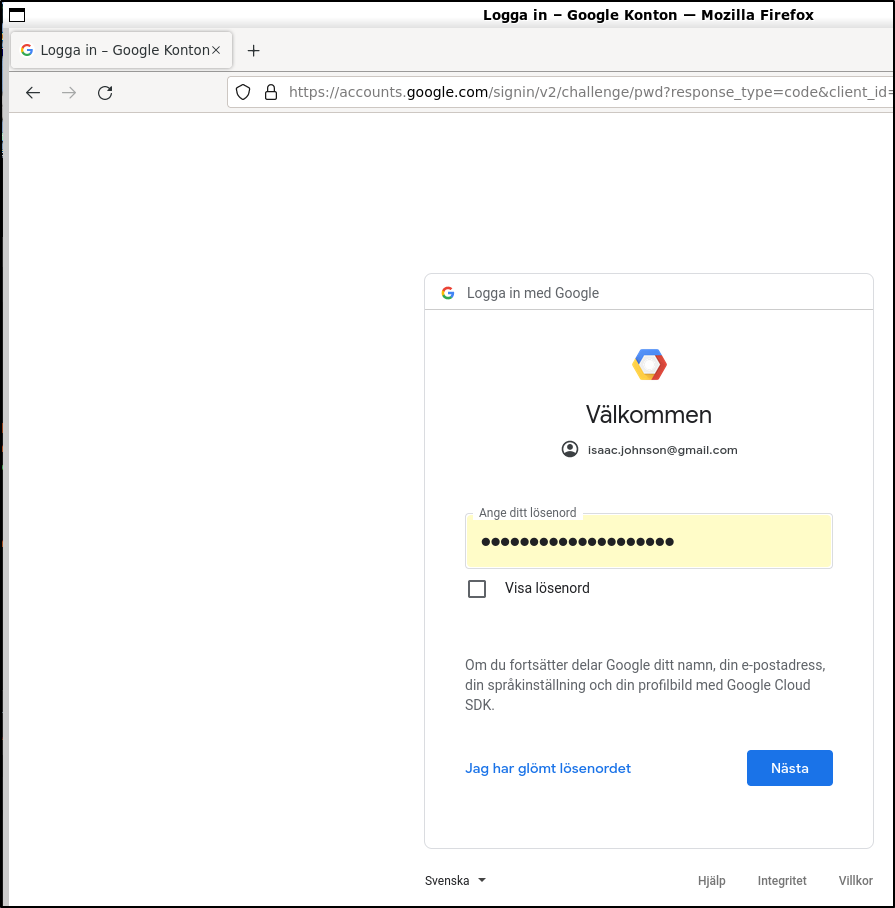
Back in my terminal, I’ll login
builder@DESKTOP-QADGF36:~/Workspaces/idj-cloudrun$ gcloud auth login
Your browser has been opened to visit:

    https://accounts.google.com/o/oauth2/auth?response_type=code&client_id=32555940559.apps.googleusercontent.com&redirect_uri=http%3A%2F%2Flocalhost%3A8085%2F&scope=openid+h...

    To take a quick anonymous survey, run:
  $ gcloud survey

builder@DESKTOP-QADGF36:~/Workspaces/idj-cloudrun$ gcloud config set project gkedemo01
Updated property [core/project].
and it’s fun when Google confuses my locale
I can now set the env vars in my Cloud Run Deployment invokation
builder@DESKTOP-QADGF36:~/Workspaces/idj-cloudrun$ gcloud run deploy idj-cloudrun --set-env-vars=DT_TENANT=kaz10218 --set-env-vars=DT_CLUSTER_ID=233333334 --set-env-vars='DT_CONNECTION_BASE_URL=https://kaz10218.live.dynatrace.com' --set-env-vars=DT_CONNECTION_AUTH_TOKEN=dt0a01.asdfasdfasdfasdfasdfasdfasdfasdfasdfasdfasdfasdfasdfasdfasdfasdfasdfasdfasdfasdfasdfasdfasdfasdf
Deploying from source. To deploy a container use [--image]. See https://cloud.google.com/run/docs/deploying-source-code for more details.
Source code location (/home/builder/Workspaces/idj-cloudrun):
Next time, use `gcloud run deploy --source .` to deploy the current directory.

Please specify a region:
 [1] asia-east1
 [2] asia-east2
 [3] asia-northeast1
 [4] asia-northeast2
 [5] asia-northeast3
 [6] asia-south1
 [7] asia-south2
 [8] asia-southeast1
 [9] asia-southeast2
 [10] australia-southeast1
 [11] australia-southeast2
 [12] europe-central2
 [13] europe-north1
 [14] europe-southwest1
 [15] europe-west1
 [16] europe-west2
 [17] europe-west3
 [18] europe-west4
 [19] europe-west6
 [20] europe-west8
 [21] europe-west9
 [22] me-west1
 [23] northamerica-northeast1
 [24] northamerica-northeast2
 [25] southamerica-east1
 [26] southamerica-west1
 [27] us-central1
 [28] us-east1
 [29] us-east4
 [30] us-east5
 [31] us-south1
 [32] us-west1
 [33] us-west2
 [34] us-west3
 [35] us-west4
 [36] cancel
Please enter numeric choice or text value (must exactly match list item):  23

To make this the default region, run `gcloud config set run/region northamerica-northeast1`.

Deploying from source requires an Artifact Registry Docker repository to store built containers. A repository named
[cloud-run-source-deploy] in region [northamerica-northeast1] will be created.

Do you want to continue (Y/n)?  Y

This command is equivalent to running `gcloud builds submit --pack image=[IMAGE] /home/builder/Workspaces/idj-cloudrun` and `gcloud run deploy idj-cloudrun --image [IMAGE]`

Allow unauthenticated invocations to [idj-cloudrun] (y/N)?  y

Building using Buildpacks and deploying container to Cloud Run service [idj-cloudrun] in project [gkedemo01] region [northamerica-northeast1]
✓ Building and deploying new service... Done.
  ✓ Creating Container Repository...
  ✓ Uploading sources...
  ✓ Building Container... Logs are available at [https://console.cloud.google.com/cloud-build/builds/c067a4b4-ce8a-4091
  -a82c-722e81c111c6?project=658532986431].
  ✓ Creating Revision... Revision deployment finished. Checking container health.
  ✓ Routing traffic...
  ✓ Setting IAM Policy...
Done.
Service [idj-cloudrun] revision [idj-cloudrun-00001-veb] has been deployed and is serving 100 percent of traffic.
Service URL: https://idj-cloudrun-v7nqcvq4eq-nn.a.run.app
I can check Cloud Run to see that my new environment variables are associated to the revision
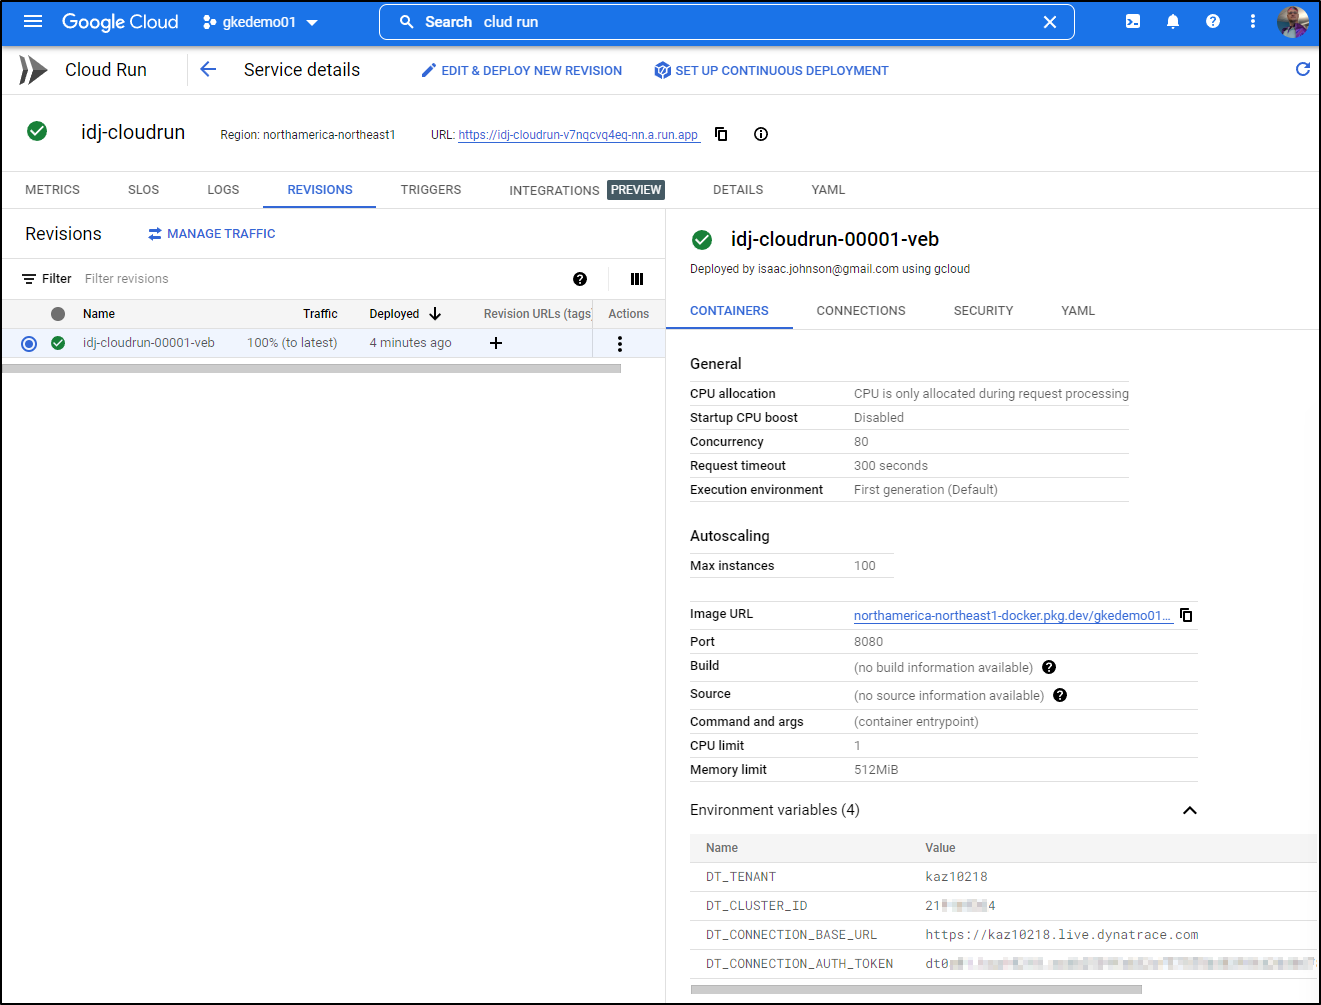
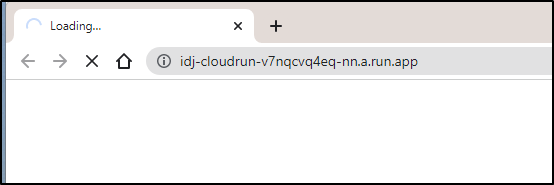
The first time I hit the app, it will take a minute for startup
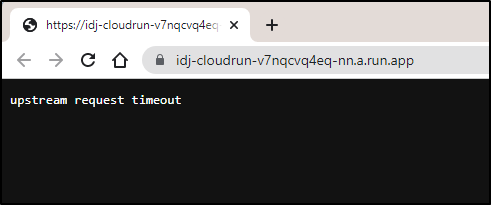
After a long enough time, I got an error
This was also reflected in GCP Logging
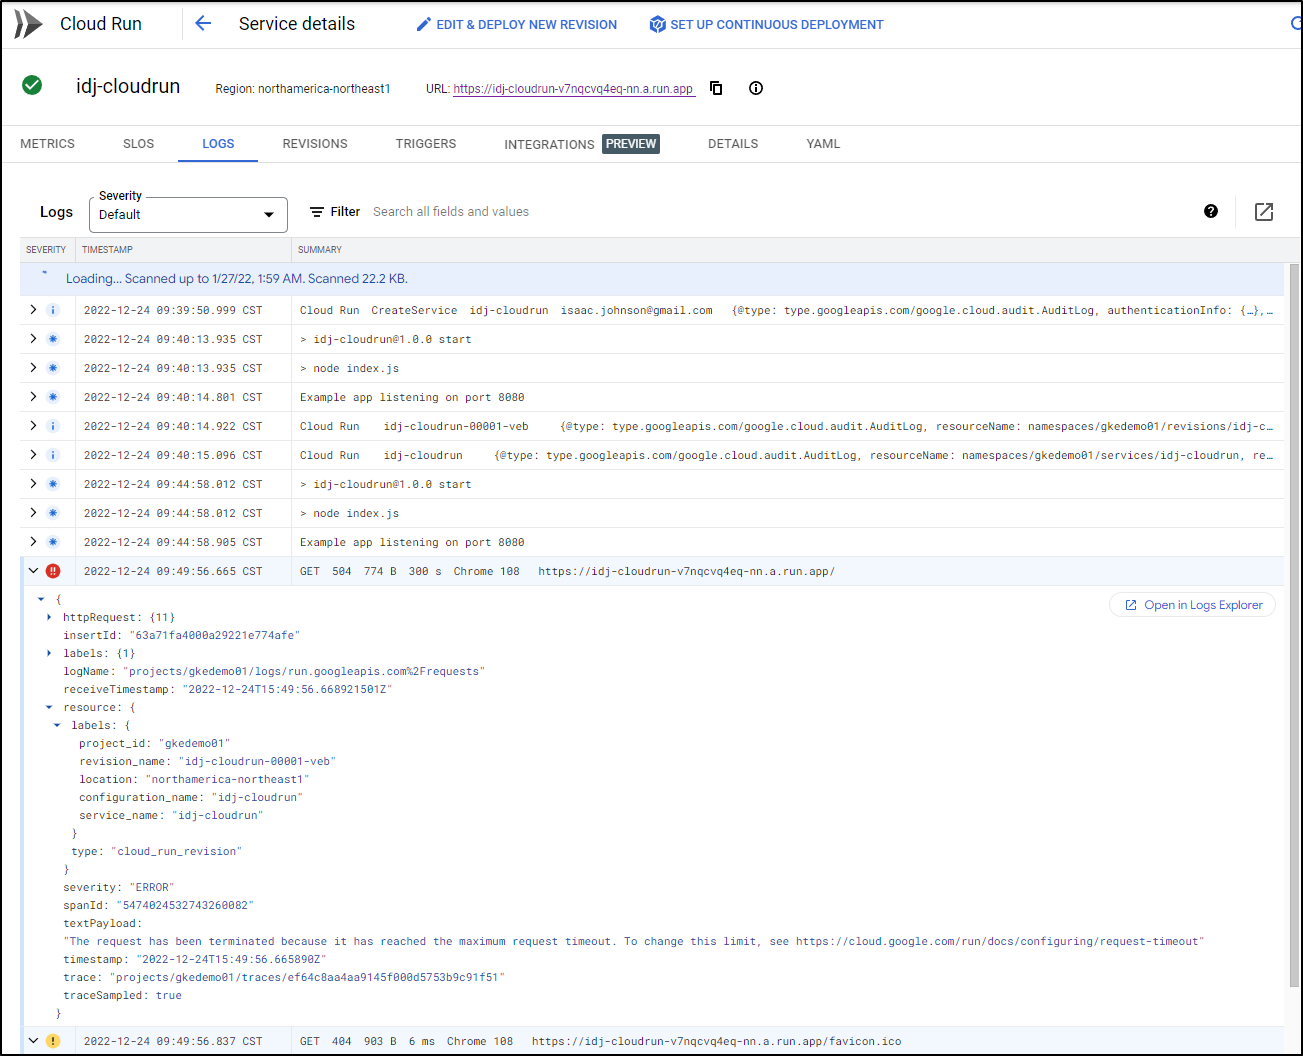
I decided to test locally
$ export DT_TENANT=kaz10218
$ export DT_CLUSTER_ID=2asasdfasd4
$ export DT_CONNECTION_BASE_URL=https://kaz10218.live.dynatrace.com
$ export DT_CONNECTION_AUTH_TOKEN=dtasdfasdf.asdfasdfasfasdssadfasf
$ npm start

> idj-cloudrun@1.0.0 start /home/builder/Workspaces/idj-cloudrun
> node index.js

Example app listening on port 8080
This too hung - clearly, I biffed my async call.
After adding in some debug and removing the redundant async, I found the timeout was a Reference Error because I neglected to add the const for startActiveHttpSpan
const { startActiveHttpSpan, endHttpSpanAndFlush } = require('@dynatrace/opentelemetry-gcf');
The working code was now
$ cat index.js
const express = require('express')
const app = express()
const port = parseInt(process.env.PORT) || 8080;

const { Resource } = require('@opentelemetry/resources');
const { NodeTracerProvider } = require('@opentelemetry/sdk-trace-node');
const { SemanticResourceAttributes } = require('@opentelemetry/semantic-conventions');
const { DtSpanExporter, DtSpanProcessor, DtTextMapPropagator, DtSampler } = require('@dynatrace/opentelemetry-core');

const provider = new NodeTracerProvider({
  resource: new Resource({
    [SemanticResourceAttributes.SERVICE_NAME]: "Freshbrewed CloudRun",
  }),
  sampler: new DtSampler()
});

const processor = new DtSpanProcessor(new DtSpanExporter());
provider.addSpanProcessor(processor);
provider.register({
  propagator: new DtTextMapPropagator()
});

const { startActiveHttpSpan, endHttpSpanAndFlush } = require('@dynatrace/opentelemetry-gcf');

const procName = process.env.NAME || 'local';

app.get('/', async (req, res) => {
        try {
                await startActiveHttpSpan(req, async (span) => {
                        let error;
                        try {
                        console.log(`Request being processed on port ${port}`)
                        } catch (e) {
                                error = e;
                                console.log(e);
                        }

                        // status should be set before span ends
                        res.status(error != null ? 500 : 200);
                        await endHttpSpanAndFlush(span, res, error);
                        res.send(`Hello World!!! - from ${procName}`)
                });
        } catch (error) {
                console.log(error)
        }
})

app.listen(port, () => {
          console.log(`Example app listening on port ${port}`)
})

// will need for tests later
module.exports = {
        app
};
I redeployed:
builder@DESKTOP-QADGF36:~/Workspaces/idj-cloudrun$ !1991
gcloud run deploy idj-cloudrun --set-env-vars=DT_TENANT=kaz10218 --set-env-vars=DT_CLUSTER_ID=2asdfasdf4 --set-env-vars='DT_CONNECTION_BASE_URL=https://kaz10218.live.dynatrace.com' --set-env-vars=DT_CONNECTION_AUTH_TOKEN=dtasdfasdfsadfsadfasdfasdfasdfasdfasdfasdfasdfasdfasfsadfasdfasdfasdf
Deploying from source. To deploy a container use [--image]. See https://cloud.google.com/run/docs/deploying-source-code for more details.
Source code location (/home/builder/Workspaces/idj-cloudrun):
Next time, use `gcloud run deploy --source .` to deploy the current directory.

Please specify a region:
 [1] asia-east1
 [2] asia-east2
 [3] asia-northeast1
 [4] asia-northeast2
 [5] asia-northeast3
 [6] asia-south1
 [7] asia-south2
 [8] asia-southeast1
 [9] asia-southeast2
 [10] australia-southeast1
 [11] australia-southeast2
 [12] europe-central2
 [13] europe-north1
 [14] europe-southwest1
 [15] europe-west1
 [16] europe-west2
 [17] europe-west3
 [18] europe-west4
 [19] europe-west6
 [20] europe-west8
 [21] europe-west9
 [22] me-west1
 [23] northamerica-northeast1
 [24] northamerica-northeast2
 [25] southamerica-east1
 [26] southamerica-west1
 [27] us-central1
 [28] us-east1
 [29] us-east4
 [30] us-east5
 [31] us-south1
 [32] us-west1
 [33] us-west2
 [34] us-west3
 [35] us-west4
 [36] cancel
Please enter numeric choice or text value (must exactly match list item):  23

To make this the default region, run `gcloud config set run/region northamerica-northeast1`.

This command is equivalent to running `gcloud builds submit --pack image=[IMAGE] /home/builder/Workspaces/idj-cloudrun` and `gcloud run deploy idj-cloudrun --image [IMAGE]`

Building using Buildpacks and deploying container to Cloud Run service [idj-cloudrun] in project [gkedemo01] region [northamerica-northeast1]
✓ Building and deploying... Done.
  ✓ Uploading sources...
  ✓ Building Container... Logs are available at [https://console.cloud.google.com/cloud-build/builds/71c3633f-5fc5-4a0f-b89a-f
  b46a3b4c965?project=658532986431].
  ✓ Creating Revision...
  ✓ Routing traffic...
Done.
Service [idj-cloudrun] revision [idj-cloudrun-00002-hic] has been deployed and is serving 100 percent of traffic.
Service URL: https://idj-cloudrun-v7nqcvq4eq-nn.a.run.app
Which came up right away
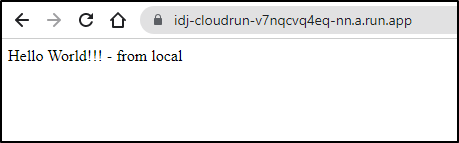
I know my code is running, both locally and via Cloud Run
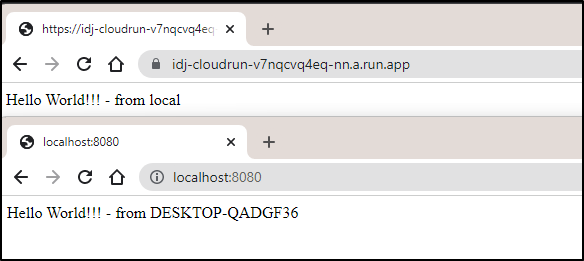
The env vars are set and the service name should show up from using
const provider = new NodeTracerProvider({
  resource: new Resource({
    [SemanticResourceAttributes.SERVICE_NAME]: "Freshbrewed CloudRun",
  }),
  sampler: new DtSampler()
});
No matter what I did, I did not see the traces show up into Dynatrace.
I even rewrote the NodeJS to the alternate model of start then activate later
const provider = new NodeTracerProvider({
  resource: new Resource({
    [SemanticResourceAttributes.SERVICE_NAME]: "Freshbrewed CloudRun",
  }),
  sampler: new DtSampler()
});

const processor = new DtSpanProcessor(new DtSpanExporter());
provider.addSpanProcessor(processor);
provider.register({
  propagator: new DtTextMapPropagator()
});

// const { startActiveHttpSpan, endHttpSpanAndFlush } = require('@dynatrace/opentelemetry-gcf');
const { context, trace, ROOT_CONTEXT } = require('@opentelemetry/api');
const { startHttpSpan, endHttpSpanAndFlush } = require('@dynatrace/opentelemetry-gcf');

const procName = process.env.NAME || 'local';

app.get('/', async (req, res) => {
	try {
		const span = await startHttpSpan(req);
		let error;

		await context.with(trace.setSpan(ROOT_CONTEXT, span), async () => {
			try {
				// do something
				console.log(`Request being processed on port ${port}`)
			} catch (e) {
				error = e;
				console.log(e);
			}
		});

		res.status(error != null ? 500 : 200);
		await endHttpSpanAndFlush(span, res, error);
  		res.send("hello world again");
	} catch (error) {
		console.log(error)
	}
})

app.listen(port, () => {
	  console.log(`Example app listening on port ${port}`)
})

// will need for tests later
module.exports = {
	app
};
Neither method seemed to get the service to show up in services
I checked back multiple times over several days, never seeing results.
AWS Lambda
Let’s try for Lambdas next.
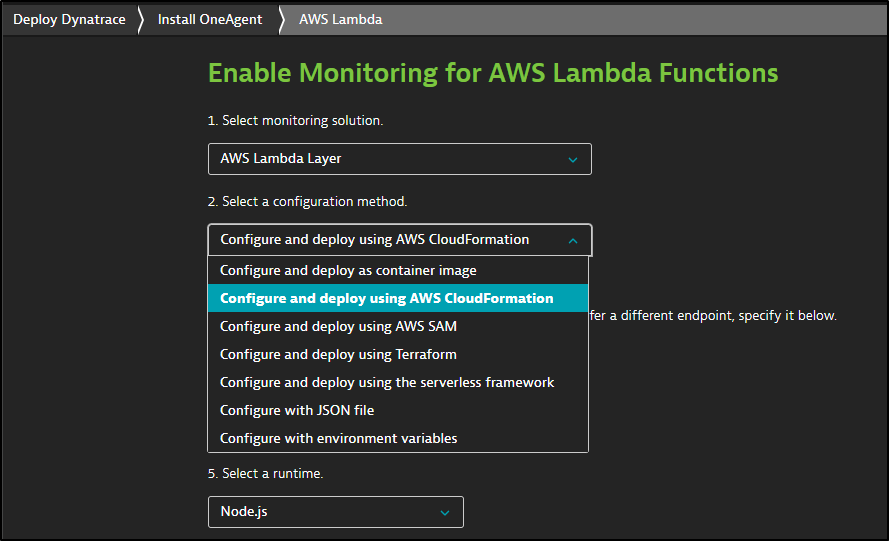
We go to “Deploy Dynatrace” and chose “AWS Lambda”
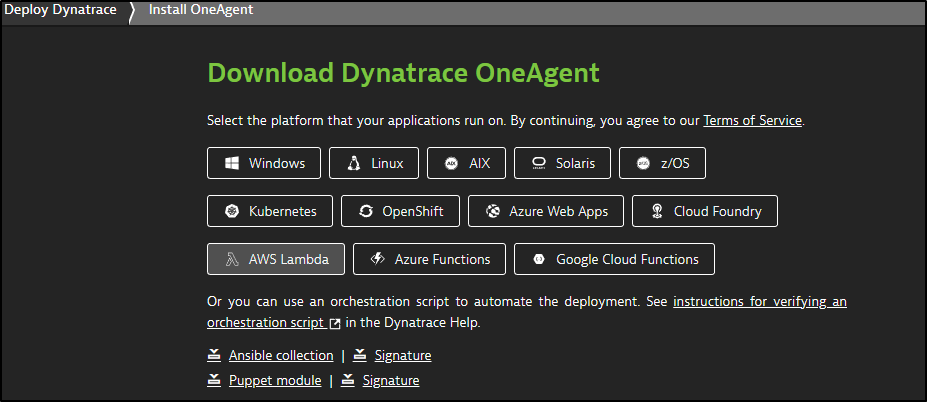
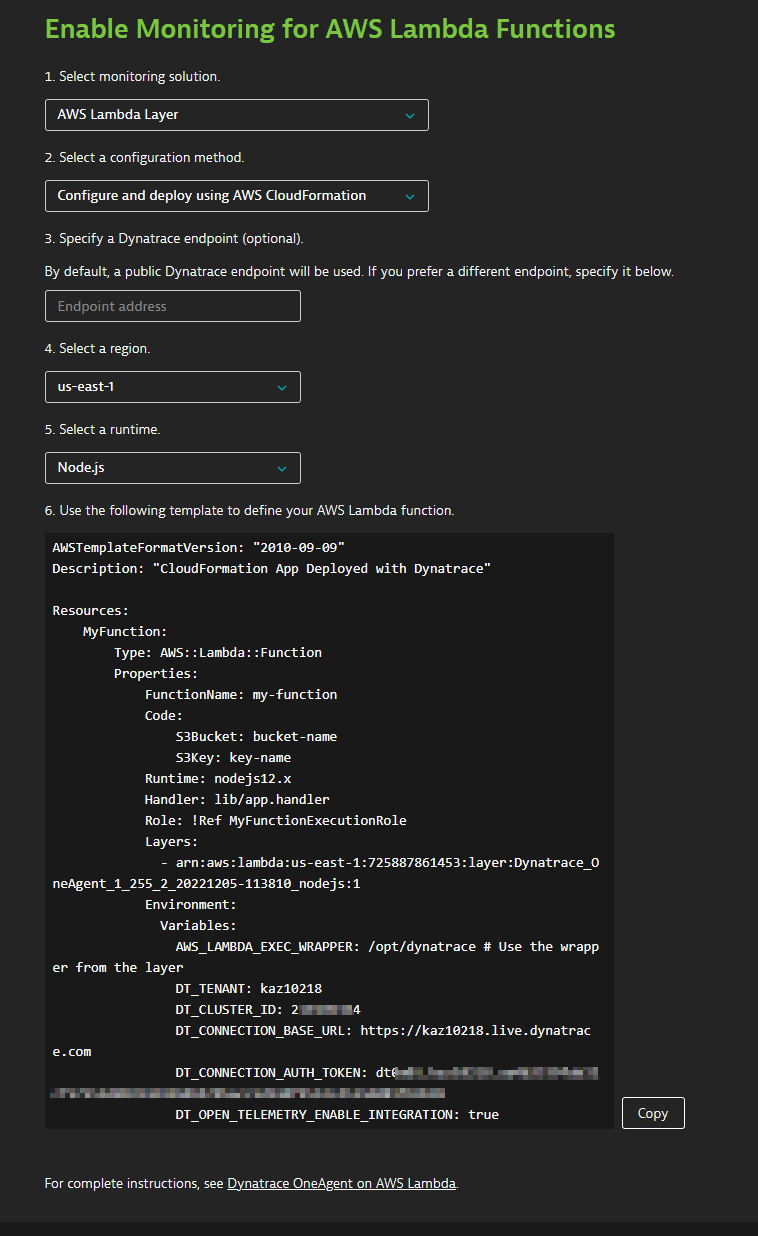
We have a few choices here. I could use CFN to set the Env vars and layer
I’ll download the CFN
The issue is really this assumes I have a baked NodeJS Function sitting in a bucket ready to deploy. This is how I generally do it when using Terraform. However, for this example, we’ll just use an inline function. I also picked a simple Lambda role I already defined as the role ref
This makes my CloudFormation code as such:
AWSTemplateFormatVersion: "2010-09-09"
Description: "CloudFormation App Deployed with Dynatrace"

Resources:
    MyFunction:
        Type: AWS::Lambda::Function
        Properties:
            FunctionName: my-dyna-function
            Code:
                ZipFile: |
                  var aws = require('aws-sdk')
                  var response = require('cfn-response')
                  exports.handler = function(event, context) {
                      console.log("REQUEST RECEIVED:\n" + JSON.stringify(event))
                      // For Delete requests, immediately send a SUCCESS response.
                      if (event.RequestType == "Delete") {
                          response.send(event, context, "SUCCESS")
                          return
                      }
                      var responseStatus = "FAILED"
                      var responseData = {}
                      var functionName = event.ResourceProperties.FunctionName
                      var lambda = new aws.Lambda()
                      lambda.invoke({ FunctionName: functionName }, function(err, invokeResult) {
                          if (err) {
                              responseData = {Error: "Invoke call failed"}
                              console.log(responseData.Error + ":\n", err)
                          }
                          else responseStatus = "SUCCESS"
                          response.send(event, context, responseStatus, responseData)
                      })
                  }
            Runtime: nodejs12.x
            Handler: lib/app.handler
            Role: arn:aws:iam::095928337644:role/idjs3funcrole
            Layers:
              - arn:aws:lambda:us-east-1:725887861453:layer:Dynatrace_OneAgent_1_255_2_20221205-113810_nodejs:1
            Environment:
              Variables:
                AWS_LAMBDA_EXEC_WRAPPER: /opt/dynatrace # Use the wrapper from the layer
                DT_TENANT: kaz10218
                DT_CLUSTER_ID: 21111114
                DT_CONNECTION_BASE_URL: https://kaz10218.live.dynatrace.com
                DT_CONNECTION_AUTH_TOKEN: dt0*************************************************************************
                DT_OPEN_TELEMETRY_ENABLE_INTEGRATION: true
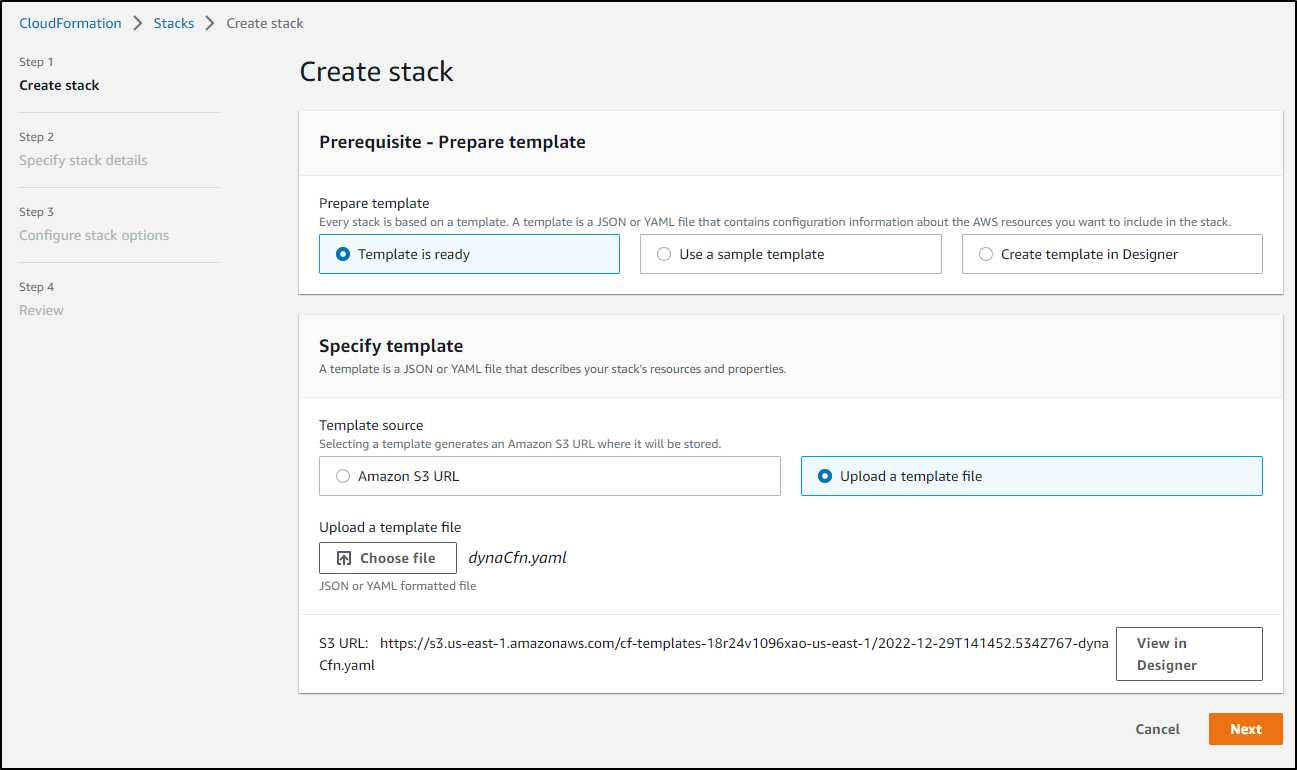
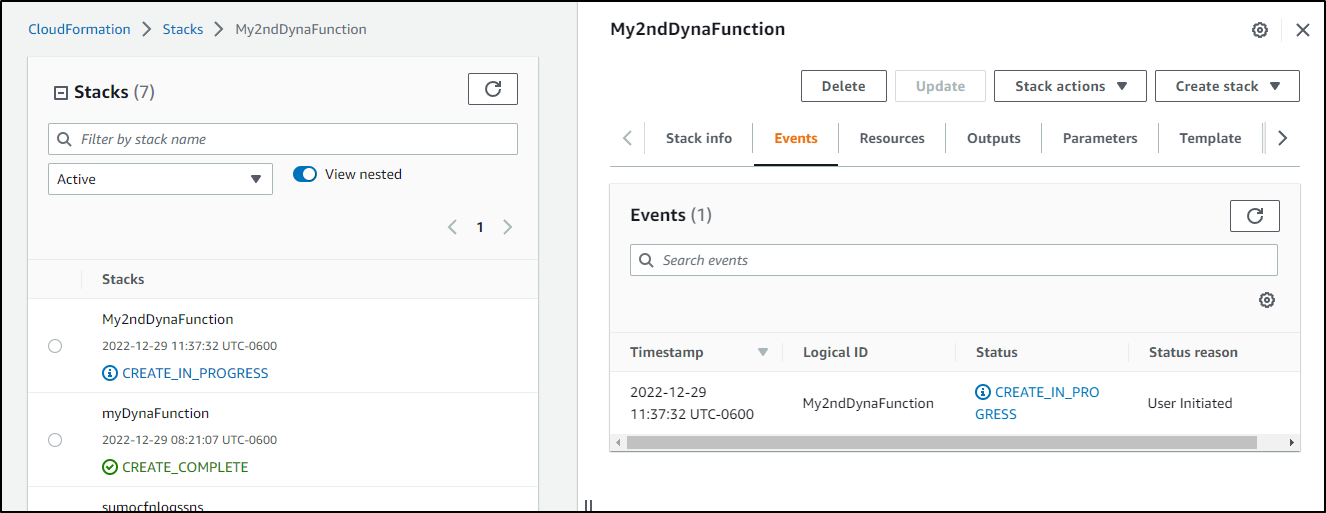
In AWS Console, in the CloudFormation area I’ll pick the file
Then give my stack a name
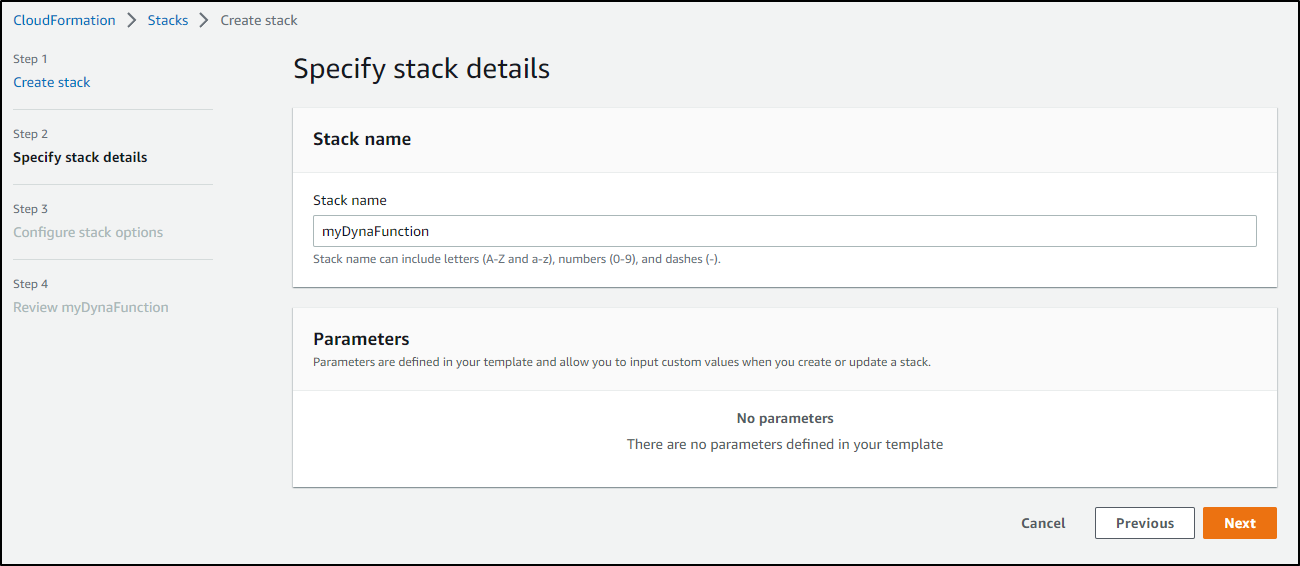
I’ll then use defaults in the next screens and submit
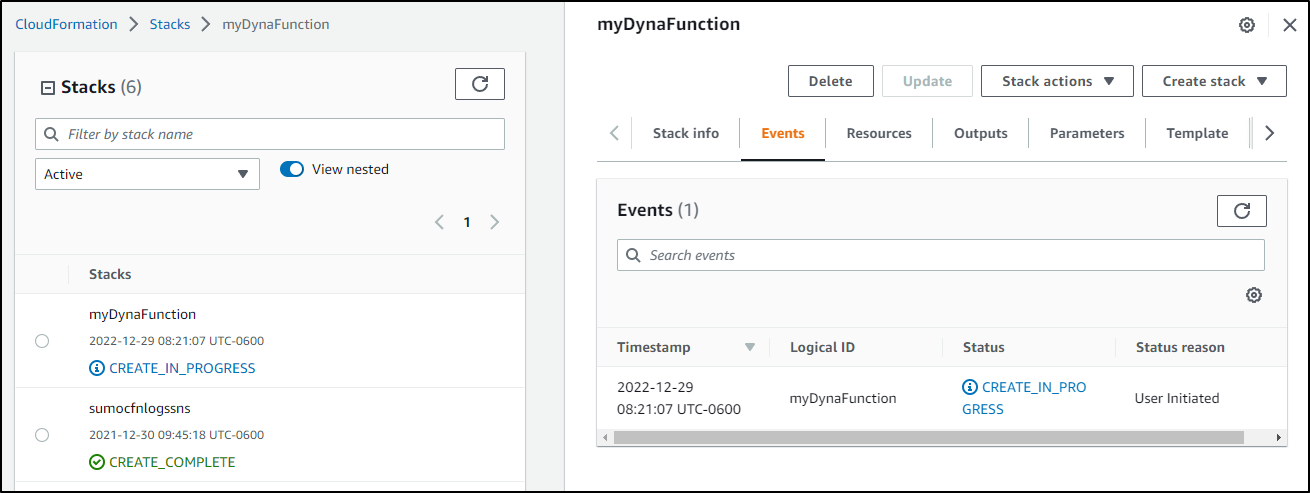
I can now see it in AWS
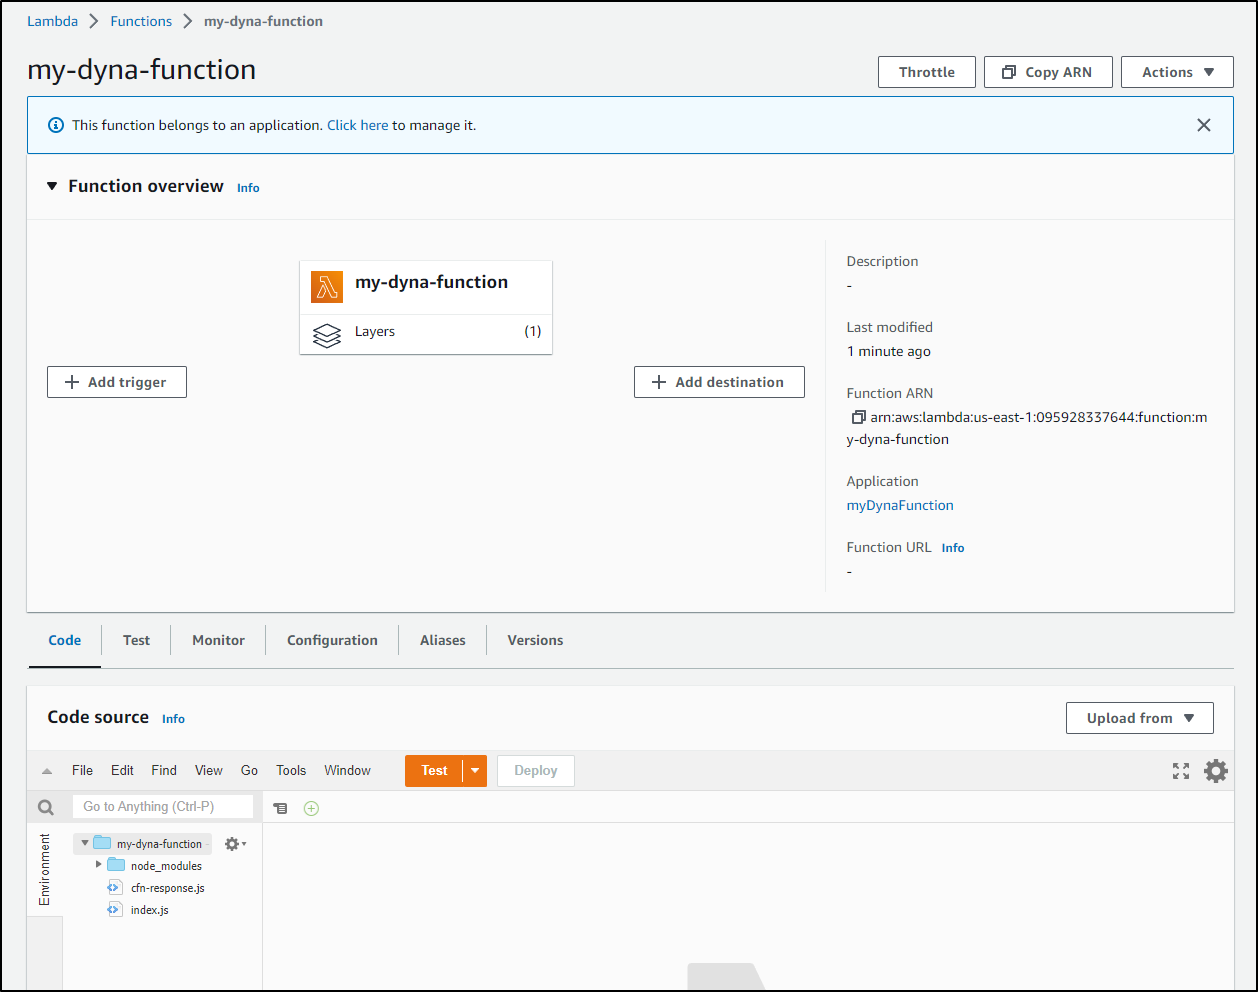
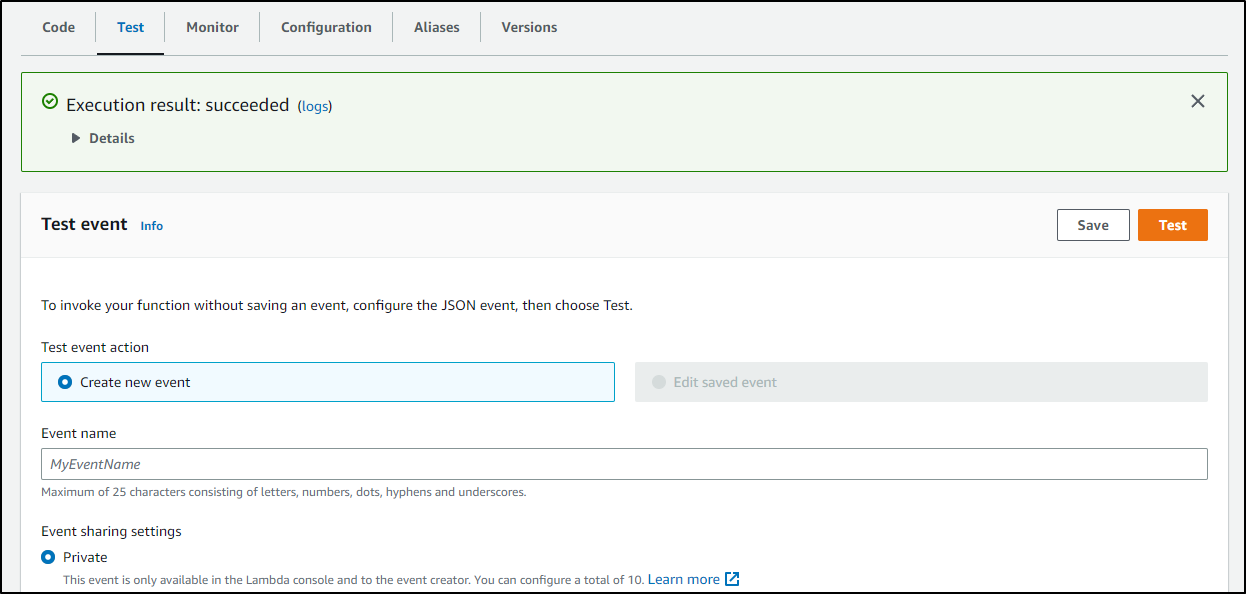
I can use “Test” to fire a test event
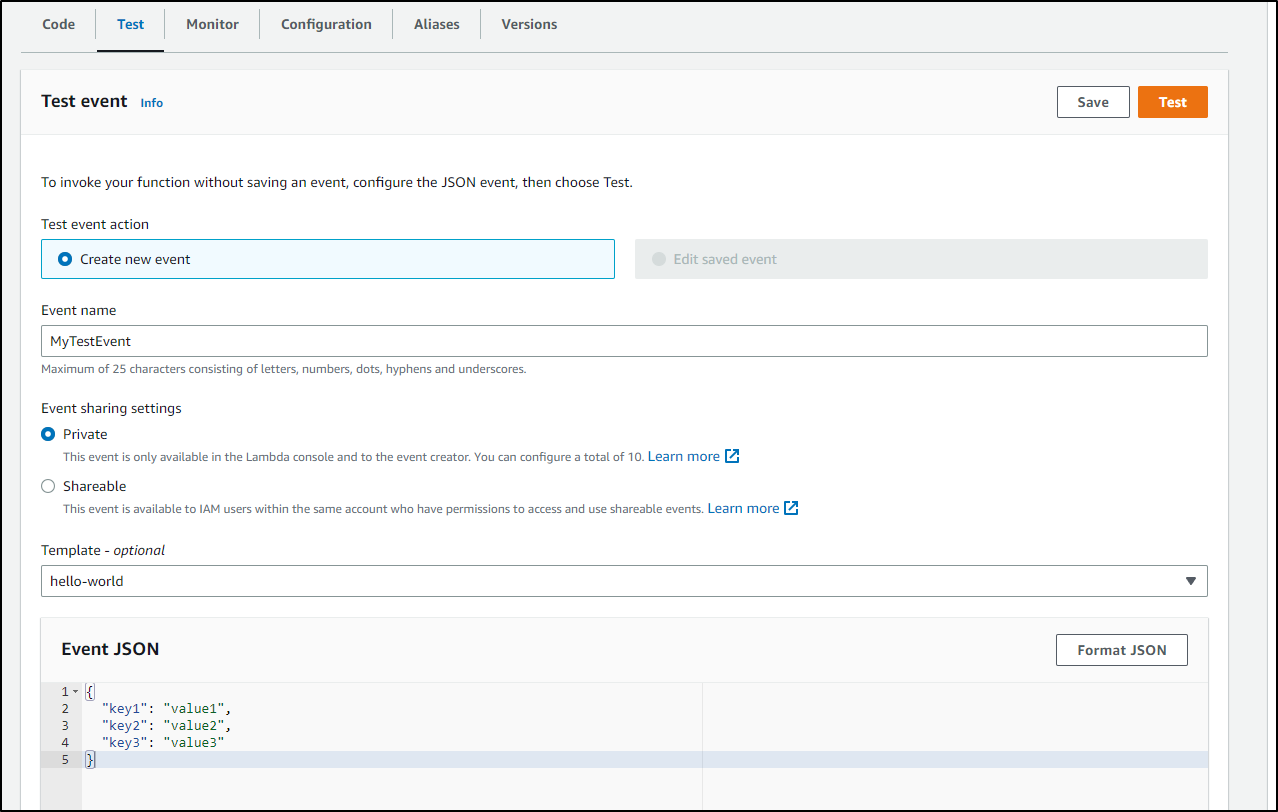
I see a fail with default values
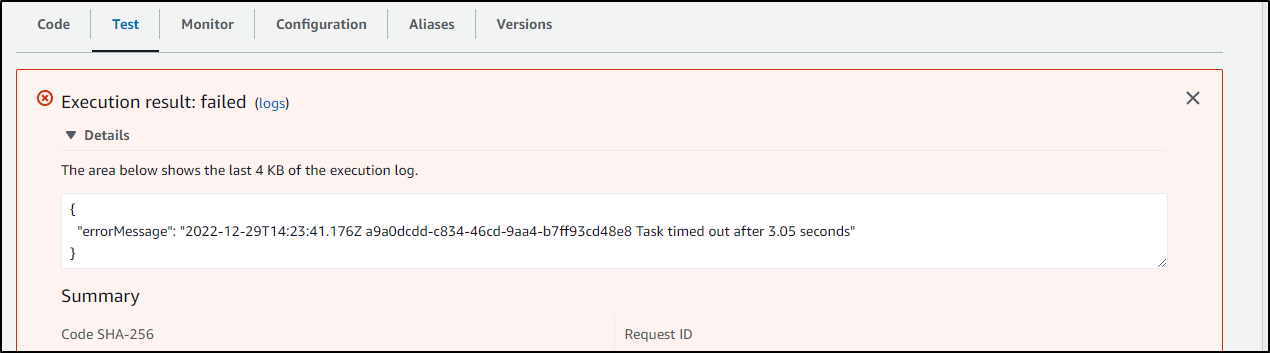
I decided after some testing to pivot and create the IAM role inline and change to a simpler NodeJS routine. To create as basic a NodeJS Lambda as I could
Resources:
  LambdaFunction:
    Type: 'AWS::Lambda::Function'
    Properties:
      FunctionName: myseconddynafunction
      Handler: index.handler
      Runtime: nodejs14.x
      Role: !GetAtt LambdaFunctionRole.Arn
      Layers:
        - arn:aws:lambda:us-east-1:725887861453:layer:Dynatrace_OneAgent_1_255_2_20221205-113810_nodejs:1
      MemorySize: 1024
      Environment:
        Variables:
          AWS_LAMBDA_EXEC_WRAPPER: /opt/dynatrace # Use the wrapper from the layer
          DT_TENANT: kaz10218
          DT_CLUSTER_ID: 2111114
          DT_CONNECTION_BASE_URL: https://kaz10218.live.dynatrace.com
          DT_CONNECTION_AUTH_TOKEN: dt0************************************************
          DT_OPEN_TELEMETRY_ENABLE_INTEGRATION: true
      Code:
        ZipFile: |
          exports.handler = async (event) => {
            return "Hello World!";
          }
  LambdaFunctionRole:
    Type: AWS::IAM::Role
    Properties:
      AssumeRolePolicyDocument:
        Version: '2012-10-17'
        Statement:
        - Effect: Allow
          Principal:
            Service:
            - lambda.amazonaws.com
          Action:
          - sts:AssumeRole
      Path: "/"
      Policies:
      - PolicyName: AppendToLogsPolicy
        PolicyDocument:
          Version: '2012-10-17'
          Statement:
          - Effect: Allow
            Action:
            - logs:CreateLogGroup
            - logs:CreateLogStream
            - logs:PutLogEvents
            Resource: "*"
which I deployed
and tested without issue
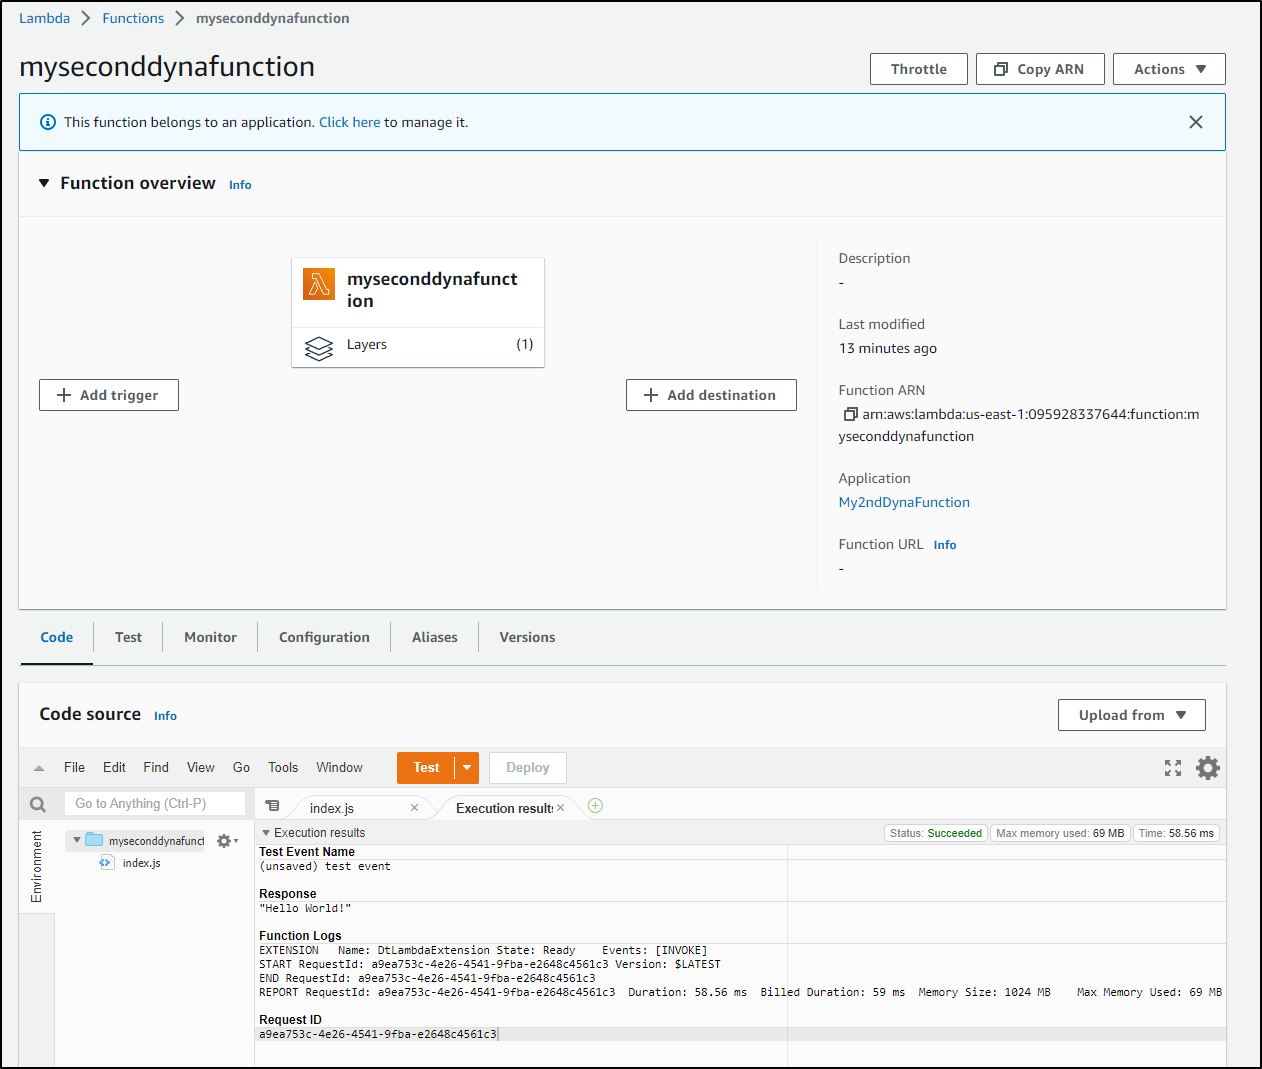
I ran it a few times
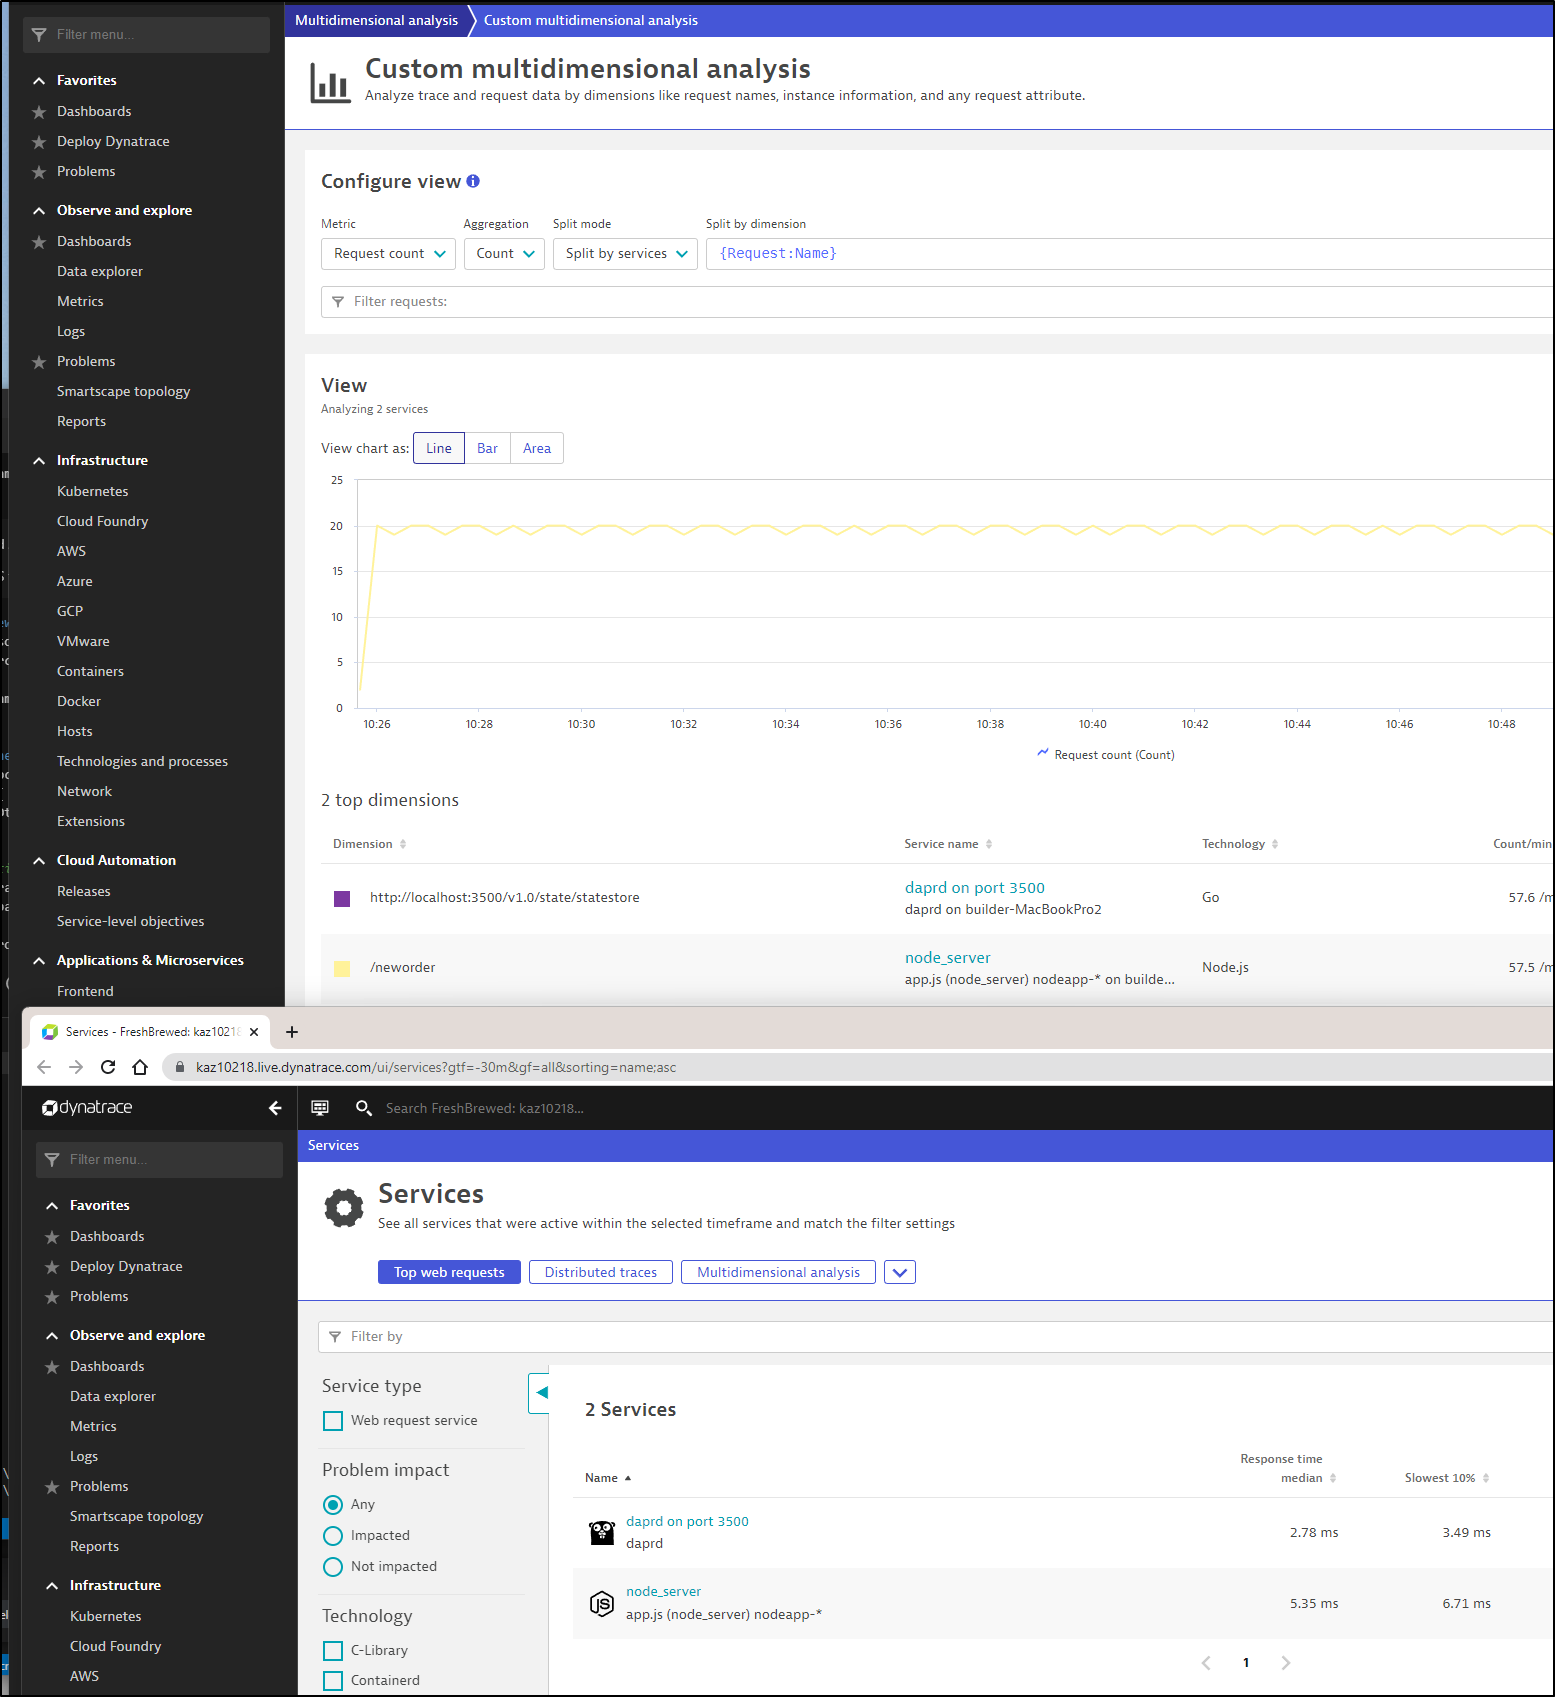
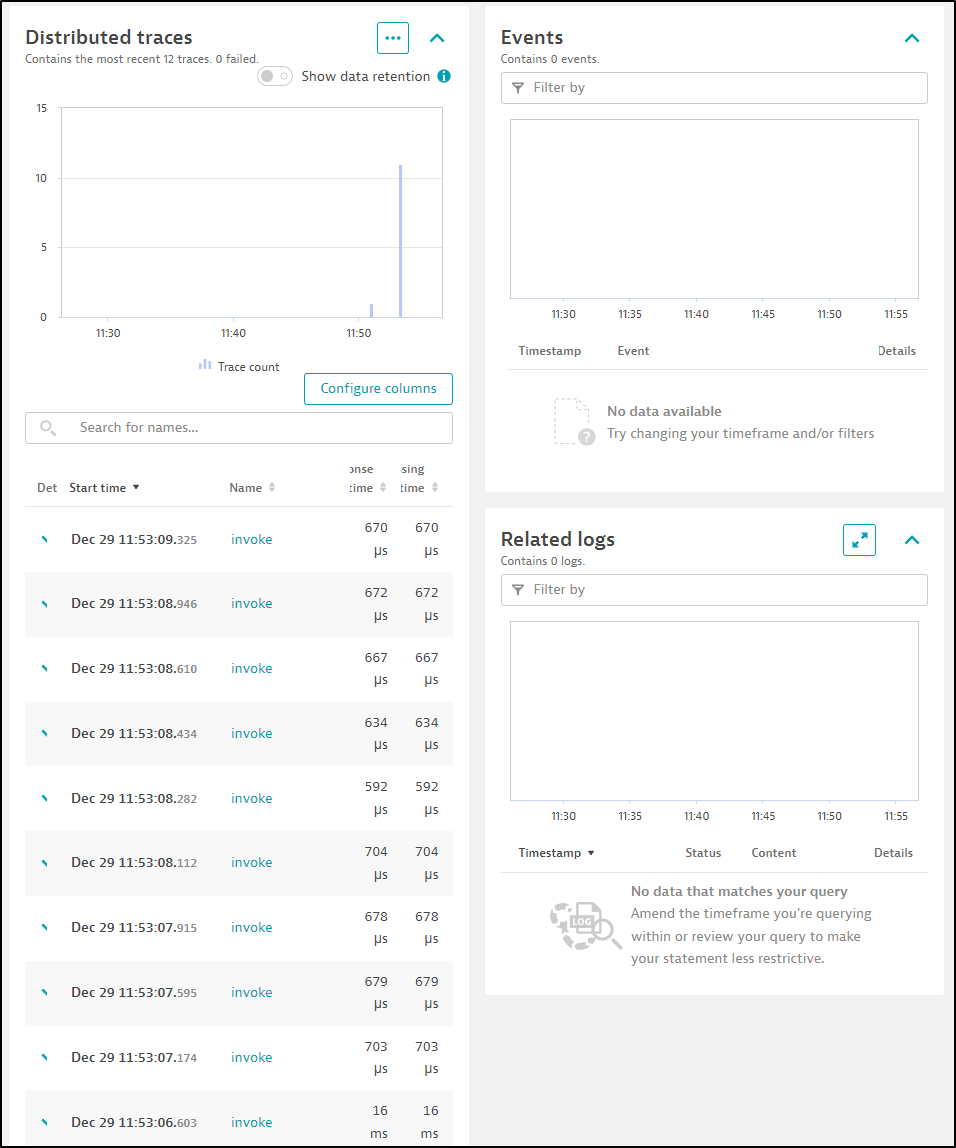
I can now see results in Dynatrace Services
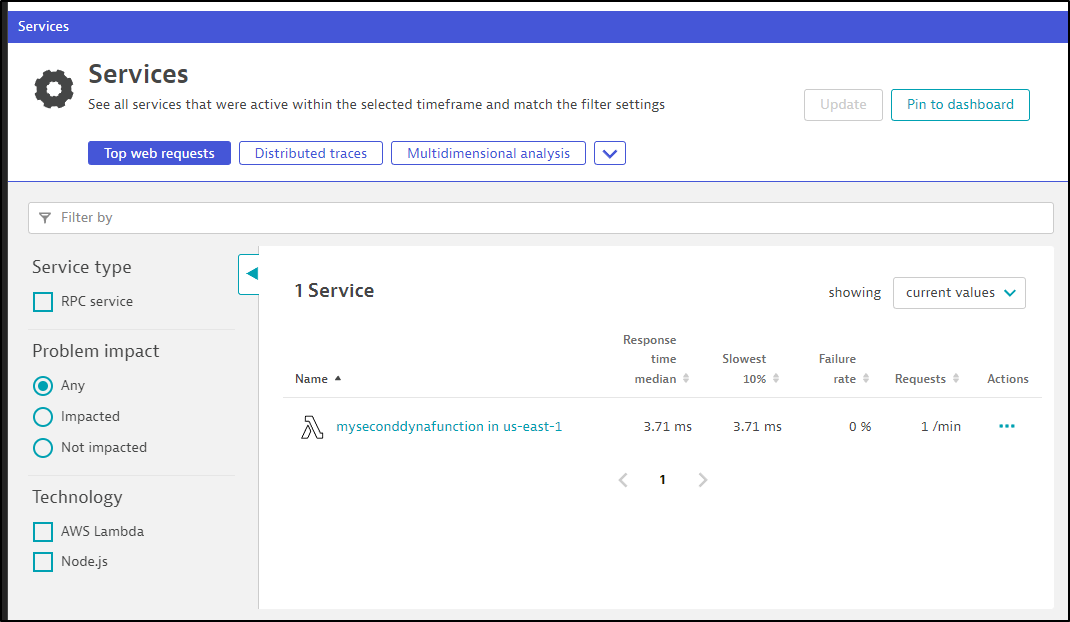
With such as small function, there isn’t much to see by way of traces
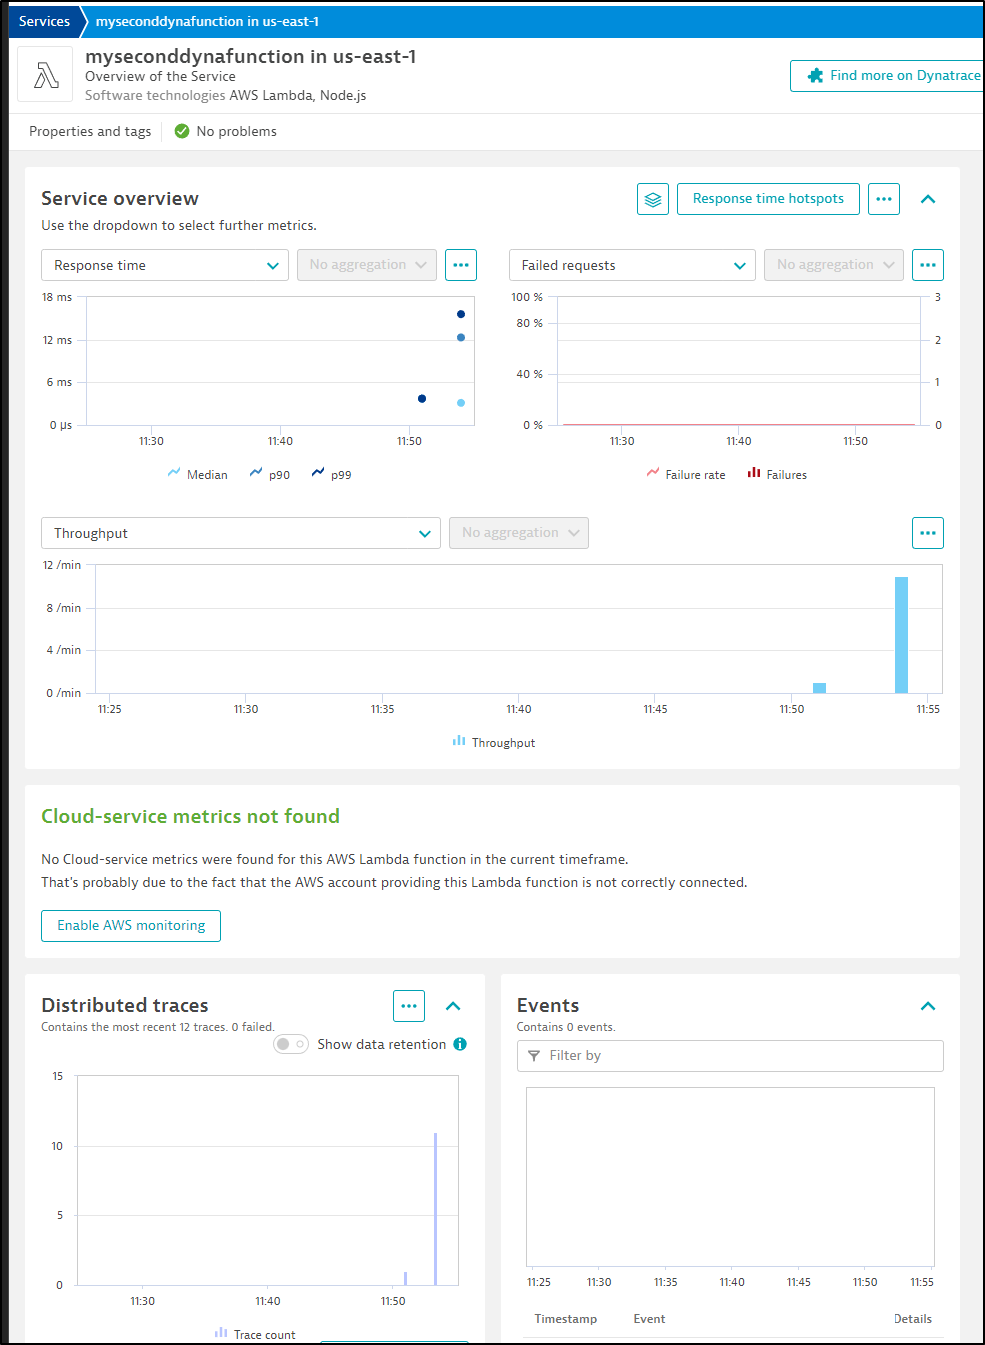
We can see the response and processing time
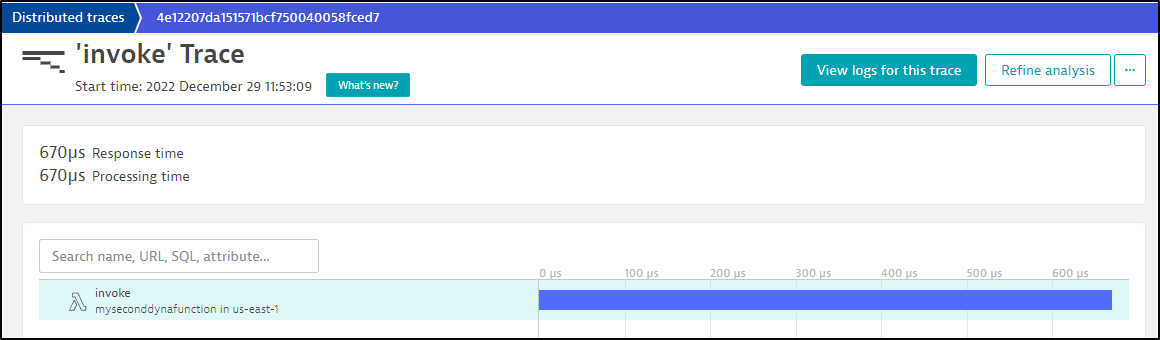
and the same for a specific trace
Agentless
Another way to get some form of monitoring in is to embed some JavaScript to a frontend site.
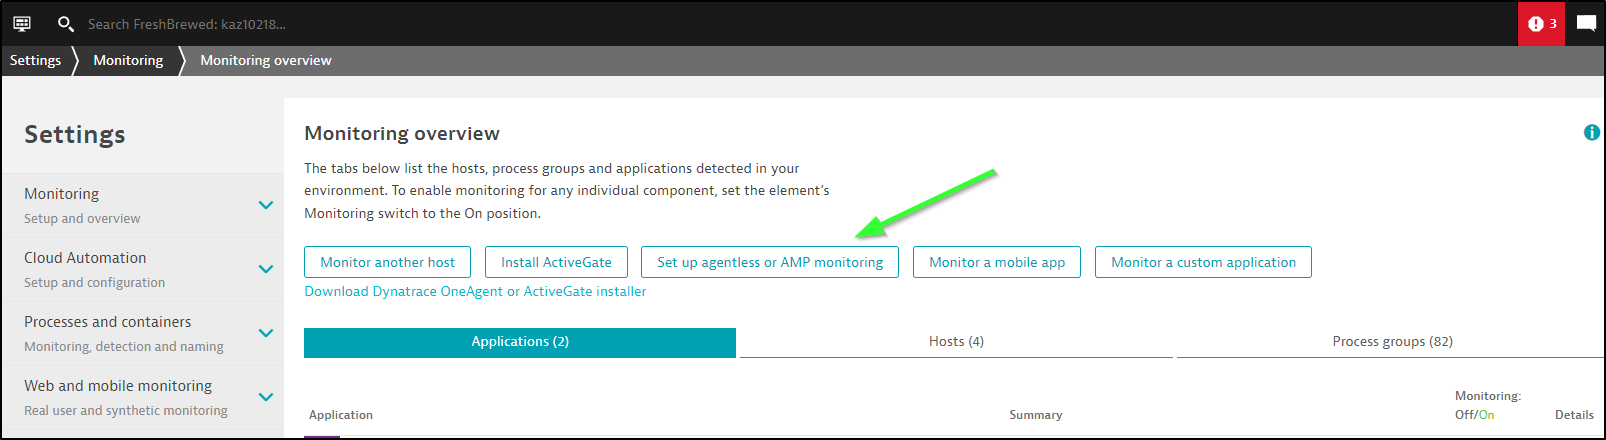
We can go to “Applications and Services/Frontend” then click “Set up agentless of AMP monitoring”
We can give it a name, like “Cloud Run”
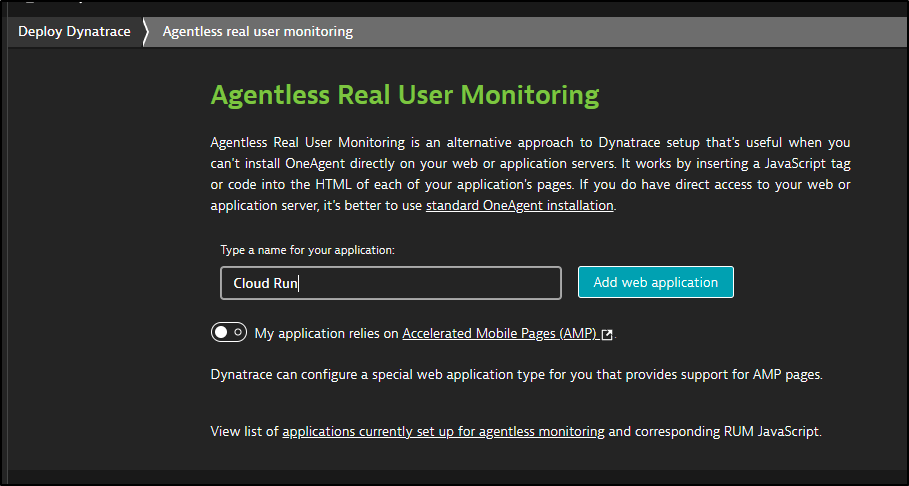
which will give you some obscuficated javascript to embed
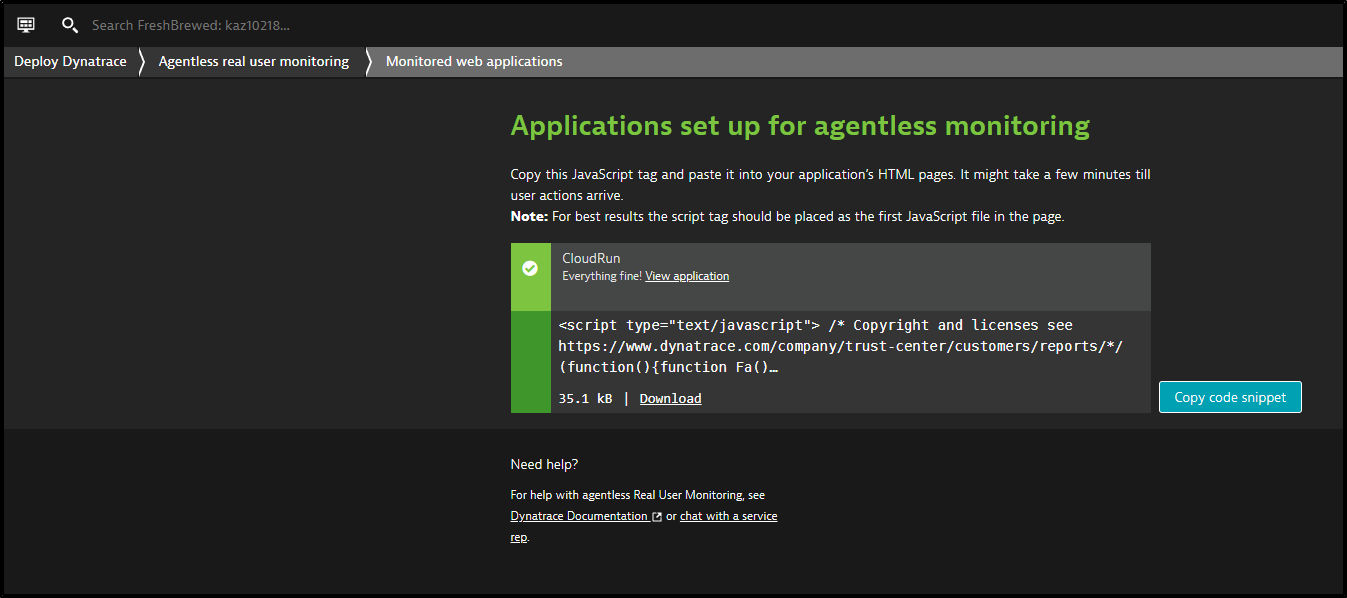
In my case, I put it in a new file (dynascript.js) and pulled it into the Cloud Run function
const express = require('express')
const app = express()
const port = parseInt(process.env.PORT) || 8080;

const { Resource } = require('@opentelemetry/resources');
const { NodeTracerProvider } = require('@opentelemetry/sdk-trace-node');
const { SemanticResourceAttributes } = require('@opentelemetry/semantic-conventions');
const { DtSpanExporter, DtSpanProcessor, DtTextMapPropagator, DtSampler } = require('@dynatrace/opentelemetry-core');

const provider = new NodeTracerProvider({
  resource: new Resource({
    [SemanticResourceAttributes.SERVICE_NAME]: "Freshbrewed CloudRun",
  }),
  sampler: new DtSampler()
});

const processor = new DtSpanProcessor(new DtSpanExporter());
provider.addSpanProcessor(processor);
provider.register({
  propagator: new DtTextMapPropagator()
});

// const { startActiveHttpSpan, endHttpSpanAndFlush } = require('@dynatrace/opentelemetry-gcf');
const { context, trace, ROOT_CONTEXT } = require('@opentelemetry/api');
const { startHttpSpan, endHttpSpanAndFlush } = require('@dynatrace/opentelemetry-gcf');

const procName = process.env.NAME || 'local';
const fs = require('fs');

app.get('/', async (req, res) => {
	try {
		const span = await startHttpSpan(req);
		let error;

		await context.with(trace.setSpan(ROOT_CONTEXT, span), async () => {
			try {
				// do something
				console.log(`Request being processed on port ${port}`)
			} catch (e) {
				error = e;
				console.log(e);
			}
		});

		res.status(error != null ? 500 : 200);
		await endHttpSpanAndFlush(span, res, error);
		fs.readFile('dynascript.js', 'utf8', (err, data) => {
			if (err) {
			  console.error(err);
			  res.send("hello world again");
			  return;
			}
			console.log(data);
			res.send('<HTML><BODY>' + data + '</BODY></HTML>');
		  });


	} catch (error) {
		console.log(error)
	}
})

app.listen(port, () => {
	  console.log(`Example app listening on port ${port}`)
})

// will need for tests later
module.exports = {
	app
};
(note: it works with or without the HTML and BODY tags)
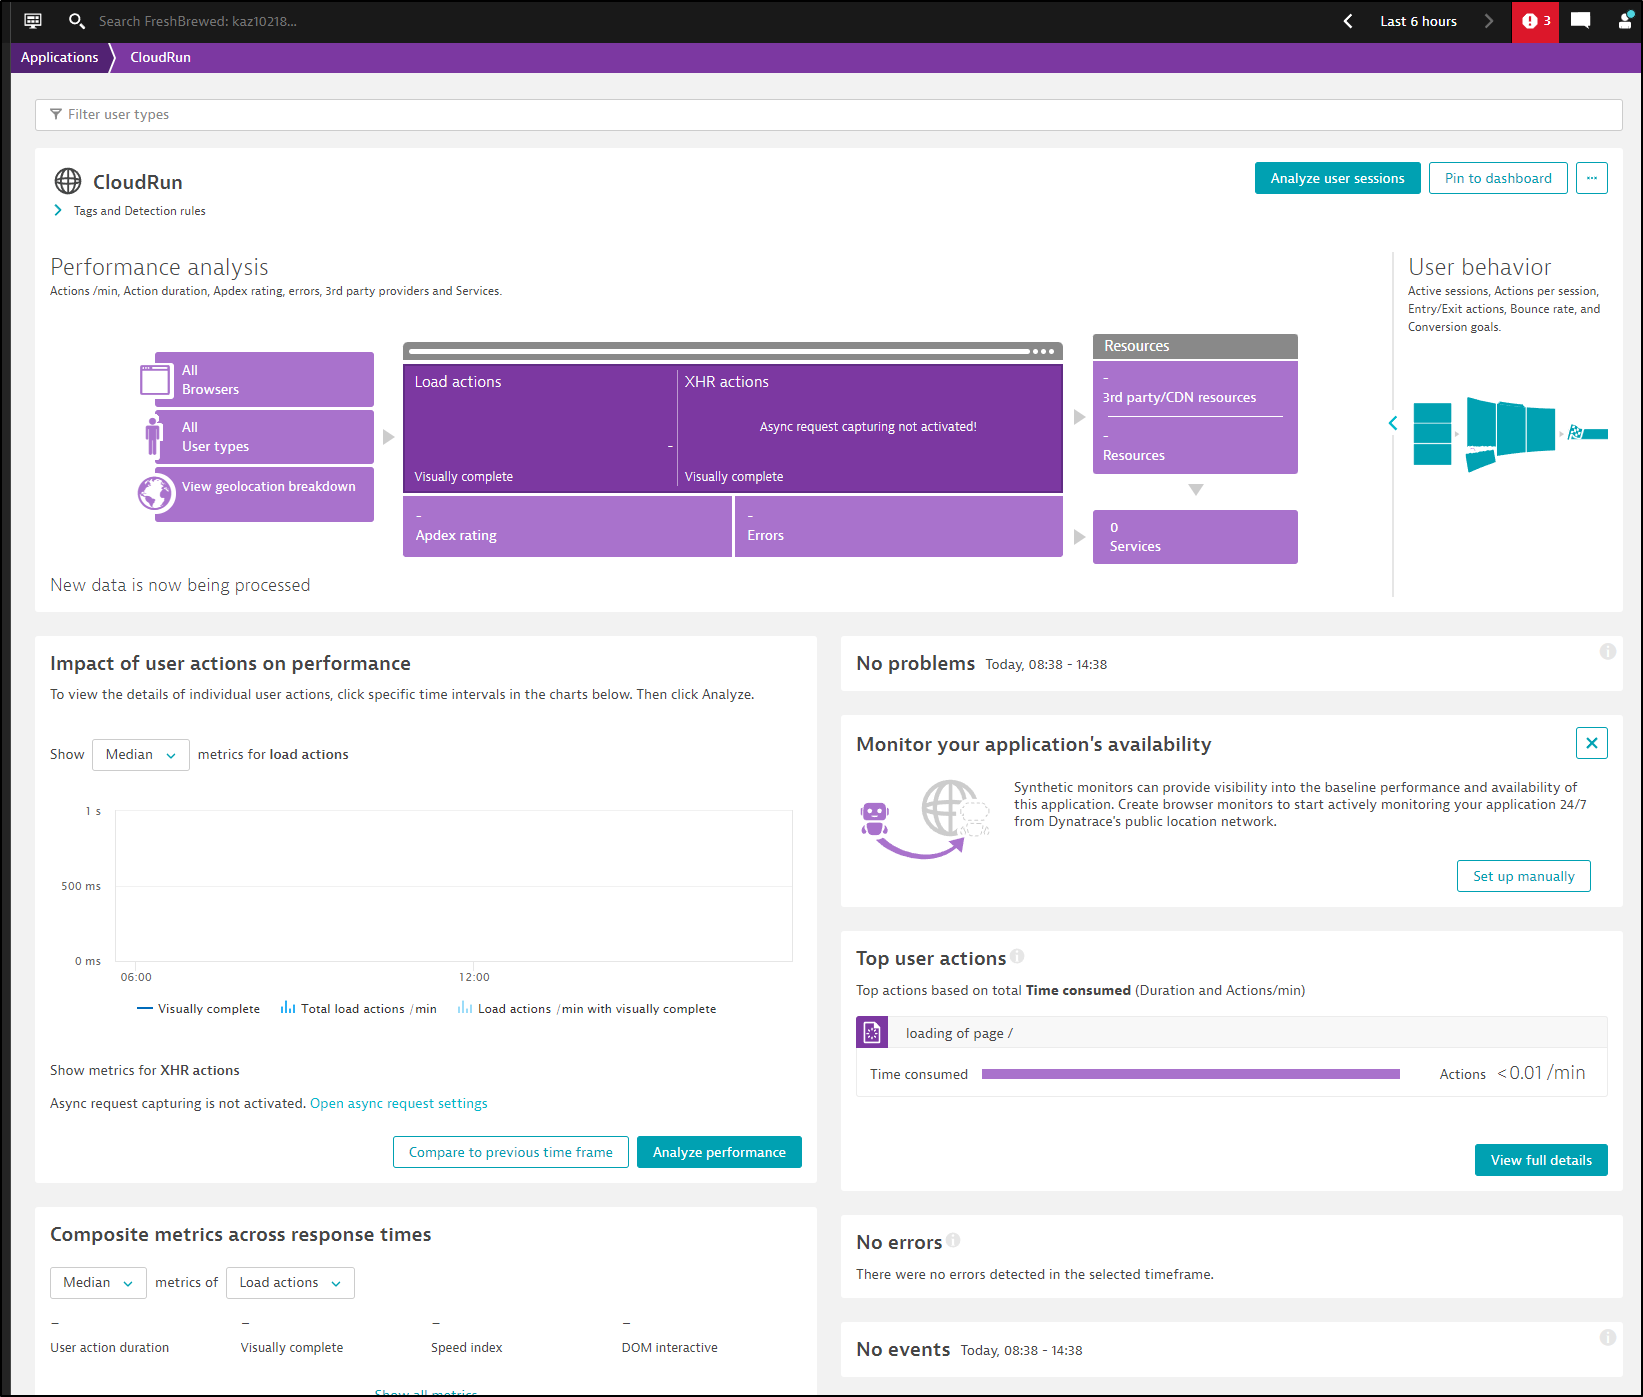
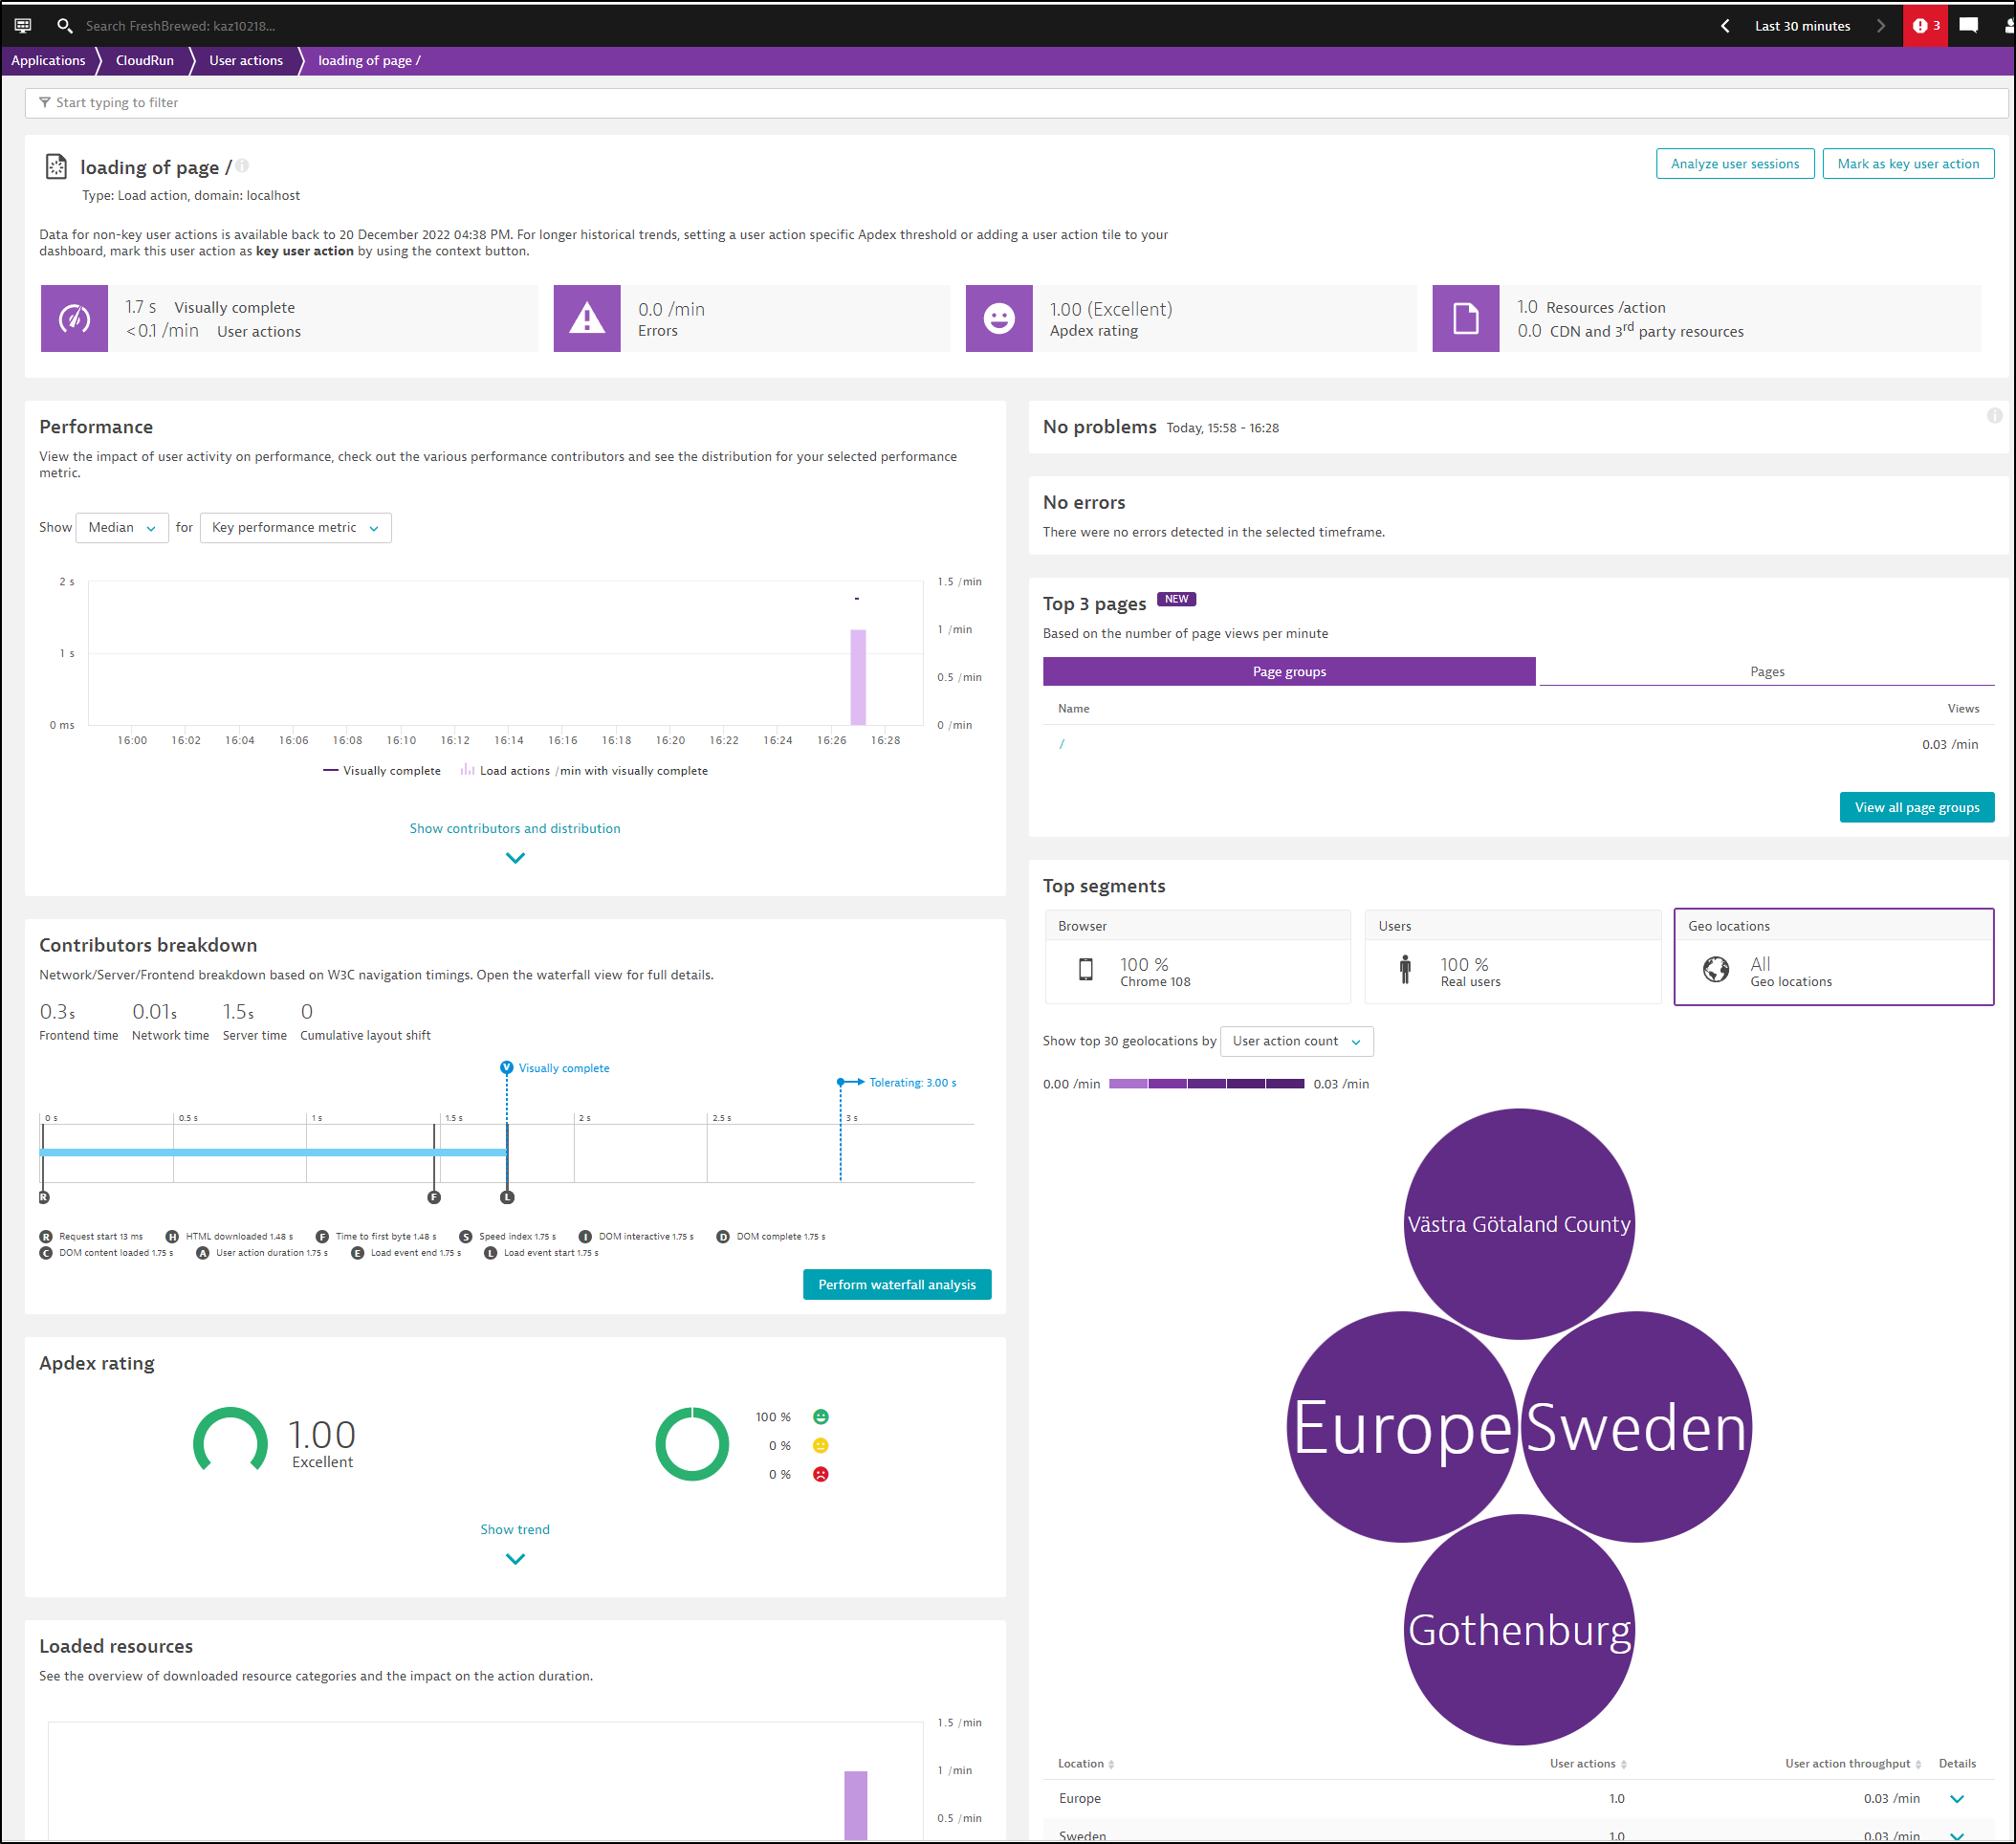
We can now see results of runs
If I route through a VPN, we can see it detects my region accordingly
Synthetic Monitors
We can see and create new Synthetic monitors from “Applications and Services/Synthetic”
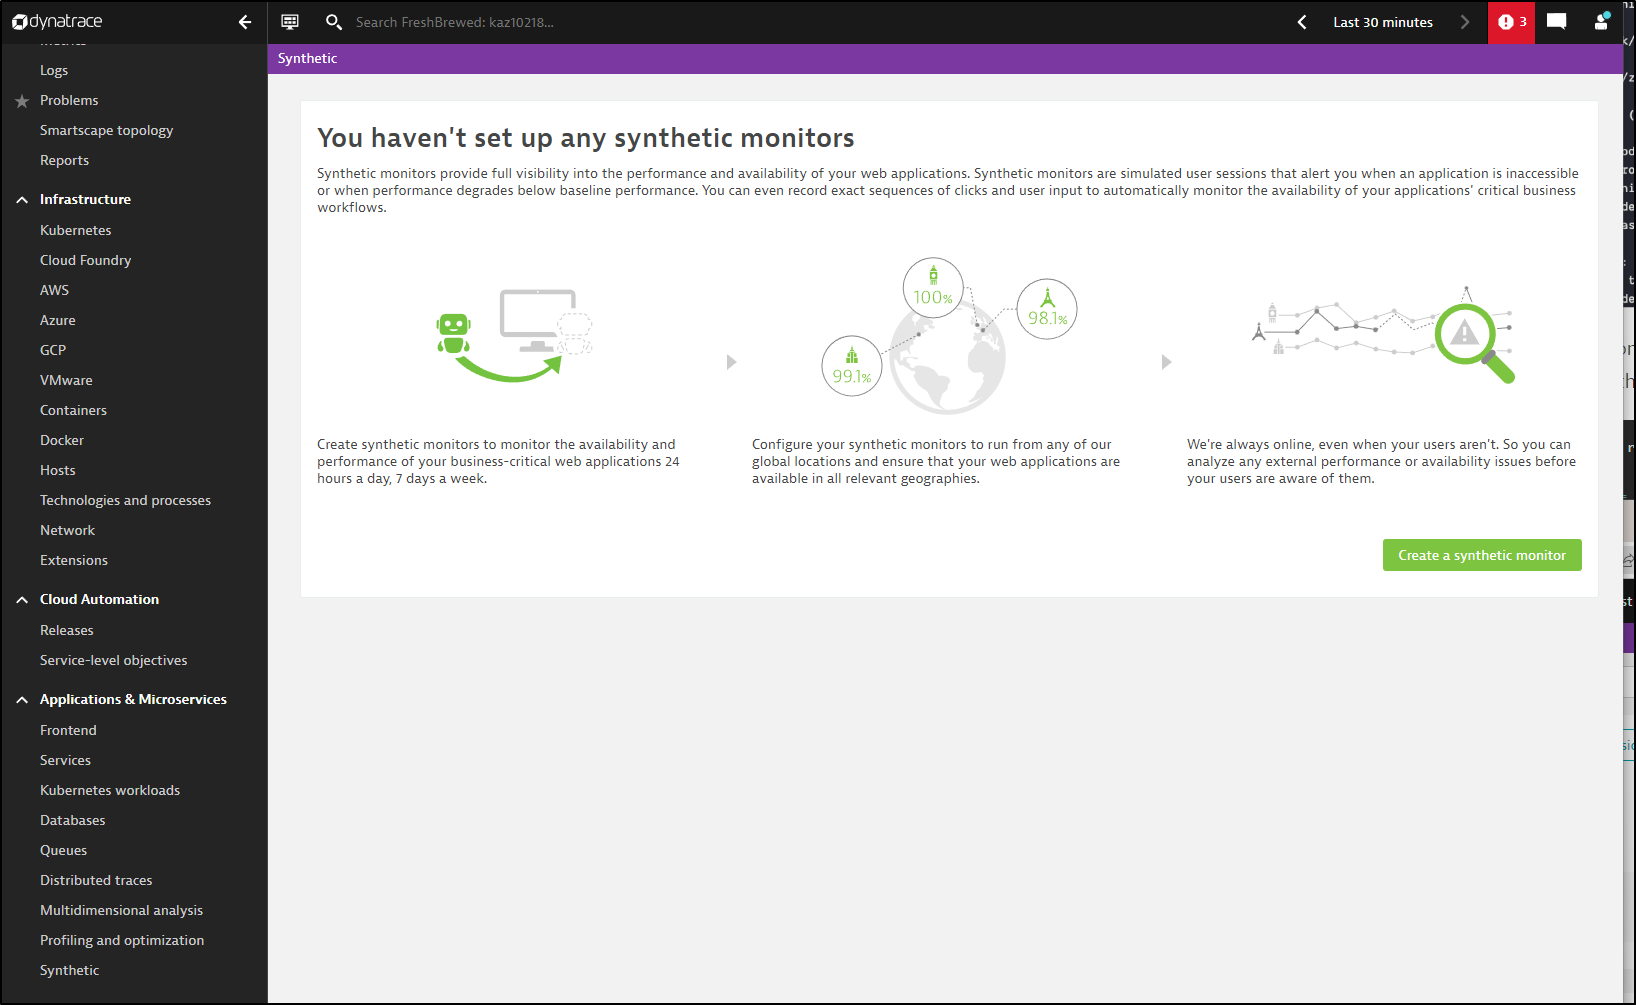
For instance, say I wanted to just see if https://harbor.freshbrewed.science was up. I might use a basic HTTP monitor
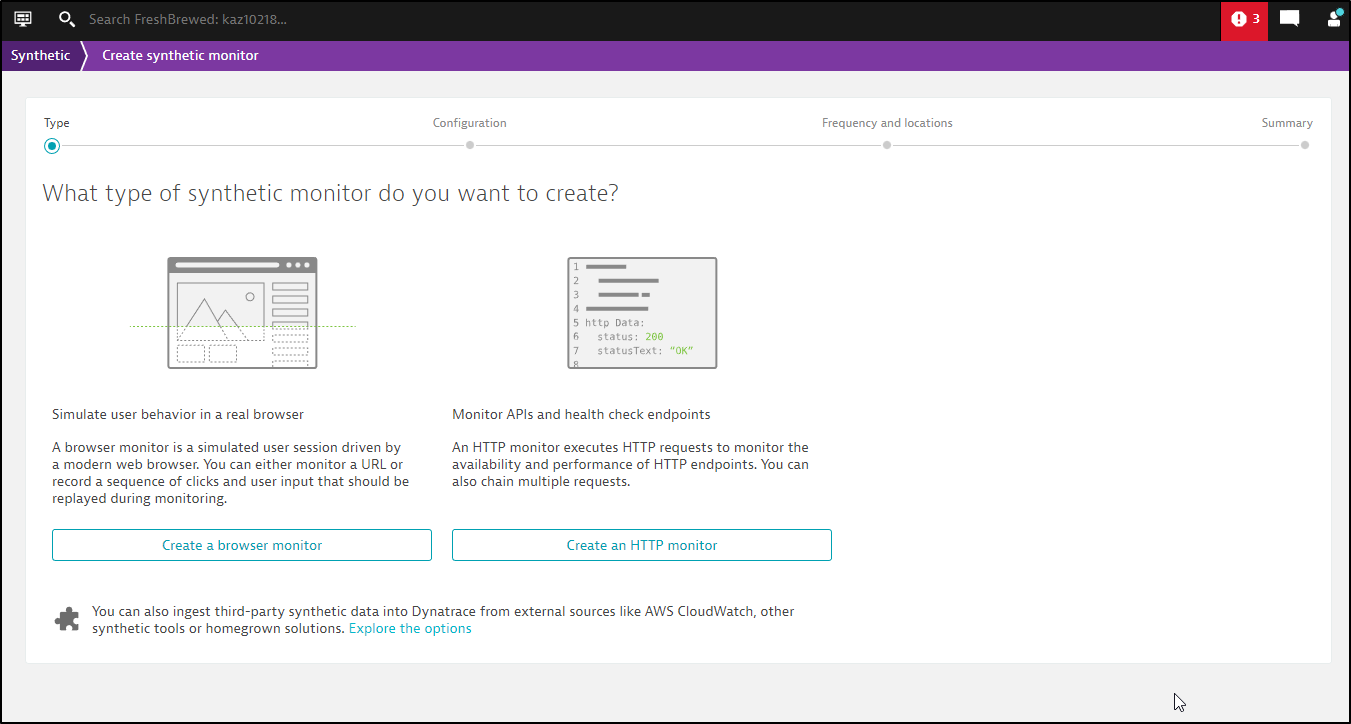
Next, I’ll give it a name and an endpoint.
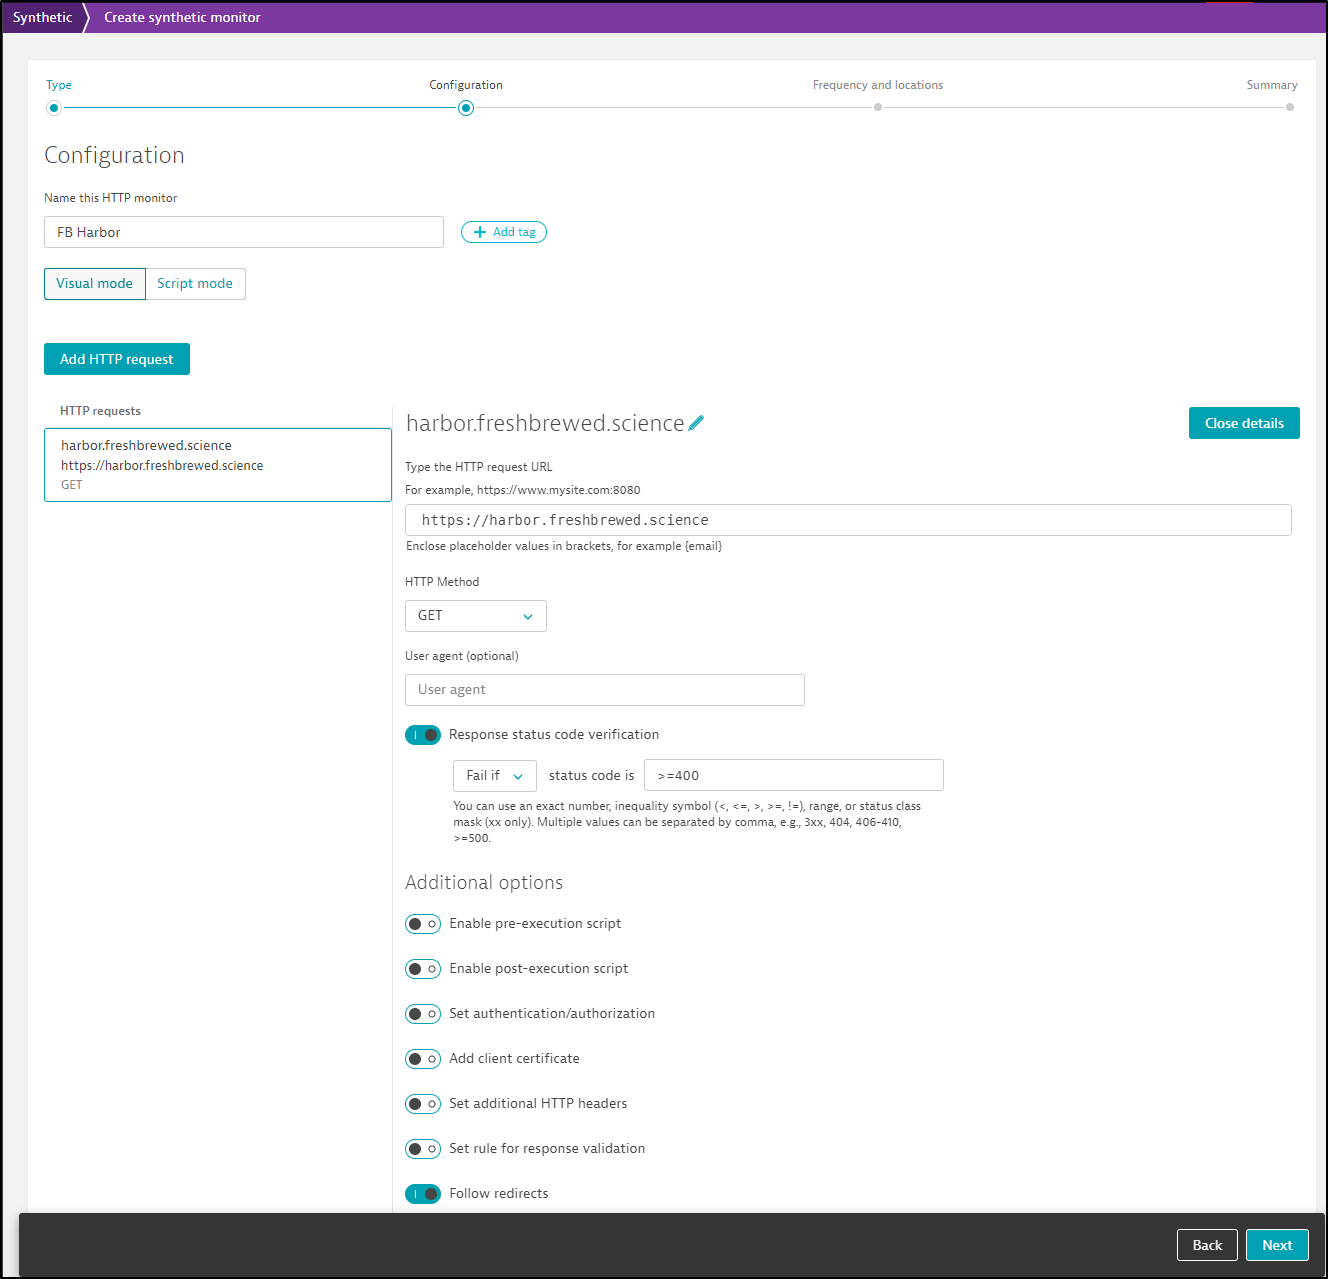
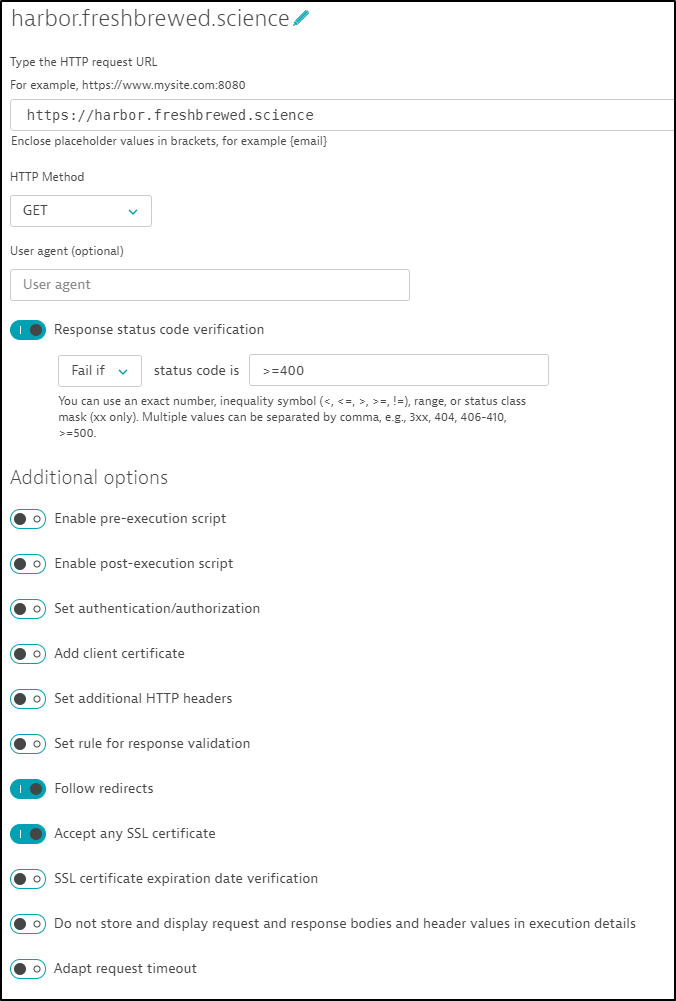
I could set the method (e.g. GET vs POST), the user agent and additional HTTP Headers or Authentication.
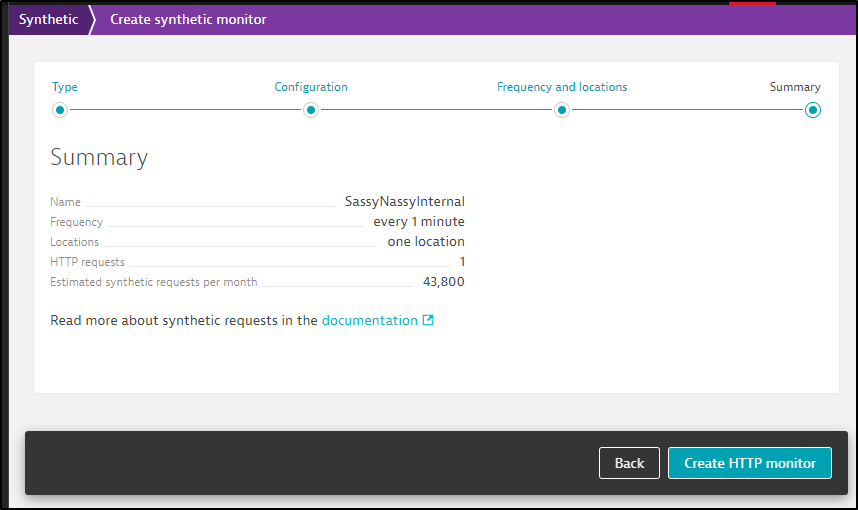
Next, I can set my frequency and location. For now, we’ll just focus on public types
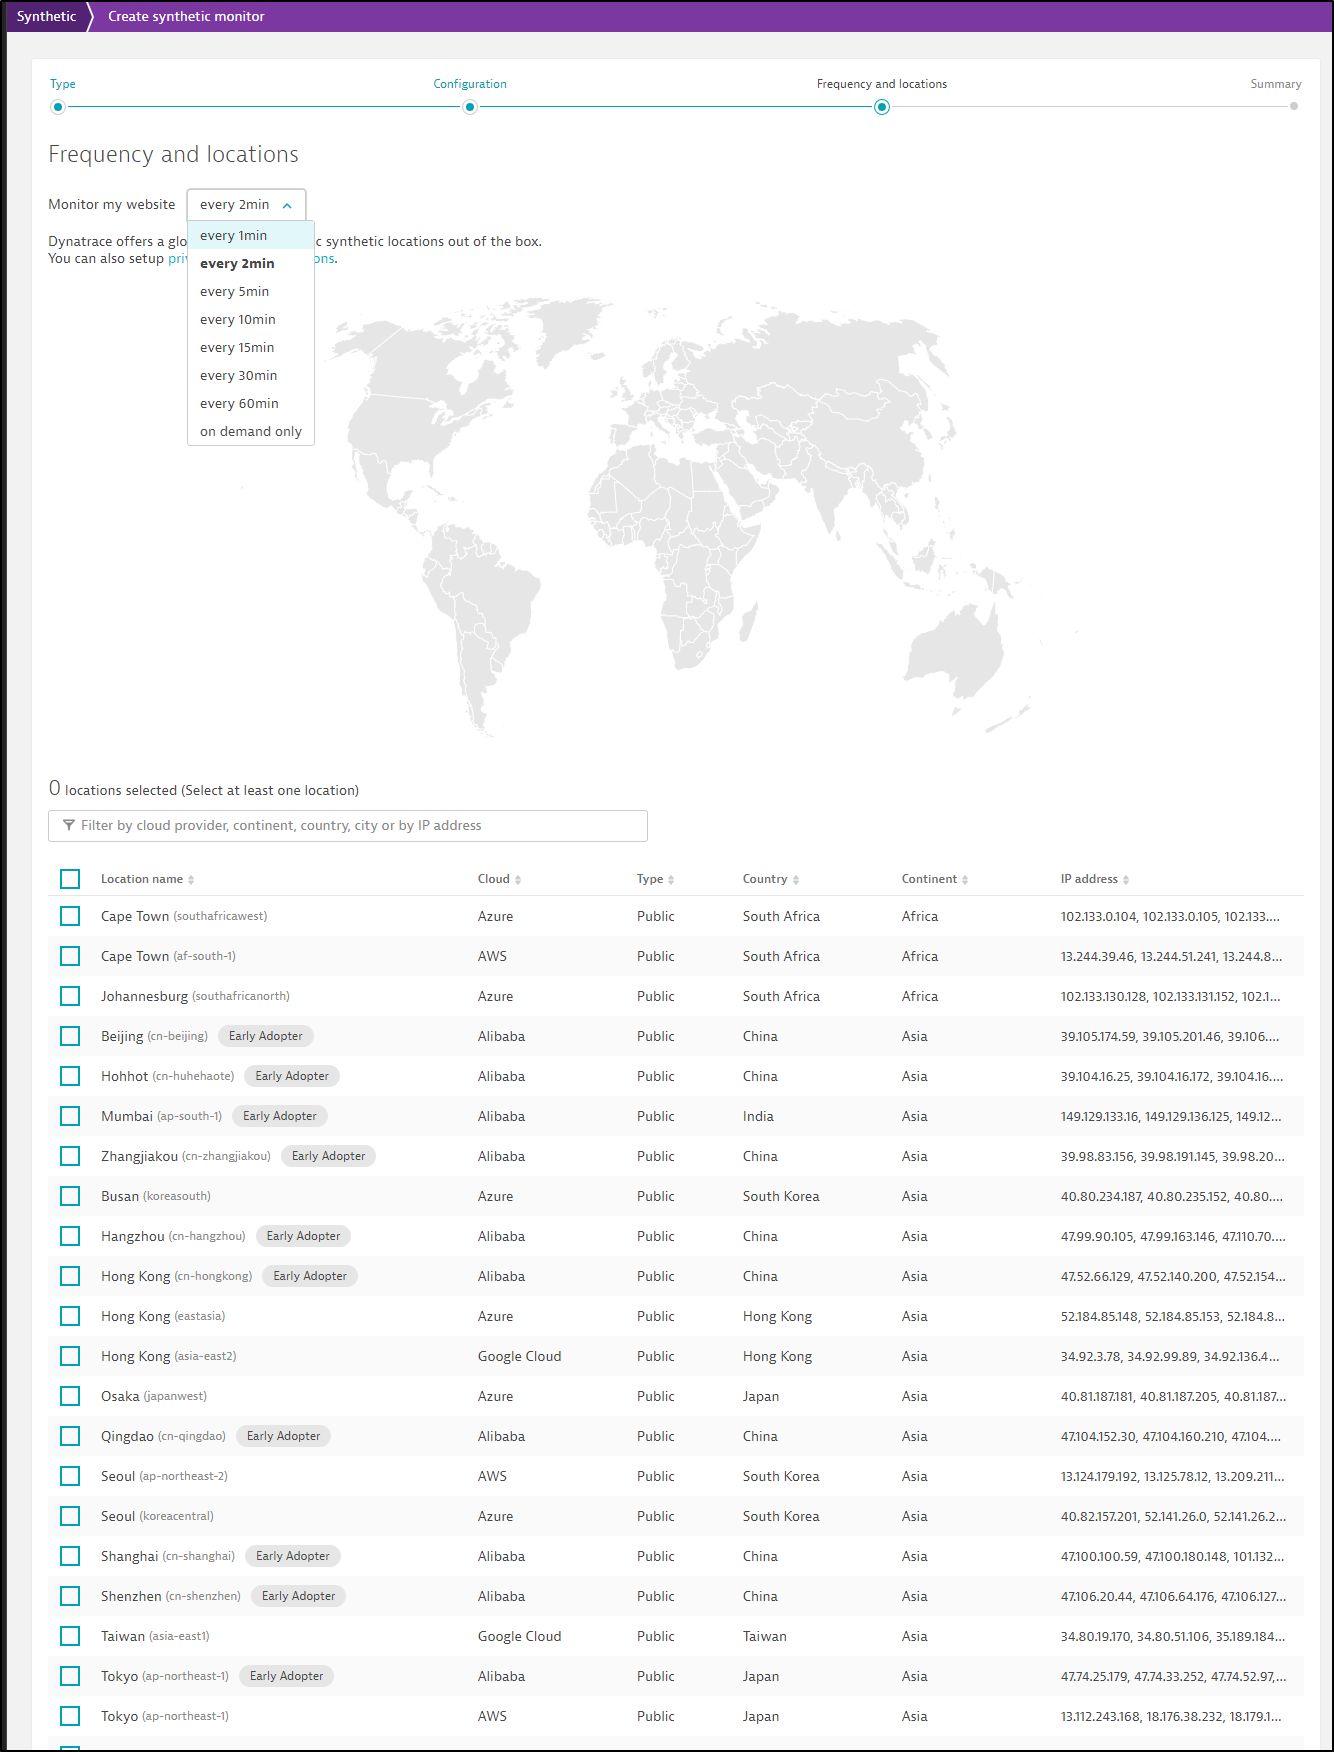
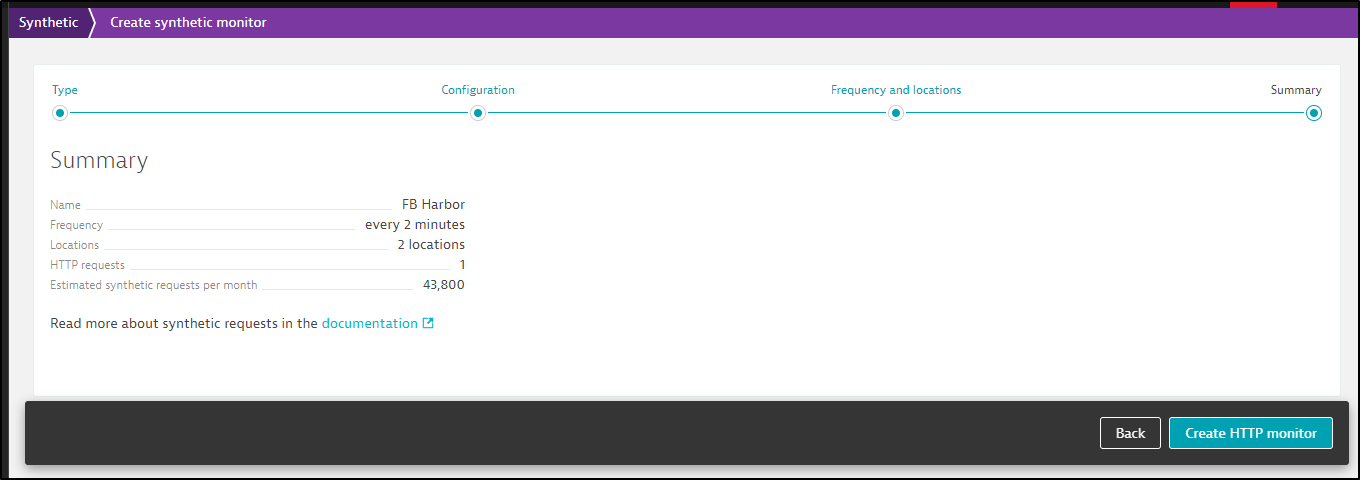
Lastly, click “Create HTTP monitor” to finish
After a few minutes, I can see results from Korea and Norway
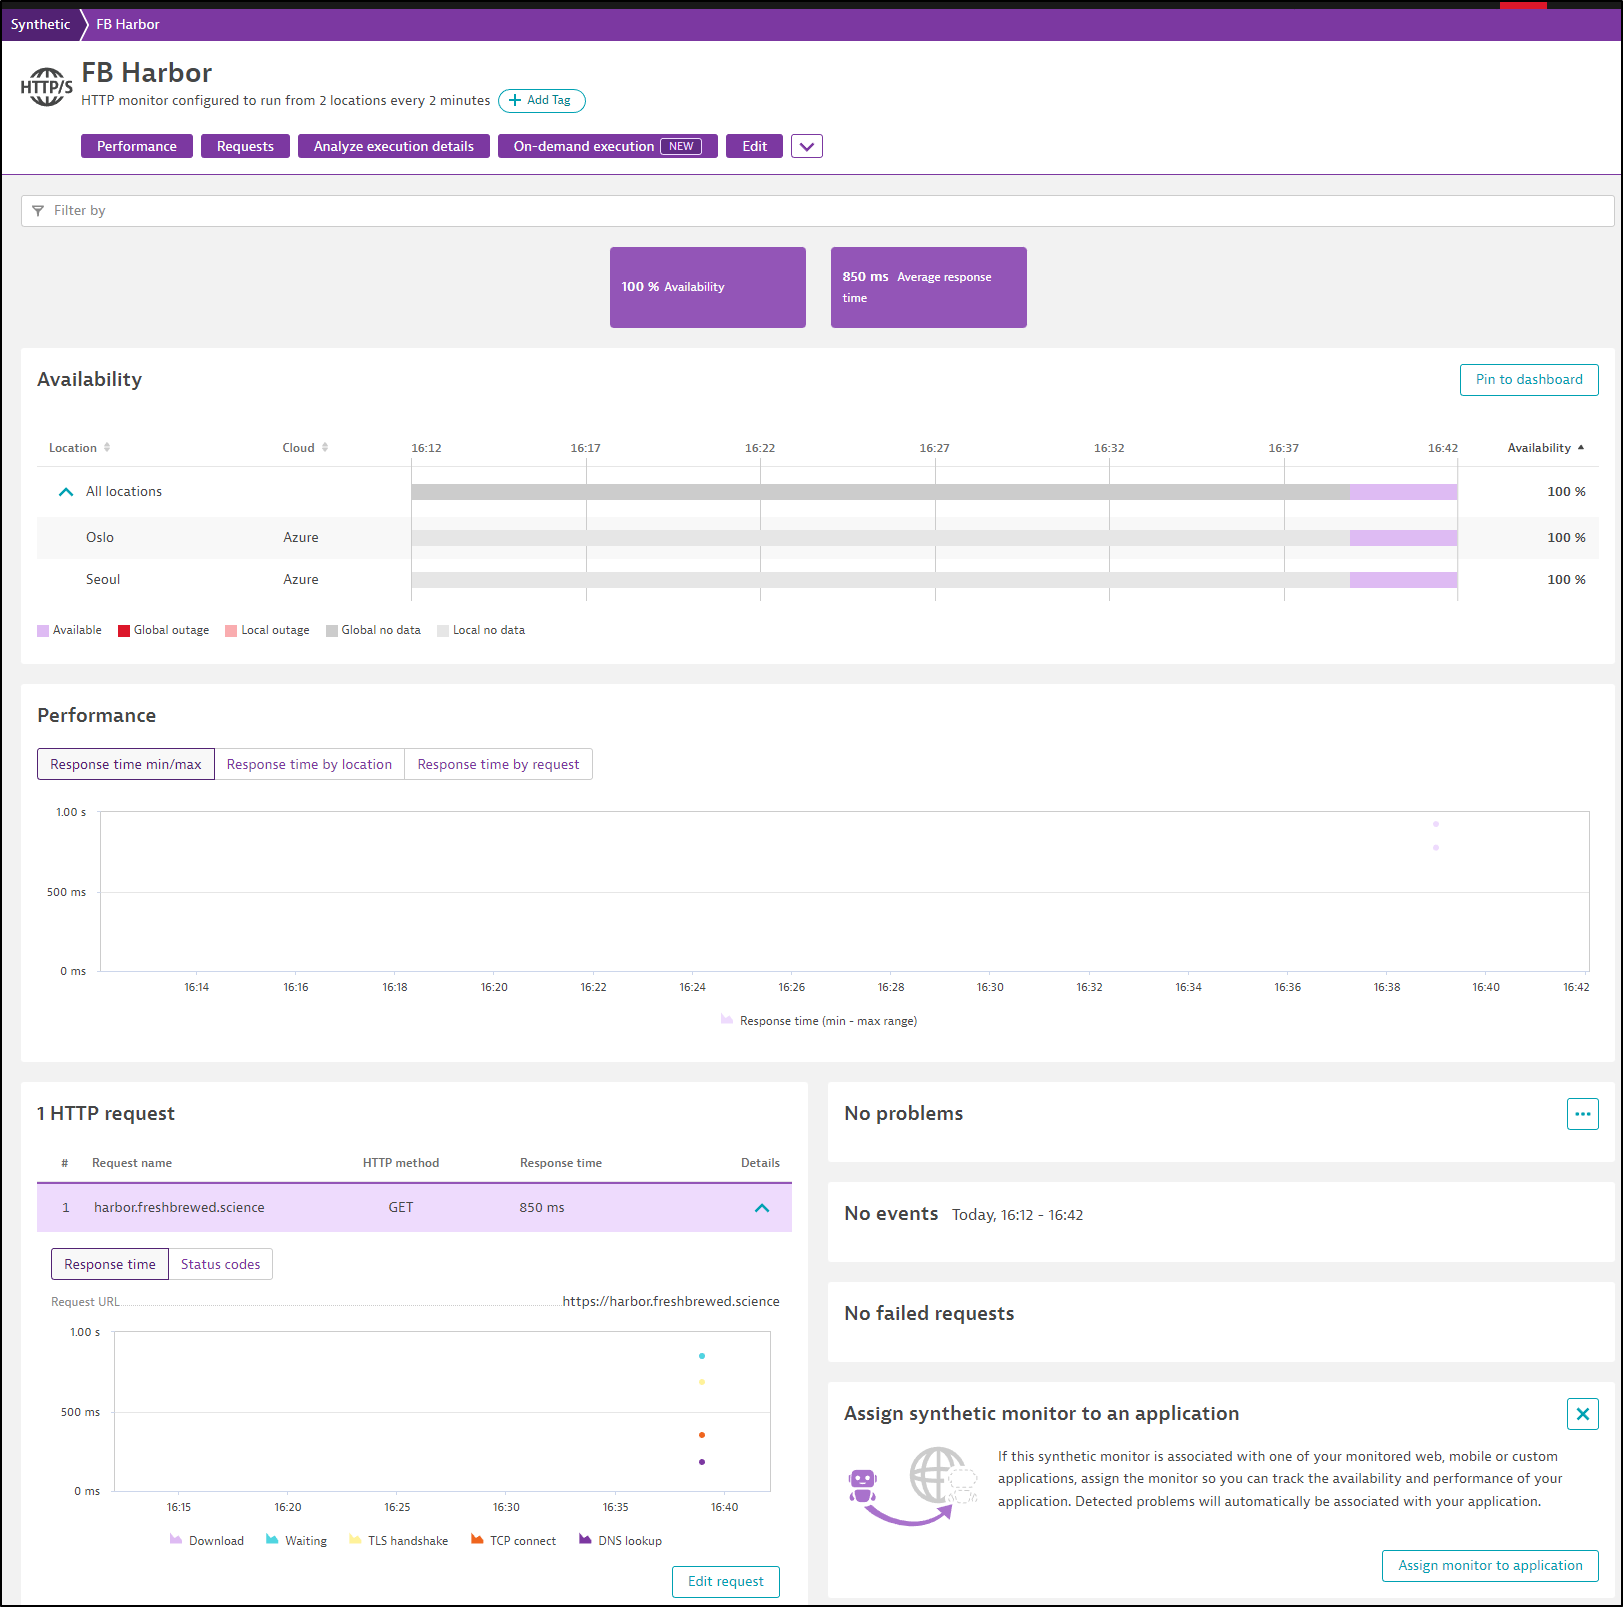
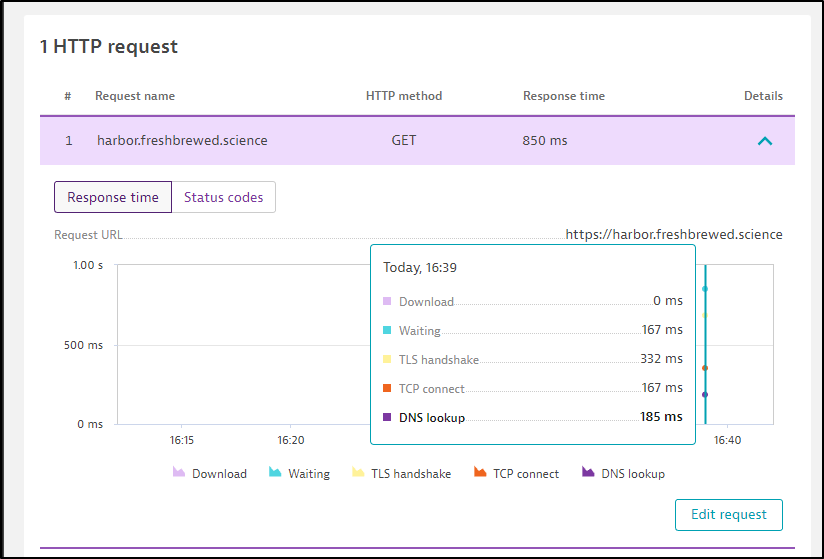
I can look at details about the traces as well
Private Synthetic Monitors
Go to settings, “Web and mobile monitoring” then find the section for “Private Synthetic Monitors”
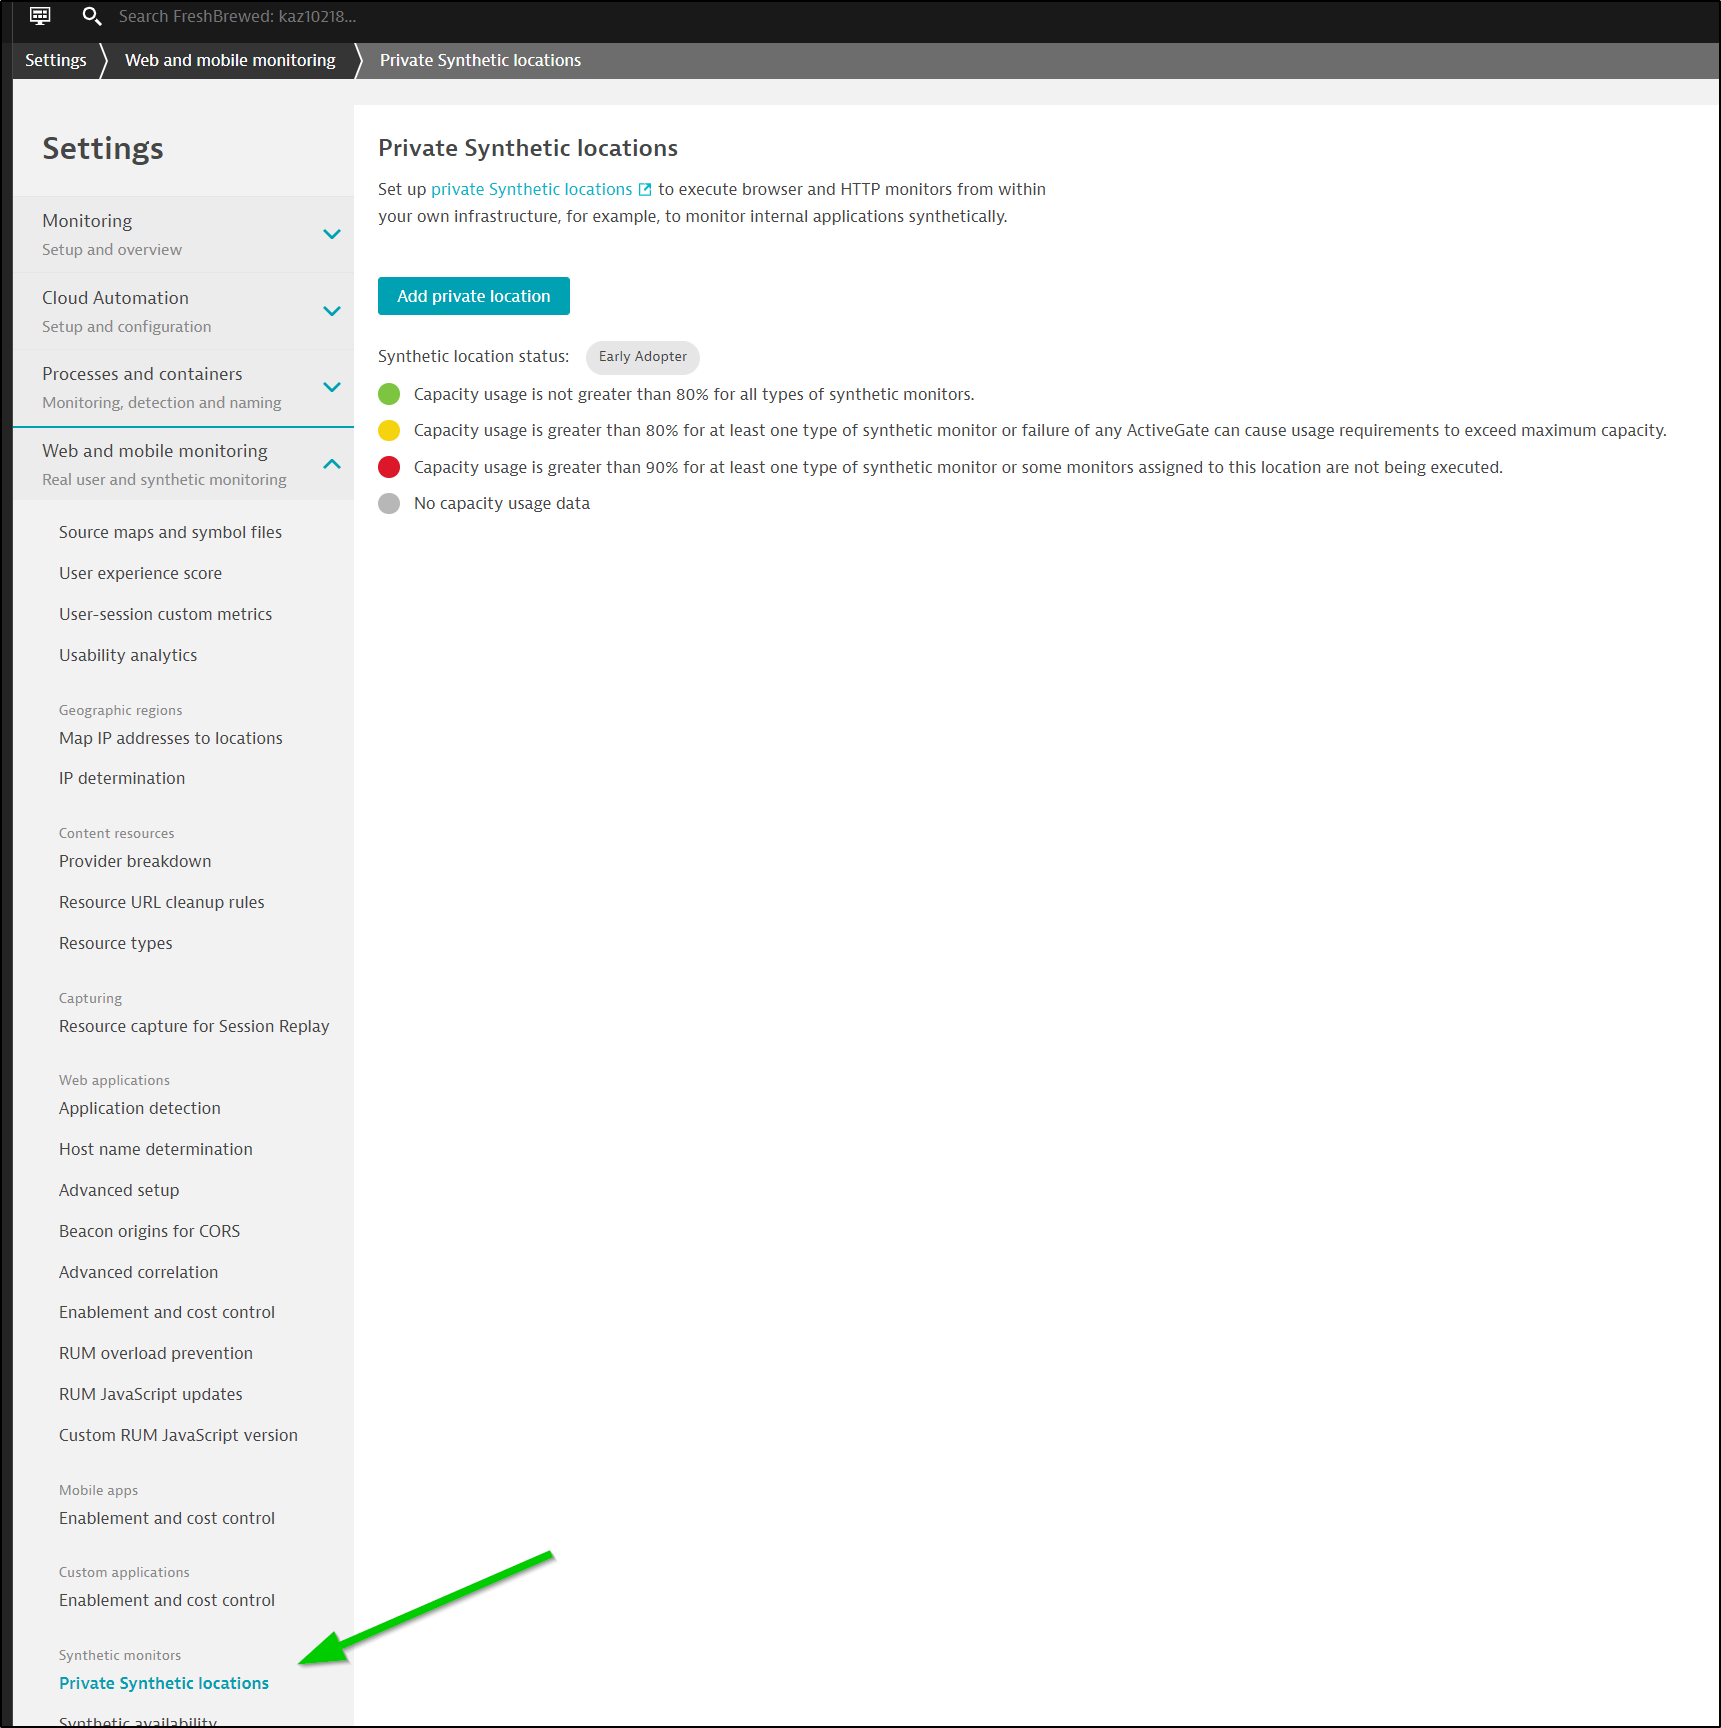
When we pick to create a Private Monitor, it wants an “ActiveGate”. So we’ll need to pivot and create one of those.
The “ActiveGate” is the private access method to be used for a private synthetic monitor. You can see some specific requirements on the docs page.
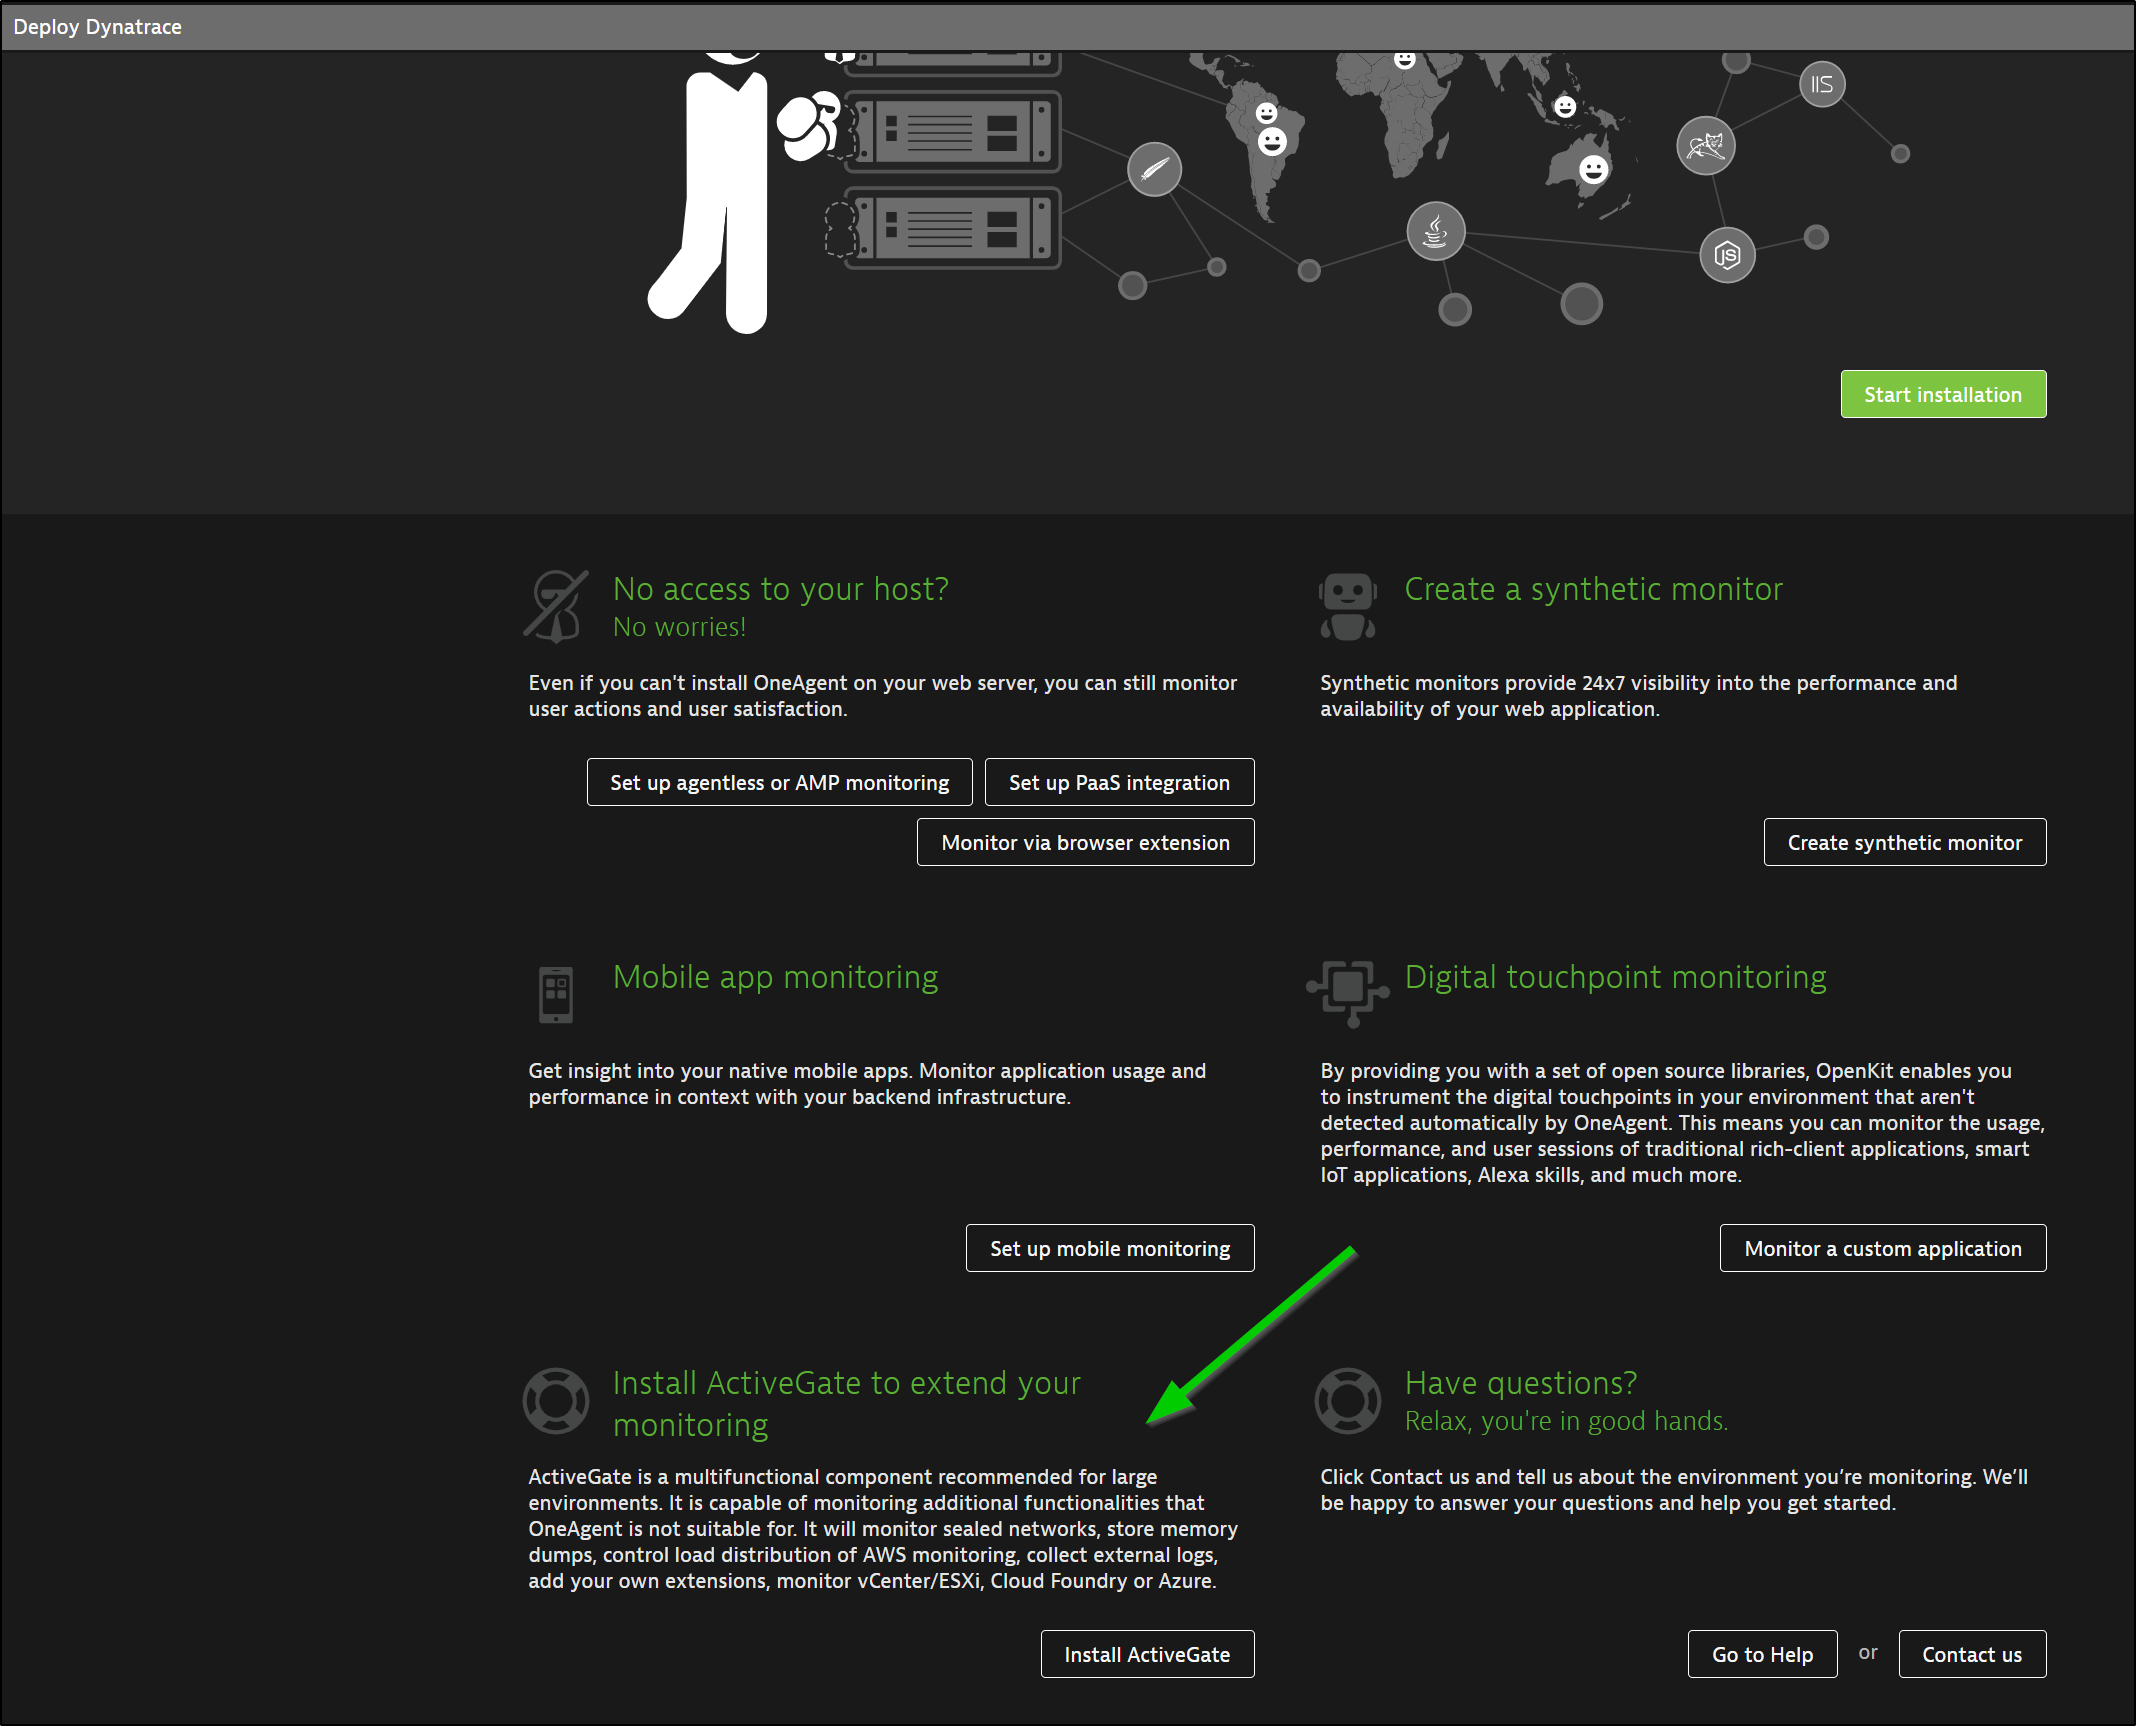
Installing an ActiveGate
We can use the WebUI or follow the docs.
If you didn’t see it from the Deploy page, it’s at the bottom if you scroll
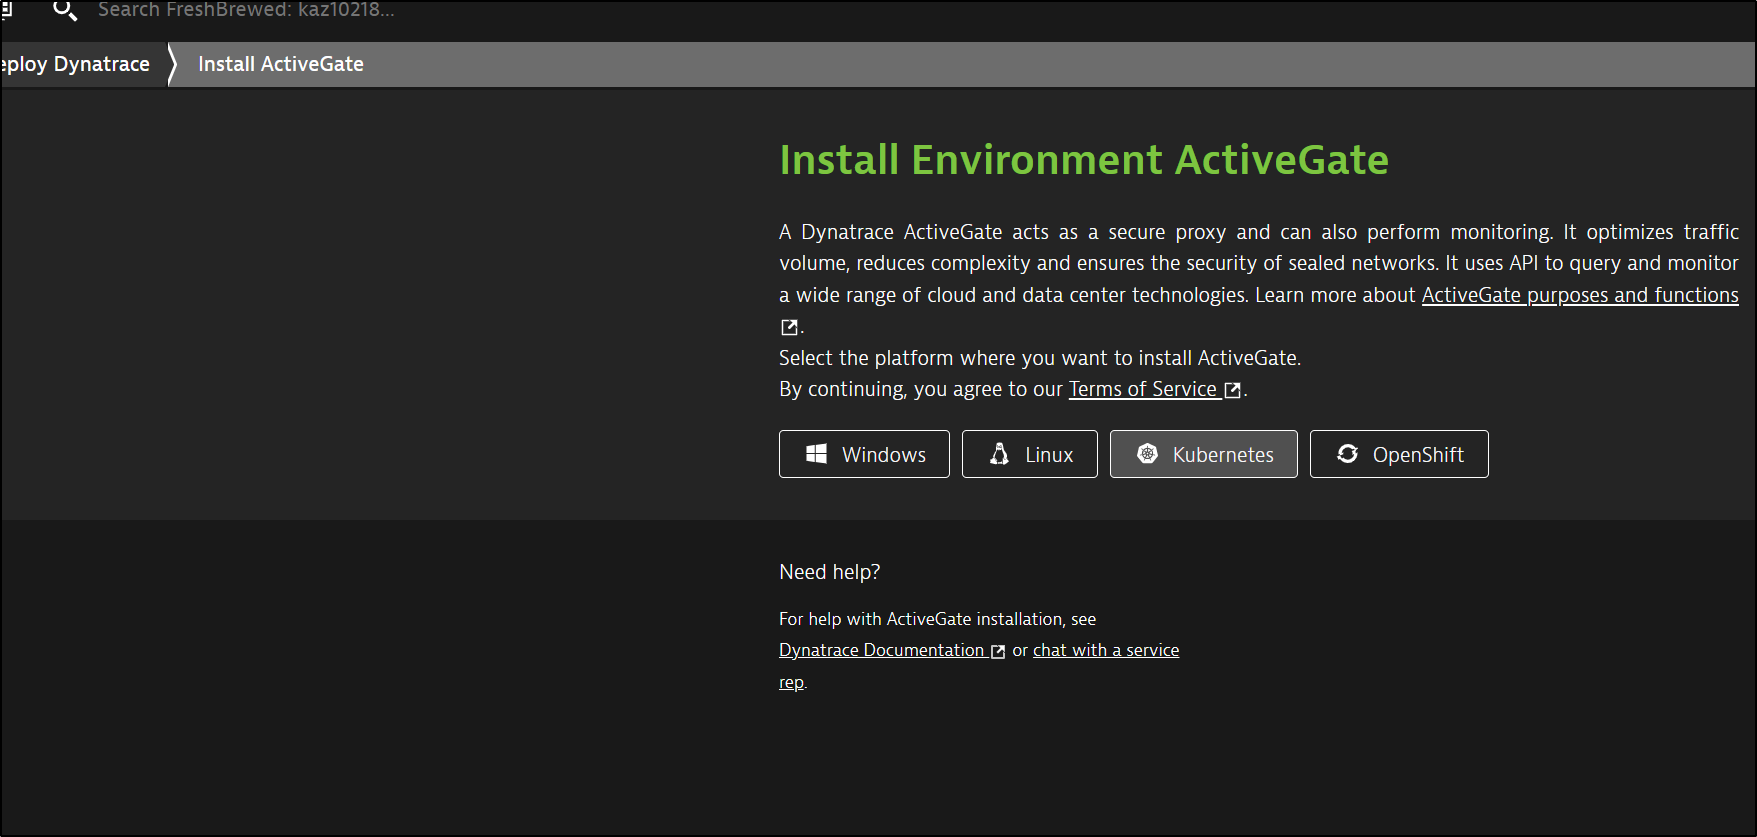
I’ll use Kubernetes
The installer follows the same as the Kubernetes monitor. We’ll have to check the differences in OneAgent yaml
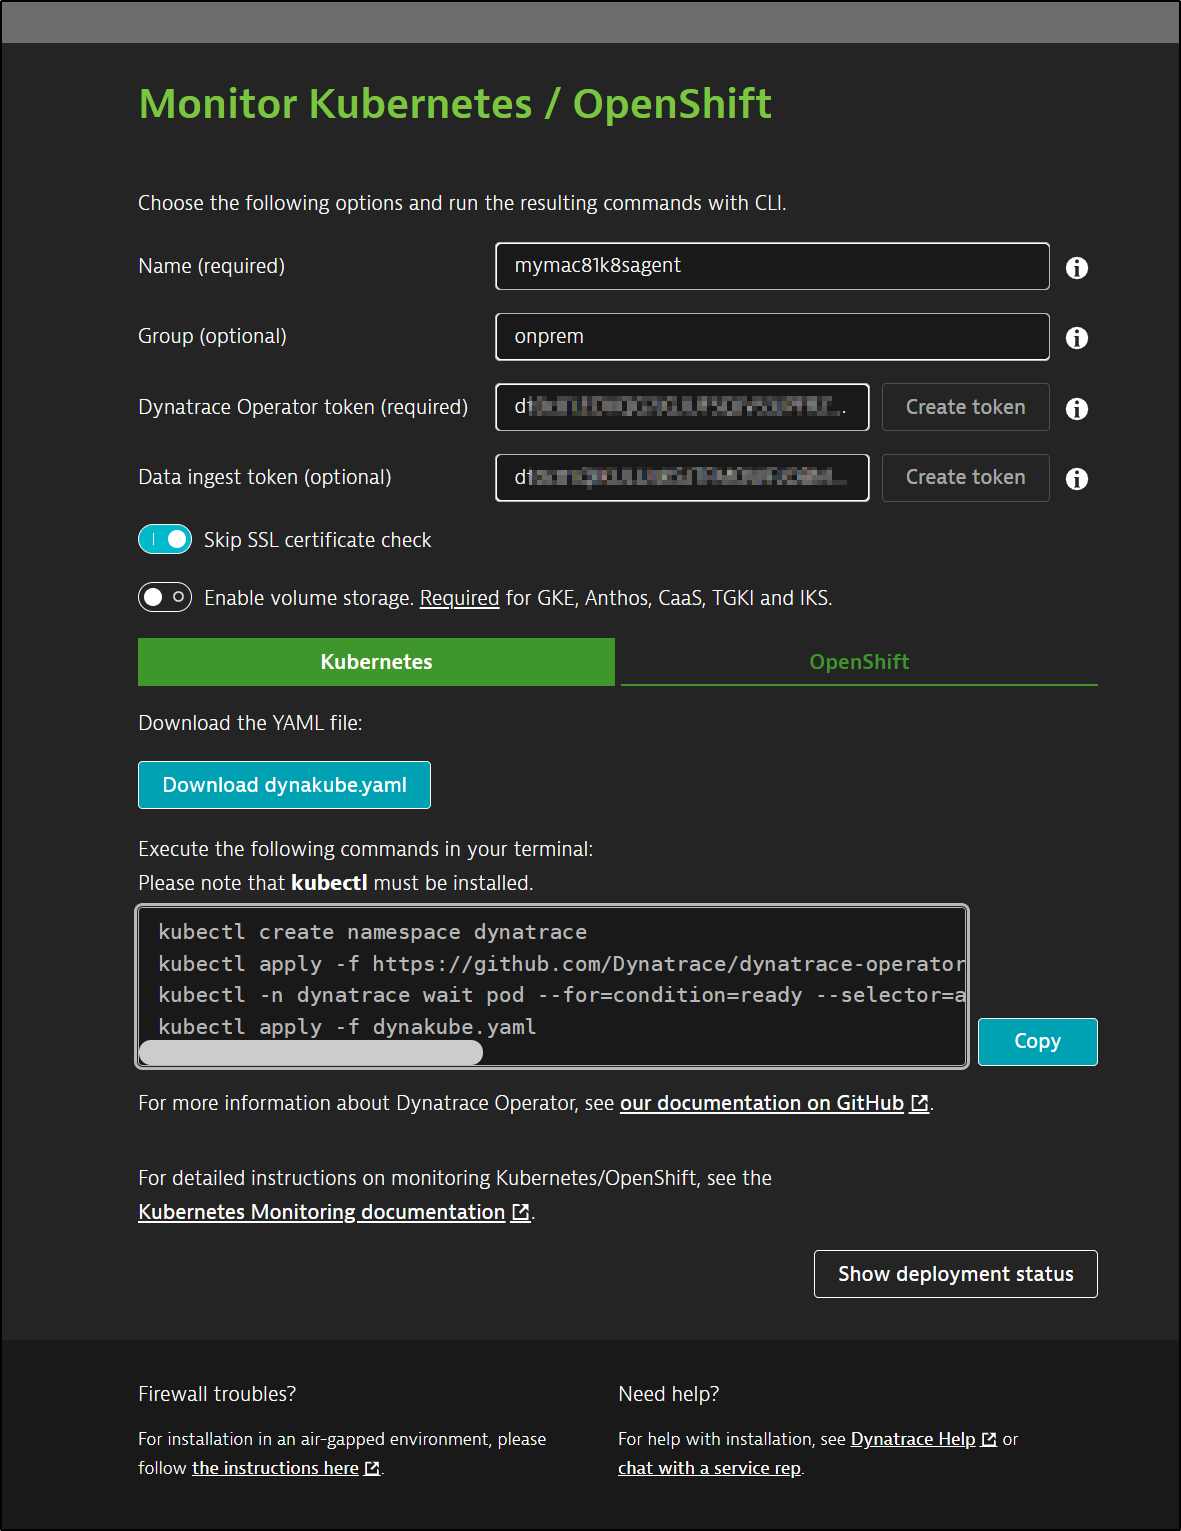
We can see its a Dynakube object:
$ cat /mnt/c/Users/isaac/Downloads/dynakube.yaml | head -n20 | sed 's/Token: .*$/Token: ********/g'
apiVersion: v1
data:
  apiToken: ********
  dataIngestToken: ********
kind: Secret
metadata:
  name: mymac81k8sagent
  namespace: dynatrace
type: Opaque
---
apiVersion: dynatrace.com/v1beta1
kind: DynaKube
metadata:
  name: mymac81k8sagent
  namespace: dynatrace
  annotations:
    feature.dynatrace.com/automatic-kubernetes-api-monitoring: "true"
spec:
  # Dynatrace apiUrl including the `/api` path at the end.
  # For SaaS, set `YOUR_ENVIRONMENT_ID` to your environment ID.
The next steps are virtually identicall to the K8s monitor steps
$ kubectl create namespace dynatrace
namespace/dynatrace created

$ kubectl apply -f https://github.com/Dynatrace/dynatrace-operator/releases/download/v0.10.0/kubernetes.yaml
poddisruptionbudget.policy/dynatrace-webhook created
serviceaccount/dynatrace-activegate created
serviceaccount/dynatrace-kubernetes-monitoring created
serviceaccount/dynatrace-dynakube-oneagent-privileged created
serviceaccount/dynatrace-dynakube-oneagent-unprivileged created
serviceaccount/dynatrace-operator created
serviceaccount/dynatrace-webhook created
customresourcedefinition.apiextensions.k8s.io/dynakubes.dynatrace.com created
clusterrole.rbac.authorization.k8s.io/dynatrace-kubernetes-monitoring created
clusterrole.rbac.authorization.k8s.io/dynatrace-operator created
clusterrole.rbac.authorization.k8s.io/dynatrace-webhook created
clusterrolebinding.rbac.authorization.k8s.io/dynatrace-kubernetes-monitoring created
clusterrolebinding.rbac.authorization.k8s.io/dynatrace-operator created
clusterrolebinding.rbac.authorization.k8s.io/dynatrace-webhook created
role.rbac.authorization.k8s.io/dynatrace-operator created
role.rbac.authorization.k8s.io/dynatrace-webhook created
rolebinding.rbac.authorization.k8s.io/dynatrace-operator created
rolebinding.rbac.authorization.k8s.io/dynatrace-webhook created
service/dynatrace-webhook created
deployment.apps/dynatrace-operator created
deployment.apps/dynatrace-webhook created
mutatingwebhookconfiguration.admissionregistration.k8s.io/dynatrace-webhook created
validatingwebhookconfiguration.admissionregistration.k8s.io/dynatrace-webhook created

$ kubectl -n dynatrace wait pod --for=condition=ready --selector=app.kubernetes.io/name=dynatrace-operator,app.kubernetes.io/component=webhook --timeout=300s
pod/dynatrace-webhook-b9c6bd86b-lnrn5 condition met
pod/dynatrace-webhook-b9c6bd86b-9m89w condition met

$ kubectl apply -f /mnt/c/Users/isaac/Downloads/dynakube\ \(2\).yaml
secret/mymac81k8sagent created
dynakube.dynatrace.com/mymac81k8sagent created
I could already see my first cluster
But in a few minutes I saw both
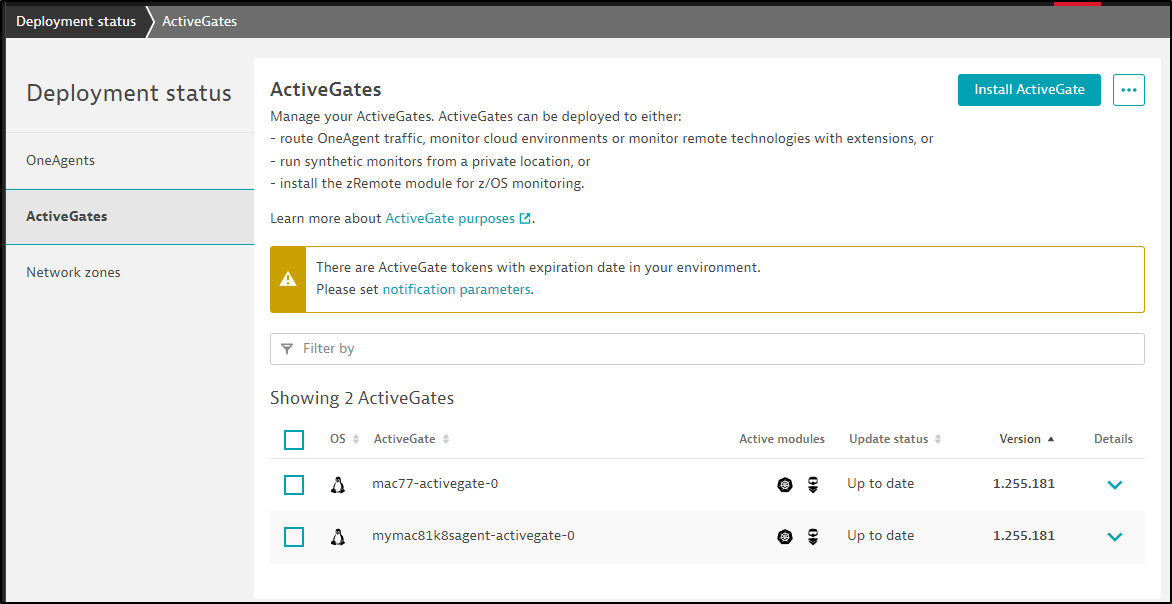
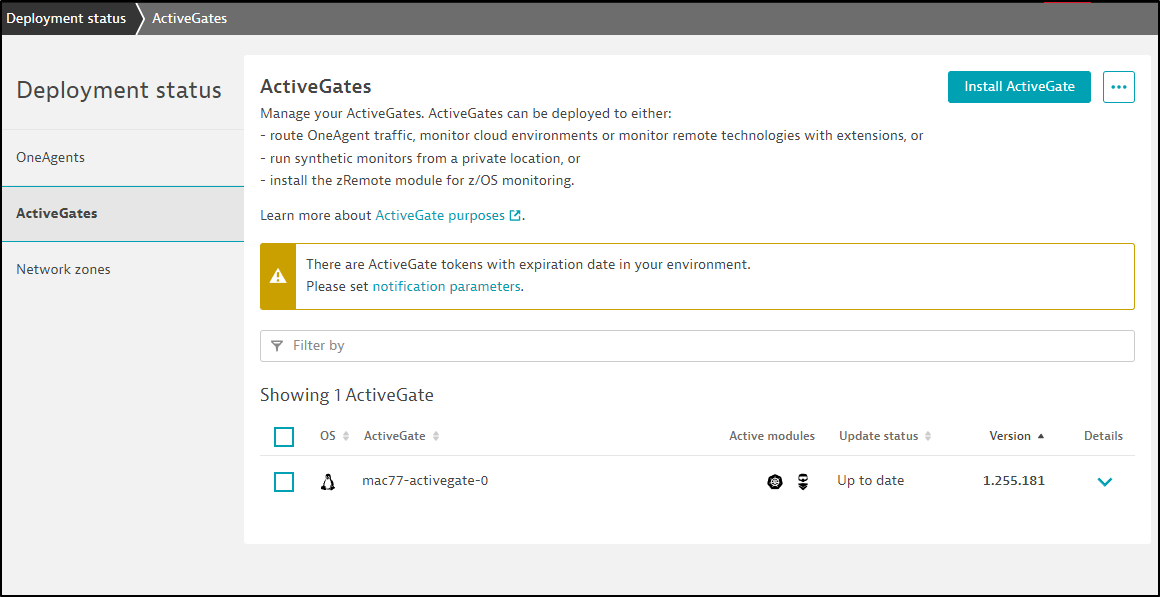
Yet, clearly, I cannot seem to add a Private Location even with two ActiveGates
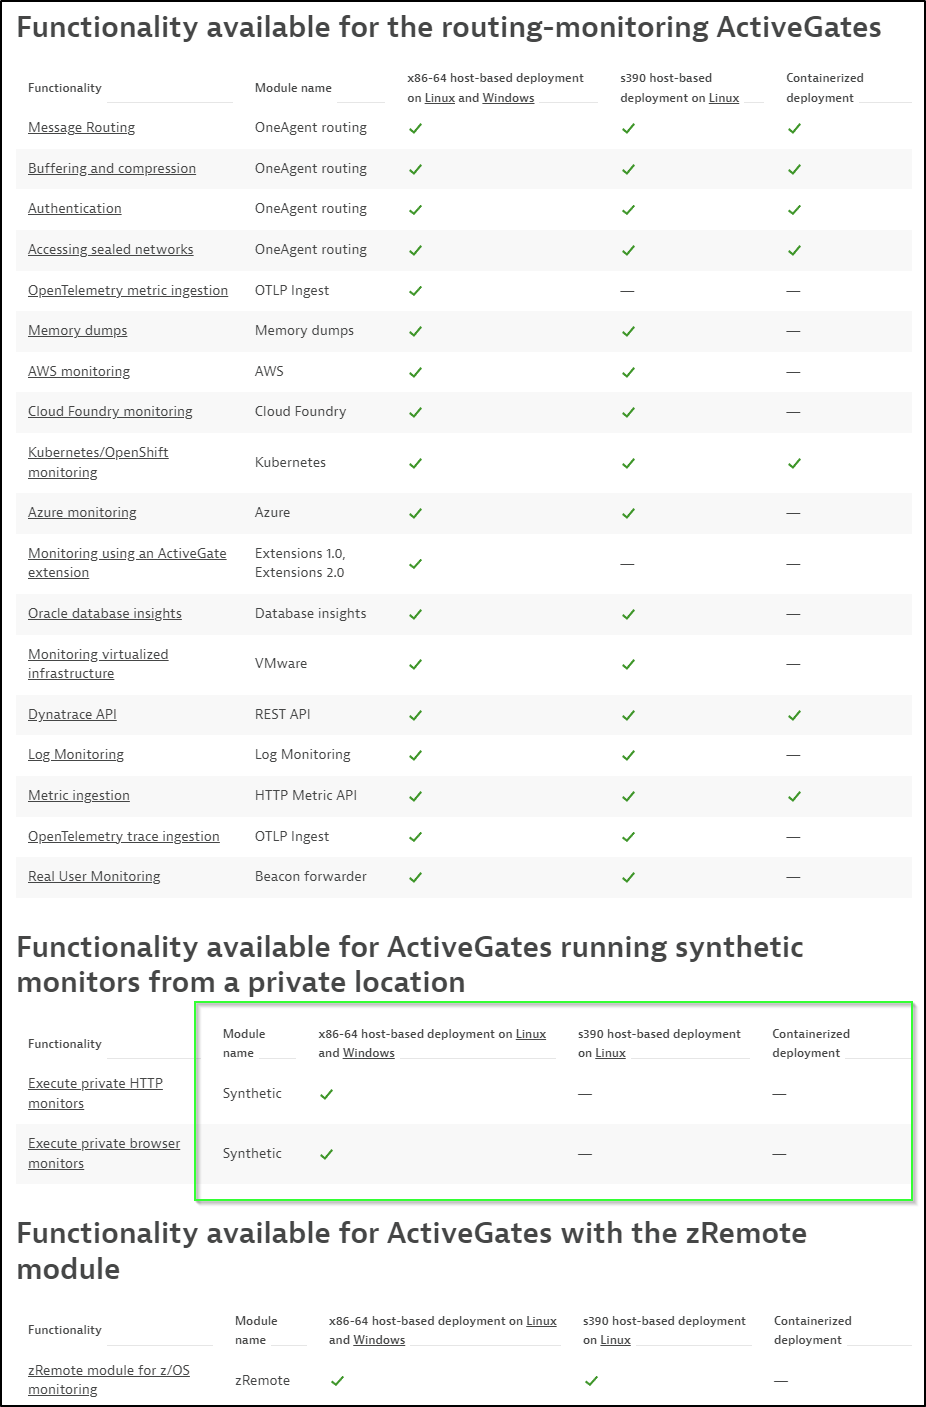
I started to dig a bit more, in the details for Functionality of ActiveGates, it would appear that only x86-64 HOST based ActiveGates can be used for Synthetic monitors
Going to the Windows Installation, we can see we can now pick the “purpose” and choose Synthetic Monitors
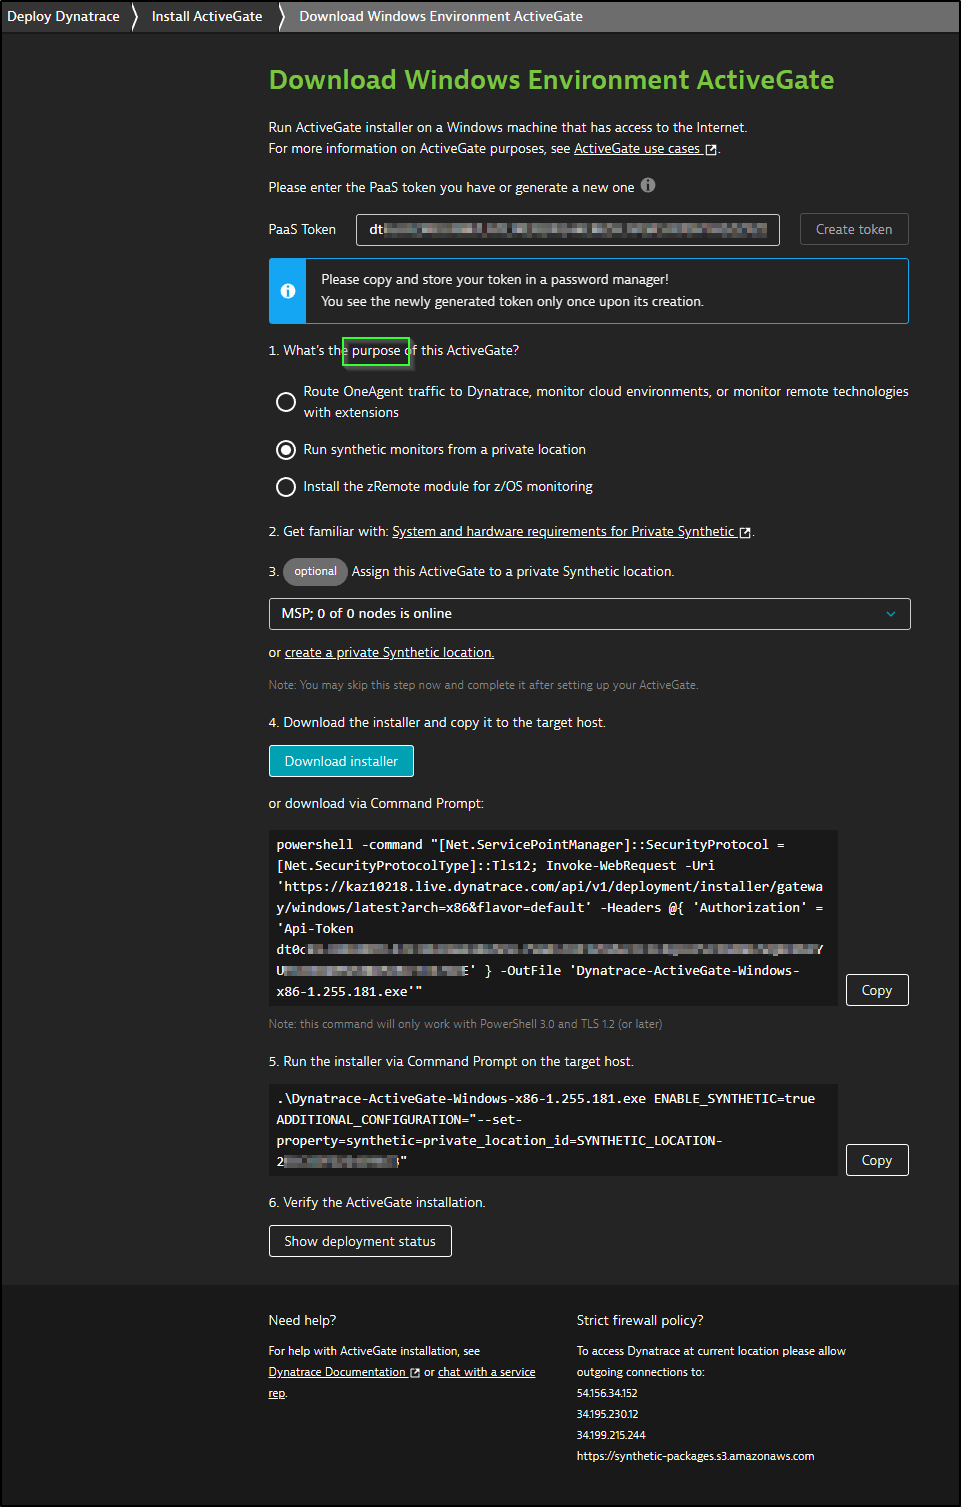
We can set the location during install
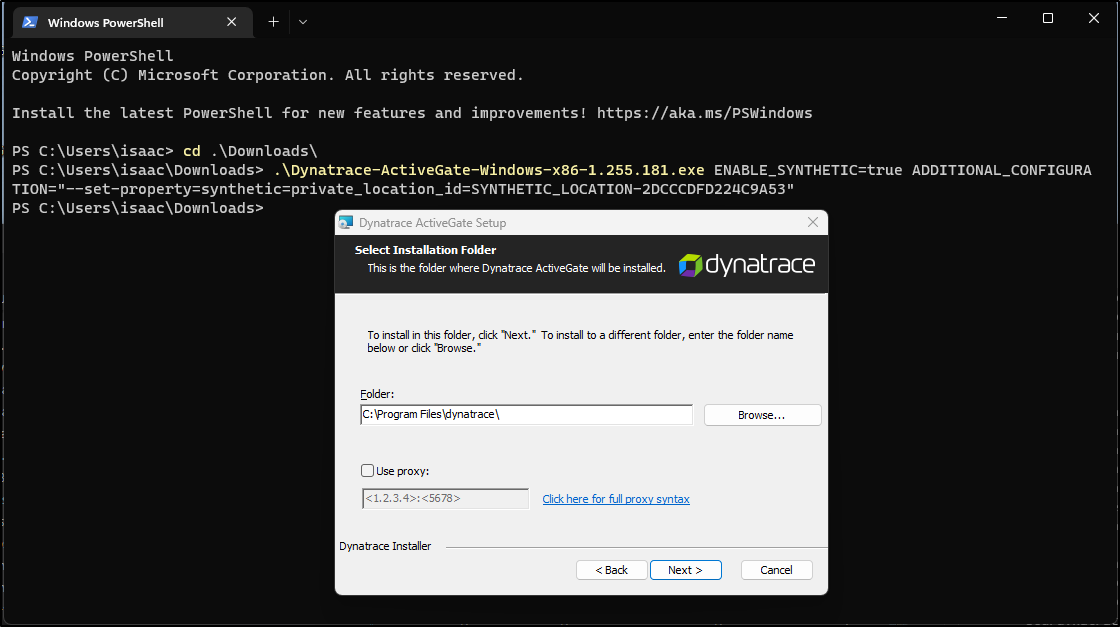
The installer took a long while and a web browser popped up briefly to a “/dev/null” URL then closed. But after several minutes, it completed
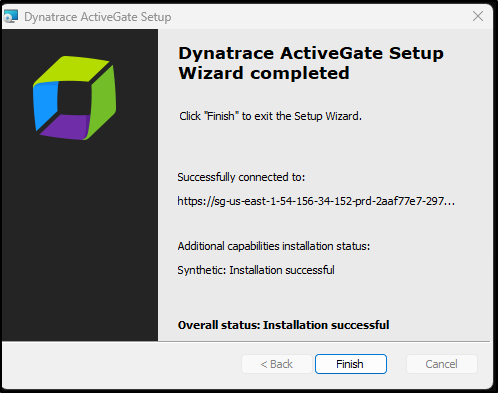
I can now see the new ActiveGate listed
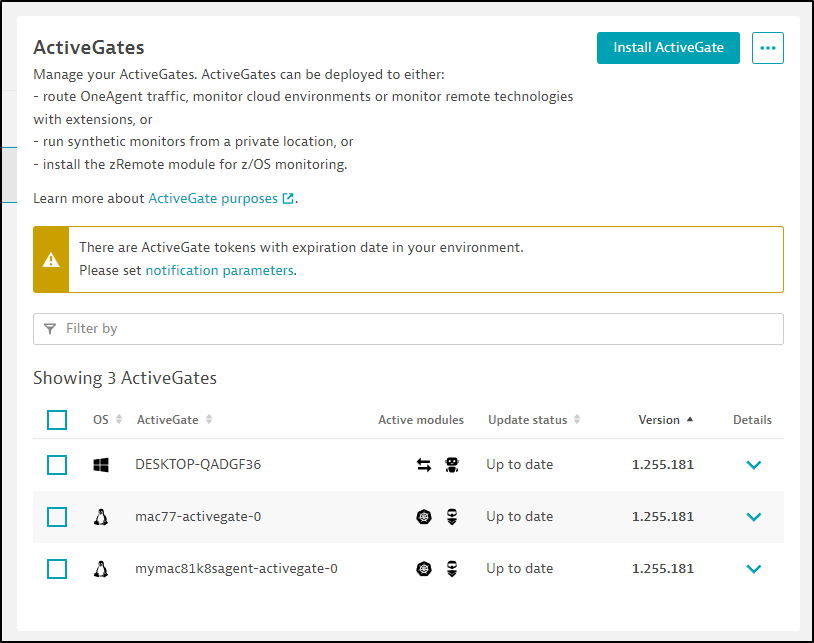
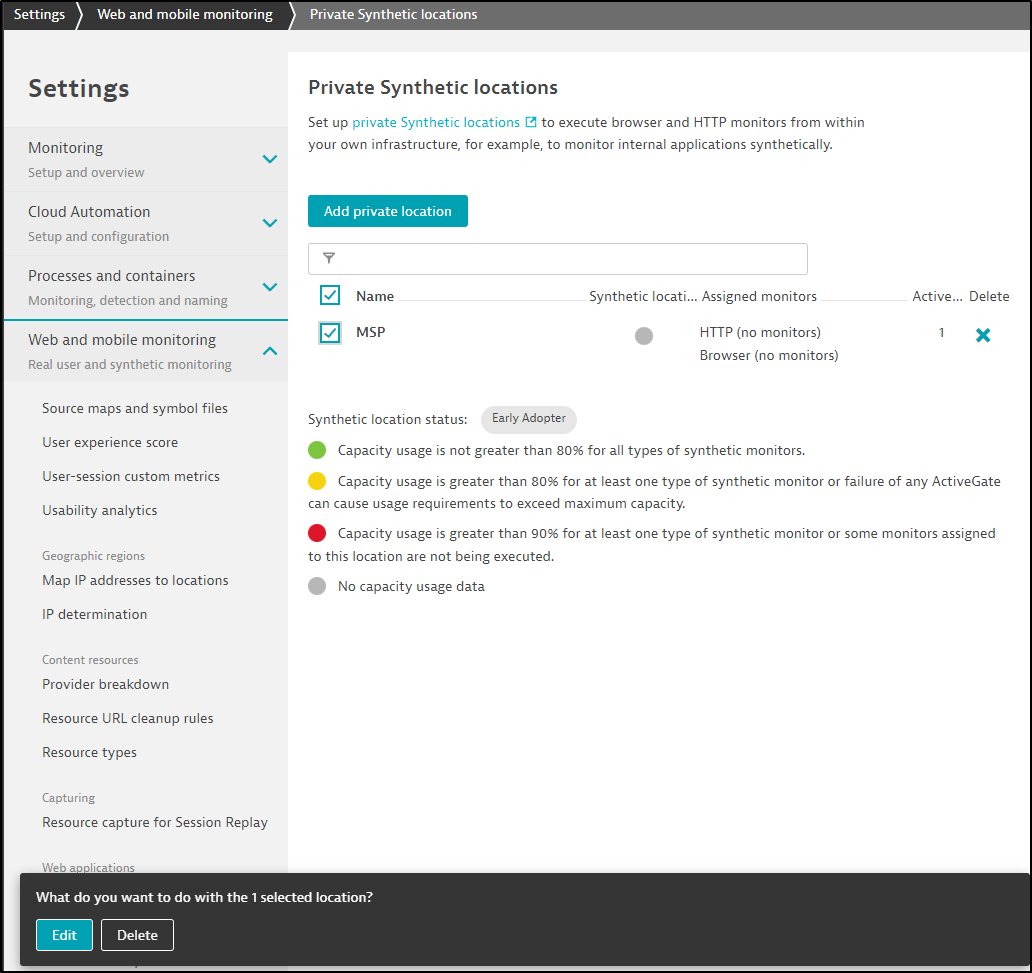
Now, when I got to edit the Private Location I started
I think it is now using a containerized docker based agent on my Windows host
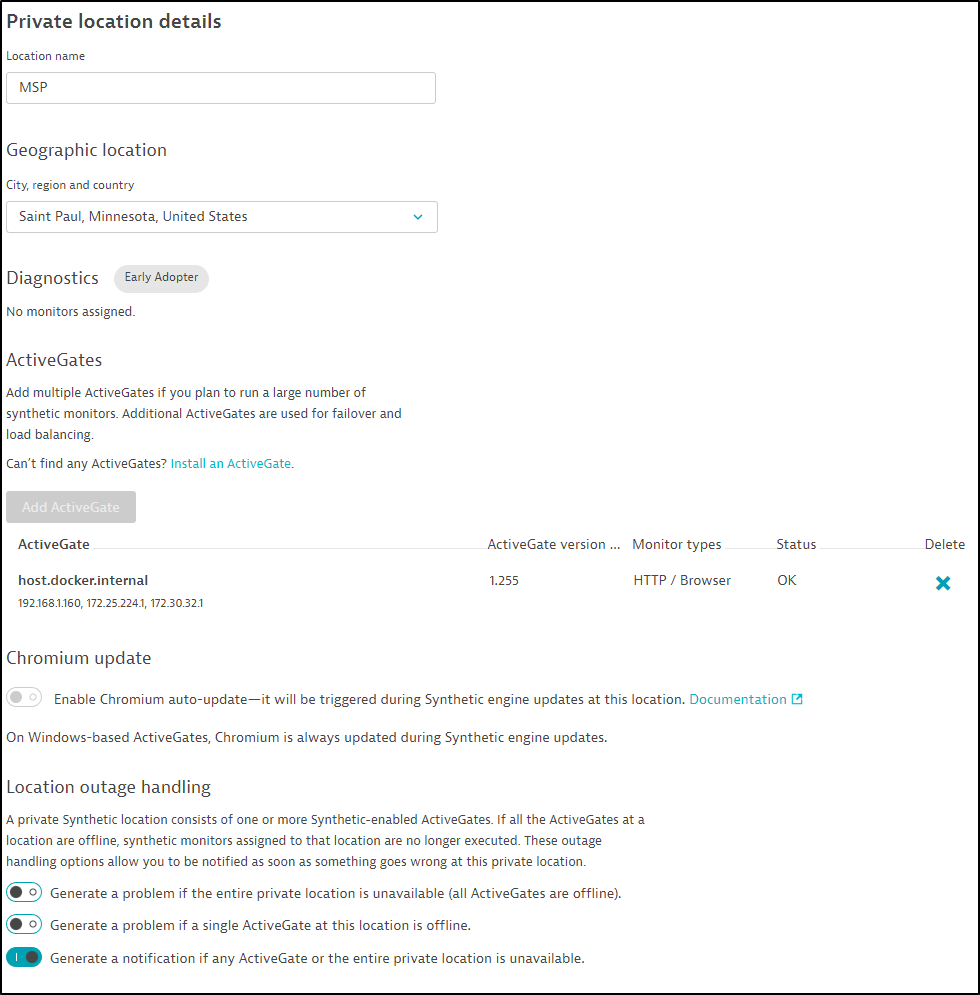
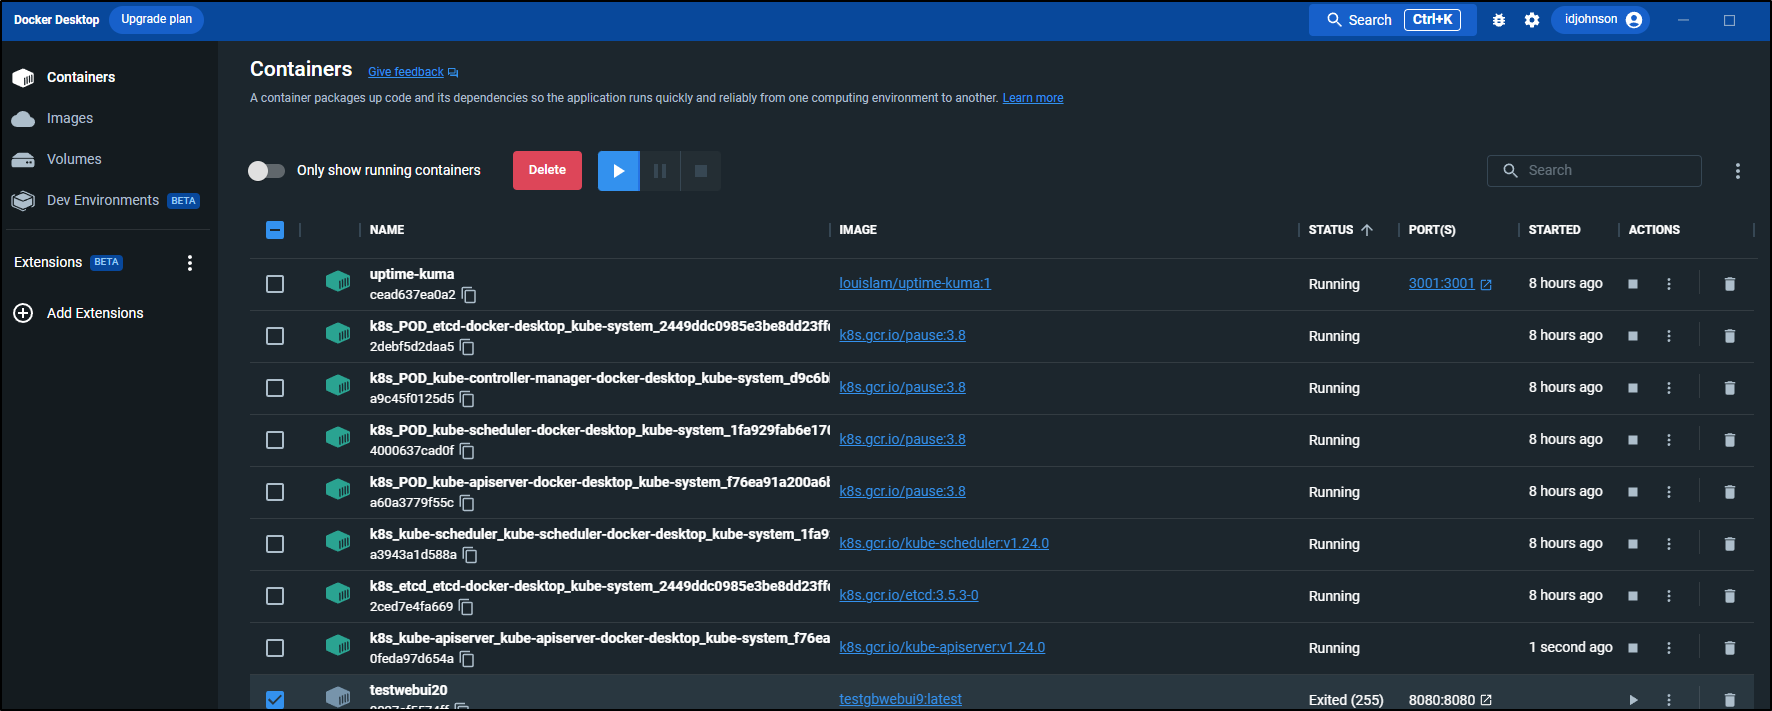
Though I do not see a new container amongst my running containers (nor in Hyper-V)
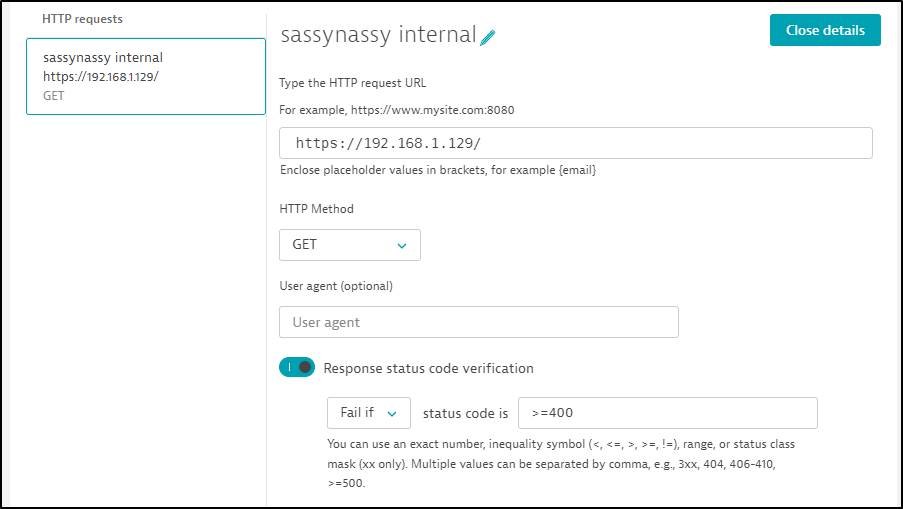
Going back to Synthetic Monitors, we can add one for an internal server
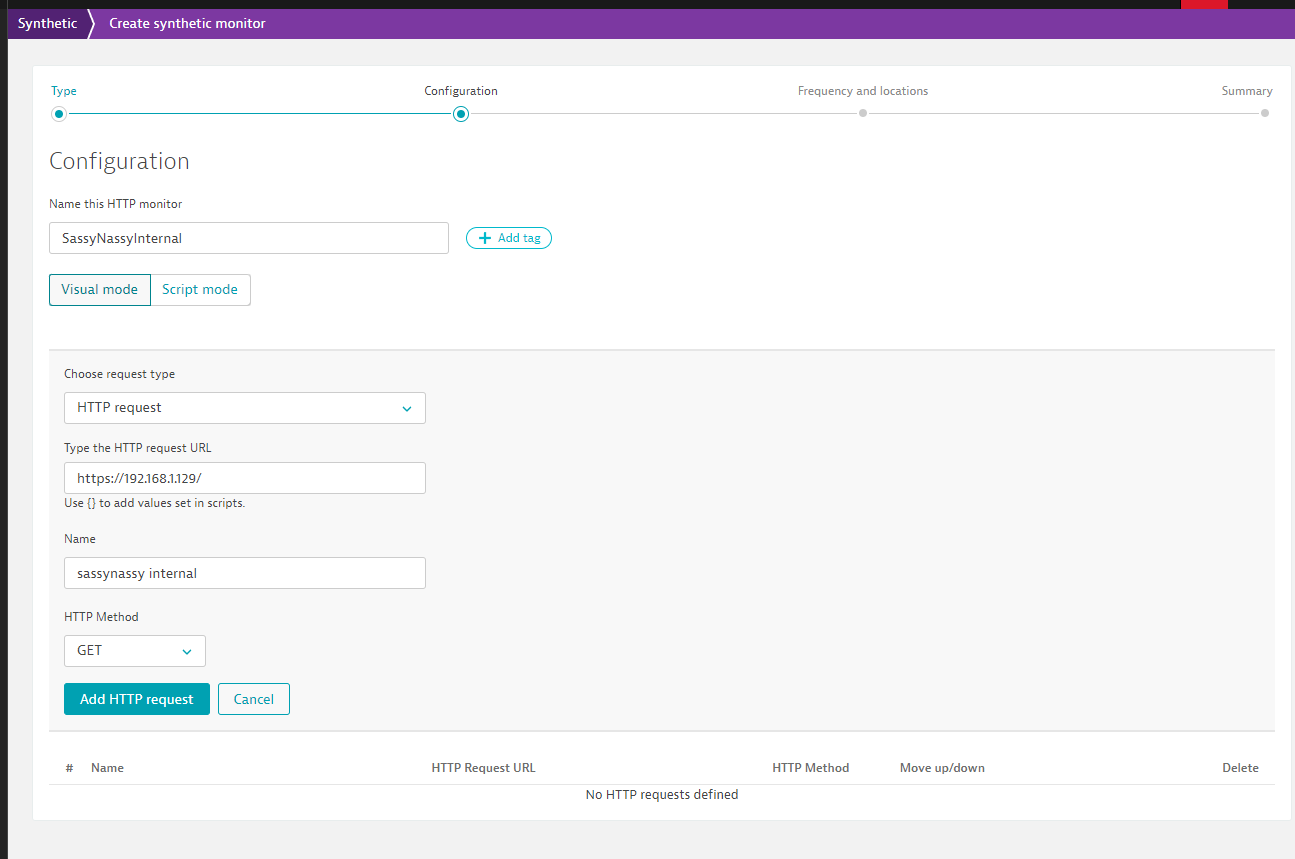
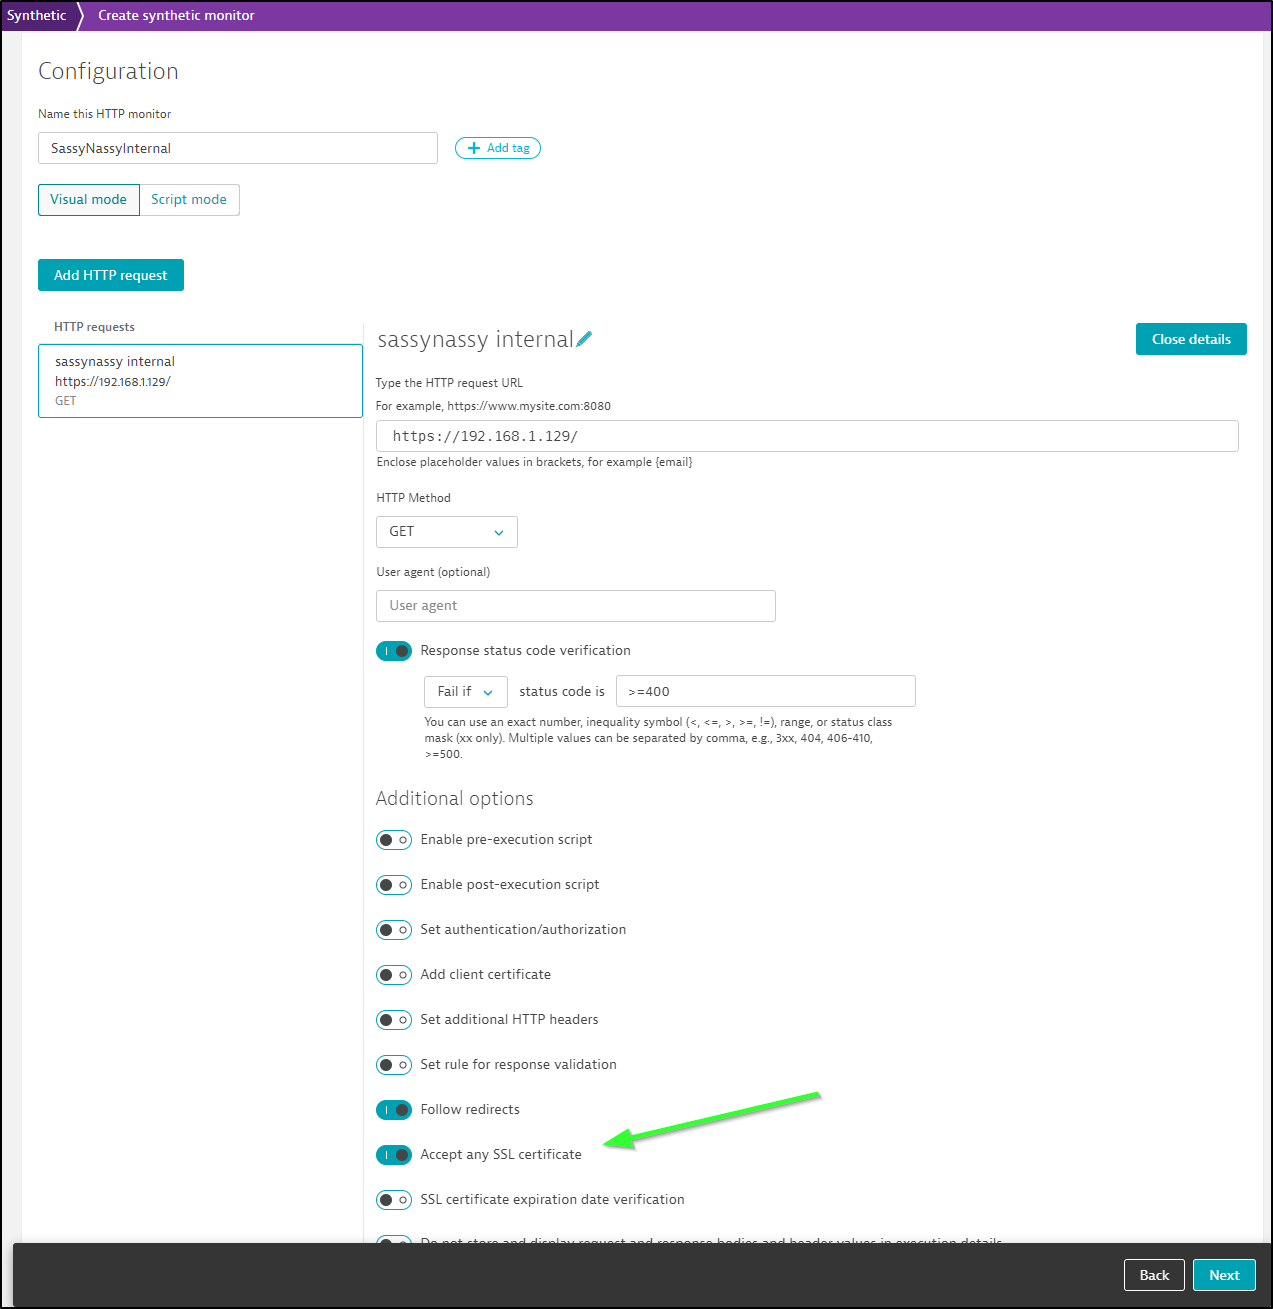
Here I’ll use the internal IP of my NAS and make sure to ignore SSL errors
When I now search for locations by Name, I can find my private location
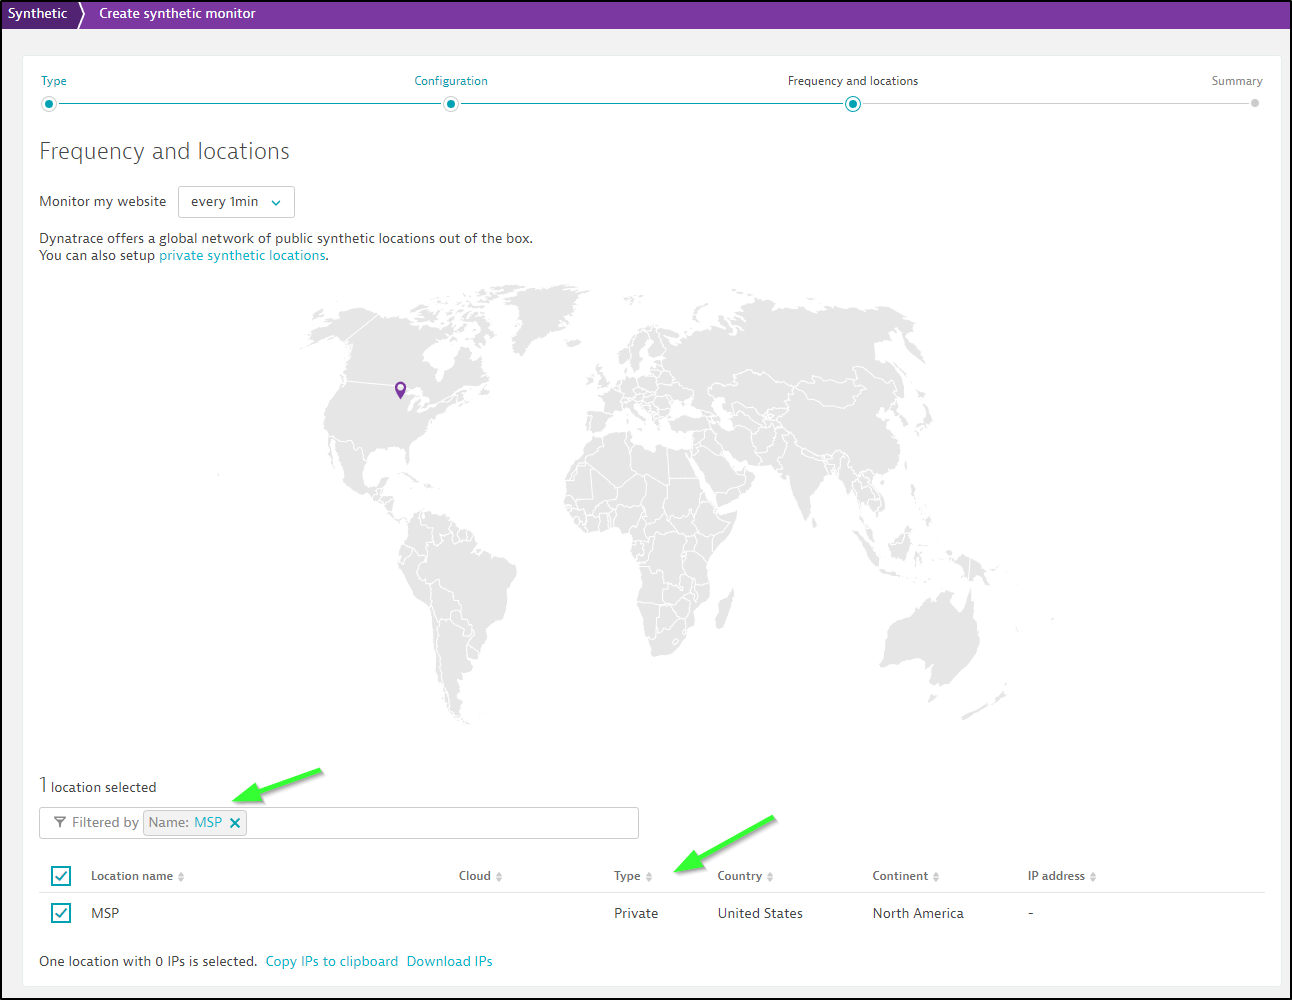
And lastly create it
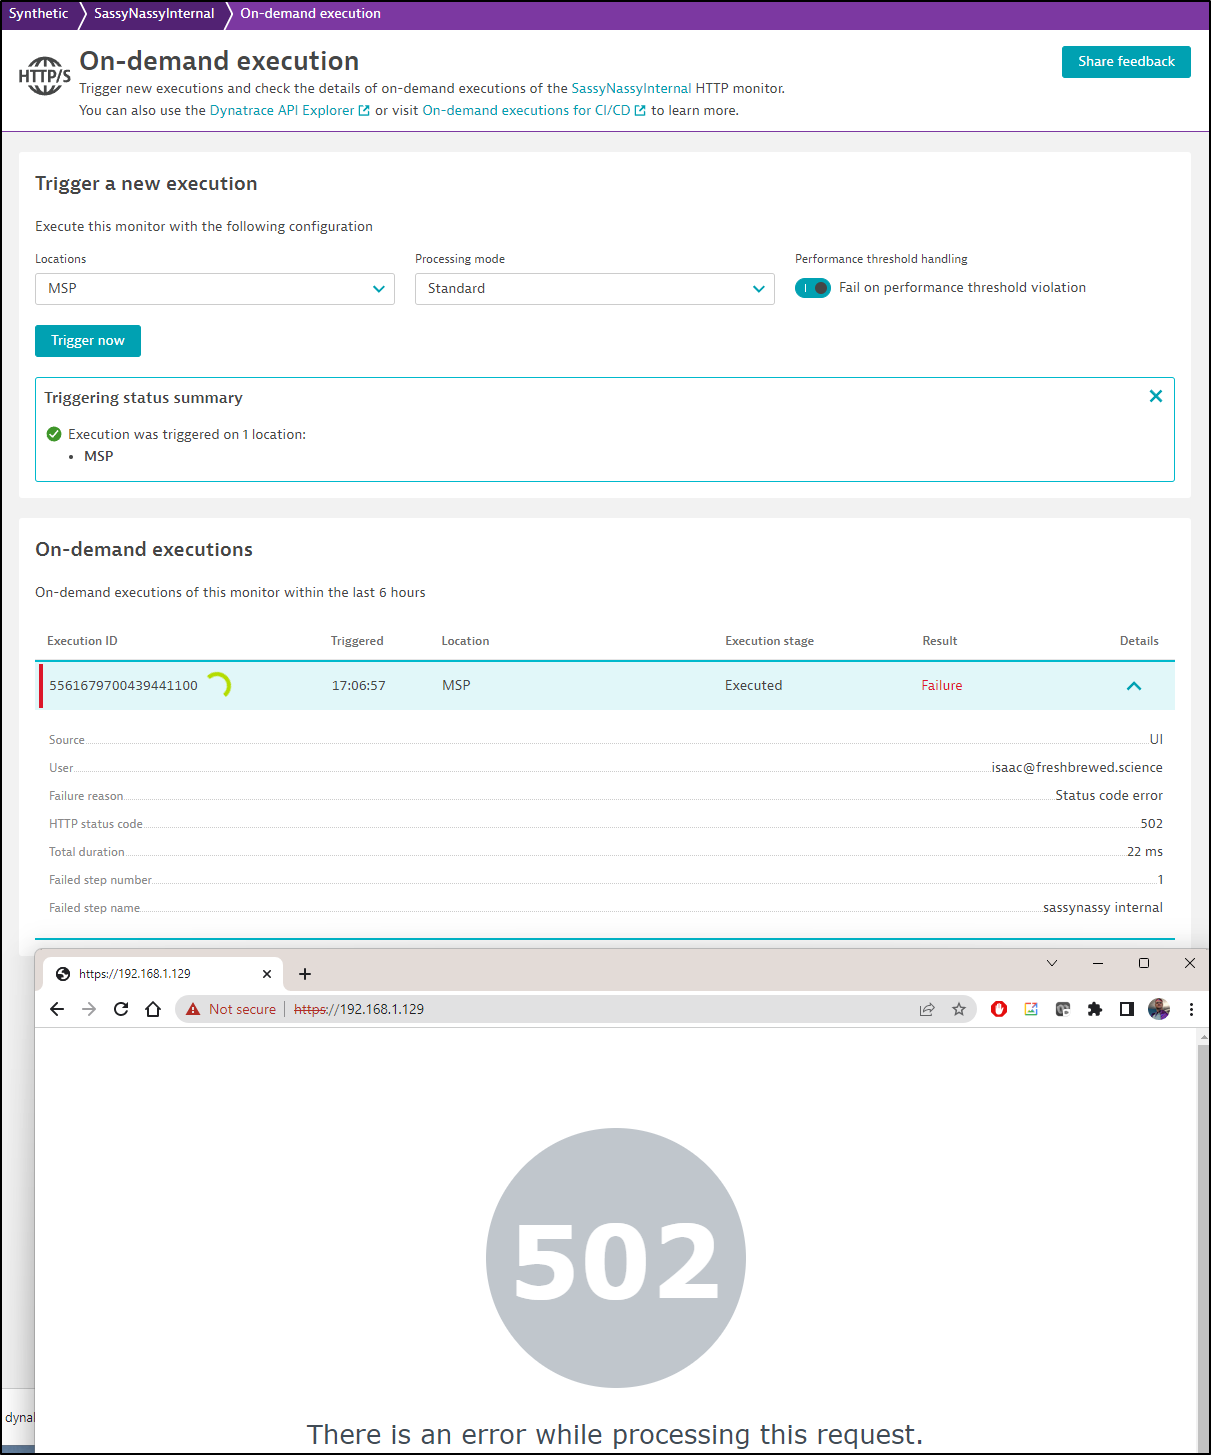
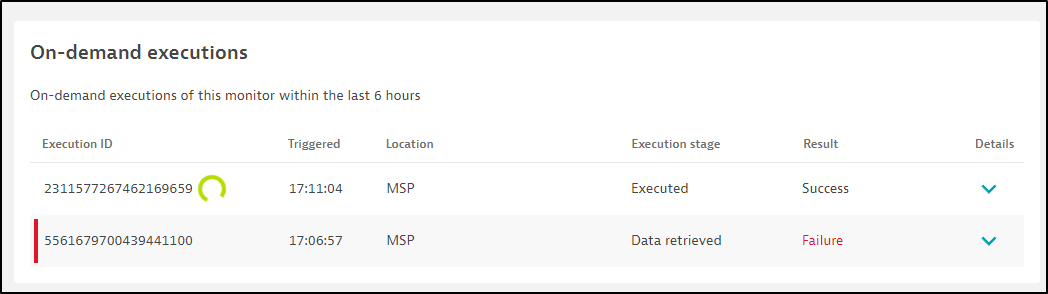
I waited a few minutes but did not see a trigger, so I went to Manual Execution
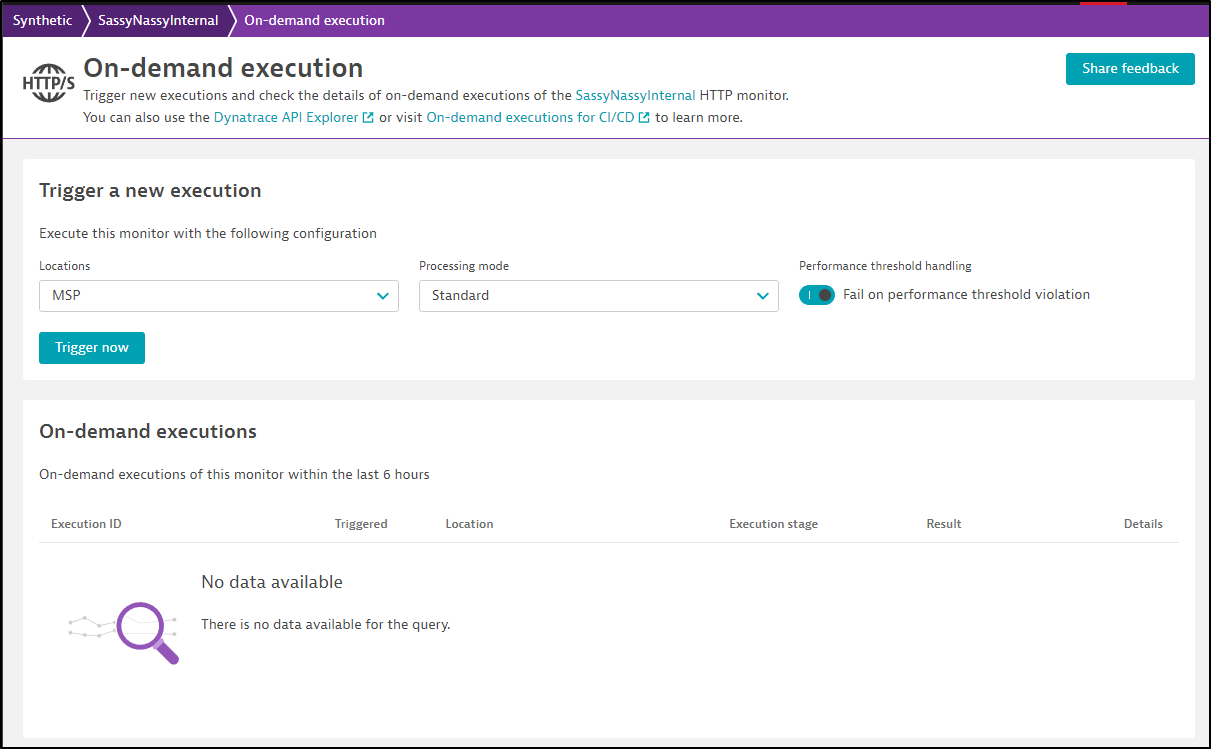
I saw a run kick off
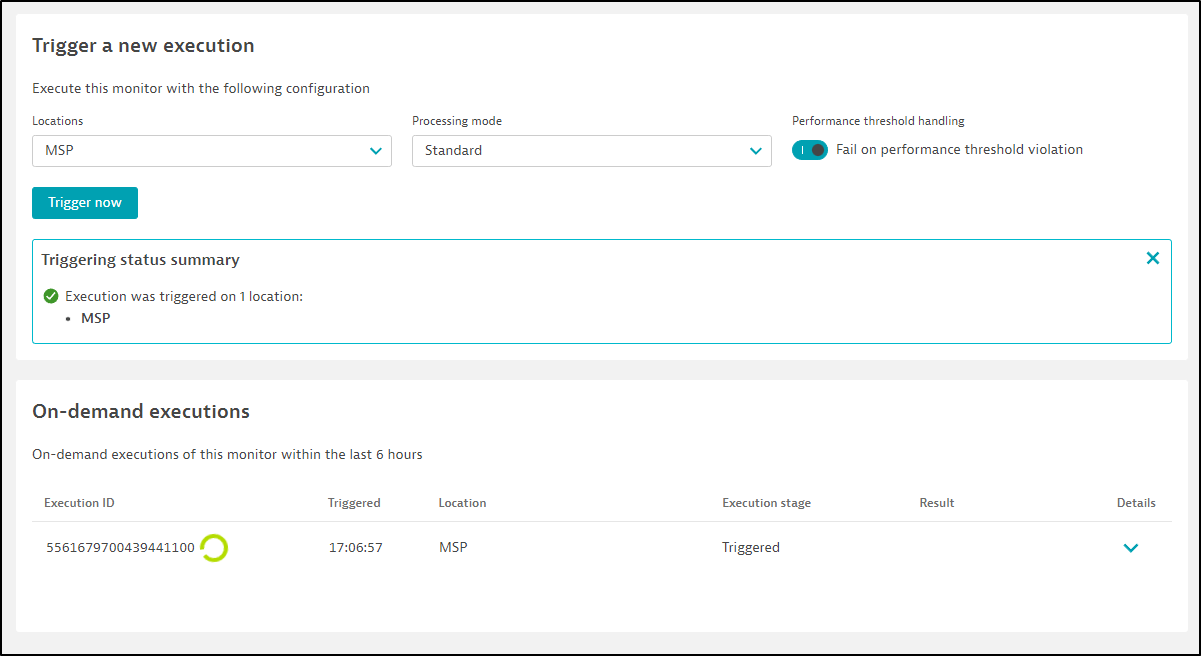
While it does show 502 ERROR, it is what I expected - that I could reach the host and get an error page
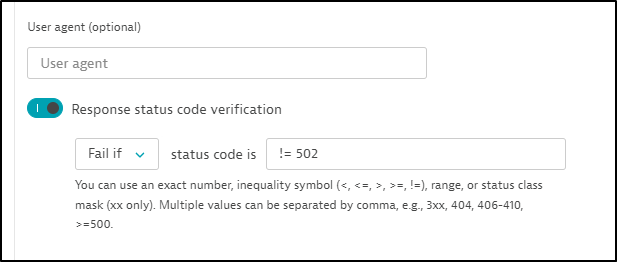
Since I actually want 502 to be the good state, I’ll edit my monitor and go to the fail section of the request
and I’ll change that to != 502
I’ll force a fresh run
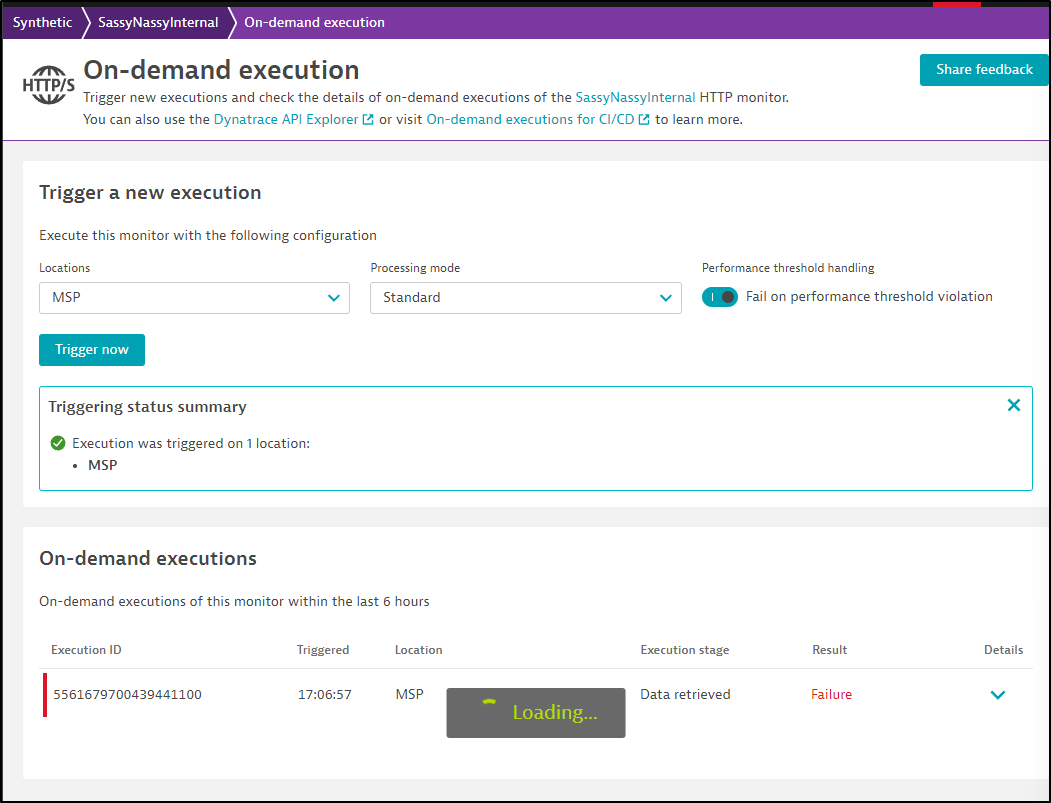
and this time see a success
Hosts
We can see our Hosts under “Infrastructure/Hosts”
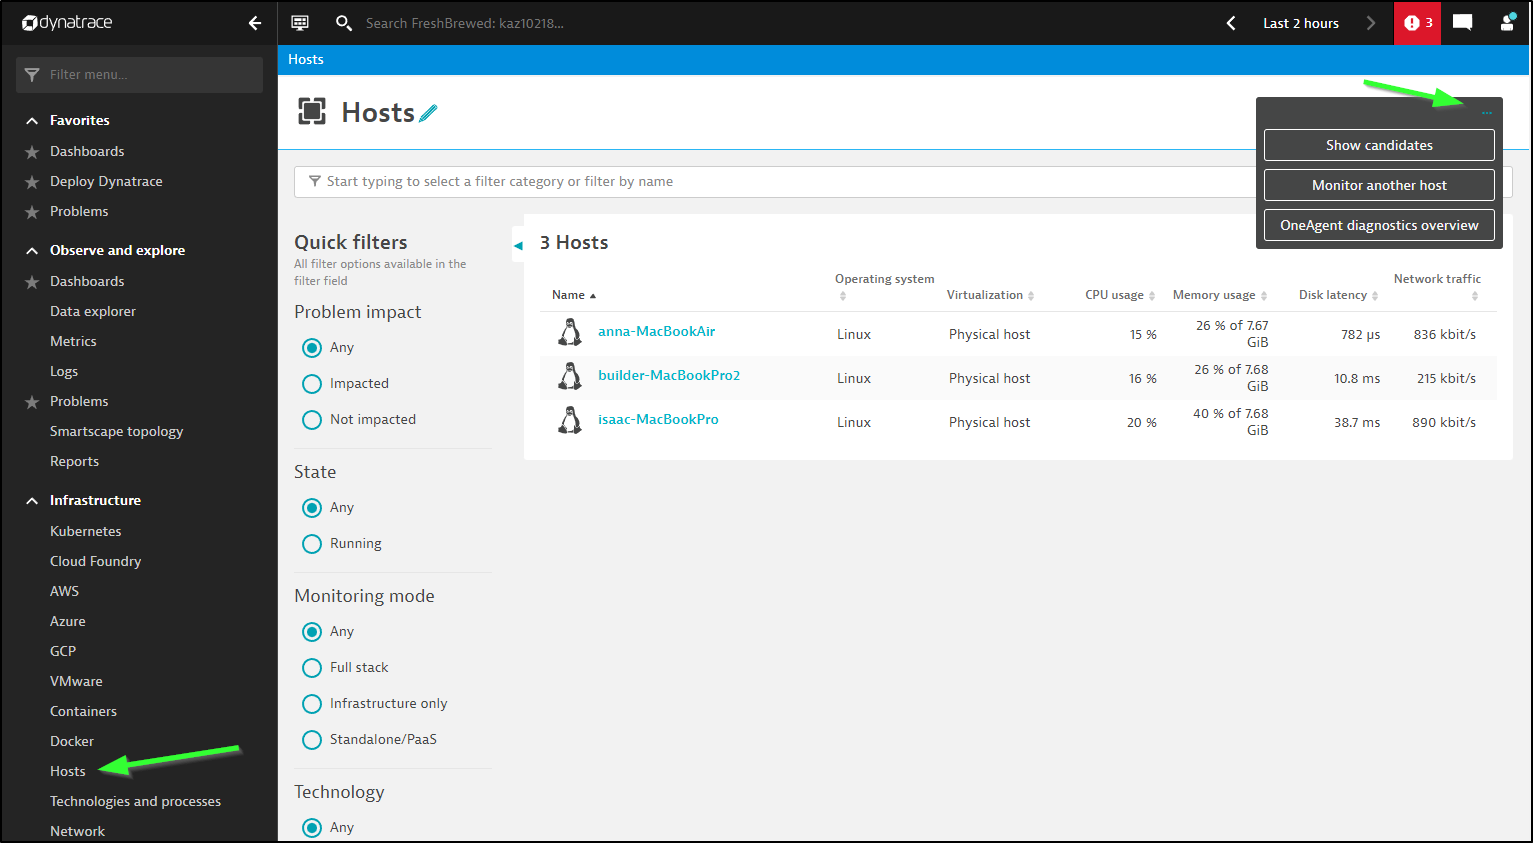
We can use the three dots to “Add Another Host”
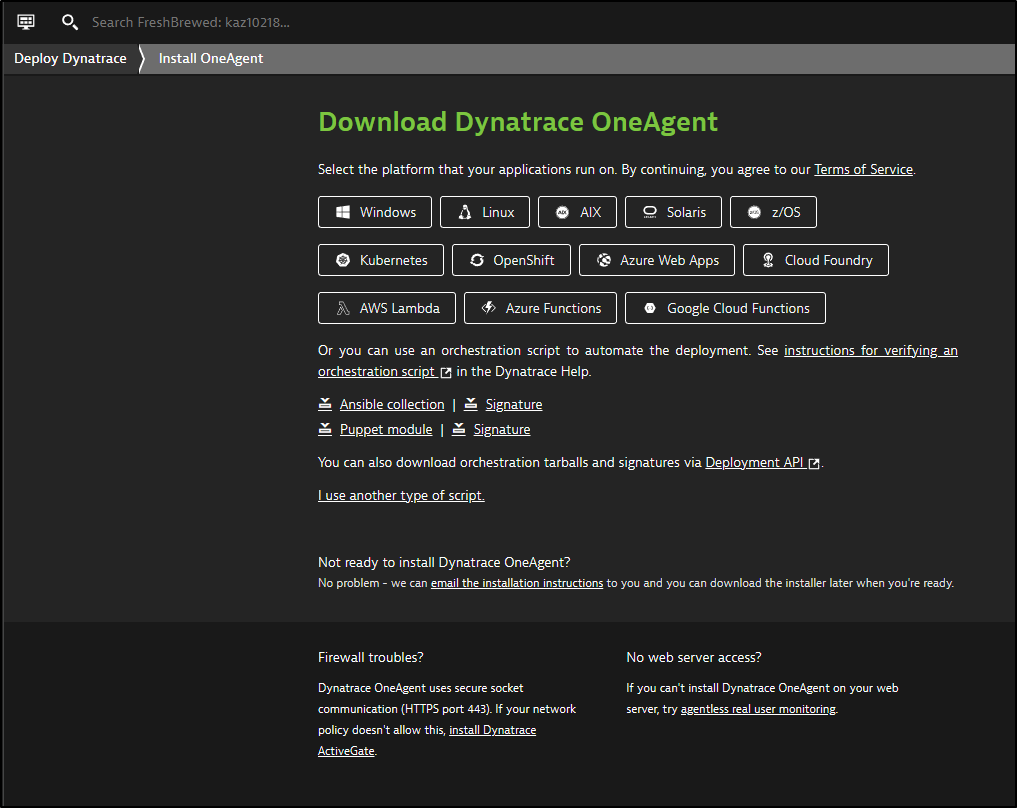
From there, we can pick our OS as well as serverless function framework.
Here I’ll test a Windows box first.
I can create the token in the window (or re-use an existing). Then click Download (or use PowerShell)
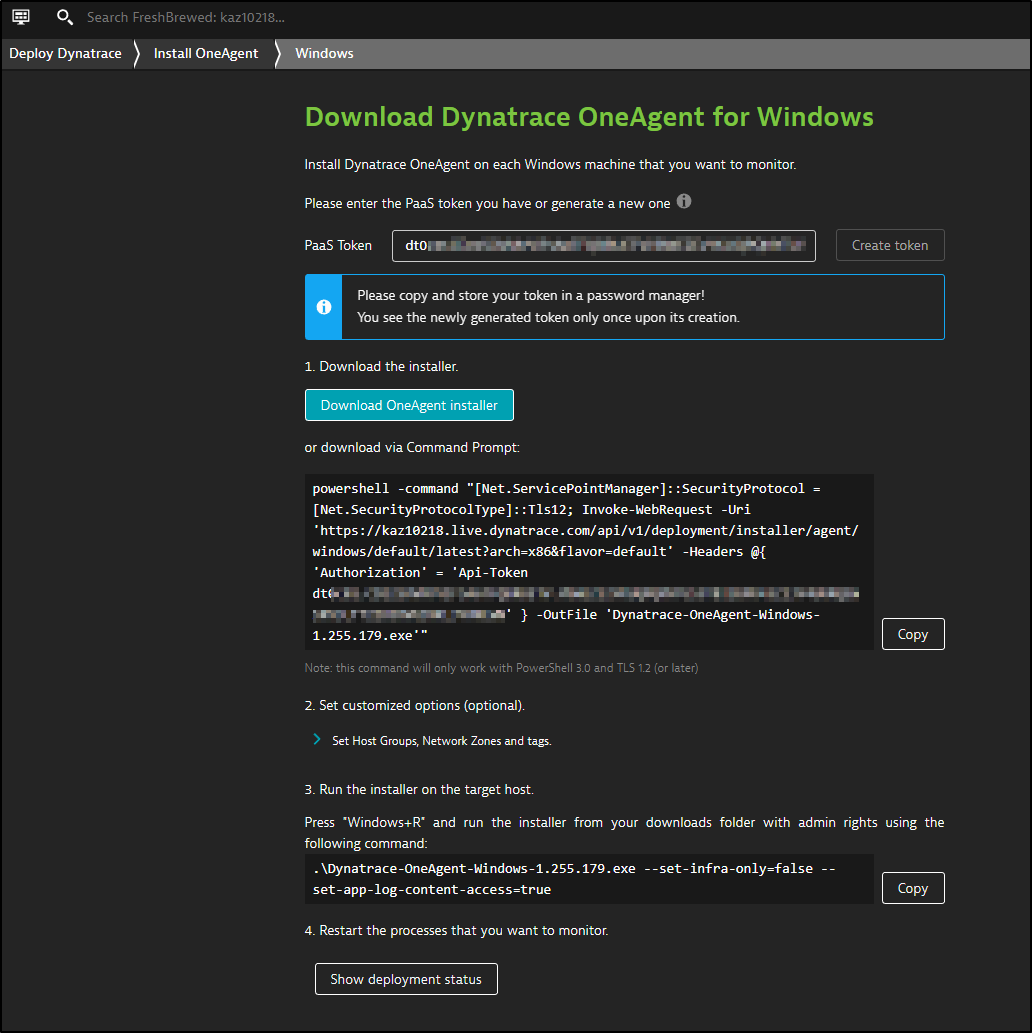
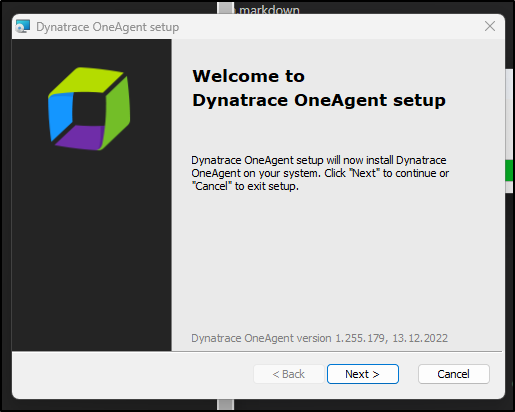
I can then run the installer
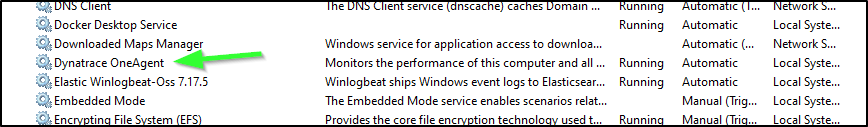
I see it’s already started in Windows services
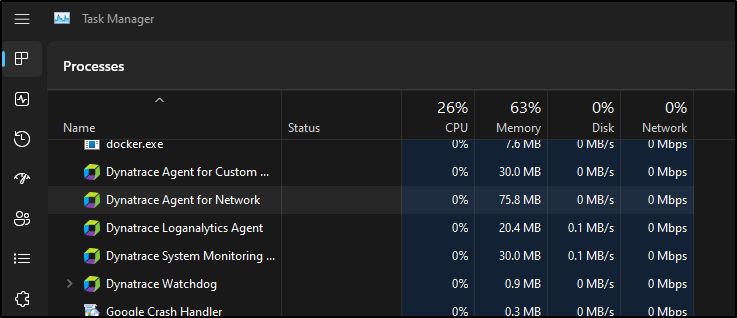
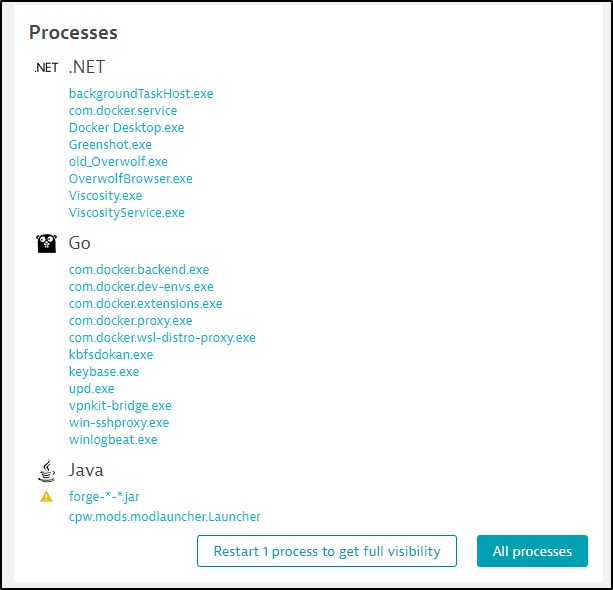
And I can see the list of Dynatrace services in Task manager as well
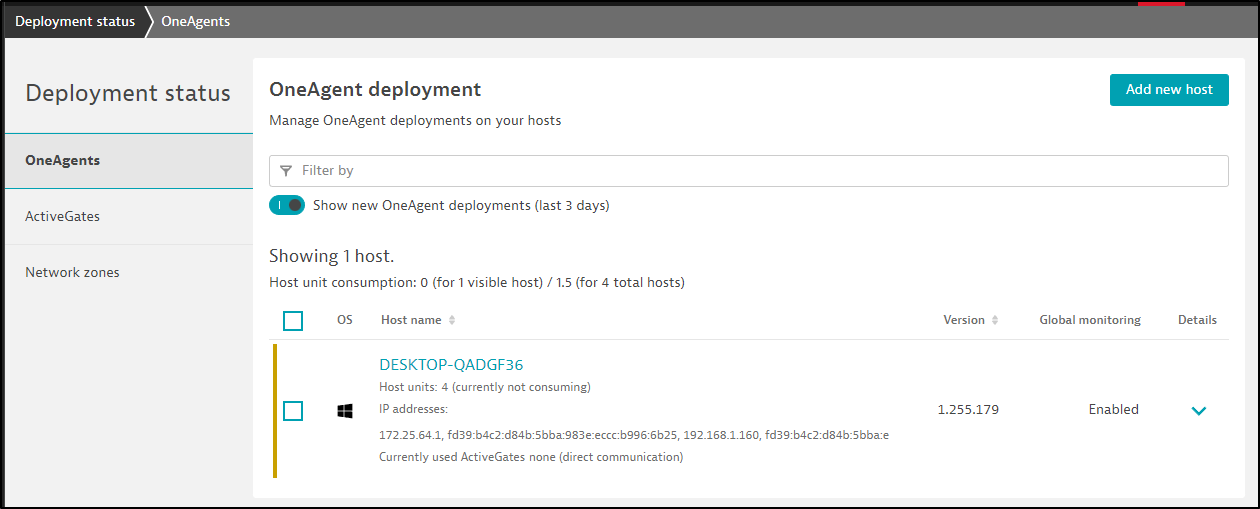
If I click “Show Deployment Status”, we can see our host is now listed
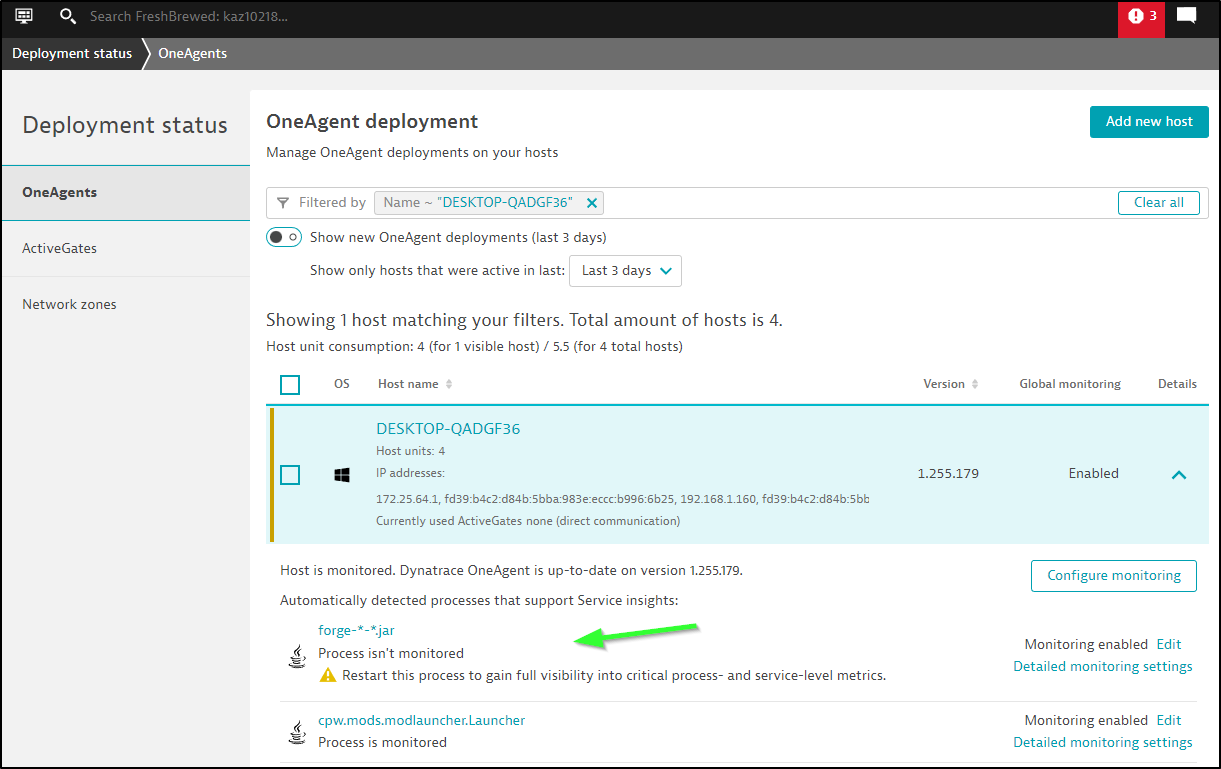
If I expand details, I can see some processes I may wish to monitor.
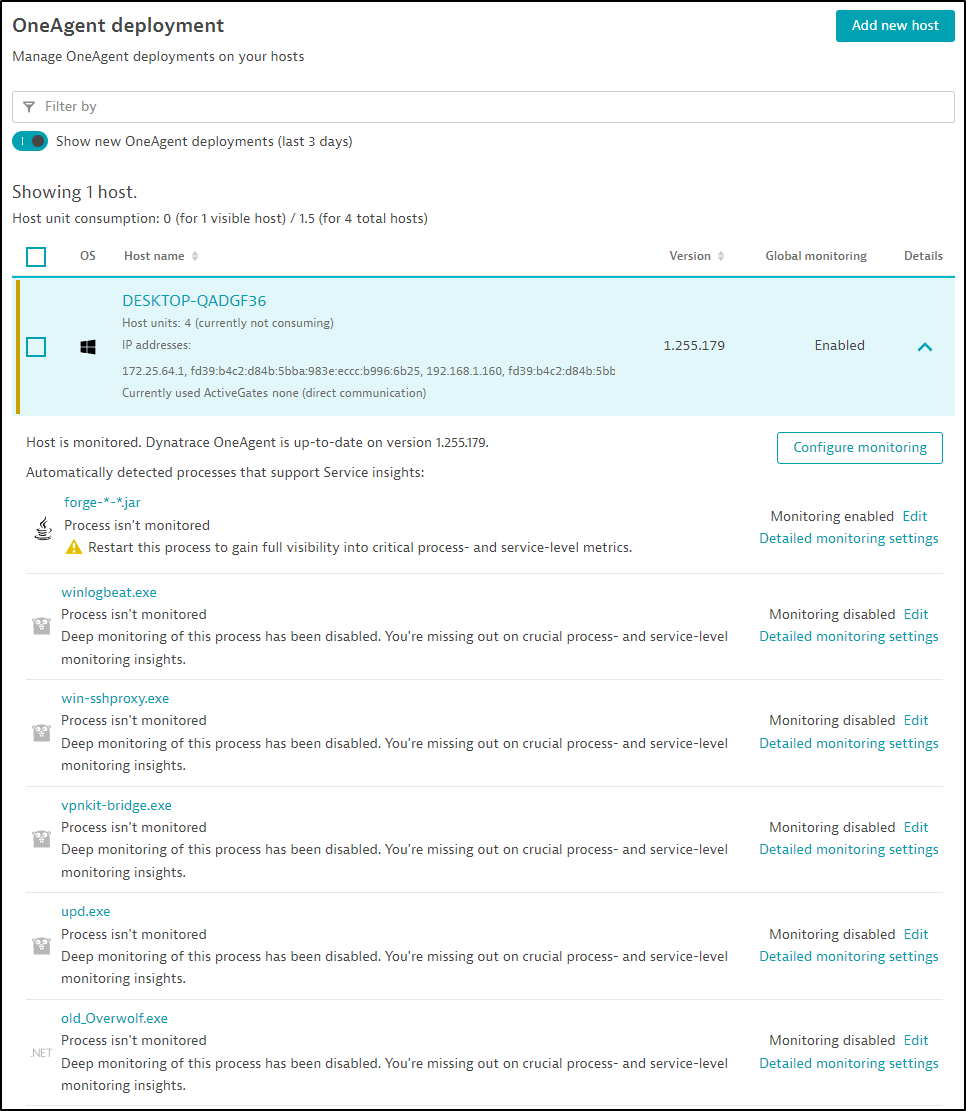
For instance, say I wish to monitor my FTB server. I see it is already monitored, but if I expand the advanced settings
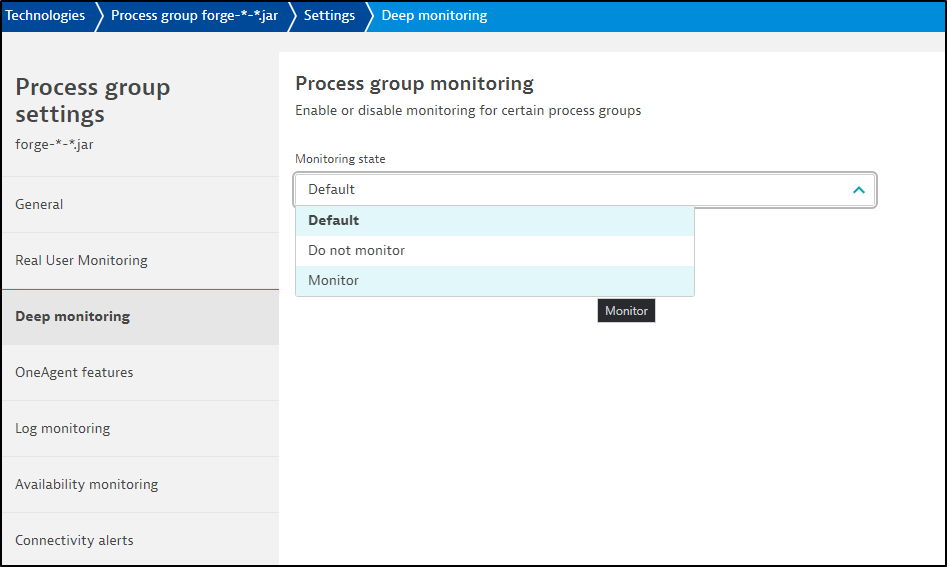
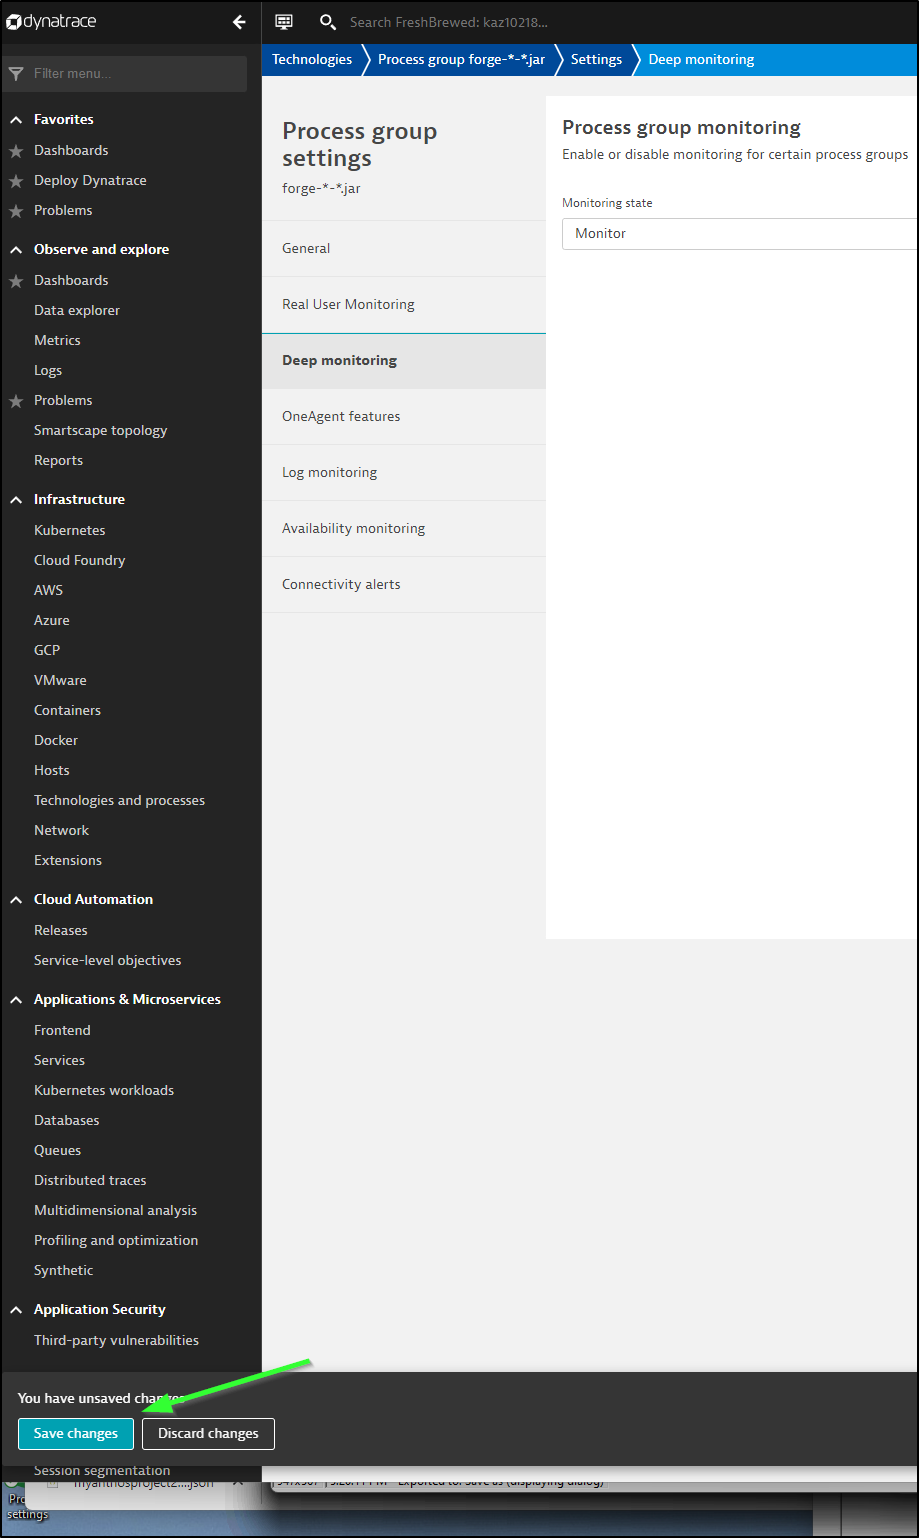
I’ll turn on deep monitoring, then save settings
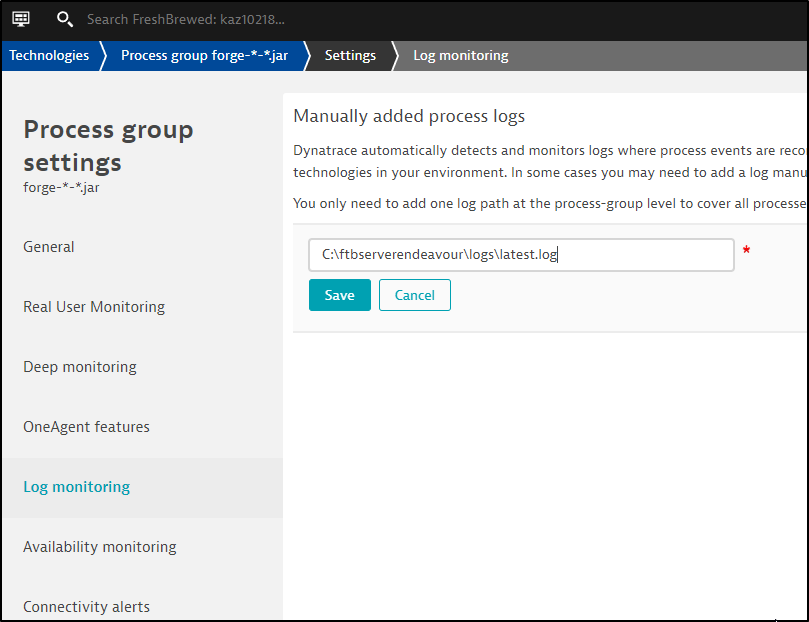
I’ll also ask it to pull in the FTP server logs
I’ll fire up FTB via GDLauncher
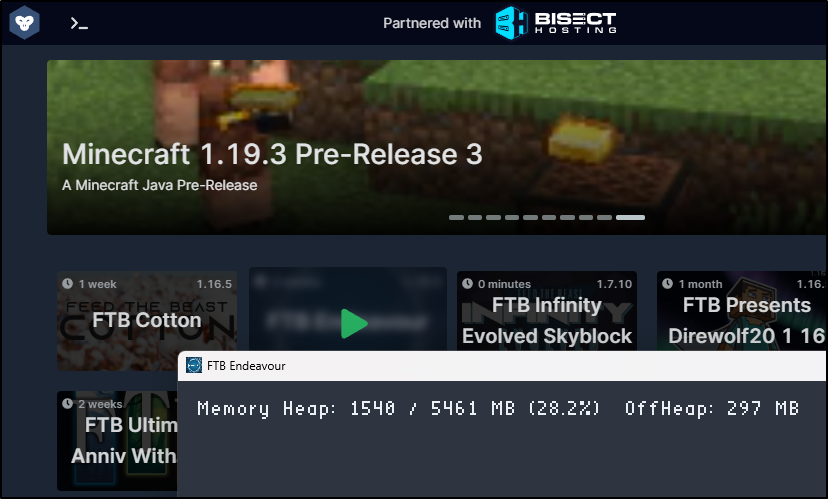
I’m in the game and see I generated a log message
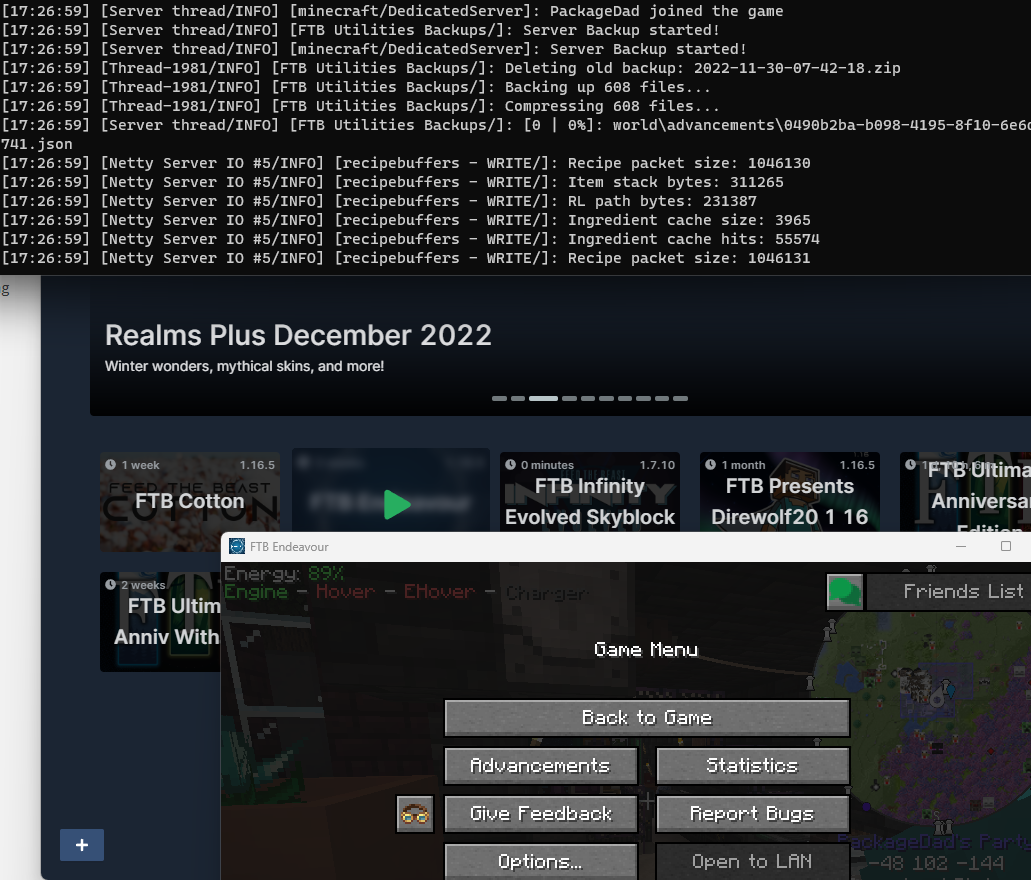
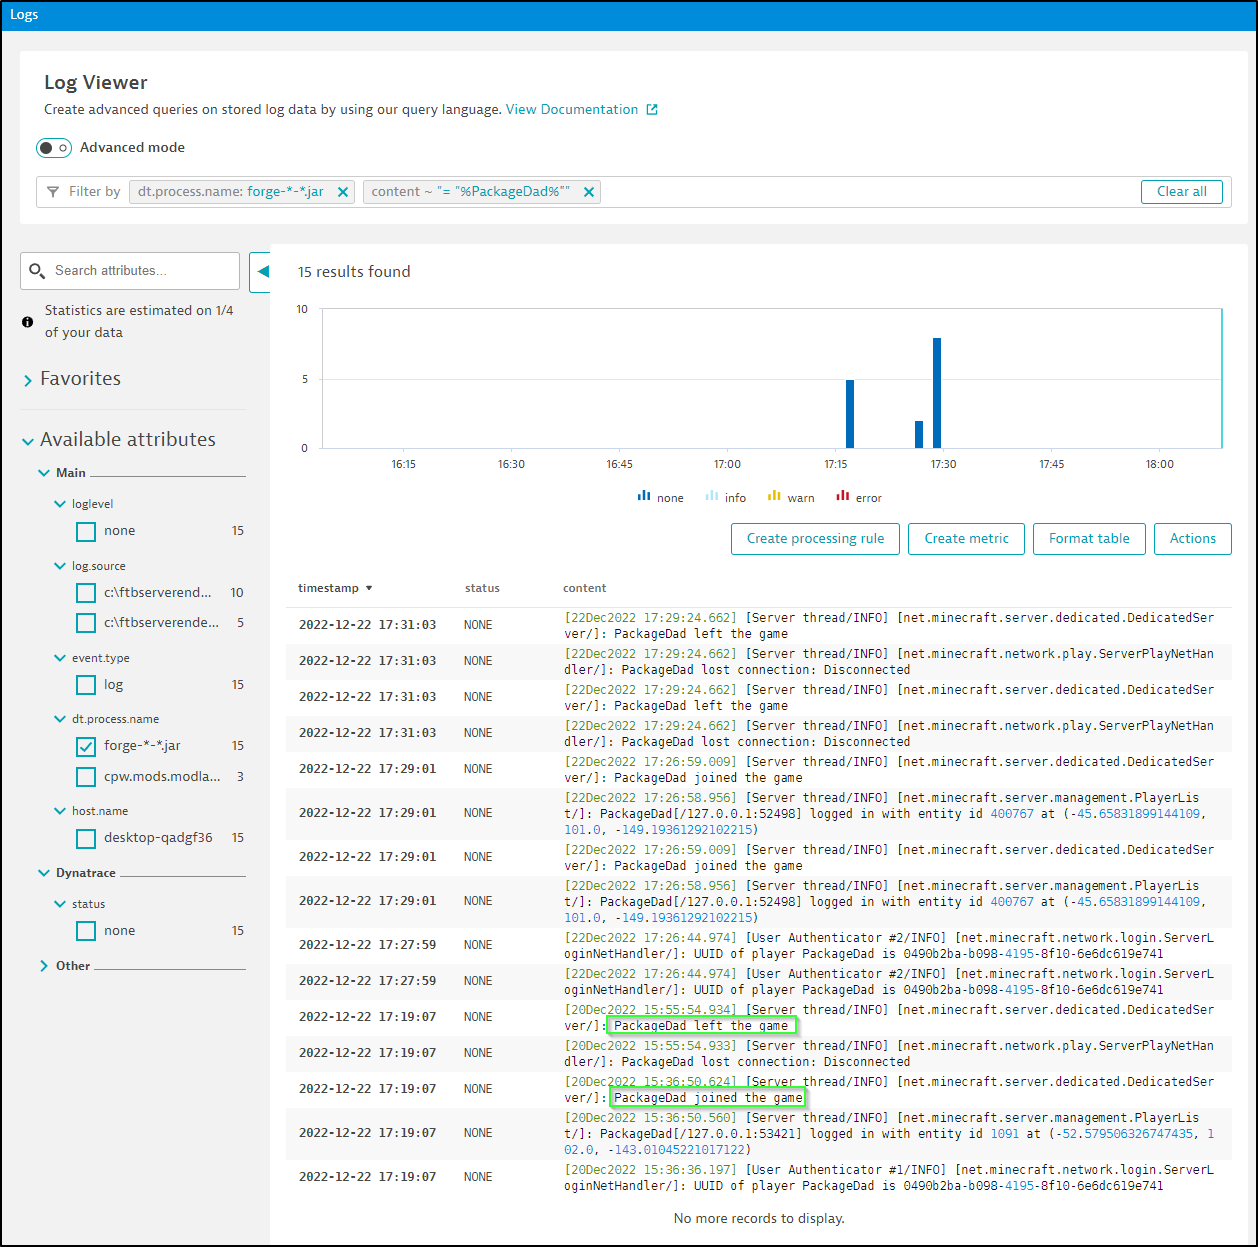
And we can see, indeed, the FTB log was ingested
(I want to point out my handle alludes to nothing risqué; rather my daughters gave me that handle as I get lots of Amazon Packages)
When looking at process, like FTB, we can see more metrics in the “process group”
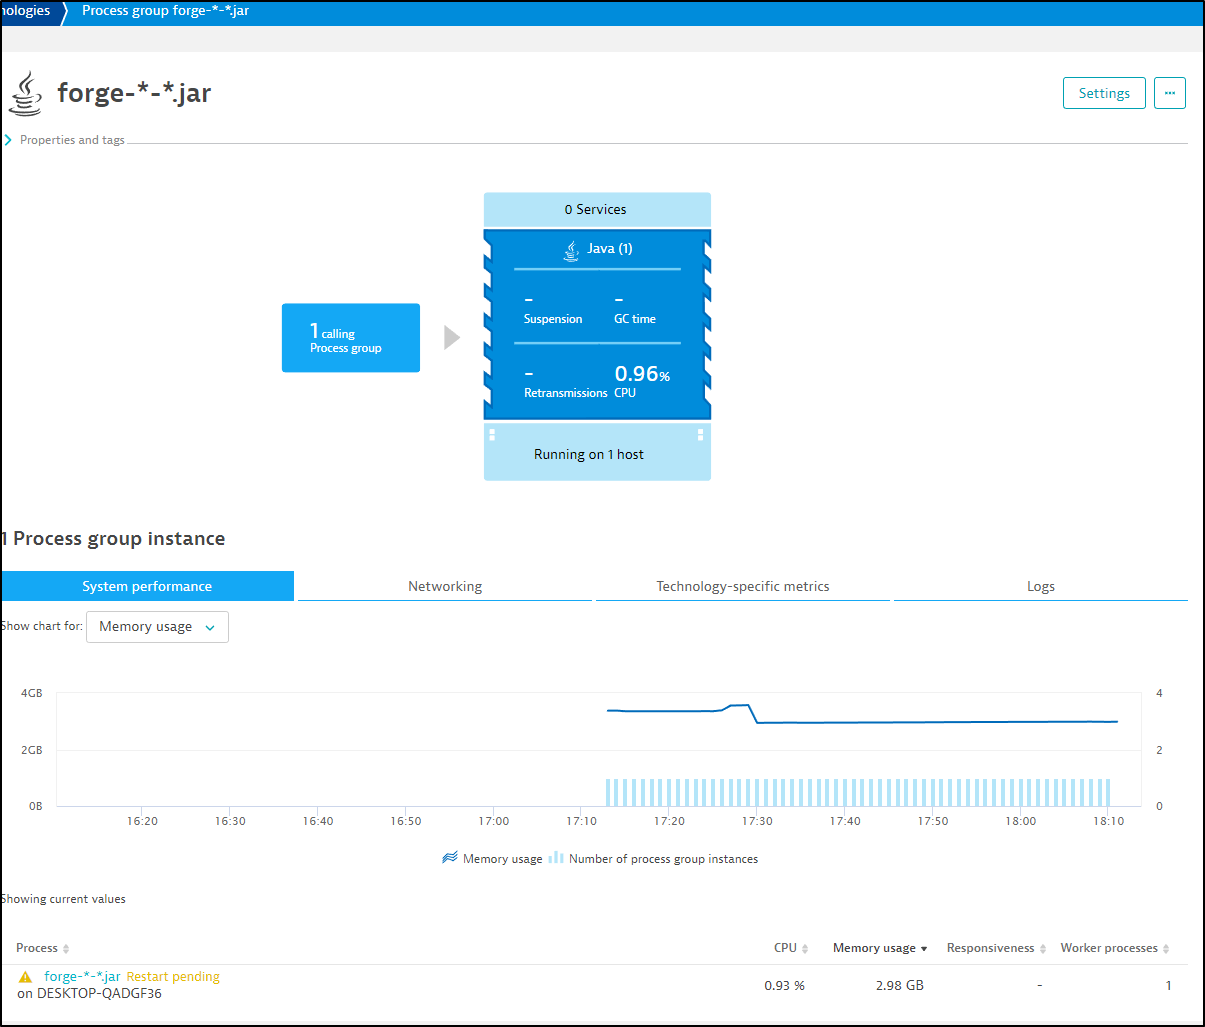
I was prompted to restart a process to get full visibility
It doesn’t say which, but clicking the button brings me to the host where I can expand processes to identify the one to bounce
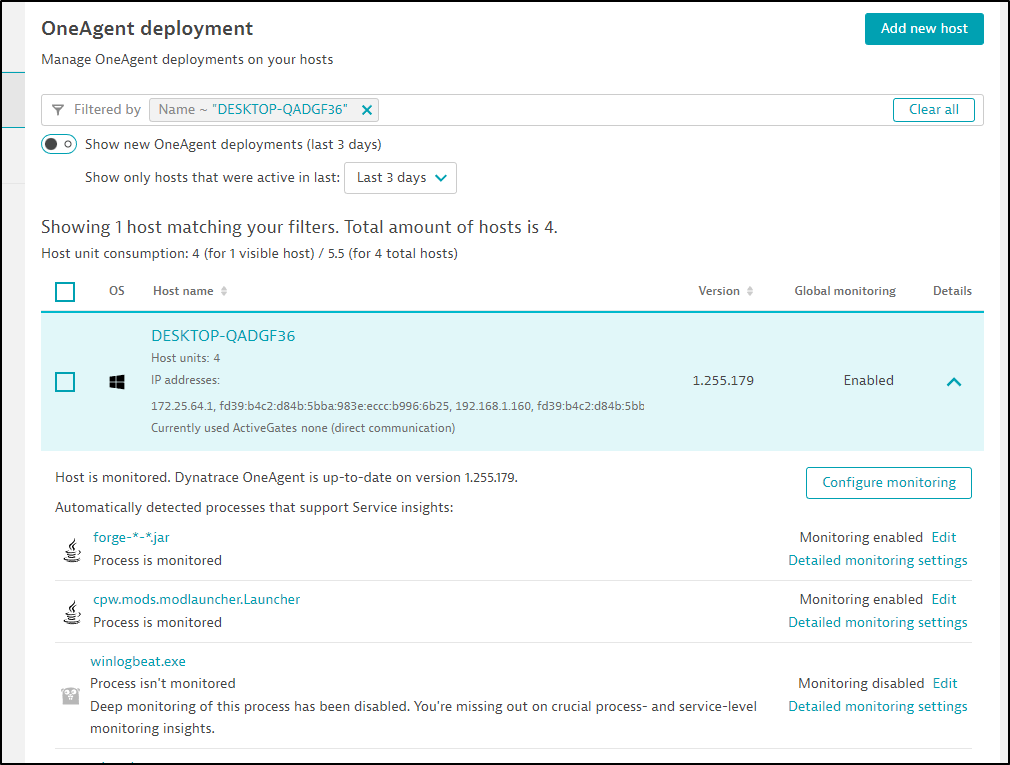
I killed the process and restarted the FTB Endeavor process and now it appears satisfied
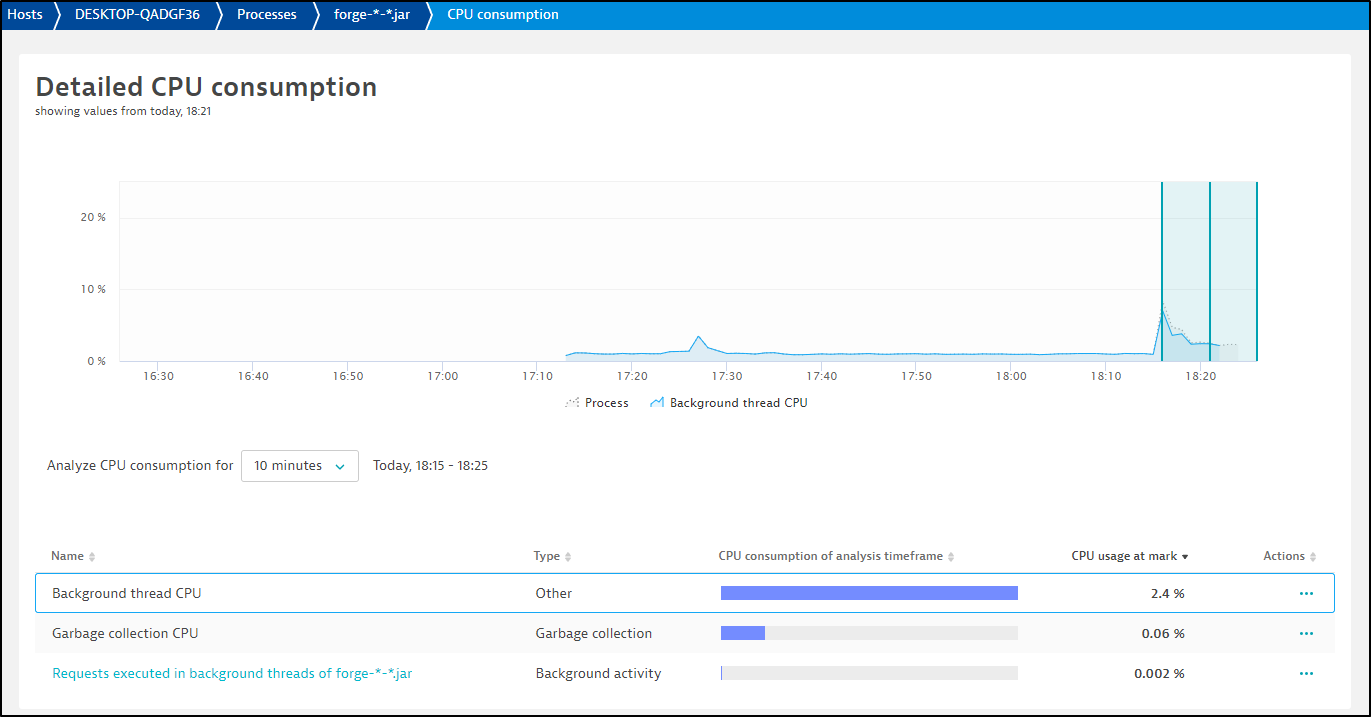
Now when I click the forge jar process, I can see a few more metrics than before
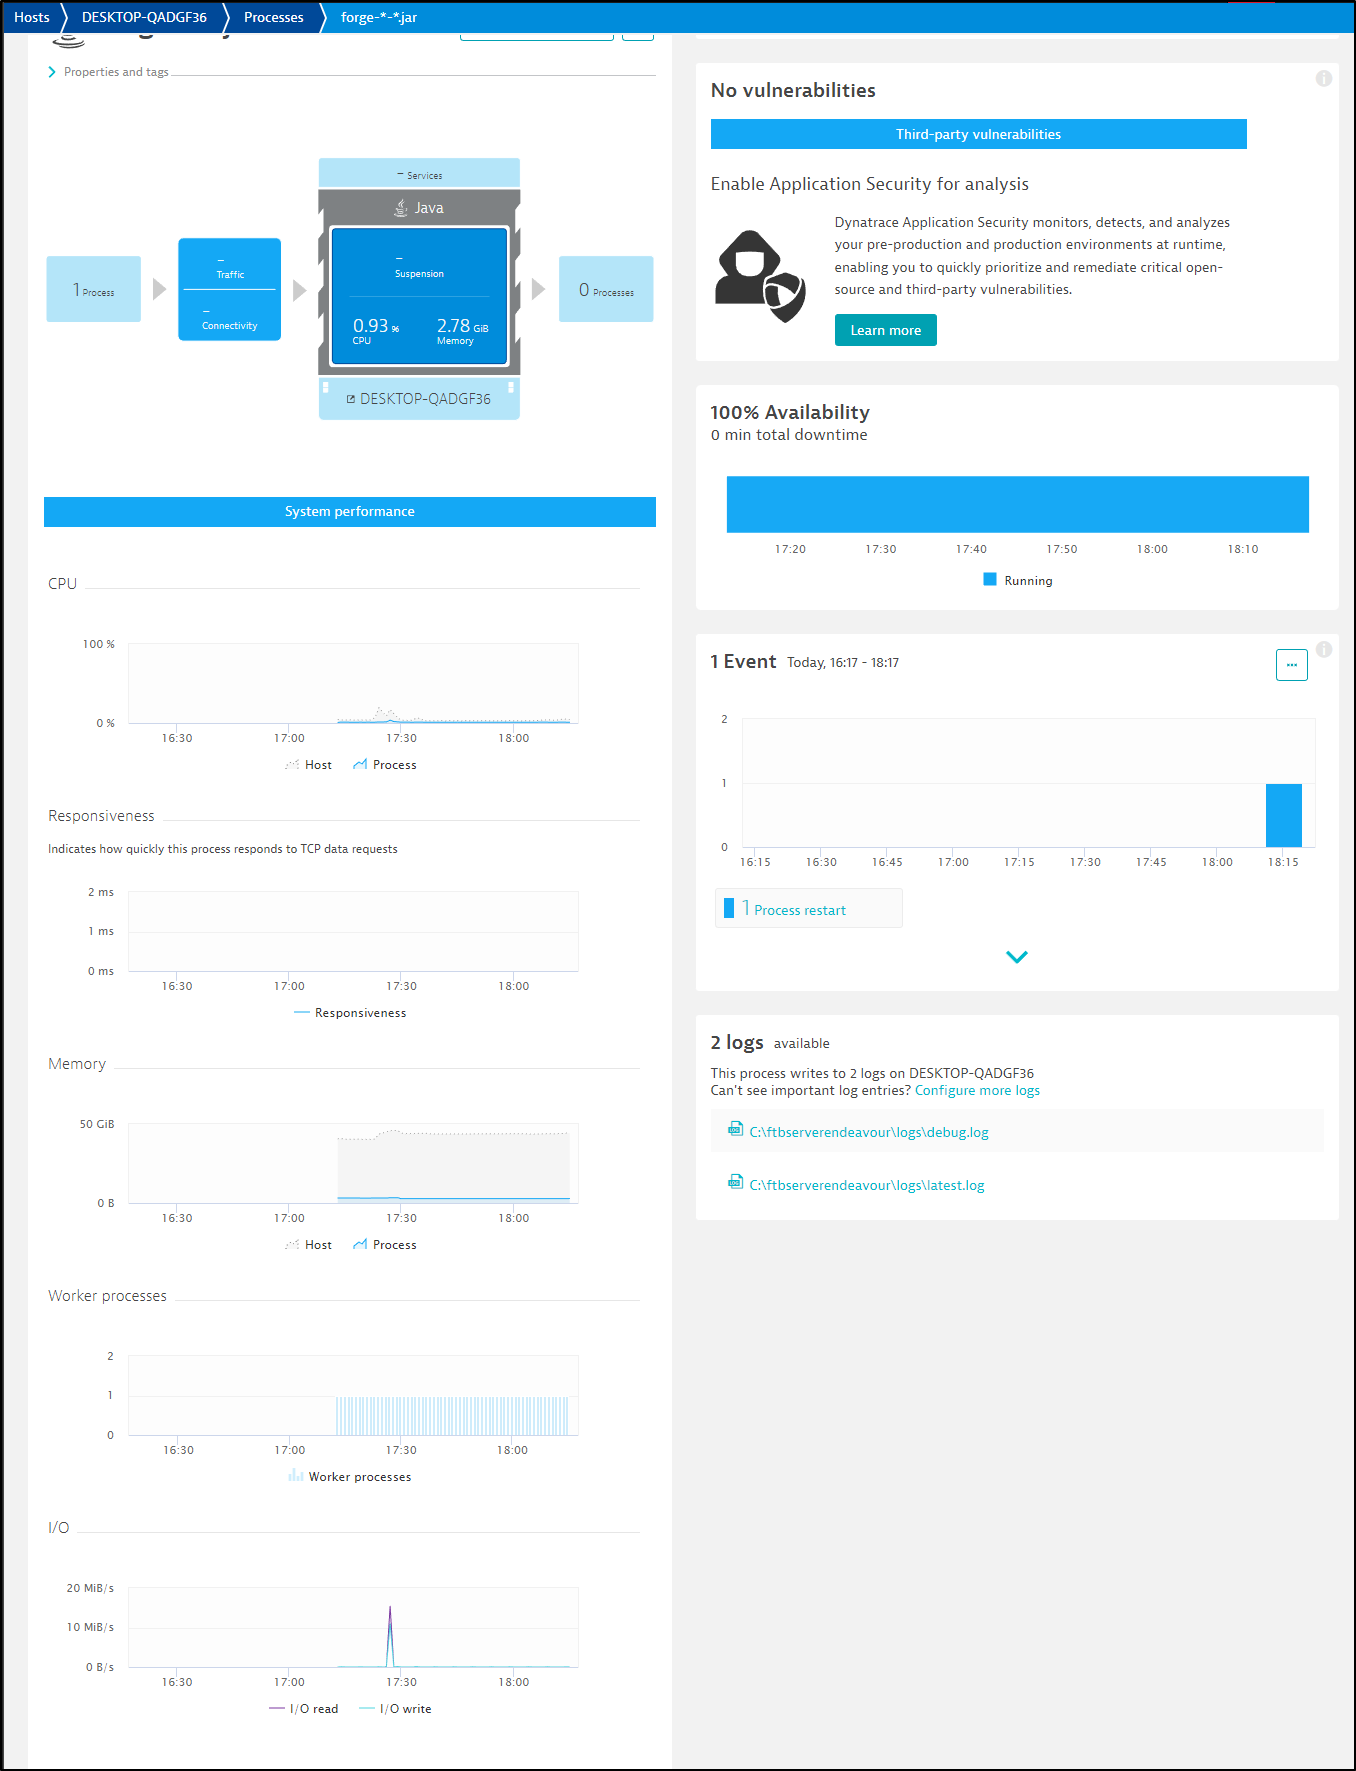
I could see a little CPU spike upon login, but that was about it
Uninstalling
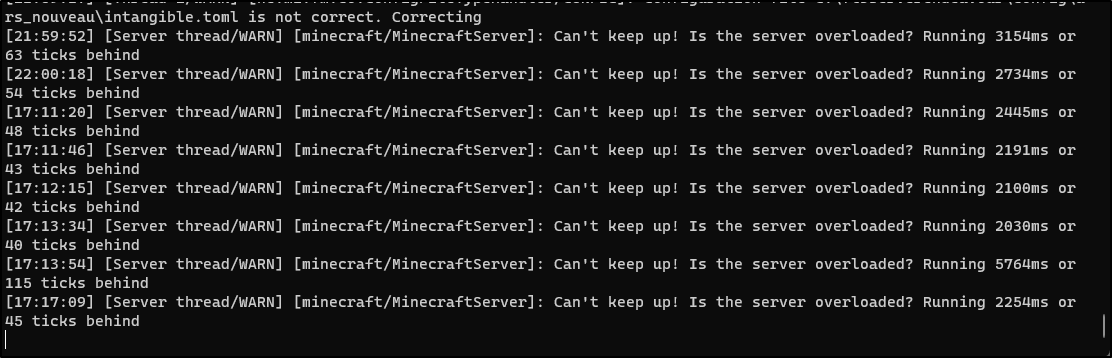
I found some performance issues on my java process for FTB so I decided to uninstall.
In “Control Panel/Add Remove Programs”, you can search for Dynatrace
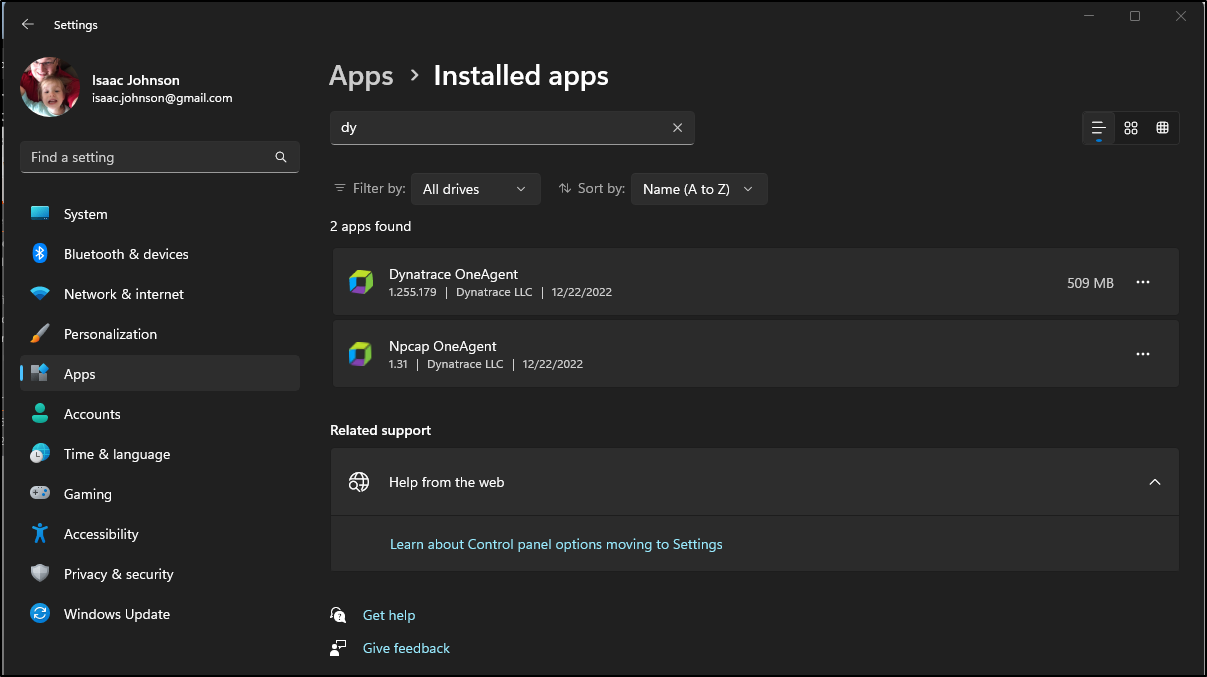
From the three dots, choose uninstall
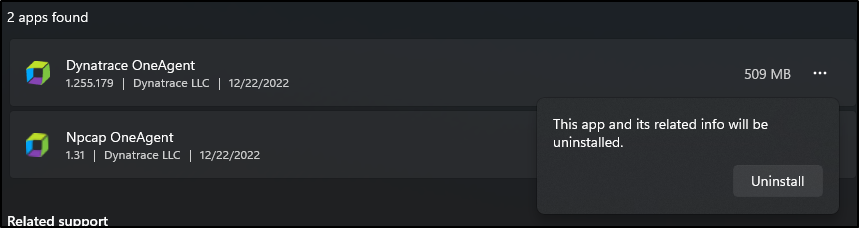
I rebooted and it was properly removed.
Removing from Kubernetes
The other test I wanted to perform this time was to try again on my production cluster.
The last time I did this, I struggled to remove it from my cluster.
I’ll just run the steps in reverse
$ kubectl delete -f /mnt/c/Users/isaac/Downloads/dynakube.yaml
secret "k3smac81" deleted
dynakube.dynatrace.com "k3smac81" deleted

$ kubectl delete -f https://github.com/Dynatrace/dynatrace-operator/releases/download/v0.10.0/kubernetes.yaml
poddisruptionbudget.policy "dynatrace-webhook" deleted
serviceaccount "dynatrace-activegate" deleted
serviceaccount "dynatrace-kubernetes-monitoring" deleted
serviceaccount "dynatrace-dynakube-oneagent-privileged" deleted
serviceaccount "dynatrace-dynakube-oneagent-unprivileged" deleted
serviceaccount "dynatrace-operator" deleted
serviceaccount "dynatrace-webhook" deleted
customresourcedefinition.apiextensions.k8s.io "dynakubes.dynatrace.com" deleted
clusterrole.rbac.authorization.k8s.io "dynatrace-kubernetes-monitoring" deleted
clusterrole.rbac.authorization.k8s.io "dynatrace-operator" deleted
clusterrole.rbac.authorization.k8s.io "dynatrace-webhook" deleted
clusterrolebinding.rbac.authorization.k8s.io "dynatrace-kubernetes-monitoring" deleted
clusterrolebinding.rbac.authorization.k8s.io "dynatrace-operator" deleted
clusterrolebinding.rbac.authorization.k8s.io "dynatrace-webhook" deleted
role.rbac.authorization.k8s.io "dynatrace-operator" deleted
role.rbac.authorization.k8s.io "dynatrace-webhook" deleted
rolebinding.rbac.authorization.k8s.io "dynatrace-operator" deleted
rolebinding.rbac.authorization.k8s.io "dynatrace-webhook" deleted
service "dynatrace-webhook" deleted
deployment.apps "dynatrace-operator" deleted

$ kubectl delete -f https://github.com/Dynatrace/dynatrace-operator/releases/download/v0.10.0/kubernetes.yaml
Error from server (NotFound): error when deleting "https://github.com/Dynatrace/dynatrace-operator/releases/download/v0.10.0/kubernetes.yaml": poddisruptionbudgets.policy "dynatrace-webhook" not found
Error from server (NotFound): error when deleting "https://github.com/Dynatrace/dynatrace-operator/releases/download/v0.10.0/kubernetes.yaml": serviceaccounts "dynatrace-activegate" not found
Error from server (NotFound): error when deleting "https://github.com/Dynatrace/dynatrace-operator/releases/download/v0.10.0/kubernetes.yaml": serviceaccounts "dynatrace-kubernetes-monitoring" not found
Error from server (NotFound): error when deleting "https://github.com/Dynatrace/dynatrace-operator/releases/download/v0.10.0/kubernetes.yaml": serviceaccounts "dynatrace-dynakube-oneagent-privileged" not found
Error from server (NotFound): error when deleting "https://github.com/Dynatrace/dynatrace-operator/releases/download/v0.10.0/kubernetes.yaml": serviceaccounts "dynatrace-dynakube-oneagent-unprivileged" not found
Error from server (NotFound): error when deleting "https://github.com/Dynatrace/dynatrace-operator/releases/download/v0.10.0/kubernetes.yaml": serviceaccounts "dynatrace-operator" not found
Error from server (NotFound): error when deleting "https://github.com/Dynatrace/dynatrace-operator/releases/download/v0.10.0/kubernetes.yaml": serviceaccounts "dynatrace-webhook" not found
Error from server (NotFound): error when deleting "https://github.com/Dynatrace/dynatrace-operator/releases/download/v0.10.0/kubernetes.yaml": customresourcedefinitions.apiextensions.k8s.io "dynakubes.dynatrace.com" not found
Error from server (NotFound): error when deleting "https://github.com/Dynatrace/dynatrace-operator/releases/download/v0.10.0/kubernetes.yaml": clusterroles.rbac.authorization.k8s.io "dynatrace-kubernetes-monitoring" not found
Error from server (NotFound): error when deleting "https://github.com/Dynatrace/dynatrace-operator/releases/download/v0.10.0/kubernetes.yaml": clusterroles.rbac.authorization.k8s.io "dynatrace-operator" not found
Error from server (NotFound): error when deleting "https://github.com/Dynatrace/dynatrace-operator/releases/download/v0.10.0/kubernetes.yaml": clusterroles.rbac.authorization.k8s.io "dynatrace-webhook" not found
Error from server (NotFound): error when deleting "https://github.com/Dynatrace/dynatrace-operator/releases/download/v0.10.0/kubernetes.yaml": clusterrolebindings.rbac.authorization.k8s.io "dynatrace-kubernetes-monitoring" not found
Error from server (NotFound): error when deleting "https://github.com/Dynatrace/dynatrace-operator/releases/download/v0.10.0/kubernetes.yaml": clusterrolebindings.rbac.authorization.k8s.io "dynatrace-operator" not found
Error from server (NotFound): error when deleting "https://github.com/Dynatrace/dynatrace-operator/releases/download/v0.10.0/kubernetes.yaml": clusterrolebindings.rbac.authorization.k8s.io "dynatrace-webhook" not found
Error from server (NotFound): error when deleting "https://github.com/Dynatrace/dynatrace-operator/releases/download/v0.10.0/kubernetes.yaml": roles.rbac.authorization.k8s.io "dynatrace-operator" not found
Error from server (NotFound): error when deleting "https://github.com/Dynatrace/dynatrace-operator/releases/download/v0.10.0/kubernetes.yaml": roles.rbac.authorization.k8s.io "dynatrace-webhook" not found
Error from server (NotFound): error when deleting "https://github.com/Dynatrace/dynatrace-operator/releases/download/v0.10.0/kubernetes.yaml": rolebindings.rbac.authorization.k8s.io "dynatrace-operator" not found
Error from server (NotFound): error when deleting "https://github.com/Dynatrace/dynatrace-operator/releases/download/v0.10.0/kubernetes.yaml": rolebindings.rbac.authorization.k8s.io "dynatrace-webhook" not found
Error from server (NotFound): error when deleting "https://github.com/Dynatrace/dynatrace-operator/releases/download/v0.10.0/kubernetes.yaml": services "dynatrace-webhook" not found
Error from server (NotFound): error when deleting "https://github.com/Dynatrace/dynatrace-operator/releases/download/v0.10.0/kubernetes.yaml": deployments.apps "dynatrace-operator" not found
Error from server (NotFound): error when deleting "https://github.com/Dynatrace/dynatrace-operator/releases/download/v0.10.0/kubernetes.yaml": deployments.apps "dynatrace-webhook" not found
Error from server (NotFound): error when deleting "https://github.com/Dynatrace/dynatrace-operator/releases/download/v0.10.0/kubernetes.yaml": mutatingwebhookconfigurations.admissionregistration.k8s.io "dynatrace-webhook" not found
Error from server (NotFound): error when deleting "https://github.com/Dynatrace/dynatrace-operator/releases/download/v0.10.0/kubernetes.yaml": validatingwebhookconfigurations.admissionregistration.k8s.io "dynatrace-webhook" not found

$ kubectl delete ns dynatrace
namespace "dynatrace" deleted
If you lost that first file, the content is basically
$ cat /mnt/c/Users/isaac/Downloads/dynakube.yaml
apiVersion: v1
data:
  apiToken: xxxxxx
  dataIngestToken: xxxxxx
kind: Secret
metadata:
  name: k3smac81
  namespace: dynatrace
type: Opaque
---
apiVersion: dynatrace.com/v1beta1
kind: DynaKube
metadata:
  name: k3smac81
  namespace: dynatrace
  annotations:
    feature.dynatrace.com/automatic-kubernetes-api-monitoring: "true"
spec:
  ...
We should just ensure we can deploy new content
$ helm repo add azure-samples https://azure-samples.github.io/helm-charts/
"azure-samples" already exists with the same configuration, skipping

$ helm repo update
Hang tight while we grab the latest from your chart repositories...
...Successfully got an update from the "longhorn" chart repository
...Successfully got an update from the "kuma" chart repository
...Successfully got an update from the "adwerx" chart repository
...Successfully got an update from the "azure-samples" chart repository
...Successfully got an update from the "novum-rgi-helm" chart repository
...Successfully got an update from the "uptime-kuma" chart repository
...Successfully got an update from the "confluentinc" chart repository
...Successfully got an update from the "actions-runner-controller" chart repository
...Successfully got an update from the "rhcharts" chart repository
...Successfully got an update from the "sonarqube" chart repository
...Successfully got an update from the "dapr" chart repository
...Successfully got an update from the "hashicorp" chart repository
...Successfully got an update from the "epsagon" chart repository
...Successfully got an update from the "nginx-stable" chart repository
...Successfully got an update from the "open-telemetry" chart repository
...Successfully got an update from the "kubecost" chart repository
...Successfully got an update from the "sumologic" chart repository
...Successfully got an update from the "myharbor" chart repository
...Successfully got an update from the "lifen-charts" chart repository
...Successfully got an update from the "datadog" chart repository
...Successfully got an update from the "rook-release" chart repository
...Successfully got an update from the "harbor" chart repository
...Successfully got an update from the "argo-cd" chart repository
...Successfully got an update from the "rancher-latest" chart repository
...Successfully got an update from the "crossplane-stable" chart repository
...Successfully got an update from the "incubator" chart repository
...Successfully got an update from the "newrelic" chart repository
...Successfully got an update from the "gitlab" chart repository
...Successfully got an update from the "bitnami" chart repository
Update Complete. ⎈Happy Helming!⎈

$ helm install azure-samples/azure-vote --generate-name
NAME: azure-vote-1672065561
LAST DEPLOYED: Mon Dec 26 08:39:21 2022
NAMESPACE: default
STATUS: deployed
REVISION: 1
TEST SUITE: None
NOTES:
The Azure Vote application has been started on your Kubernetes cluster.

Title: Azure Vote App
Vote 1 value: Cats
Vote 2 value: Dogs

The externally accessible IP address can take a minute or so to provision. Run the following command to monitor the provisioning status. Once an External IP address has been provisioned, brows to this IP address to access the Azure Vote application.

kubectl get service -l name=azure-vote-front -w
We can see they launched fine
$ kubectl get pods | grep vote
vote-back-azure-vote-1672065561-7667b49cf6-wqdm7    1/1     Running   0          4m37s
vote-front-azure-vote-1672065561-6b4f7dcb7d-xf6vd   1/1     Running   0          4m37s
OneAgent in Kubernetes
One thing I continue to find amazing is how it can find and gather details automatically in Kubernetes.
For instance, just running the deployment of last week’s blog process, I could see OneAgent find and gather metrics on the Jekyll workload via the Github runners in my cluster
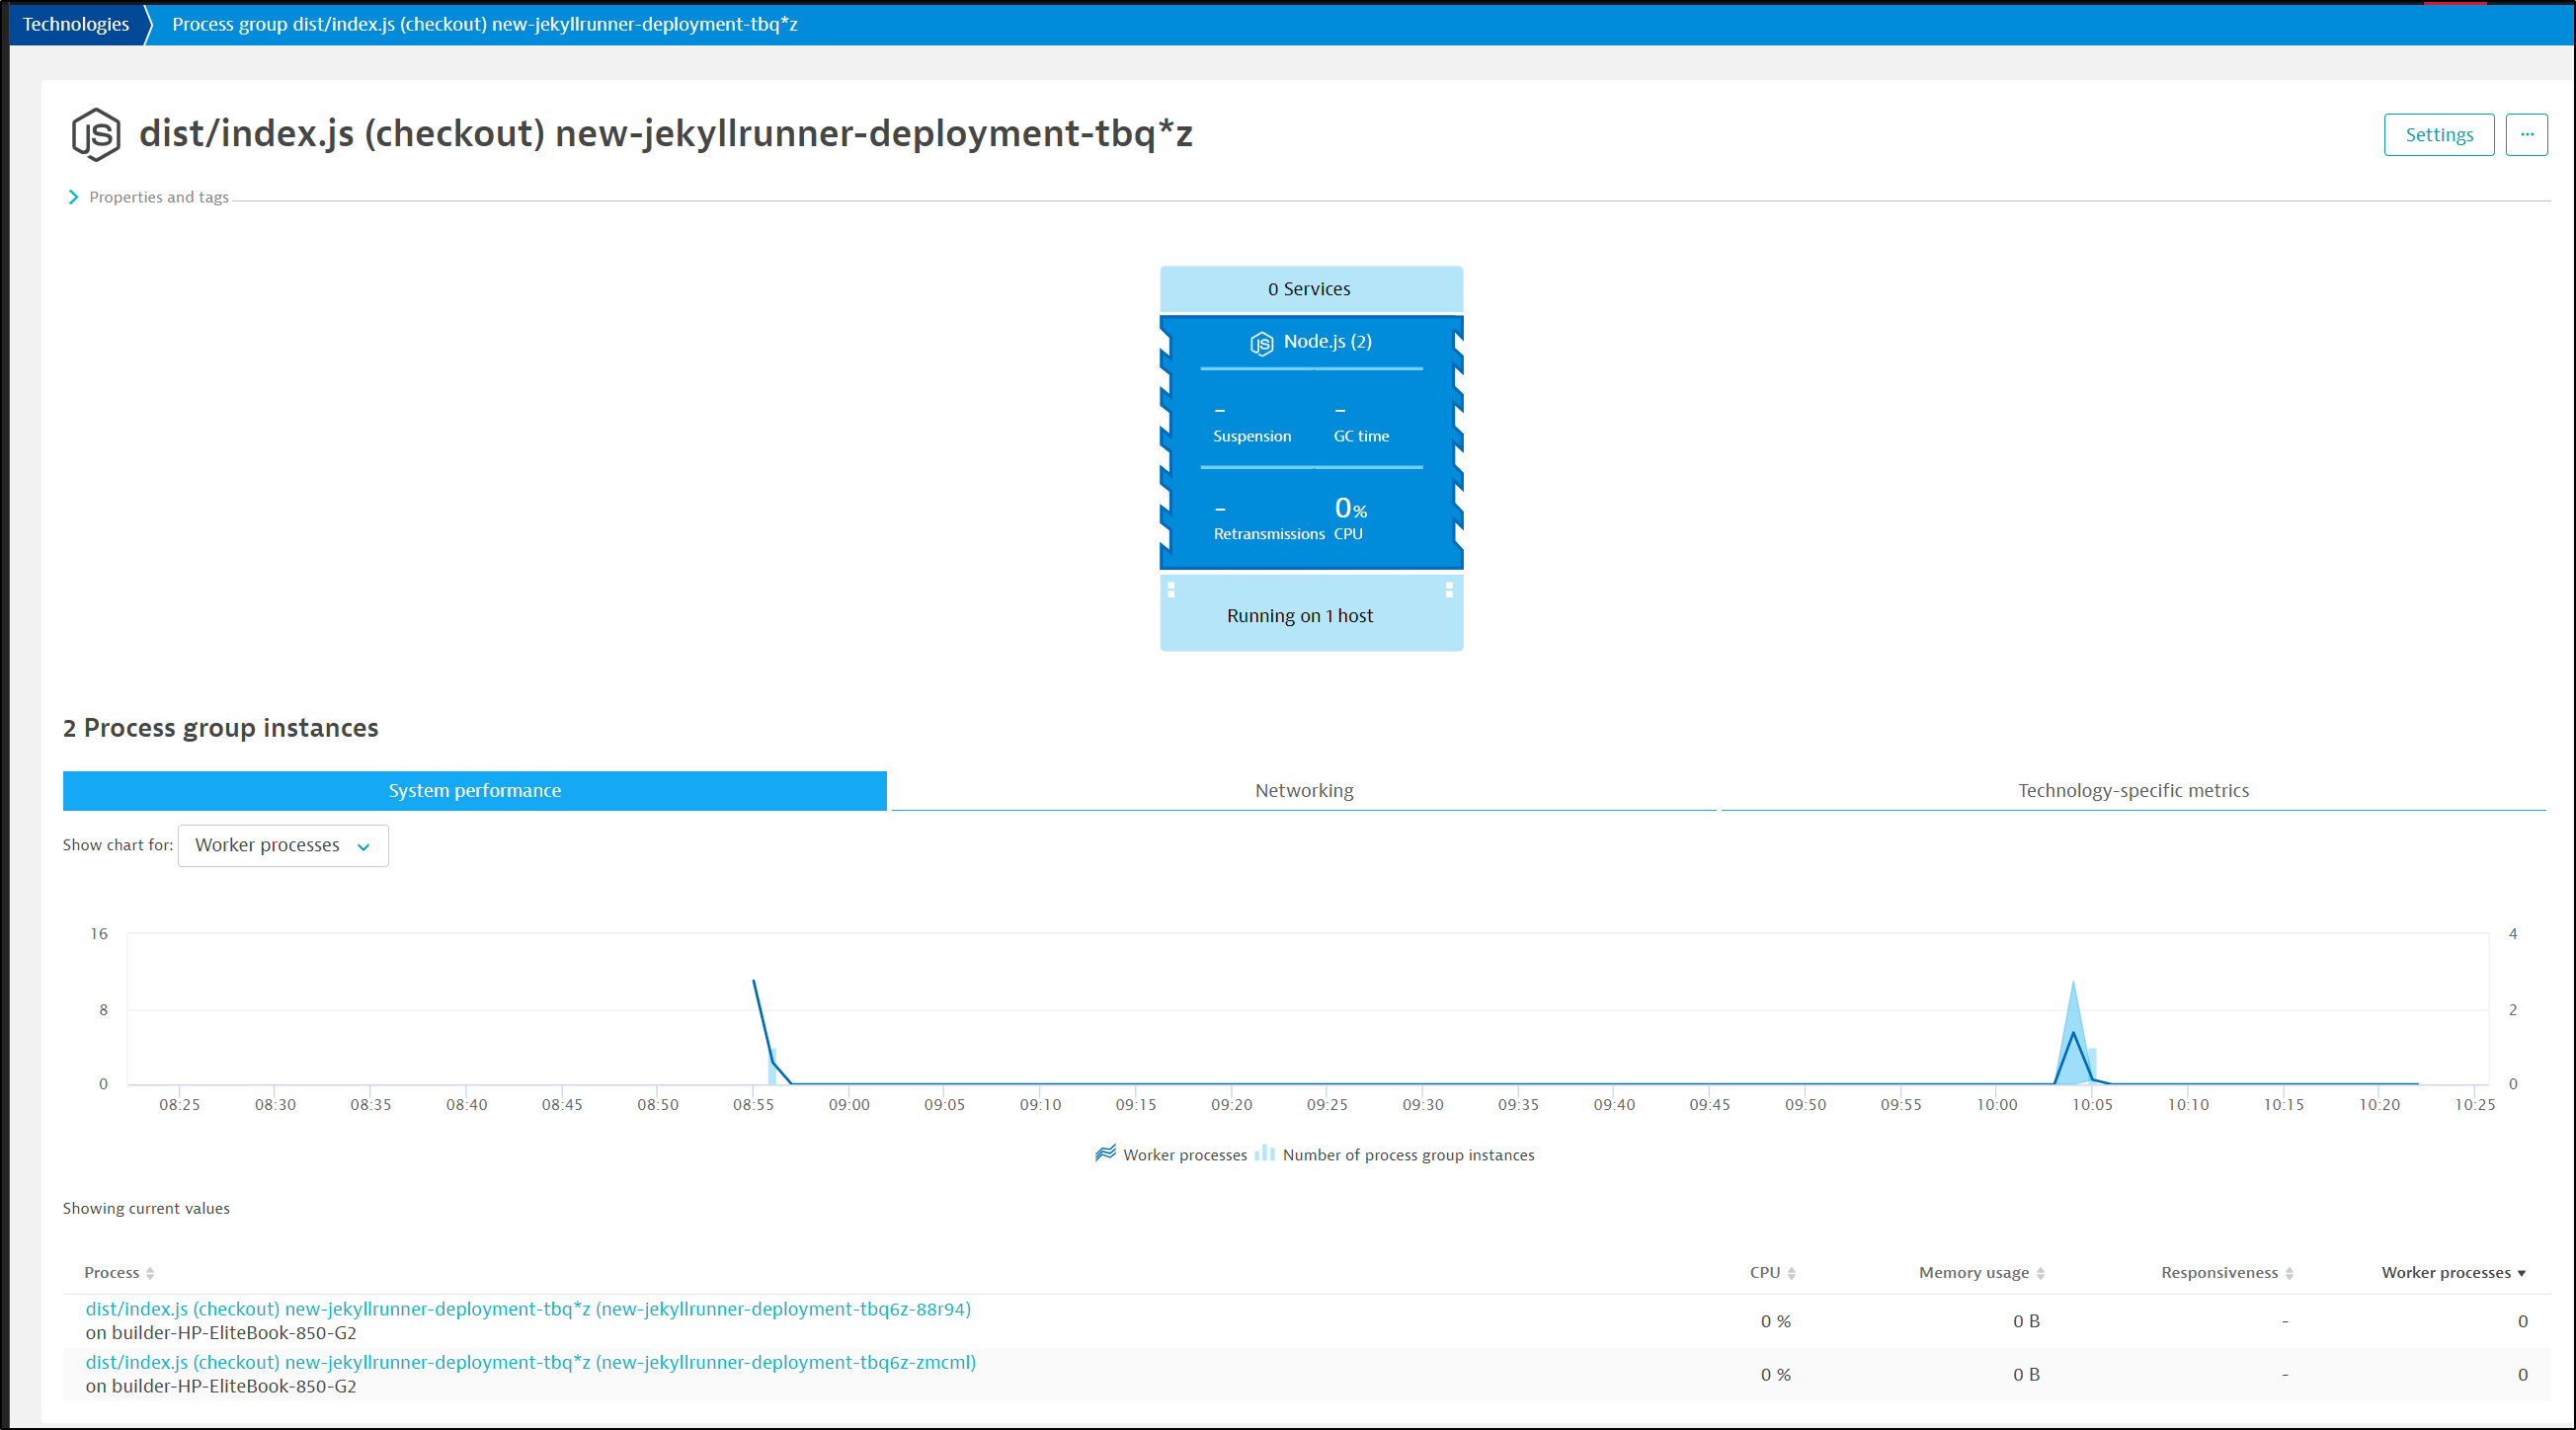
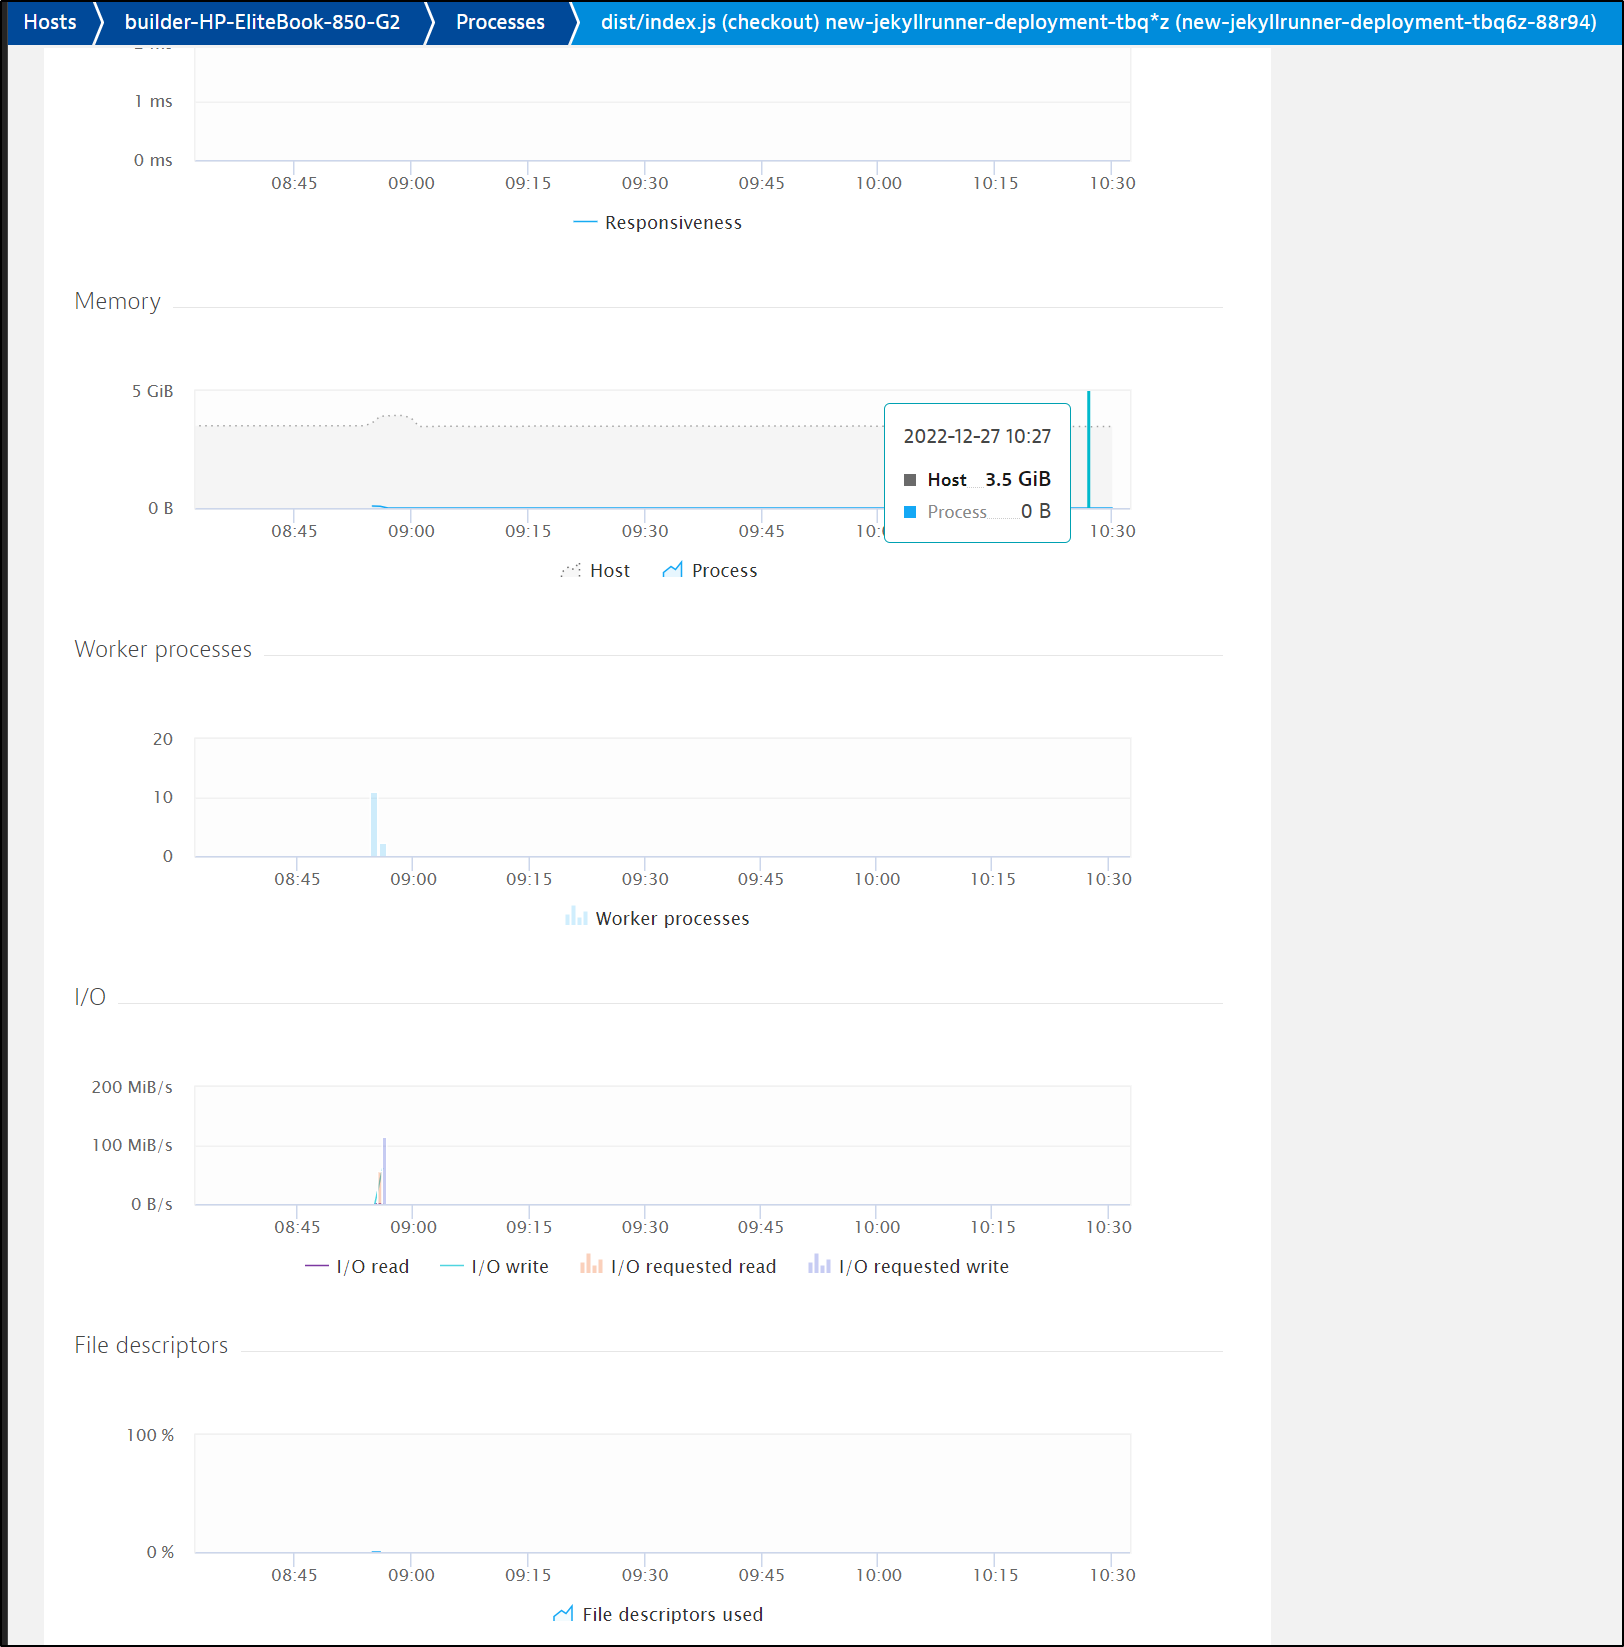
We can then dig into the details
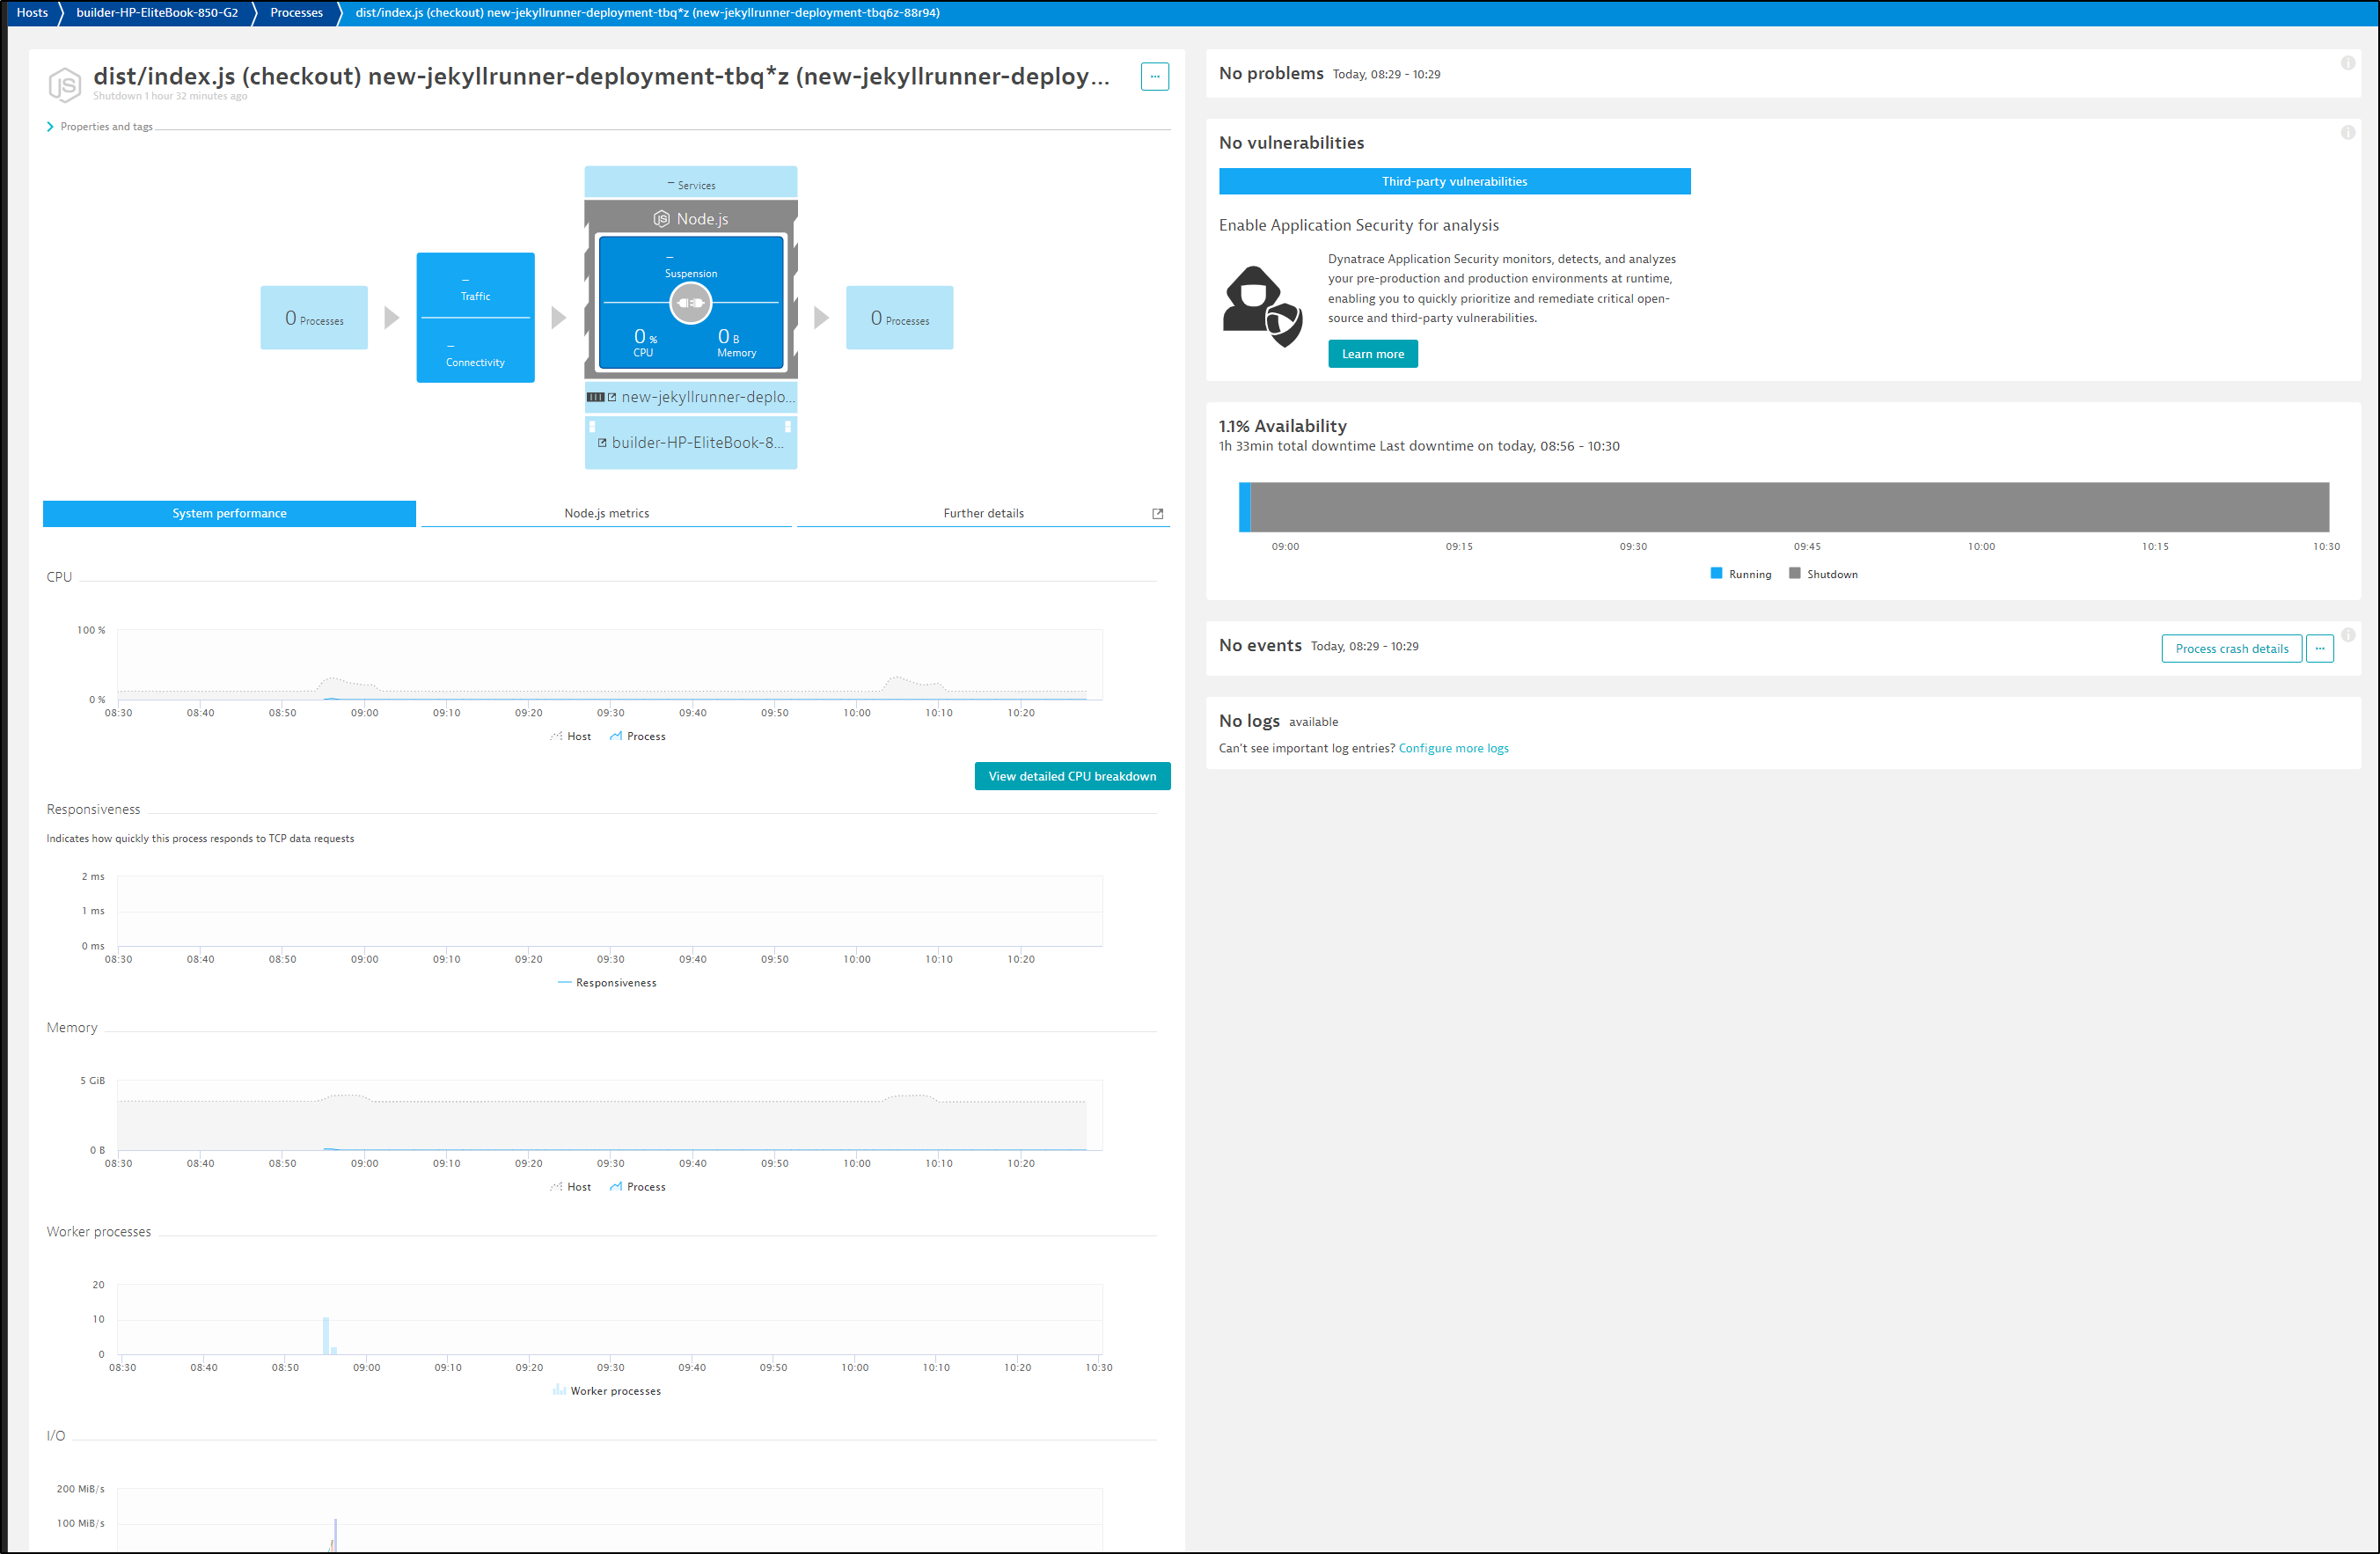
I can see specific details on memory, file, and I/O speeds
Summary
In Tuesday’s post we covered signing up for Dynatrace then installing into a fresh on-prem K3s cluster. We looked at the various monitoring options we get out of the box from the K8s collector; services, metrics and traces. We then wrapped up by setting up the Open Telemetry collector with Dapr and directing zipkin traces to the zipkin OTel Dynatrace endpoint.
Today we focused on Serverless monitoring of GCP Cloud Run and AWS Lambdas, Agentless (JavaScript/web-based), monitoring of Hosts (Infrastructure) and then how we remove the agent from Kubernetes which was one of our tests we set out to check at the start.
Next Tuesday we’ll wrap the series with production clusters, profiling and optimization, alerting, the mobile app, usage and some wrap up thoughts on costs and “buy now”.