Published: Dec 29, 2021 by Isaac Johnson
Dynatrace is an Observability, APM and Logging suite with a focus on AI and Automation as well as DevSecOps. Dynatrace likes to highlight its high customer satisfaction scores and Gartner award.
Their one-liner is “Simplify cloud complexity with Software Intelligence – observability, automation, AI, and cloud-native application security in one platform.”
Today we’ll dig into Dynatrace and see how well it performs, how we can use it and identify any gaps in the offering. We’ll explore the offering using an On-Prem k3s cluster and several fresh AKS clusters. We will dig into Logging, Metrics and Traces and wrap up with a summary of our findings.
Sizing and Adoption
Arguably Dynatrace is a player right there with Datadog and New Relic, with smaller entities in the space being Lightstep and Sumo Logic.
If we use stackshare we can see it ranks lower in stacks from Datadog and New Relic:
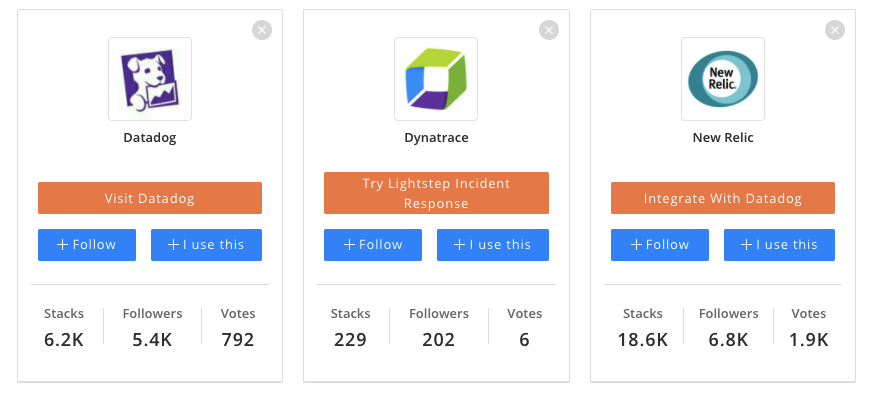
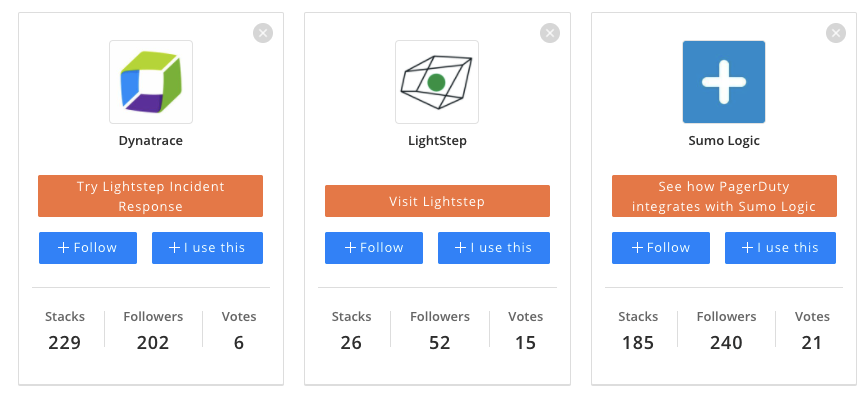
but is a touch higher than Sumo Logic and Lightstep
According to google, they reported US$703.5m in revenue last year (ending Mar 2021) with a net income of $75.7m. This beat New Relic who reported $667.7m at that time. Datadog who reported $603.5m in 2020 recently reported $802m for 2021. Sumo Logic’s last reported revenue was $155m.
We should also consider the gorilla in the room; Splunk who reported $2.36 BILLION for 2020.
History
Dynatrace has been around since 2005. It was founded in Austria by Bernd Greifeneder (still CTO) and Sok-Kheng Taing. While it is a public company (DT, IPO in 2019), it is owned by Compuware as of 2011 (owned by BMC owned by KKR). According to Crunchbase and glassdoor they have between 1k-5k employees and recently acquired SpectX in Sept, a high speed parsing and query analytics company.
Setup
Let’s create a Trial account which could be converted later to a consumption plan (more on that later).
Once created, I have a URL: https://lbt93643.live.dynatrace.com/#deploy;gf=all
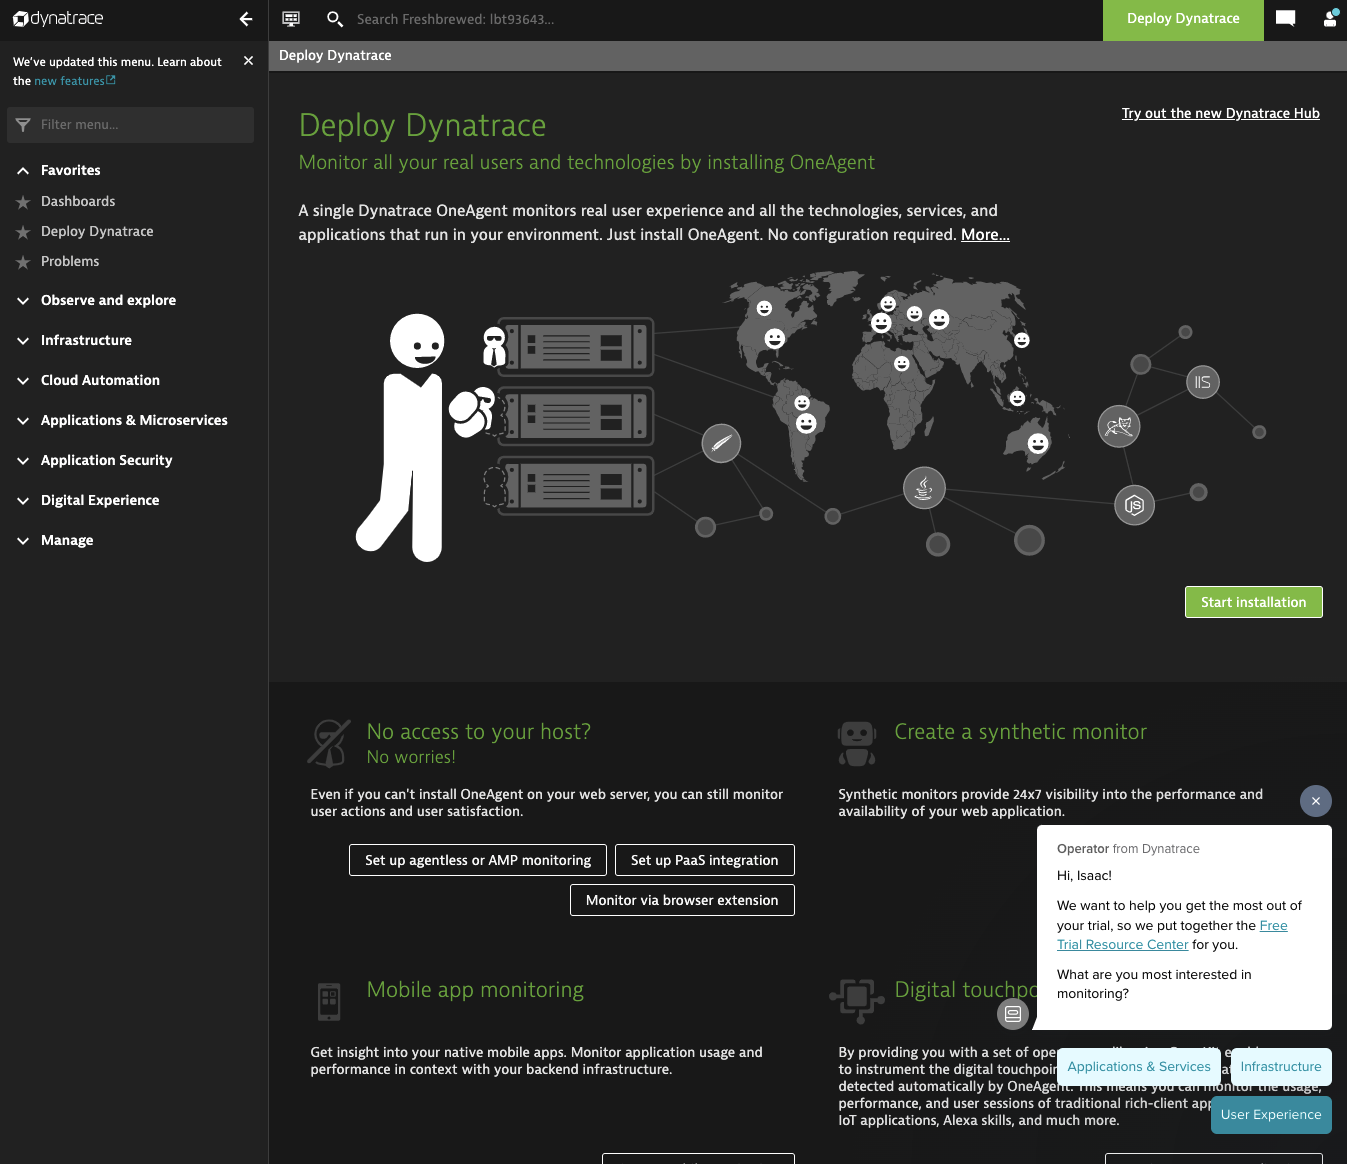
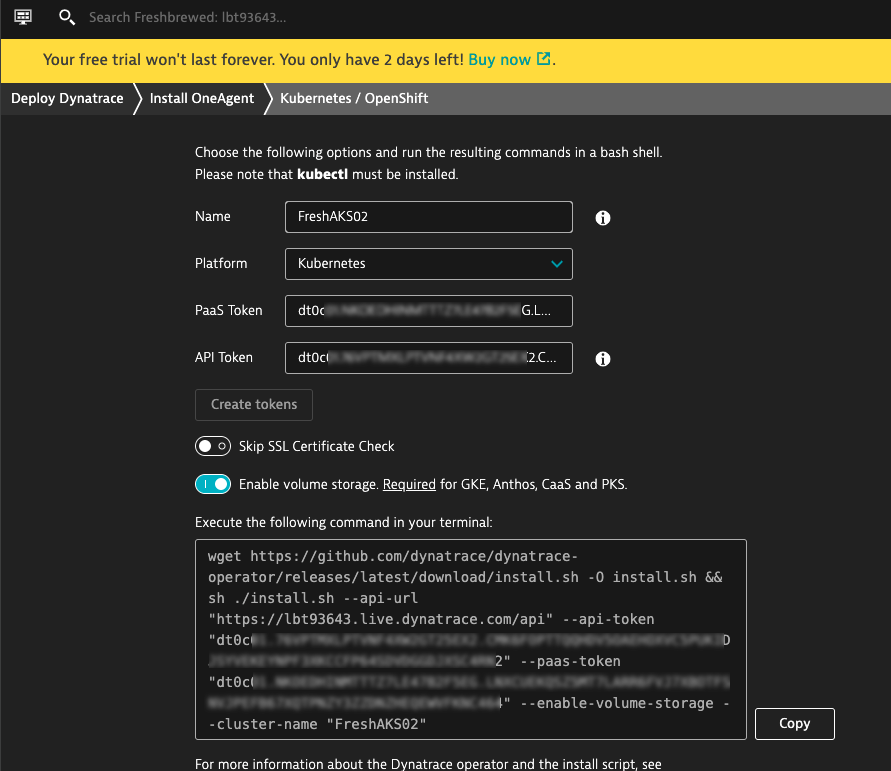
Next, I’ll follow the installer wizard for Kubernetes.
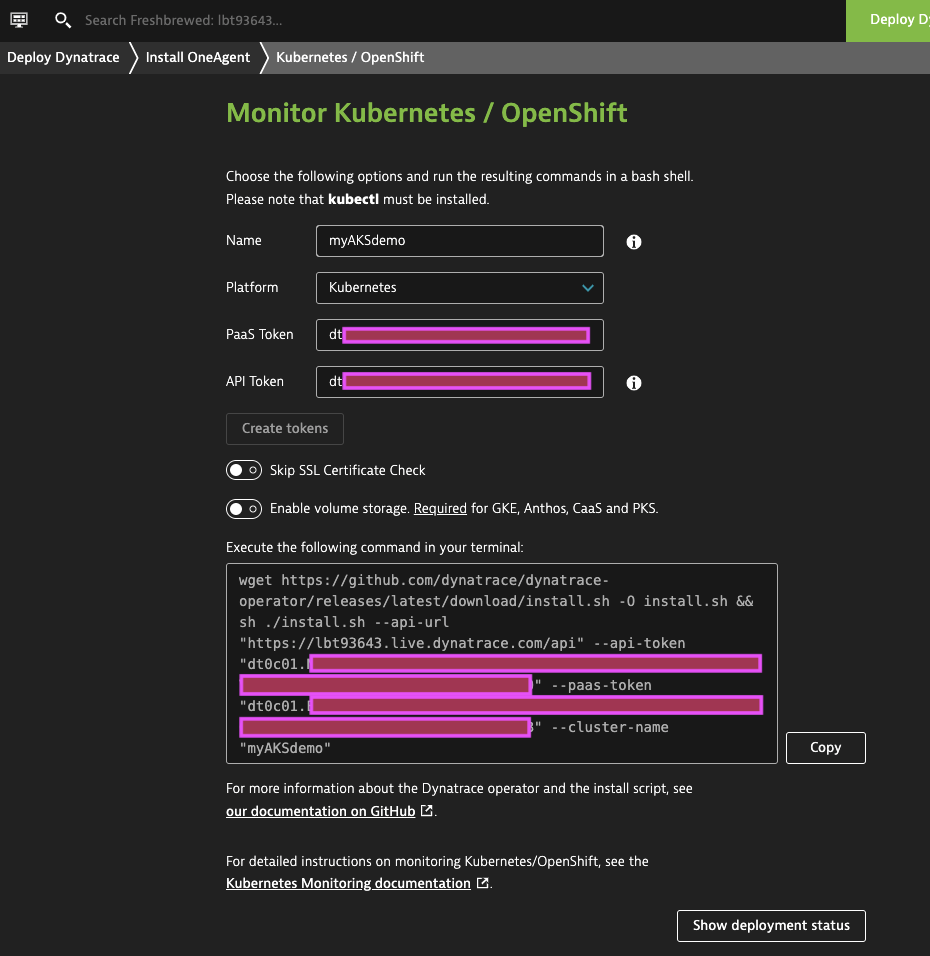
Sadly, it’s not a helm chart but a downloadable script.
The install script does a few things from creating a secret to making a new operator (e.g. https://github.com/Dynatrace/dynatrace-operator/releases/latest/download/kubernetes.yaml)
On-Prem K3s cluster
First, I’ll install to my local cluster
$ sh ./install.sh --api-url "https://lbt93643.live.dynatrace.com/api" --api-token "dt0c01.asdfasdfasdfasdfasdfasfasdfasdfasdf" --paas-token "dt0c01.asdfasdfasdfasdfasdfasdfasdfasdfasdfasdfasdfasdfasdfasdasdf" --cluster-name "myAKSdemo"

Check for token scopes...

Check if cluster already exists...

Creating Dynatrace namespace...
namespace/dynatrace created

Applying Dynatrace Operator...
customresourcedefinition.apiextensions.k8s.io/dynakubes.dynatrace.com created
mutatingwebhookconfiguration.admissionregistration.k8s.io/dynatrace-webhook created
serviceaccount/dynatrace-activegate created
serviceaccount/dynatrace-dynakube-oneagent created
serviceaccount/dynatrace-dynakube-oneagent-unprivileged created
serviceaccount/dynatrace-kubernetes-monitoring created
serviceaccount/dynatrace-operator created
serviceaccount/dynatrace-routing created
serviceaccount/dynatrace-webhook created
role.rbac.authorization.k8s.io/dynatrace-operator created
role.rbac.authorization.k8s.io/dynatrace-webhook created
clusterrole.rbac.authorization.k8s.io/dynatrace-kubernetes-monitoring created
clusterrole.rbac.authorization.k8s.io/dynatrace-operator created
clusterrole.rbac.authorization.k8s.io/dynatrace-webhook created
rolebinding.rbac.authorization.k8s.io/dynatrace-operator created
rolebinding.rbac.authorization.k8s.io/dynatrace-webhook created
clusterrolebinding.rbac.authorization.k8s.io/dynatrace-kubernetes-monitoring created
clusterrolebinding.rbac.authorization.k8s.io/dynatrace-operator created
clusterrolebinding.rbac.authorization.k8s.io/dynatrace-webhook created
service/dynatrace-webhook created
deployment.apps/dynatrace-operator created
deployment.apps/dynatrace-webhook created
validatingwebhookconfiguration.admissionregistration.k8s.io/dynatrace-webhook created
W1214 12:27:26.869531   53903 helpers.go:555] --dry-run is deprecated and can be replaced with --dry-run=client.
secret/dynakube created

Wait for webhook to become available
pod/dynatrace-webhook-78768bd789-ksrcn condition met

Applying DynaKube CustomResource...
CR.yaml:
----------
apiVersion: dynatrace.com/v1beta1
kind: DynaKube
metadata:
  name: dynakube
  namespace: dynatrace
spec:
  apiUrl: https://lbt93643.live.dynatrace.com/api
  skipCertCheck: false
  networkZone: myAKSdemo
  oneAgent:
    classicFullStack:
      tolerations:
      - effect: NoSchedule
        key: node-role.kubernetes.io/master
        operator: Exists

      args:
      - --set-host-group=myAKSdemo
  activeGate:
    capabilities:
      - routing
      - kubernetes-monitoring
    group: myAKSdemo
----------
dynakube.dynatrace.com/dynakube created

Adding cluster to Dynatrace...
Kubernetes monitoring successfully setup.
I watched the pods come up.. some had failures.. It seems to pull a container from my newly created endpoint:
$ kubectl get pods -n dynatrace
NAME                                  READY   STATUS    RESTARTS   AGE
dynatrace-operator-8448d4556c-xhrv8   1/1     Running   0          3m26s
dynatrace-webhook-78768bd789-ksrcn    1/1     Running   0          3m26s
dynakube-activegate-0                 0/1     Running   0          2m12s
dynakube-oneagent-tks6h               1/1     Running   0          2m12s
dynakube-oneagent-tkhlq               1/1     Running   0          2m12s
dynakube-oneagent-8wwz6               0/1     Running   0          2m12s
dynakube-oneagent-s9pcv               1/1     Running   0          2m12s
dynakube-oneagent-vh6l9               1/1     Running   0          2m12s
dynakube-oneagent-4djp2               1/1     Running   0          2m12s
and some of the events of a pod
Events:
  Type     Reason     Age                From               Message
  ----     ------     ----               ----               -------
  Normal   Scheduled  97s                default-scheduler  Successfully assigned dynatrace/dynakube-oneagent-8wwz6 to isaac-macbookpro
  Warning  Failed     69s                kubelet            Failed to pull image "lbt93643.live.dynatrace.com/linux/oneagent:latest": rpc error: code = Unknown desc = failed to pull and unpack image "lbt93643.live.dynatrace.com/linux/oneagent:latest": failed to copy: httpReaderSeeker: failed open: failed to do request: Get "https://lbt93643.live.dynatrace.com/v2/linux/oneagent/blobs/sha256:c6f63695b5464744760c66afa0d48ce8ccfd9f838ecbb562320cc72b0af80f4e": dial tcp: lookup lbt93643.live.dynatrace.com: Try again
  Warning  Failed     69s                kubelet            Error: ErrImagePull
  Normal   BackOff    69s                kubelet            Back-off pulling image "lbt93643.live.dynatrace.com/linux/oneagent:latest"
  Warning  Failed     69s                kubelet            Error: ImagePullBackOff
  Normal   Pulling    55s (x2 over 95s)  kubelet            Pulling image "lbt93643.live.dynatrace.com/linux/oneagent:latest"
  Normal   Pulled     14s                kubelet            Successfully pulled image "lbt93643.live.dynatrace.com/linux/oneagent:latest" in 41.322559191s
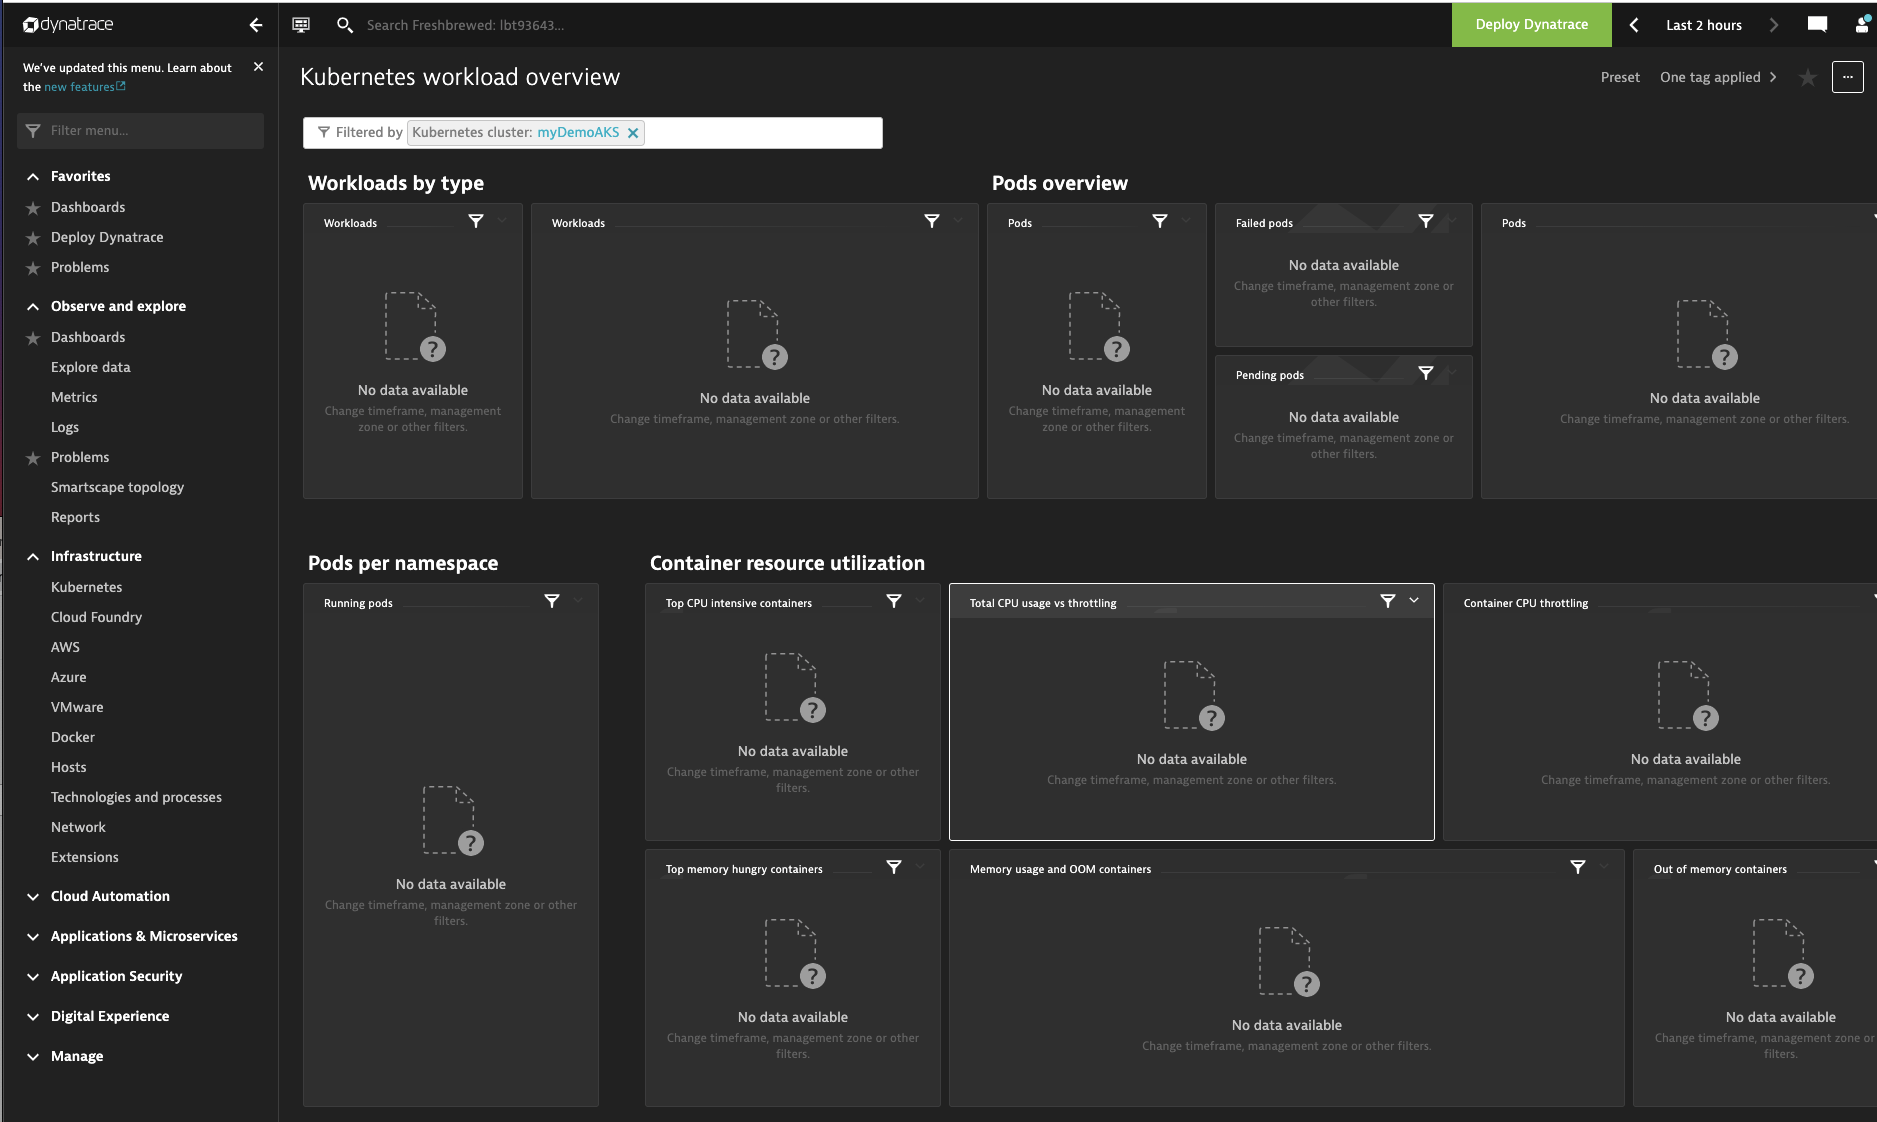
After a bit I saw my 6 nodes show up
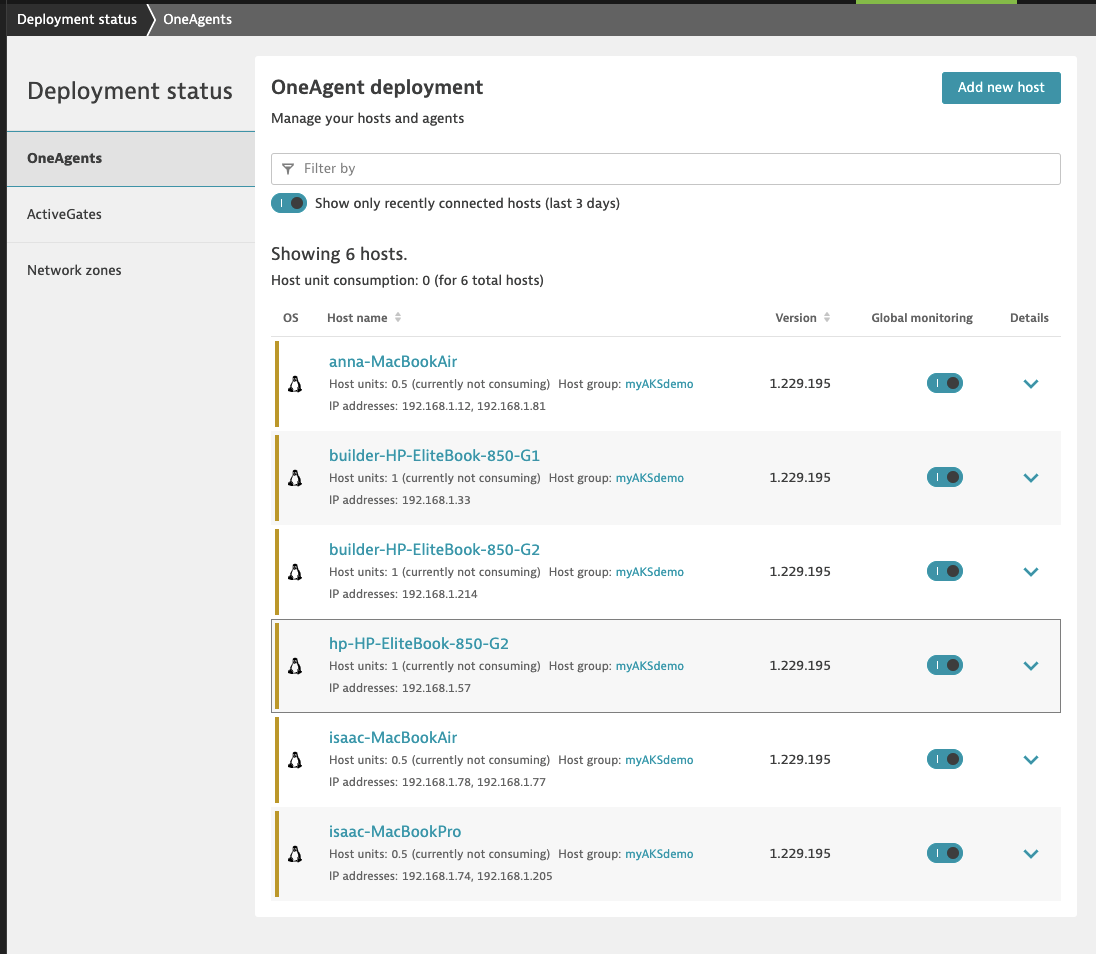
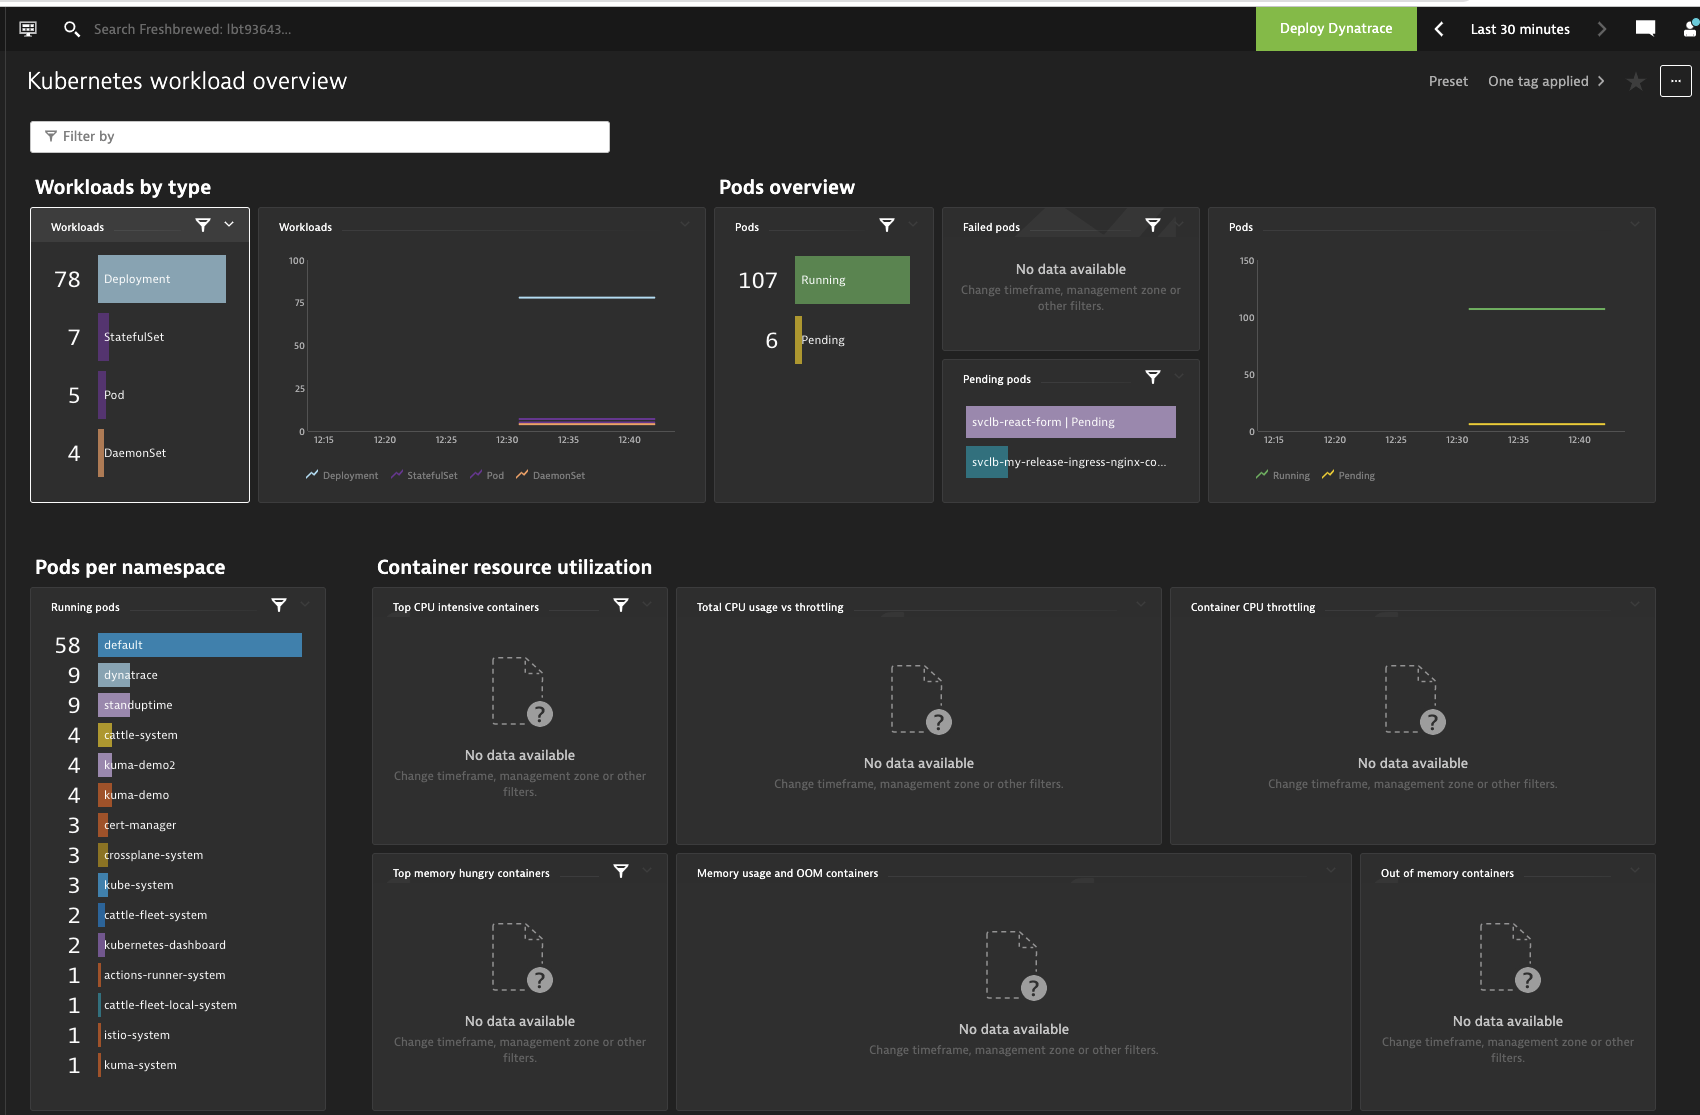
After a while (more than 10 minutes or so) I started to see some data in the Dashboard:
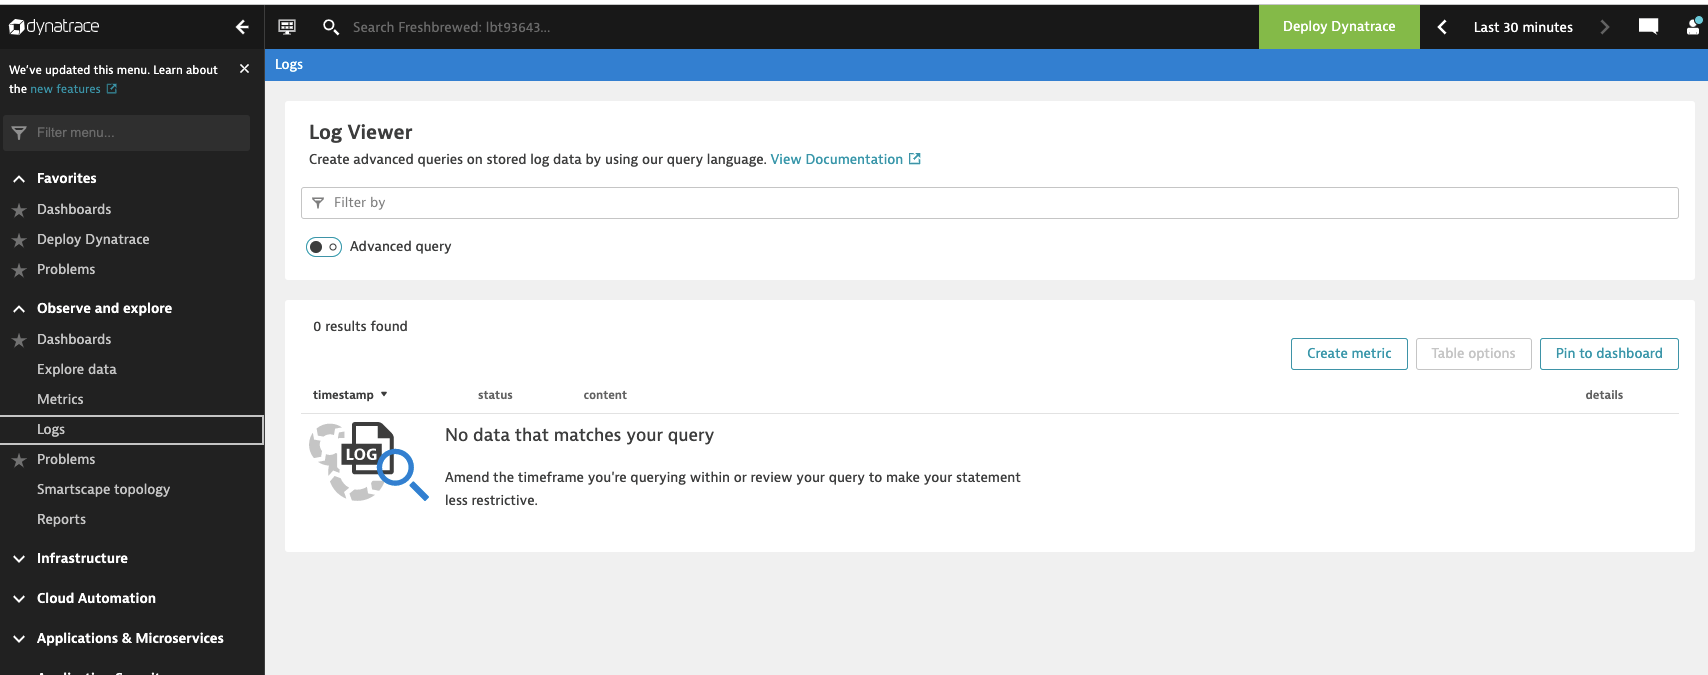
I went to view logs, but saw no data
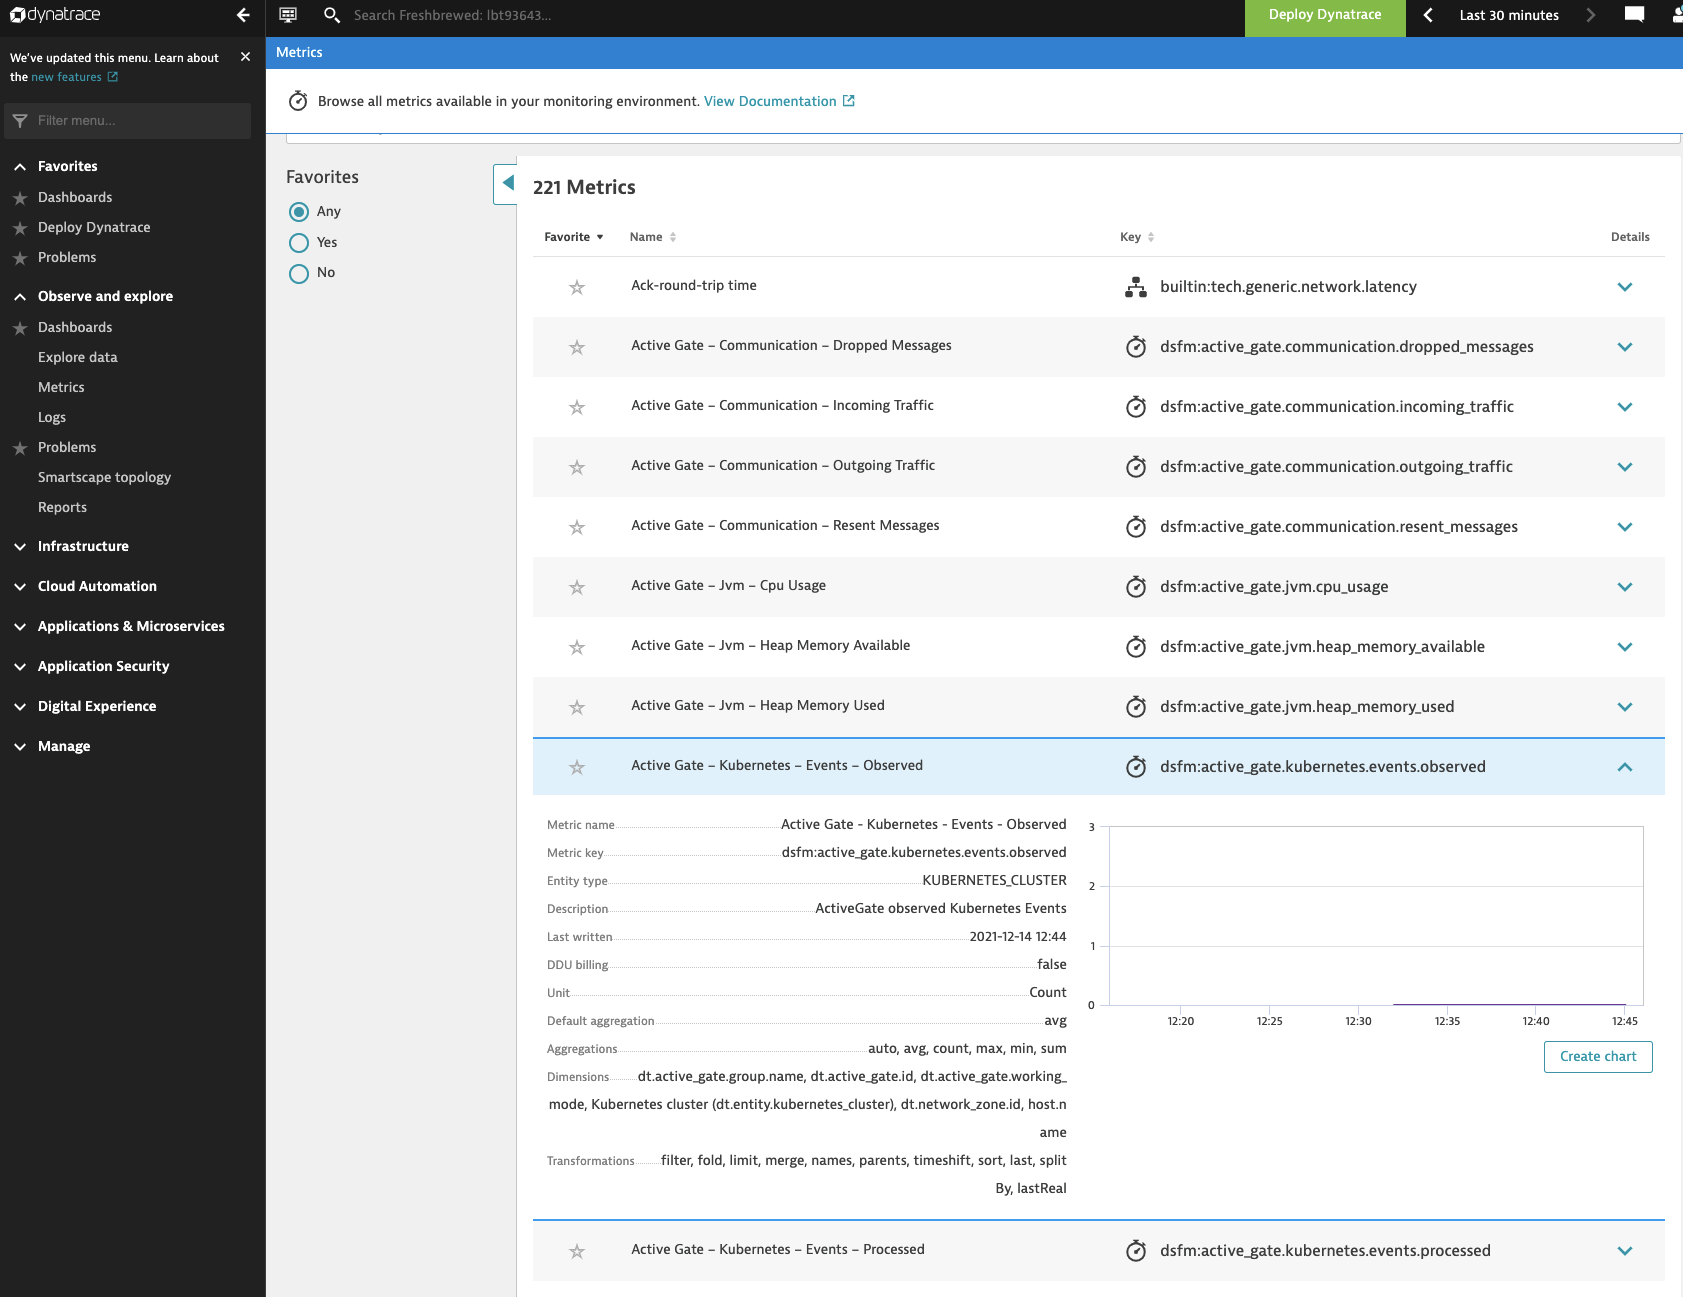
Though I could see some Metrics being gathered
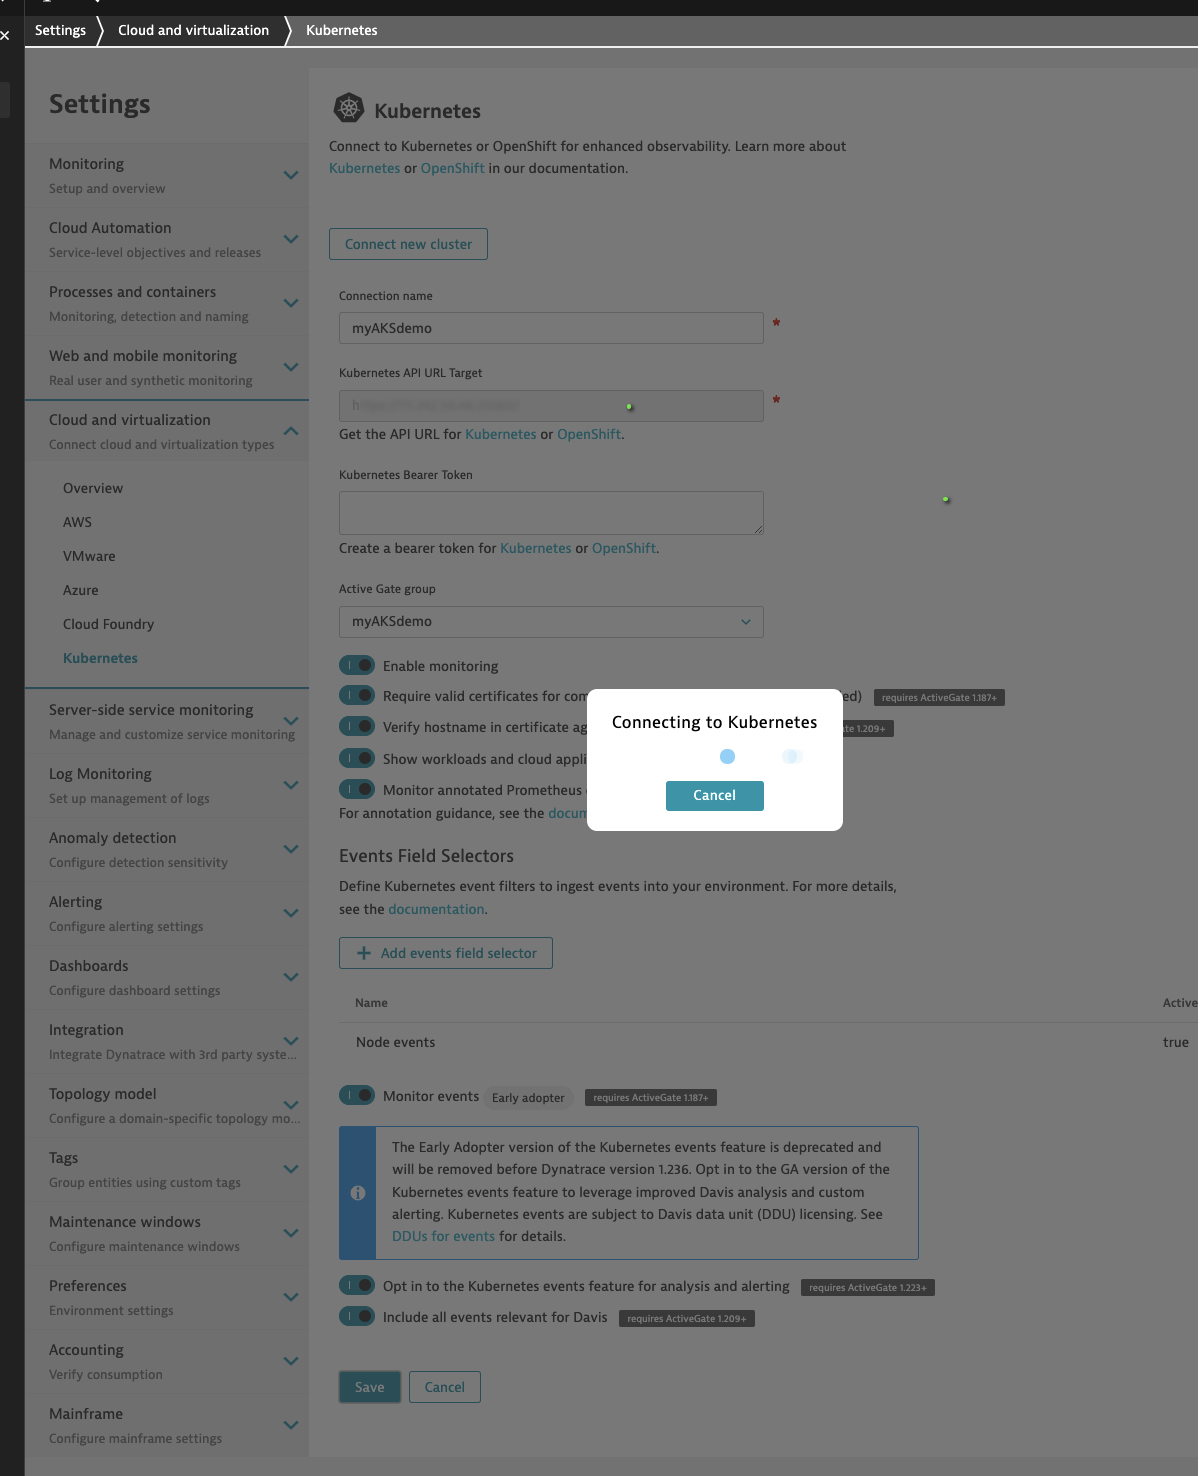
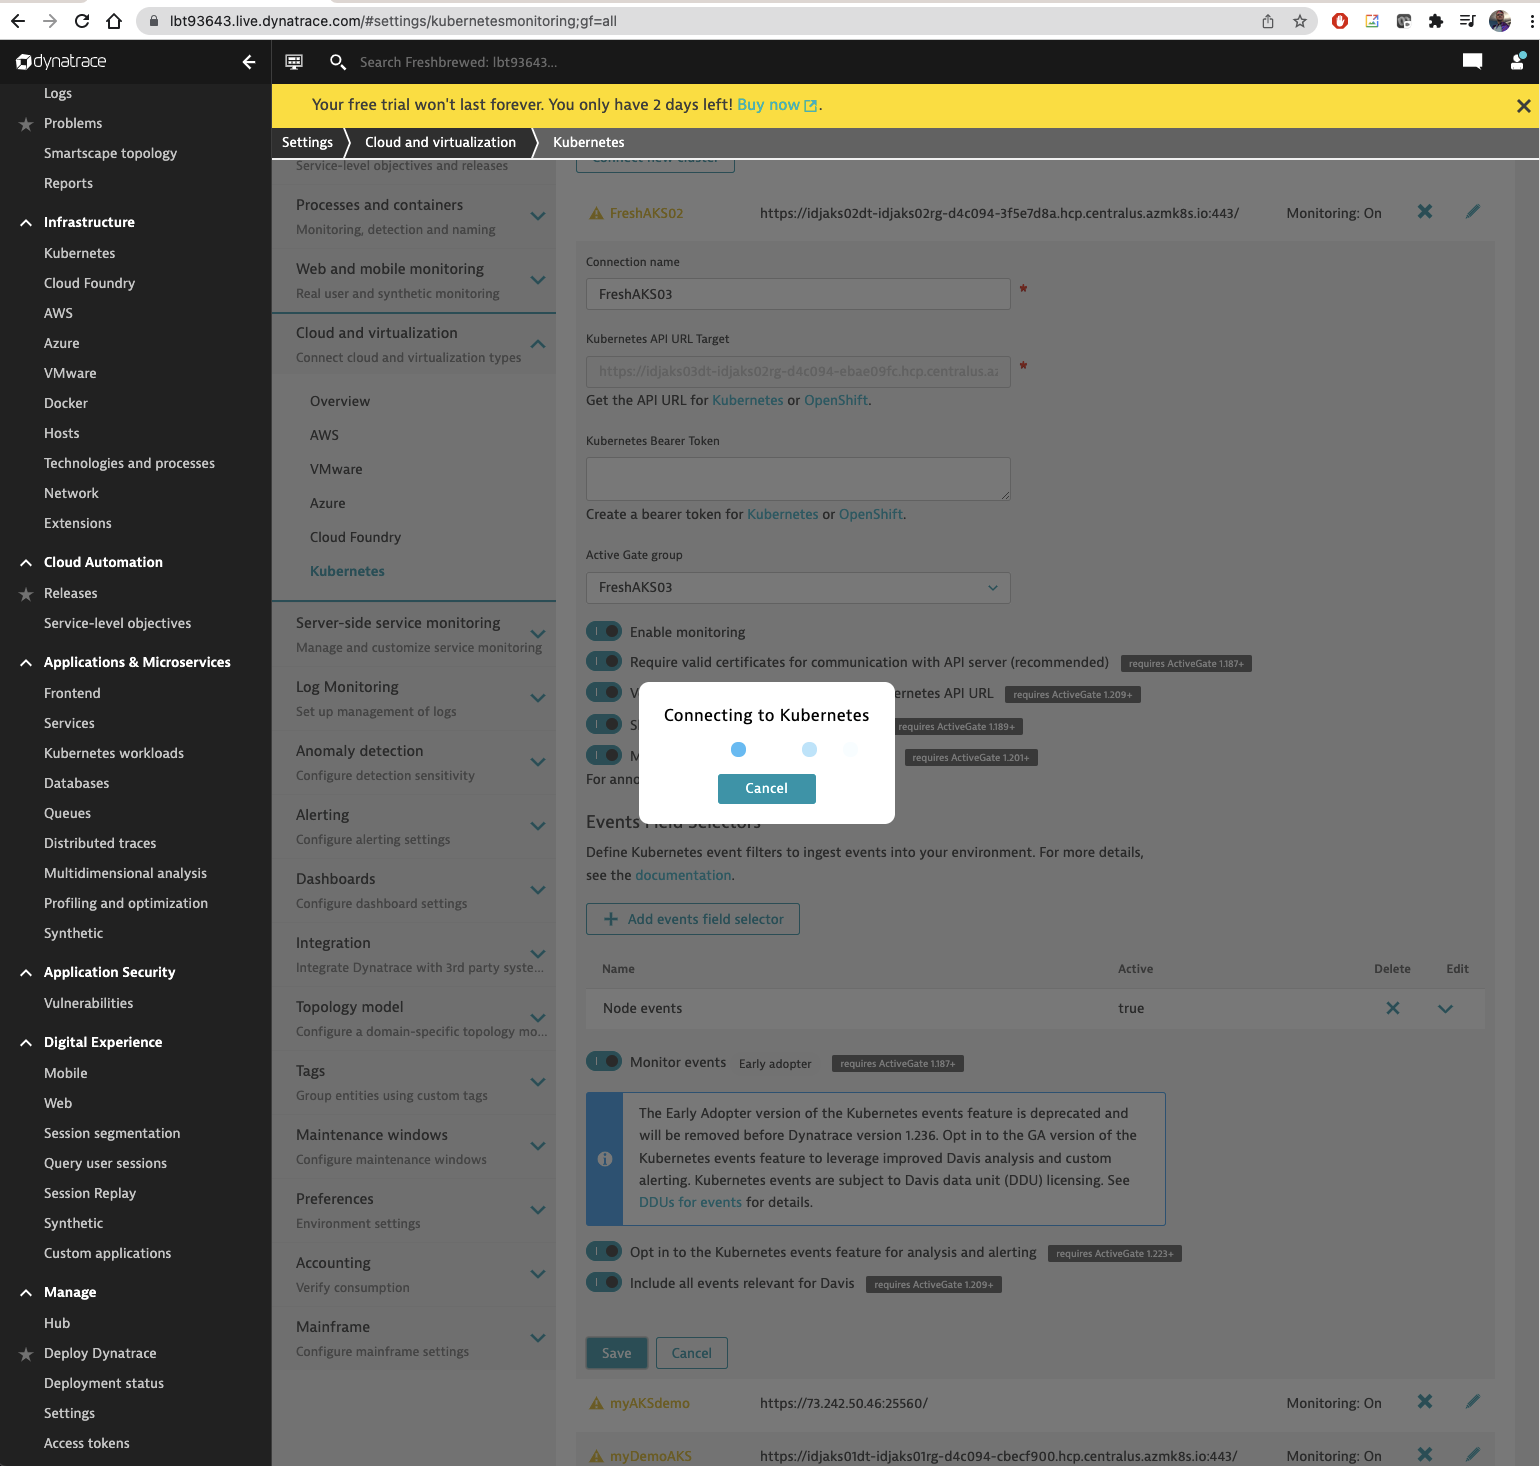
I wanted to enable some advanced features so I went to edit the settings.
It connects to my cluster to change configurations. This made me a bit uncomfortable. Pixie via NewRelic did similar.
I don’t really like the idea of some remote vendor controlling my cluster (I like helm settings or YAML updates)
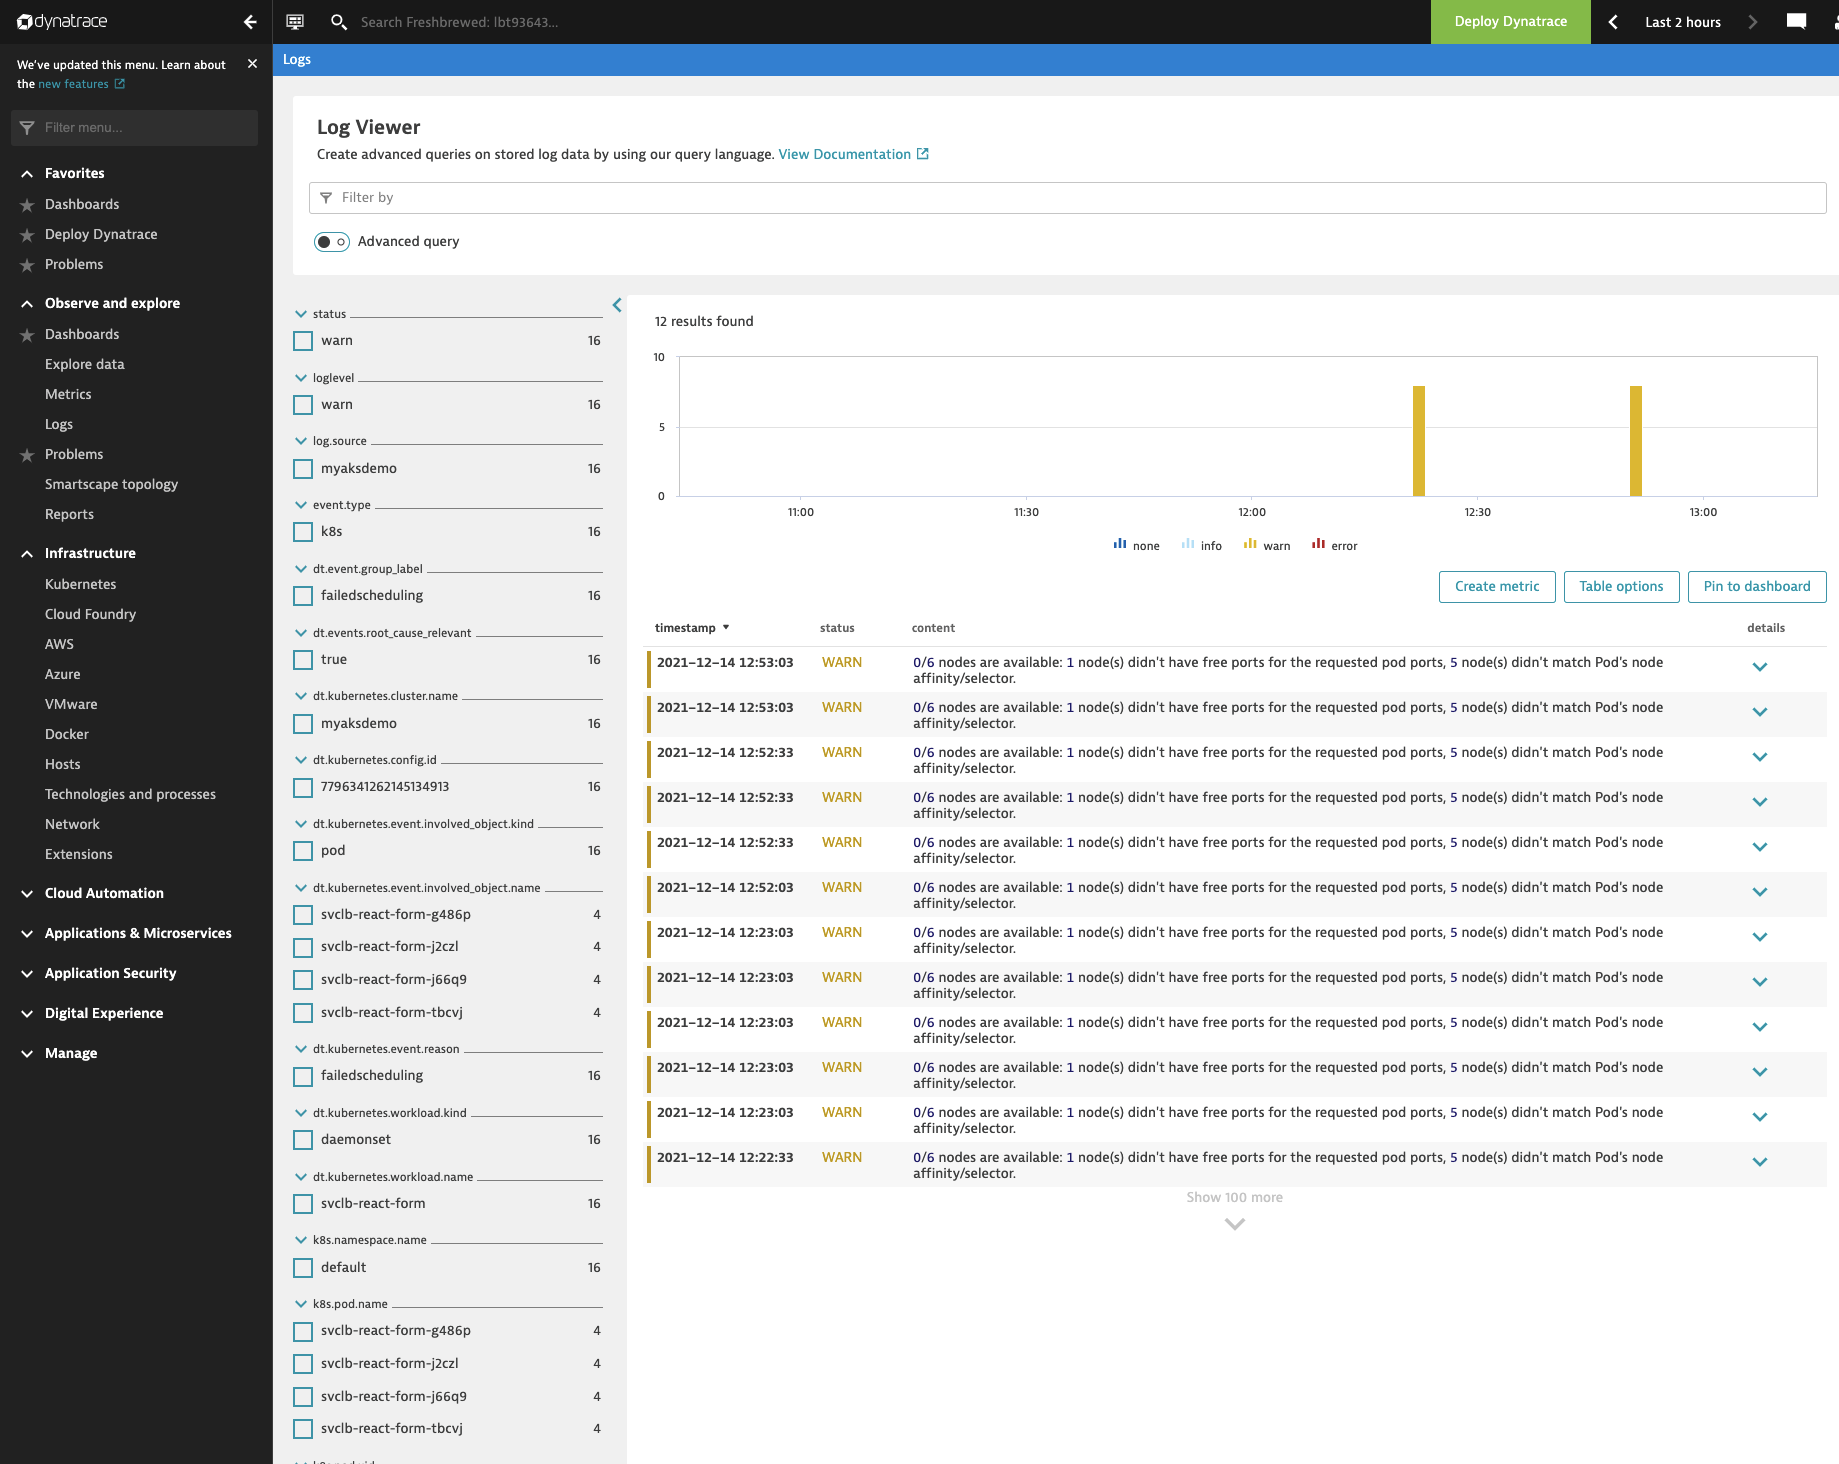
Revisiting logs..
After a while, in fact, while I was checking the AKS deploy, I found logs populated.
AKS
We tried a long standing on-prem light k3s cluster. Now let’s use a proper Kubernetes instance.
Let’s create a quick cluster in Azure:
# using a current identity
$ export SP_ID=`cat SP_ID | tr -d '\n'`
$ export SP_PASS=`cat SP_PASS | tr -d '\n'`

$ az group create -n idjaks01rg --location centralus

$ az aks create -g idjaks01rg -n idjaks01dt --location centralus  --network-plugin azure --network-policy azure --generate-ssh-keys --service-principal $SP_ID --client-secret $SP_PASS
Now we get the creds and verify our node pool size:
$ (rm -f ~/.kube/config || true) && az aks get-credentials -n idjaks01dt -g idjaks01rg --admin
Merged "idjaks01dt-admin" as current context in /Users/johnisa/.kube/config

$ kubectl get nodes
NAME                                STATUS   ROLES   AGE   VERSION
aks-nodepool1-67624029-vmss000000   Ready    agent   37m   v1.20.9
aks-nodepool1-67624029-vmss000001   Ready    agent   37m   v1.20.9
aks-nodepool1-67624029-vmss000002   Ready    agent   37m   v1.20.9
Now I’ll follow the same wizard and launch the installer again
wget https://github.com/dynatrace/dynatrace-operator/releases/latest/download/install.sh -O install.sh && sh ./install.sh --api-url "https://lbt93643.live.dynatrace.com/api" --api-token "dt0c01.asdfasdfasdfasfasdfasdfasdfasdfasdfasdf" --paas-token "dt0c01.asdfasdfasdfasdfasdfasdfasdfasdfasdfasdfsadfasdf" --cluster-name "myDemoAKS"
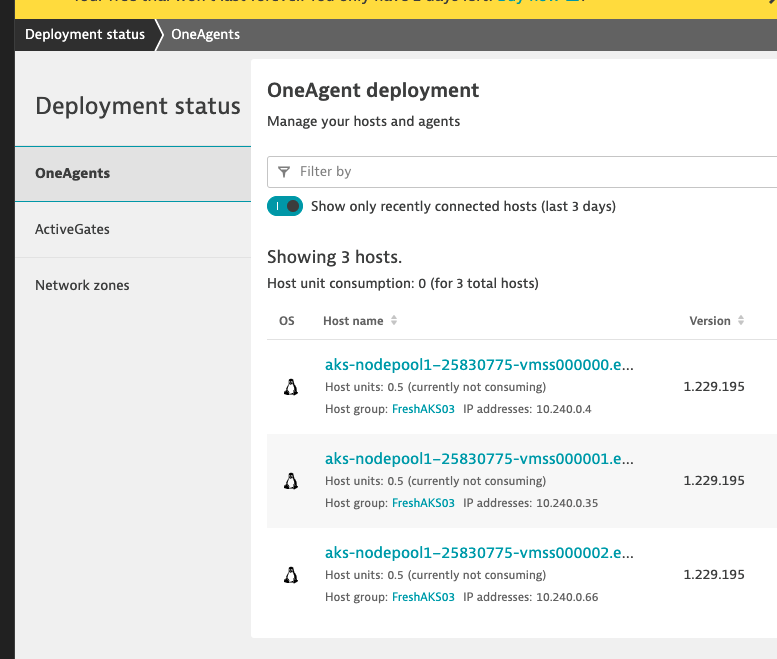
After a couple minutes, I see the hosts listed in our OneAgent deployment
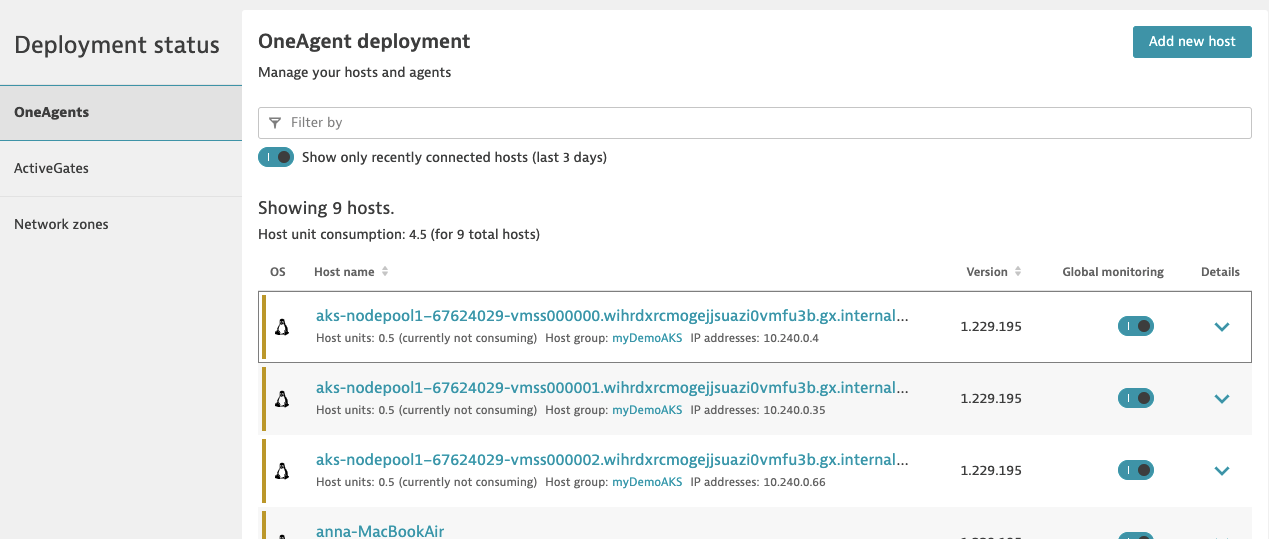
I can filter by the cluster name of myDemoAKS
Account Settings
I can see how long my Trial has left from the profile dropdown
I tried to figure out how to turn on pay features so I could get a handle on cost, but the only options were to route me to sales.
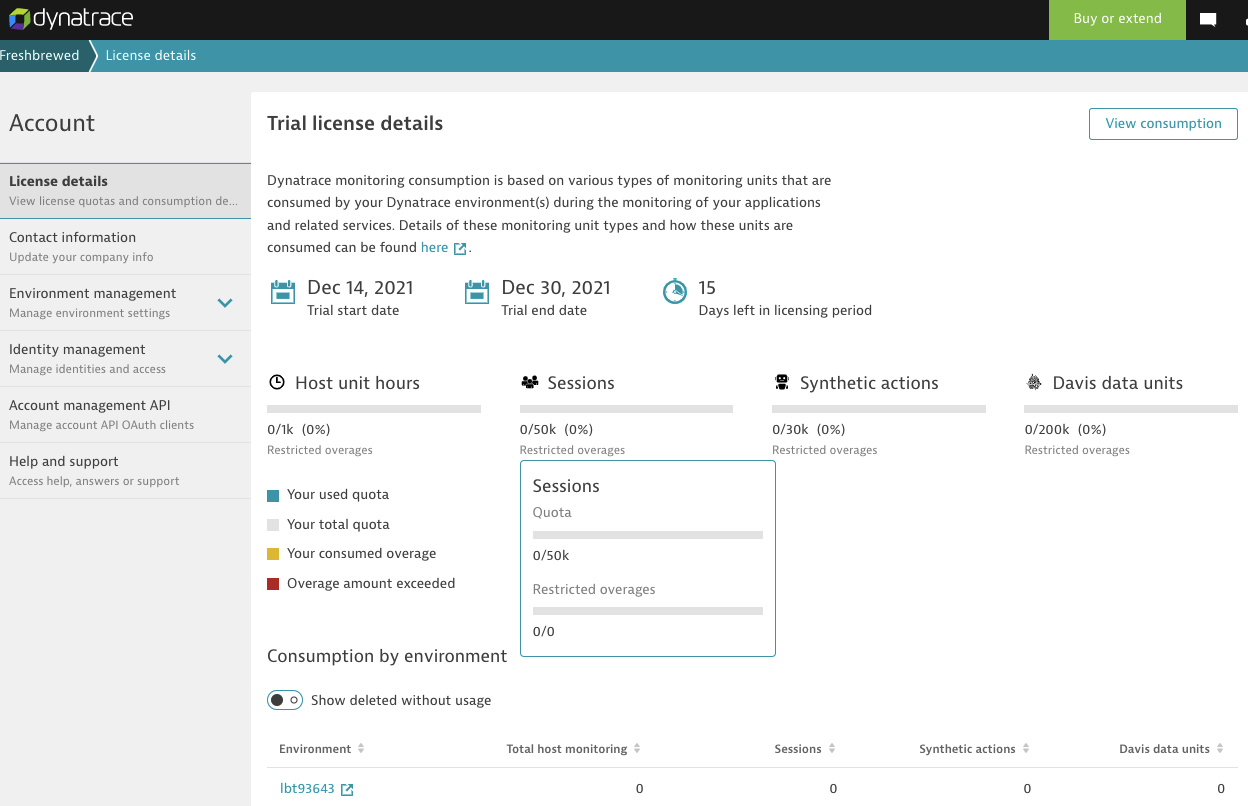
However, I could at least see how much data I have used
Open Telemetry (OTel)
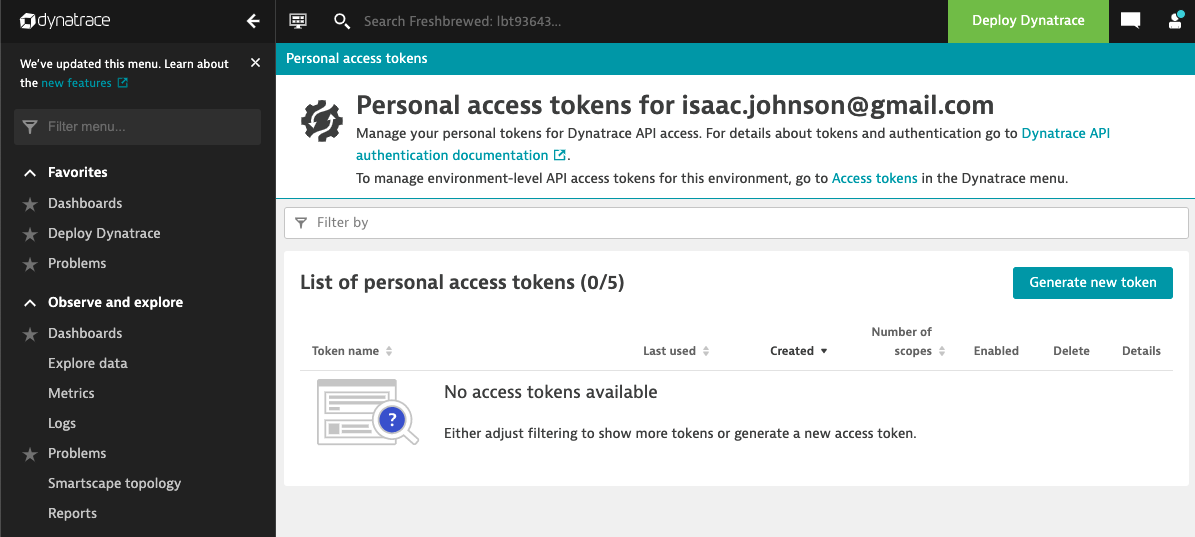
Getting a Token was hard. The docs do not match the UI.. In the end I searched and hunted till I figured out a place to enable PATs, then I found the URL:
https://MYENVIRONMENT.live.dynatrace.com/ui/personal-access-tokens?gtf=-2h&gf=all
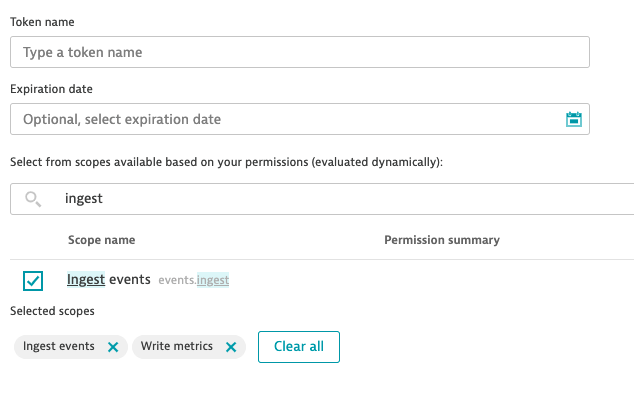
We only need to allow Metrics.Ingest/Ingest Metrics scope according to the Dynatrace OpenTelemetry Docs.
That does not match the UI either.
So I’ll try to add “write metrics” and “ingest events” and see if that covers us.
Here you can see what I did in the OTel conf:
$ kubectl get cm otel-collector-conf -o yaml > otel.conf
$ kubectl get cm otel-collector-conf -o yaml > otel.conf.bak

$ vi otel.conf

$ git diff otel.conf.bak otel.conf
diff --git a/otel.conf.bak b/otel.conf
index 42a15d9..114ee9e 100644
--- a/otel.conf.bak
+++ b/otel.conf
@@ -11,6 +11,9 @@ data:
       zpages:
         endpoint: :55679
     exporters:
+      dynatrace:
+        endpoint: "https://lbt93643.live.dynatrace.com/api/v2/metrics/ingest"
+        api_token: "dt0c01.2KOMNSQWHEWDHA6S7WYJOVTI.KKH7OJRasdfasdfasdfasdfasdfasdfasdfasdfasdfasdfVY"
       logging:
         loglevel: debug
       # Depending on where you want to export your trace, use the
@@ -28,9 +31,6 @@ data:
       datadog:
         api:
           key: "adfasdfasdfasdfasdfasdfasdfasdfasdfasdfasdfasdf"
-      newrelic:
-        apikey: c87asdfasdfasdfasdfasdfasdfasdfAL
-        timeout: 30s

     service:
       extensions: [pprof, zpages, health_check]
@@ -38,7 +38,7 @@ data:
         traces:
           receivers: [zipkin]
           # List your exporter here.
-          exporters: [azuremonitor, datadog, newrelic, logging]
+          exporters: [azuremonitor, datadog, dynatrace, logging]
     # datadog/api maybe?
 kind: ConfigMap
 metadata:
This did not work
$ kubectl get pods | grep tel
otel-collector-85b54fbfdc-ms9lj                         1/1     Running   0          24d

$ kubectl delete pod otel-collector-85b54fbfdc-ms9lj
pod "otel-collector-85b54fbfdc-ms9lj" deleted

$ kubectl get pods | grep tel
otel-collector-85b54fbfdc-jj2qf                         0/1     CrashLoopBackOff   3          58s

$ kubectl logs otel-collector-85b54fbfdc-jj2qf
2021-12-14T19:25:16.137Z	info	service/collector.go:190	Applying configuration...
Error: cannot build exporters: pipeline "traces" of data type "traces" has an exporter dynatrace, which does not support that data type
2021/12/14 19:25:16 collector server run finished with error: cannot build exporters: pipeline "traces" of data type "traces" has an exporter dynatrace, which does not support that data type
The more I looked, the more it looked like Dynatrace via Otel can really only do metrics
https://github.com/open-telemetry/opentelemetry-collector-contrib/tree/main/exporter/dynatraceexporter
The Dynatrace metrics exporter exports metrics to the metrics API v2 using the metrics ingestion protocol. This enables Dynatrace to receive metrics collected by the OpenTelemetry Collector.
Let’s switch that up
$ kubectl get cm otel-collector-conf -o yaml > otel.conf.bak2
$ kubectl get cm otel-collector-conf -o yaml > otel.conf2
$ vi otel.conf2
$ diff otel.conf2 otel.conf.bak2
41,43c41,42
<           exporters: [azuremonitor, datadog, logging]
<         metrics:
<           exporters: [dynatrace]
---
>           exporters: [azuremonitor, datadog, dynatrace, logging]
>     # datadog/api maybe?

$ kubectl apply -f otel.conf2
configmap/otel-collector-conf configured

$ kubectl get pods | grep otel
otel-collector-85b54fbfdc-jj2qf                         0/1     CrashLoopBackOff   6          6m48s

$ kubectl delete pod otel-collector-85b54fbfdc-jj2qf
pod "otel-collector-85b54fbfdc-jj2qf" deleted
but that crashed too.. requiring a receiver first (e.g. prometheus)
In doing more digging, the trace data comes via otlhttp, not their own contrib offering
https://www.dynatrace.com/support/help/extend-dynatrace/opentelemetry/opentelemetry-ingest#expand–sample-collector-configuration
In the end what worked:
$ kubectl get pods | grep otel
otel-collector-85b54fbfdc-s4hfv                         1/1     Running   0          4m25s
was a config like this (keys of course masked):
$ cat otel.conf4
apiVersion: v1
data:
  otel-collector-config: |
    receivers:
      otlp:
        protocols:
          grpc:
            endpoint: 0.0.0.0:55680
          http:
            endpoint: 0.0.0.0:55681
      zipkin:
        endpoint: 0.0.0.0:9411
      prometheus:
        config:
          scrape_configs:
            - job_name: 'otel-collector'
              scrape_interval: 10s
              static_configs:
                - targets: [ '0.0.0.0:8888' ]
    extensions:
      health_check:
      pprof:
        endpoint: :1888
      zpages:
        endpoint: :55679
    exporters:
      dynatrace:
        endpoint: "https://lbt93643.live.dynatrace.com/api/v2/metrics/ingest"
        api_token: "dt0c01.2****************************4****************************4****************************4"
      otlphttp:
        endpoint: "https://lbt93643.live.dynatrace.com/api/v2/otlp"
        headers: {"Authorization": "Api-Token dt0c01.2****************************4****************************4****************************4"}
      logging:
        loglevel: debug
      # Depending on where you want to export your trace, use the
      # correct OpenTelemetry trace exporter here.
      #
      # Refer to
      # https://github.com/open-telemetry/opentelemetry-collector/tree/main/exporter
      # and
      # https://github.com/open-telemetry/opentelemetry-collector-contrib/tree/main/exporter
      # for full lists of trace exporters that you can use, and how to
      # configure them.
      azuremonitor:
        instrumentation_key: "7****************************4a"
        endpoint: "https://centralus-2.in.applicationinsights.azure.com/v2/track"
      datadog:
        api:
          key: "f8****************************4"

    service:
      extensions: [pprof, zpages, health_check]
      pipelines:
        traces:
          receivers: [zipkin]
          # List your exporter here.
          exporters: [azuremonitor, datadog, otlphttp, logging]
        metrics:
          receivers: [prometheus]
          exporters: [dynatrace]
kind: ConfigMap
metadata:
  labels:
    app: opentelemetry
    component: otel-collector-conf
  name: otel-collector-conf
  namespace: default
I fired a few sample apps to generate traces.
While I could view them in Datadog, I did not see them show up in Dynatrace
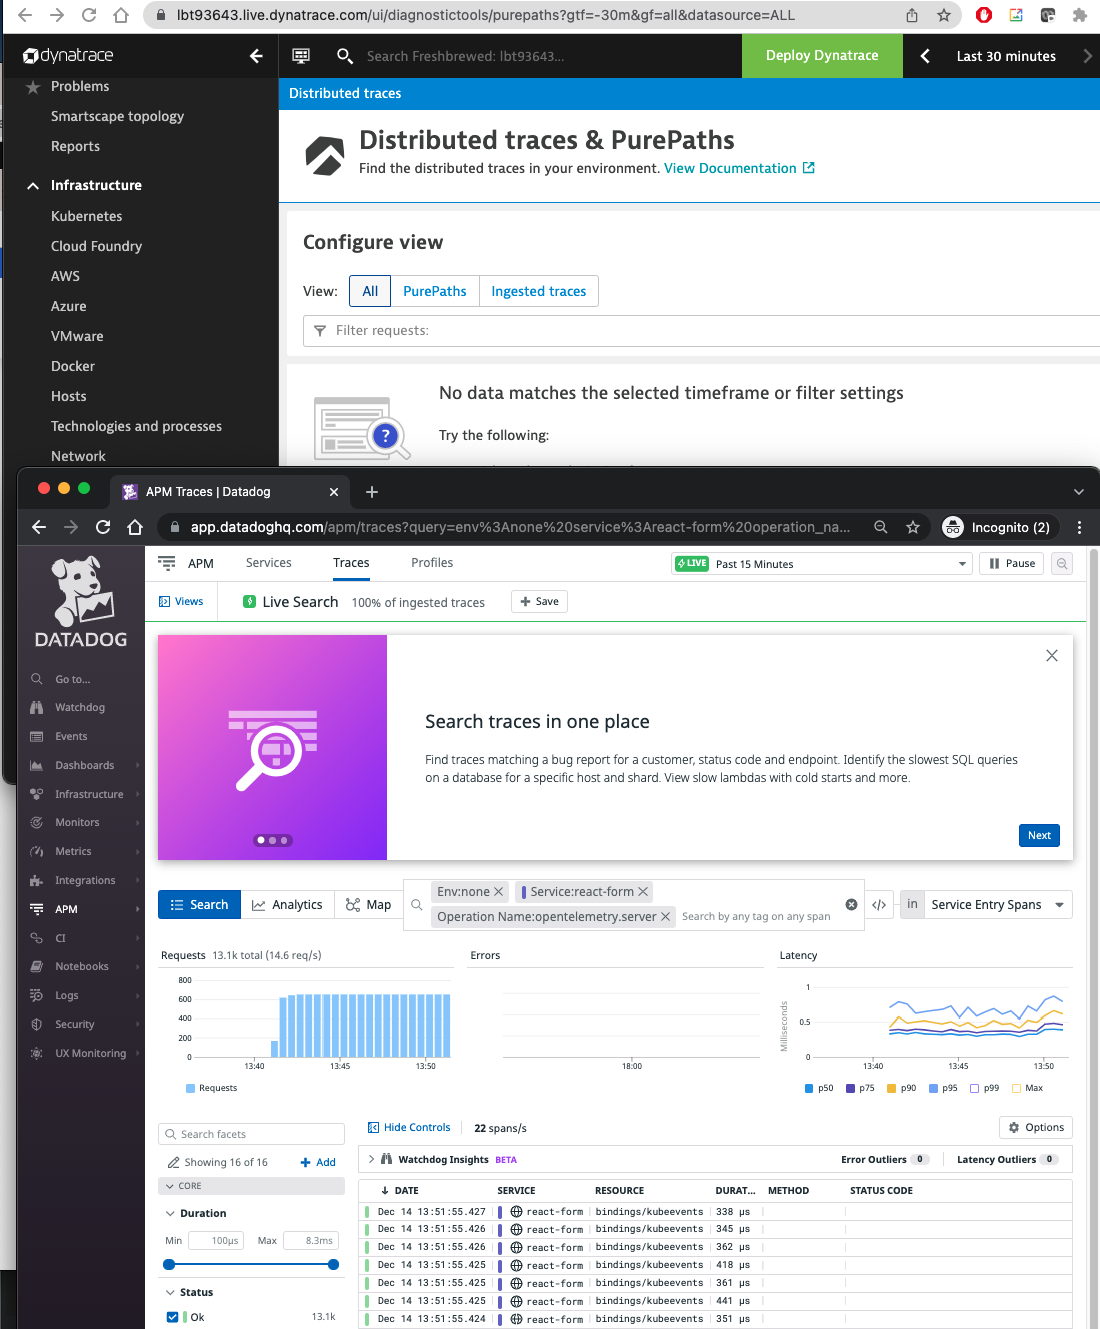
If I check the logs of the exporter, I see 403 auth errors from the OTLPHTTP endpoint
 kubectl logs otel-collector-85b54fbfdc-s4hfv | tail -n15
    Name           : bindings/kubeevents
    Kind           : SPAN_KIND_SERVER
    Start time     : 2021-12-14 19:54:05.493713 +0000 UTC
    End time       : 2021-12-14 19:54:05.495032 +0000 UTC
    Status code    : STATUS_CODE_UNSET
    Status message :
Attributes:
     -> db.connection_string: STRING(POST /kubeevents)
     -> db.name: STRING(kubeevents)
     -> db.system: STRING(bindings)
     -> opencensus.status_description: STRING(OK)
     -> rpc.service: STRING(Dapr)
     -> net.host.ip: STRING(10.42.1.10)

2021-12-14T19:54:07.829Z	info	exporterhelper/queued_retry.go:215	Exporting failed. Will retry the request after interval.	{"kind": "exporter", "name": "otlphttp", "error": "error exporting items, request to https://lbt93643.live.dynatrace.com/api/v2/otlp/v1/traces responded with HTTP Status Code 403", "interval": "41.003188794s"}
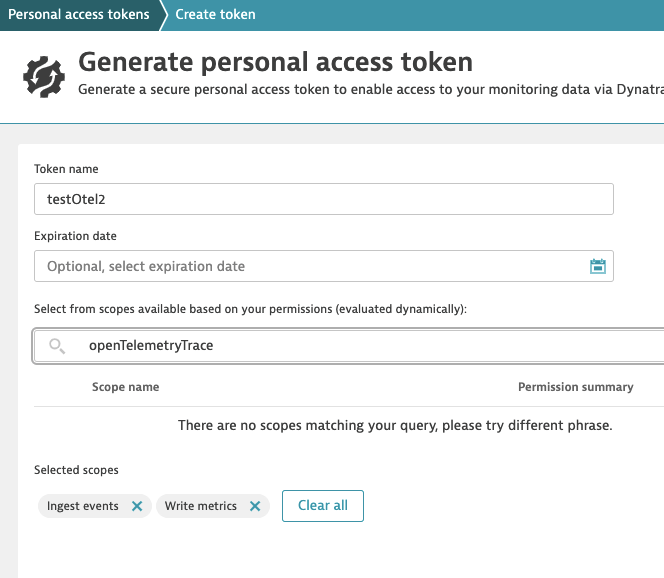
Ah, there is another scope we need to add for “openTelemetryTrace.ingest”
However there is no matching “openTelemetryTrace” in PAT scopes
But you have to use the REST API for some scopes. which is a whole other can of worms
https://www.dynatrace.com/support/help/dynatrace-api/environment-api/tokens-v2/api-tokens/post-token#definition–ApiTokenCreate
{
  "personalAccessToken": true,
  "expirationDate": "now+14d",
  "name": "tokenName",
  "scopes": [
    "metrics.write",
    "metrics.ingest",
    "events.ingest",
    "openTelemetryTrace.ingest"
  ]
}
In searching again I found a sub menu in API keys that might work
https://lbt93643.live.dynatrace.com/#settings/integration/apikeys;gf=all
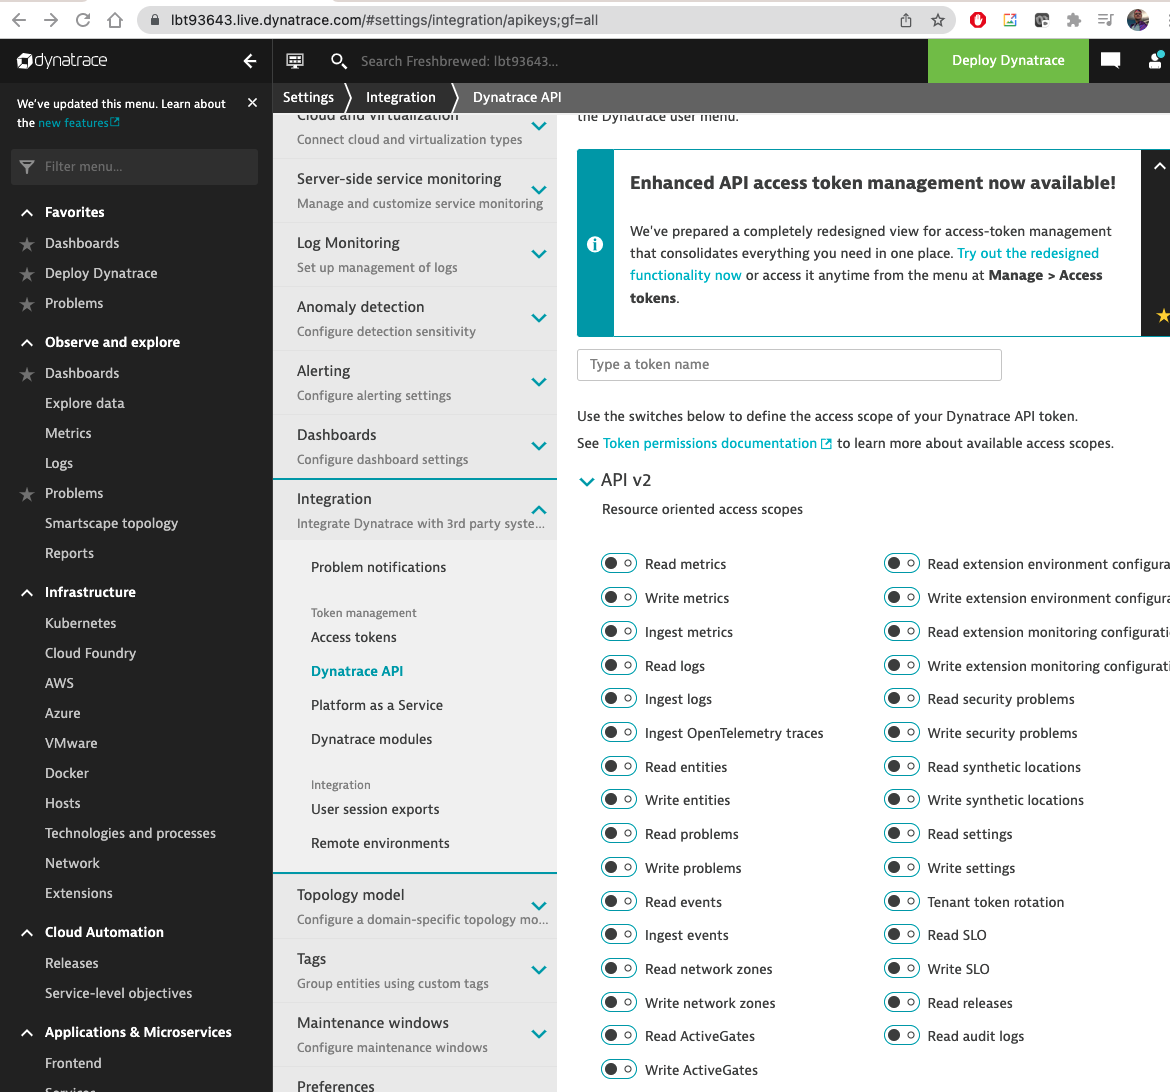
I’ll pick the scopes I desire
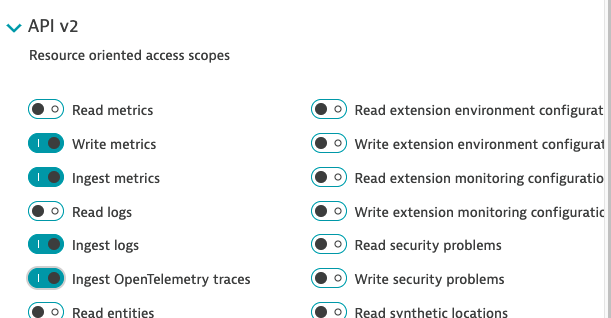
I updated the otel conf with the token and tried again:
$ kubectl apply -f otel.conf5
configmap/otel-collector-conf configured

$ kubectl get pods | grep otel
otel-collector-85b54fbfdc-s4hfv                         1/1     Running   0          24m

$ kubectl delete pod otel-collector-85b54fbfdc-s4hfv
pod "otel-collector-85b54fbfdc-s4hfv" deleted

$ kubectl get pods | grep otel
otel-collector-85b54fbfdc-7r2jx                         1/1     Running   0          84s
This time I saw no errors
$ kubectl logs otel-collector-85b54fbfdc-7r2jx  | tail -n15
    ID             : 5e39933166b5b5e9
    Name           : bindings/kubeevents
    Kind           : SPAN_KIND_SERVER
    Start time     : 2021-12-14 20:08:45.680315 +0000 UTC
    End time       : 2021-12-14 20:08:45.680961 +0000 UTC
    Status code    : STATUS_CODE_UNSET
    Status message :
Attributes:
     -> db.name: STRING(kubeevents)
     -> db.system: STRING(bindings)
     -> opencensus.status_description: STRING(OK)
     -> rpc.service: STRING(Dapr)
     -> db.connection_string: STRING(POST /kubeevents)
     -> net.host.ip: STRING(10.42.1.10)
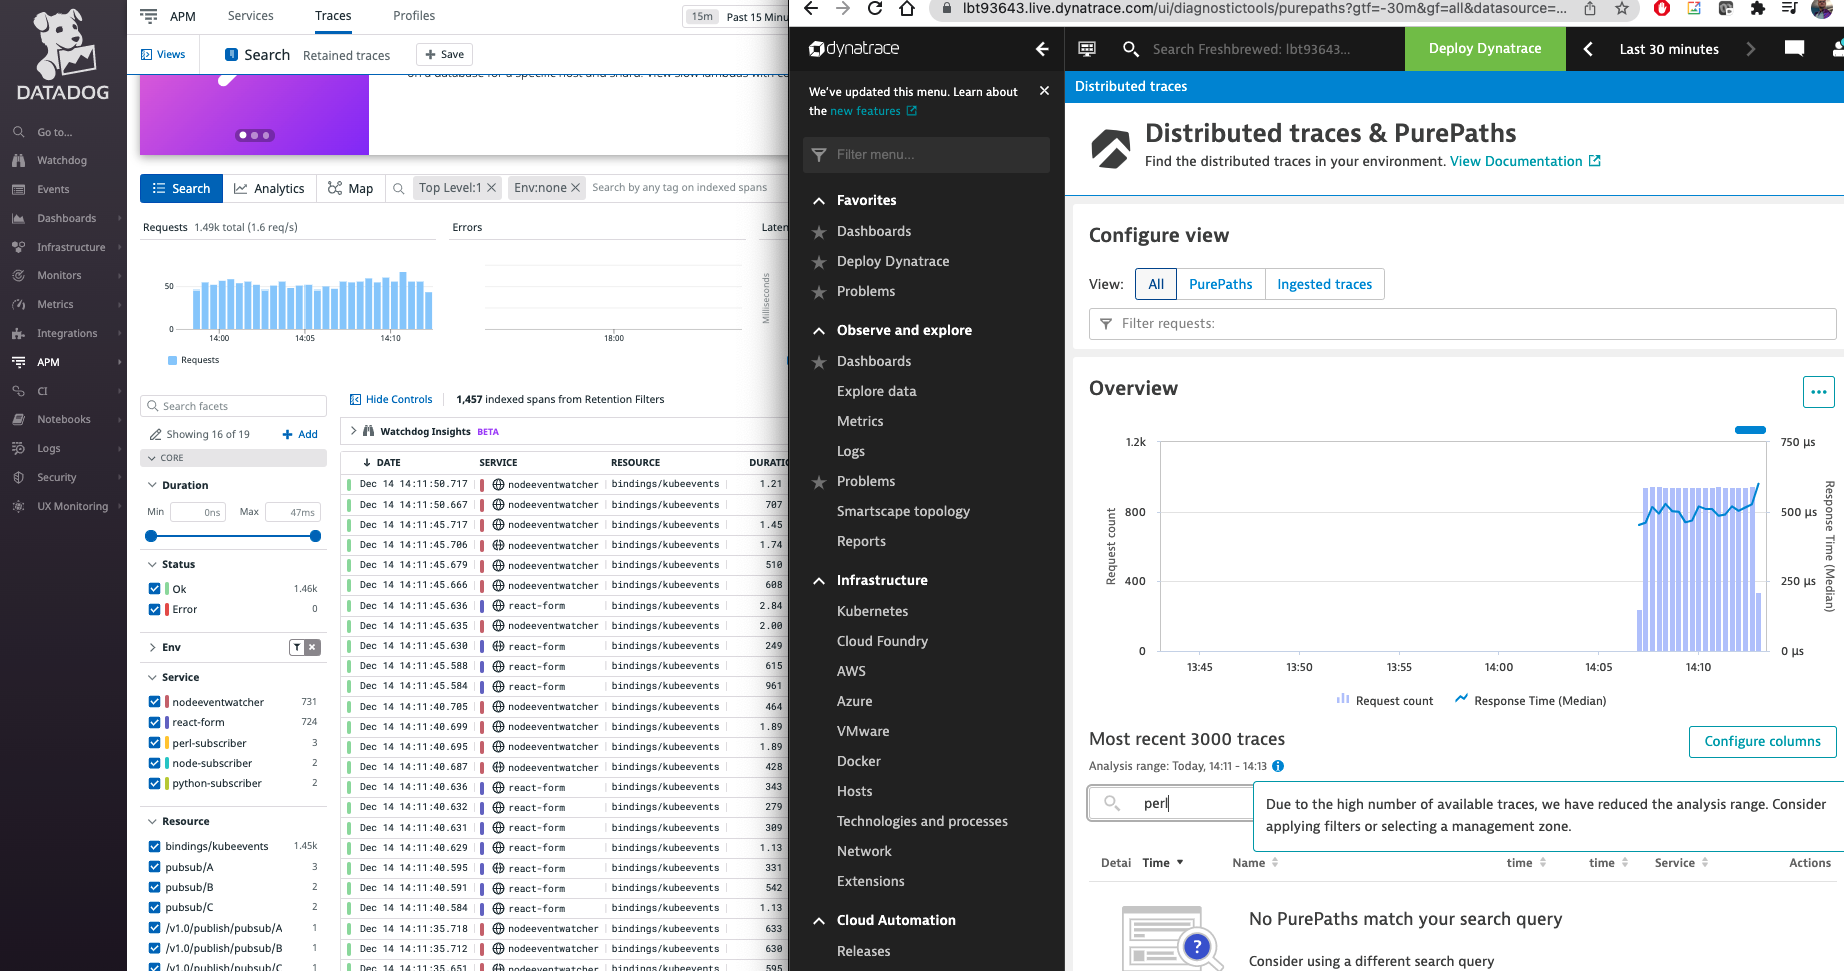
and we can see trace data
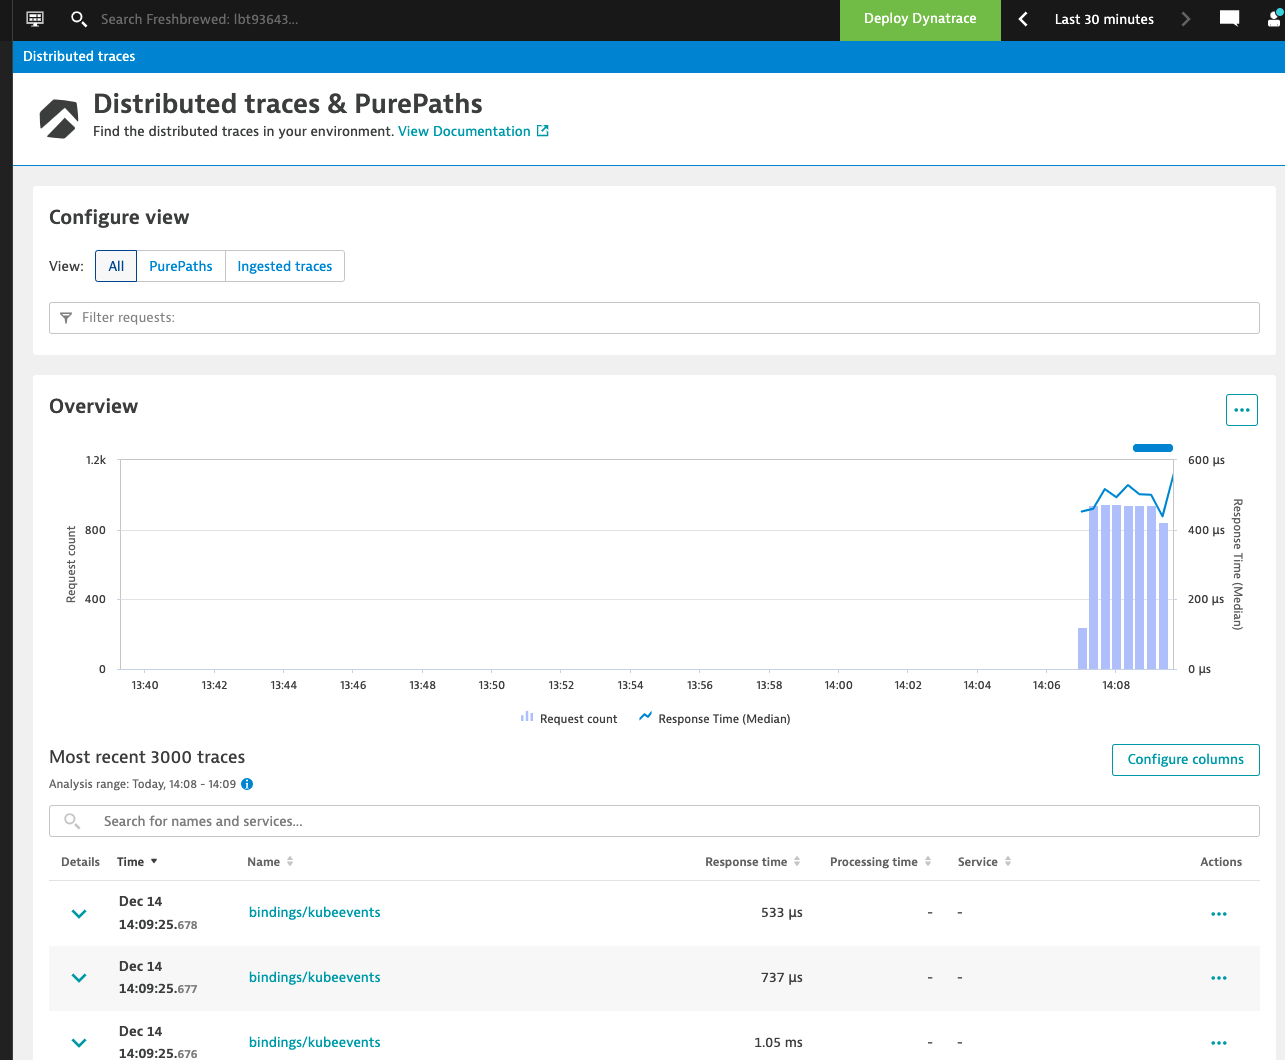
I used some local pods to push some traces out.
I immediately saw them in DD.. however even refreshing the page a few times, I could not see data from anything outside the kubeevents
Fresh AKS cluster
Let’s try a fresh AKS cluster:
$ export SP_ID=`cat SP_ID | tr -d '\n'`
$ export SP_PASS=`cat SP_PASS | tr -d '\n'`
$ az account set --subscription "Visual Studio Enterprise Subscription"
$ az group create -n idjaks02rg --location centralus
$ az aks create -g idjaks02rg -n idjaks02dt --location centralus  --network-plugin azure --network-policy azure --generate-ssh-keys --service-principal $SP_ID --client-secret $SP_PASS
...
Like before, we’ll “Add cluster” from the Infrastructure/Kubernetes window.
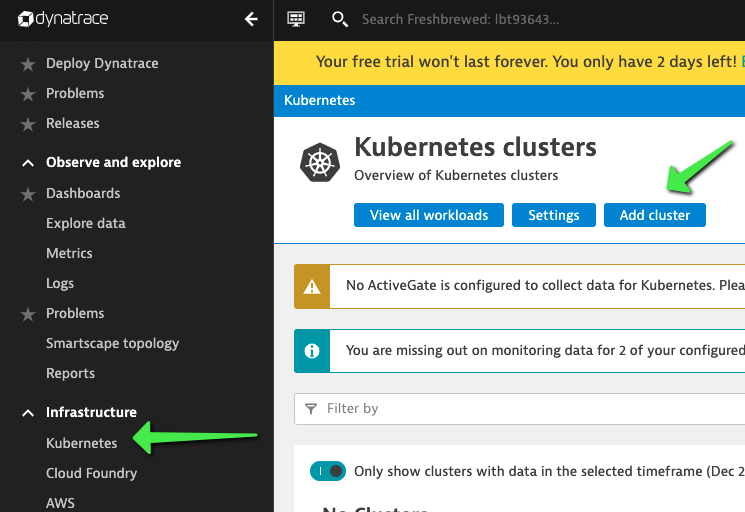
We click “create tokens” to create tokens then we can use the bash put in the copy window.
This assuems are logged in, so let’s login to the cluster then run the Dynatrace installer:
$ (rm -f ~/.kube/config || true) && az aks get-credentials -g idjaks02rg -n idjaks02dt --admin
Merged "idjaks02dt-admin" as current context in /Users/johnisa/.kube/config
$ wget https://github.com/dynatrace/dynatrace-operator/releases/latest/download/install.sh -O install.sh && sh ./install.sh --api-url "https://lbt93643.live.dynatrace.com/api" --api-token "dt0c01.asdfasdfasdfasdfasdfasdfasdfasdfasdfasdfasdfasdfasdf" --paas-token "dt0c01.asdfsadfasdfasdfasdfasdfasdfasdfasdfsadfasdf" --enable-volume-storage --cluster-name "FreshAKS02"

...

install.sh                                          100%[===================================================================================================================>]   8.40K  --.-KB/s    in 0s

2021-12-27 10:08:56 (35.7 MB/s) - ‘install.sh’ saved [8603/8603]


Check for token scopes...

Check if cluster already exists...

Creating Dynatrace namespace...
namespace/dynatrace created

Applying Dynatrace Operator...
customresourcedefinition.apiextensions.k8s.io/dynakubes.dynatrace.com created
mutatingwebhookconfiguration.admissionregistration.k8s.io/dynatrace-webhook created
serviceaccount/dynatrace-activegate created
serviceaccount/dynatrace-dynakube-oneagent created
serviceaccount/dynatrace-dynakube-oneagent-unprivileged created
serviceaccount/dynatrace-kubernetes-monitoring created
serviceaccount/dynatrace-operator created
serviceaccount/dynatrace-routing created
serviceaccount/dynatrace-webhook created
role.rbac.authorization.k8s.io/dynatrace-operator created
role.rbac.authorization.k8s.io/dynatrace-webhook created
clusterrole.rbac.authorization.k8s.io/dynatrace-kubernetes-monitoring created
clusterrole.rbac.authorization.k8s.io/dynatrace-operator created
clusterrole.rbac.authorization.k8s.io/dynatrace-webhook created
rolebinding.rbac.authorization.k8s.io/dynatrace-operator created
rolebinding.rbac.authorization.k8s.io/dynatrace-webhook created
clusterrolebinding.rbac.authorization.k8s.io/dynatrace-kubernetes-monitoring created
clusterrolebinding.rbac.authorization.k8s.io/dynatrace-operator created
clusterrolebinding.rbac.authorization.k8s.io/dynatrace-webhook created
service/dynatrace-webhook created
deployment.apps/dynatrace-operator created
deployment.apps/dynatrace-webhook created
validatingwebhookconfiguration.admissionregistration.k8s.io/dynatrace-webhook created
secret/dynakube created

Wait for webhook to become available
pod/dynatrace-webhook-78768bd789-w8rdf condition met

Applying DynaKube CustomResource...
CR.yaml:
----------
apiVersion: dynatrace.com/v1beta1
kind: DynaKube
metadata:
  name: dynakube
  namespace: dynatrace
spec:
  apiUrl: https://lbt93643.live.dynatrace.com/api
  skipCertCheck: false
  networkZone: FreshAKS02
  oneAgent:
    classicFullStack:
      tolerations:
      - effect: NoSchedule
        key: node-role.kubernetes.io/master
        operator: Exists

      args:
      - --set-host-group=FreshAKS02
      env:
      - name: ONEAGENT_ENABLE_VOLUME_STORAGE
        value: "true"
  activeGate:
    capabilities:
      - routing
      - kubernetes-monitoring
    group: FreshAKS02
----------
dynakube.dynatrace.com/dynakube created

Adding cluster to Dynatrace...
Kubernetes monitoring successfully setup.
I tried with persistence (thinking it might help with PVCs). But it just crashed;
$ kubectl get deployments --all-namespaces
NAMESPACE     NAME                 READY   UP-TO-DATE   AVAILABLE   AGE
dynatrace     dynatrace-operator   1/1     1            1           4m21s
dynatrace     dynatrace-webhook    1/1     1            1           4m21s
kube-system   coredns              2/2     2            2           10m
kube-system   coredns-autoscaler   1/1     1            1           10m
kube-system   metrics-server       1/1     1            1           10m
kube-system   tunnelfront          1/1     1            1           10m

$ kubectl get pods -n dynatrace
NAME                                  READY   STATUS             RESTARTS   AGE
dynakube-activegate-0                 1/1     Running            0          3m45s
dynakube-oneagent-492fl               0/1     CrashLoopBackOff   4          3m44s
dynakube-oneagent-cwqdv               0/1     CrashLoopBackOff   4          3m44s
dynakube-oneagent-p7csv               0/1     CrashLoopBackOff   4          3m44s
dynatrace-operator-8448d4556c-qxzk5   1/1     Running            0          4m38s
dynatrace-webhook-78768bd789-w8rdf    1/1     Running            0          4m38s

$ kubectl logs dynakube-oneagent-492fl -n dynatrace
16:13:41 Bootstrapping regular deployment
16:13:41 Started agent deployment as a container, PID 25624.
16:13:41 System version: Linux aks-nodepool1-25330612-vmss000000 5.4.0-1064-azure #67~18.04.1-Ubuntu SMP Wed Nov 10 11:38:21 UTC 2021 x86_64 x86_64 x86_64 GNU/Linux
16:13:41 Command line: --set-host-group=FreshAKS02 --set-network-zone=FreshAKS02 --set-host-property=OperatorVersion=v0.3.0 --set-deployment-metadata=orchestration_tech=Operator-classic_fullstack --set-deployment-metadata=script_version=v0.3.0 --set-deployment-metadata=orchestrator_id=38f25a5b-fa2f-4316-9839-93467ac8a47a --set-host-id-source=auto
16:13:41 Installed version:
16:13:41 ONEAGENT_INSTALLER_SCRIPT_URL=
16:13:41 ONEAGENT_INSTALLER_DOWNLOAD_TOKEN=
16:13:41 ONEAGENT_INSTALLER_DOWNLOAD_VERBOSE=
16:13:41 ONEAGENT_INSTALLER_SKIP_CERT_CHECK=
16:13:41 ONEAGENT_ENABLE_VOLUME_STORAGE=true
16:13:41 ONEAGENT_CONTAINER_STORAGE_PATH=
16:13:41 ONEAGENT_NO_REMOUNT_ROOT=
16:13:41 ONEAGENT_ADDITIONAL_UNMOUNT_PATTERN=
16:13:41 ONEAGENT_DISABLE_CONTAINER_INJECTION=
16:13:41 ONEAGENT_READ_ONLY_MODE=
16:13:41 AGENT_CONTAINER_IMAGE_VERSION=1.229.65.20211018-111427
16:13:41 Path: /usr/sbin:/usr/bin:/sbin:/bin:/usr/local/sbin:/usr/local/bin:/usr/sbin:/usr/bin:/sbin:/bin
16:13:41 Started with capabilities: Capabilities for `self': = cap_chown,cap_dac_override,cap_dac_read_search,cap_fowner,cap_fsetid,cap_kill,cap_setgid,cap_setuid,cap_net_admin,cap_net_raw,cap_sys_chroot,cap_sys_ptrace,cap_sys_admin,cap_sys_resource,cap_setfcap+eip
16:13:41 Started with user: uid=0(root) gid=0(root) groups=0(root)
16:13:41 Using pre-packed installer, no download from external location will be performed.
16:13:41 Using volume-based storage
16:13:41 Initializing volume-based storage from within the container
16:13:41 Error: Cannot create self-initialized volume: container management CLI tool not detected
16:13:41 Error: Initialization procedure failed
However, the uninstall didn’t work. My only recourse was to redo the cluster.
$ kubectl delete -n dynatrace oneagent --all
error: the server doesn't have a resource type "oneagent"
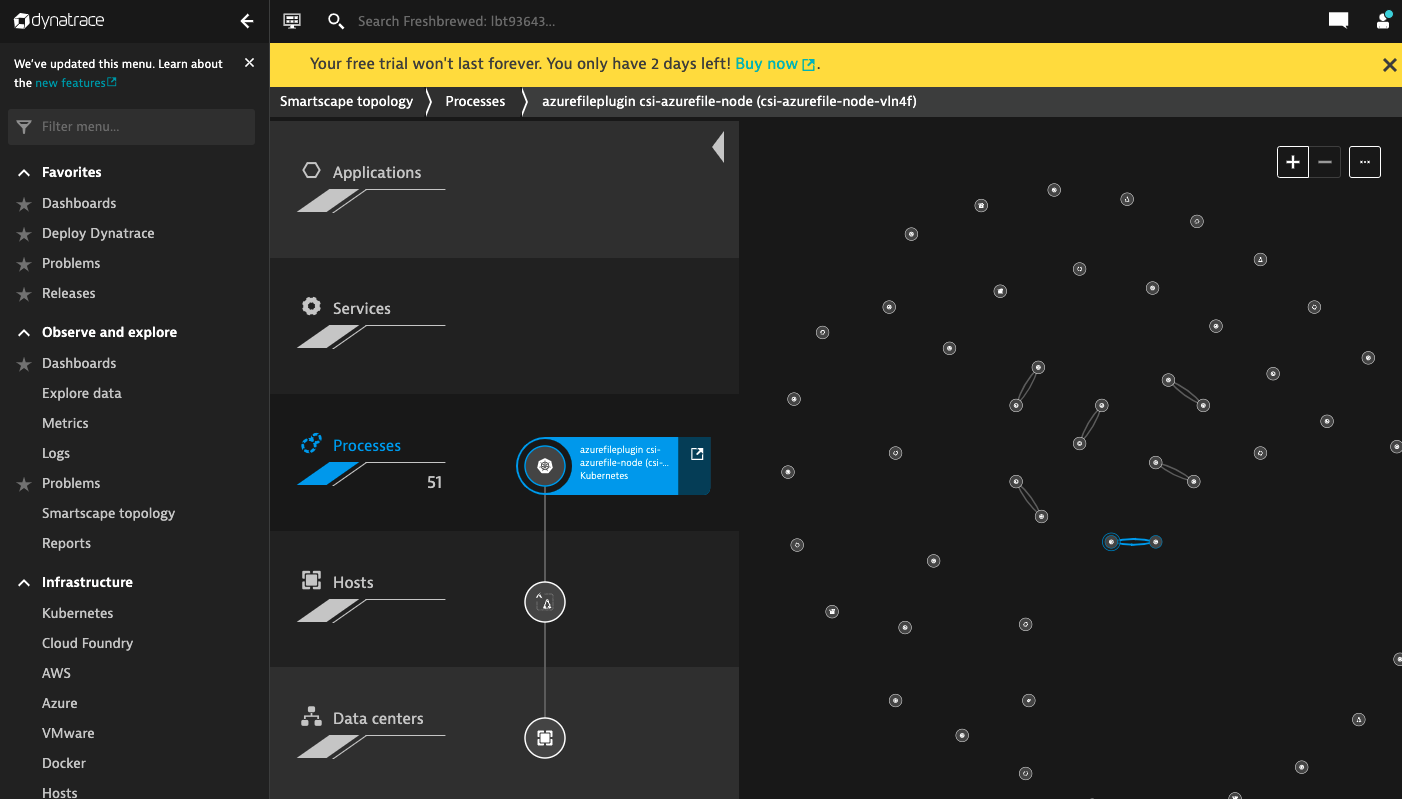
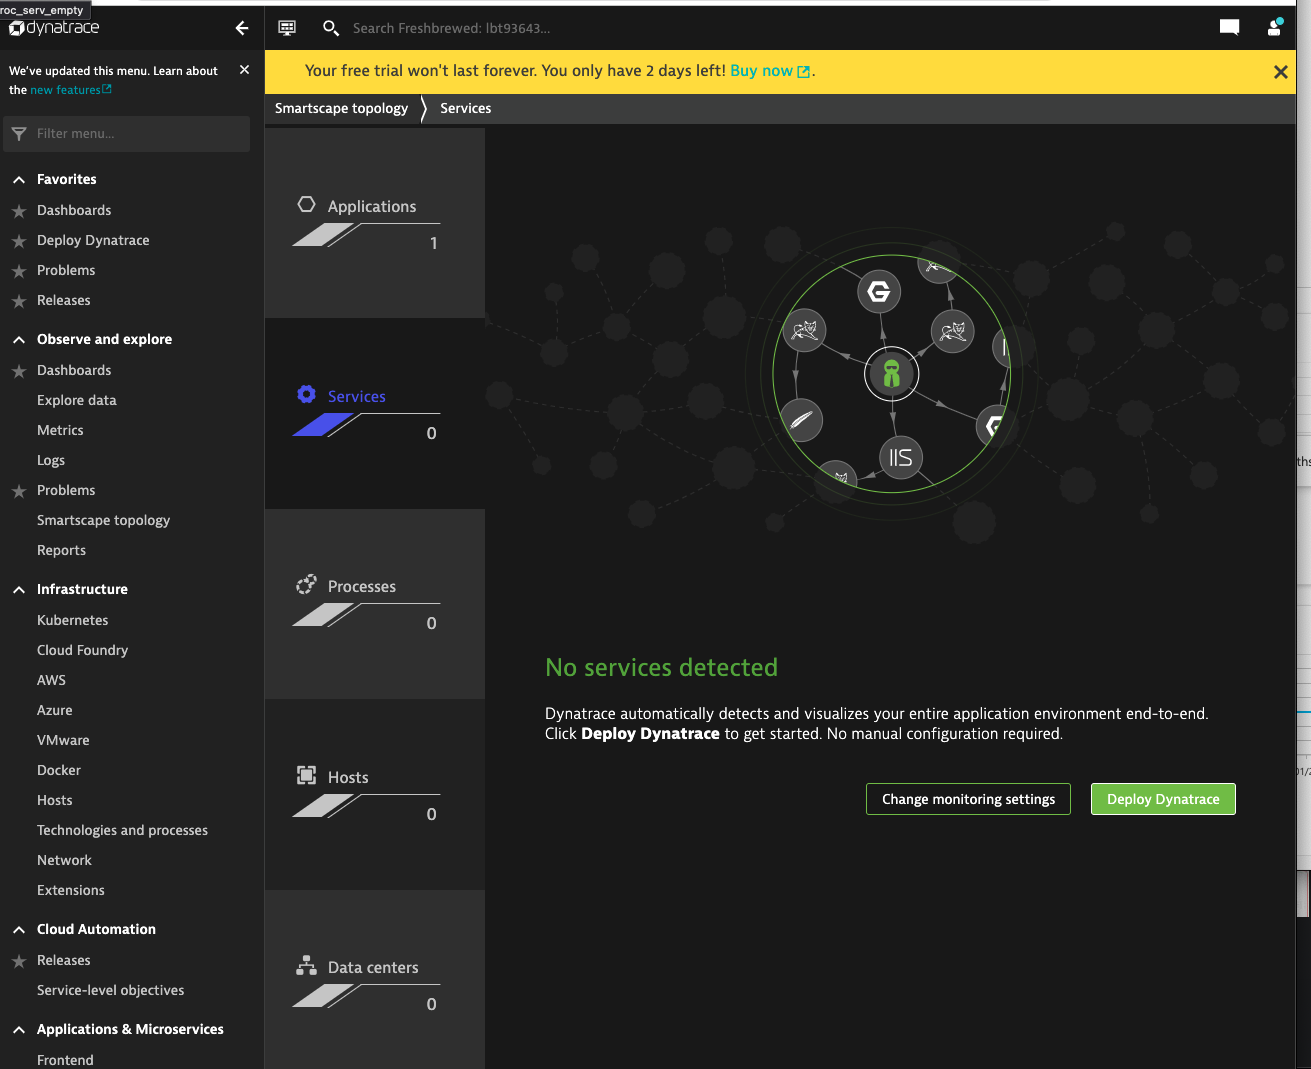
I can now see the basic hosts and processes in the Smartscape Topology
I had to find some buried menus to enable metrics.. And it requires Dynatrace SaaS to talk back to the Agent to enable
Installing a sample app:
$ helm repo add azure-samples https://azure-samples.github.io/helm-charts/
"azure-samples" already exists with the same configuration, skipping

$ helm repo update
Hang tight while we grab the latest from your chart repositories...
...Successfully got an update from the "azure-samples" chart repository
...Successfully got an update from the "datadog" chart repository
...Successfully got an update from the "cribl" chart repository
...Successfully got an update from the "actions-runner-controller" chart repository
...Successfully got an update from the "chrdemo" chart repository
...Successfully got an update from the "bitnami" chart repository
Update Complete. ⎈Happy Helming!⎈

$ helm install azure-samples/azure-vote --generate-name
NAME: azure-vote-1640623825
LAST DEPLOYED: Mon Dec 27 10:50:28 2021
NAMESPACE: default
STATUS: deployed
REVISION: 1
TEST SUITE: None
NOTES:
The Azure Vote application has been started on your Kubernetes cluster.

Title: Azure Vote App
Vote 1 value: Cats
Vote 2 value: Dogs

The externally accessible IP address can take a minute or so to provision. Run the following command to monitor the provisioning status. Once an External IP address has been provisioned, brows to this IP address to access the Azure Vote application.

kubectl get service -l name=azure-vote-front -w
I tried turning on “Monitor” (from default) on some services, including the vote app
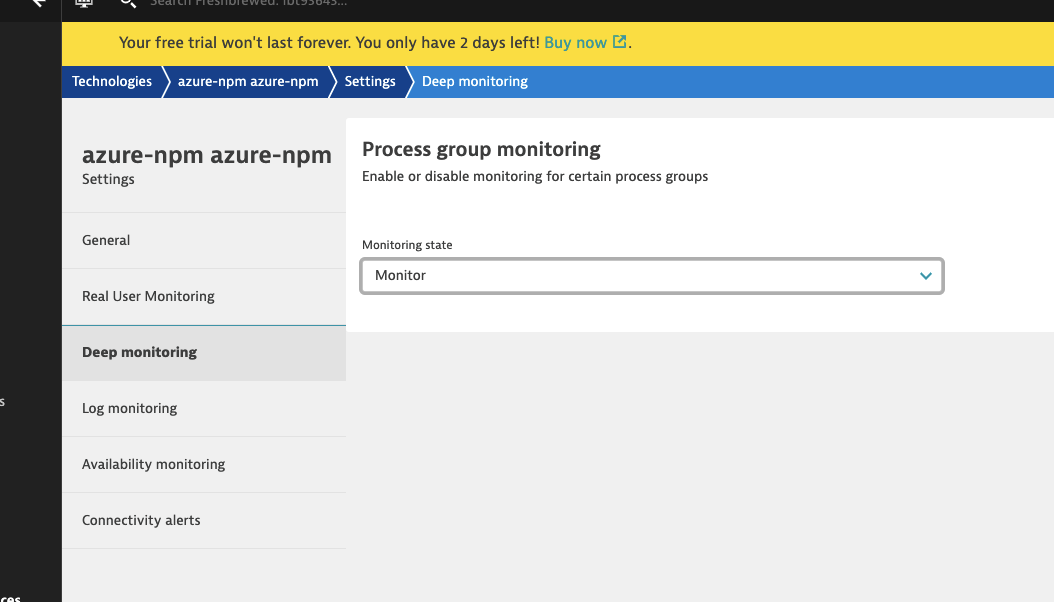
And after a while I saw some service details show up in Smartscape
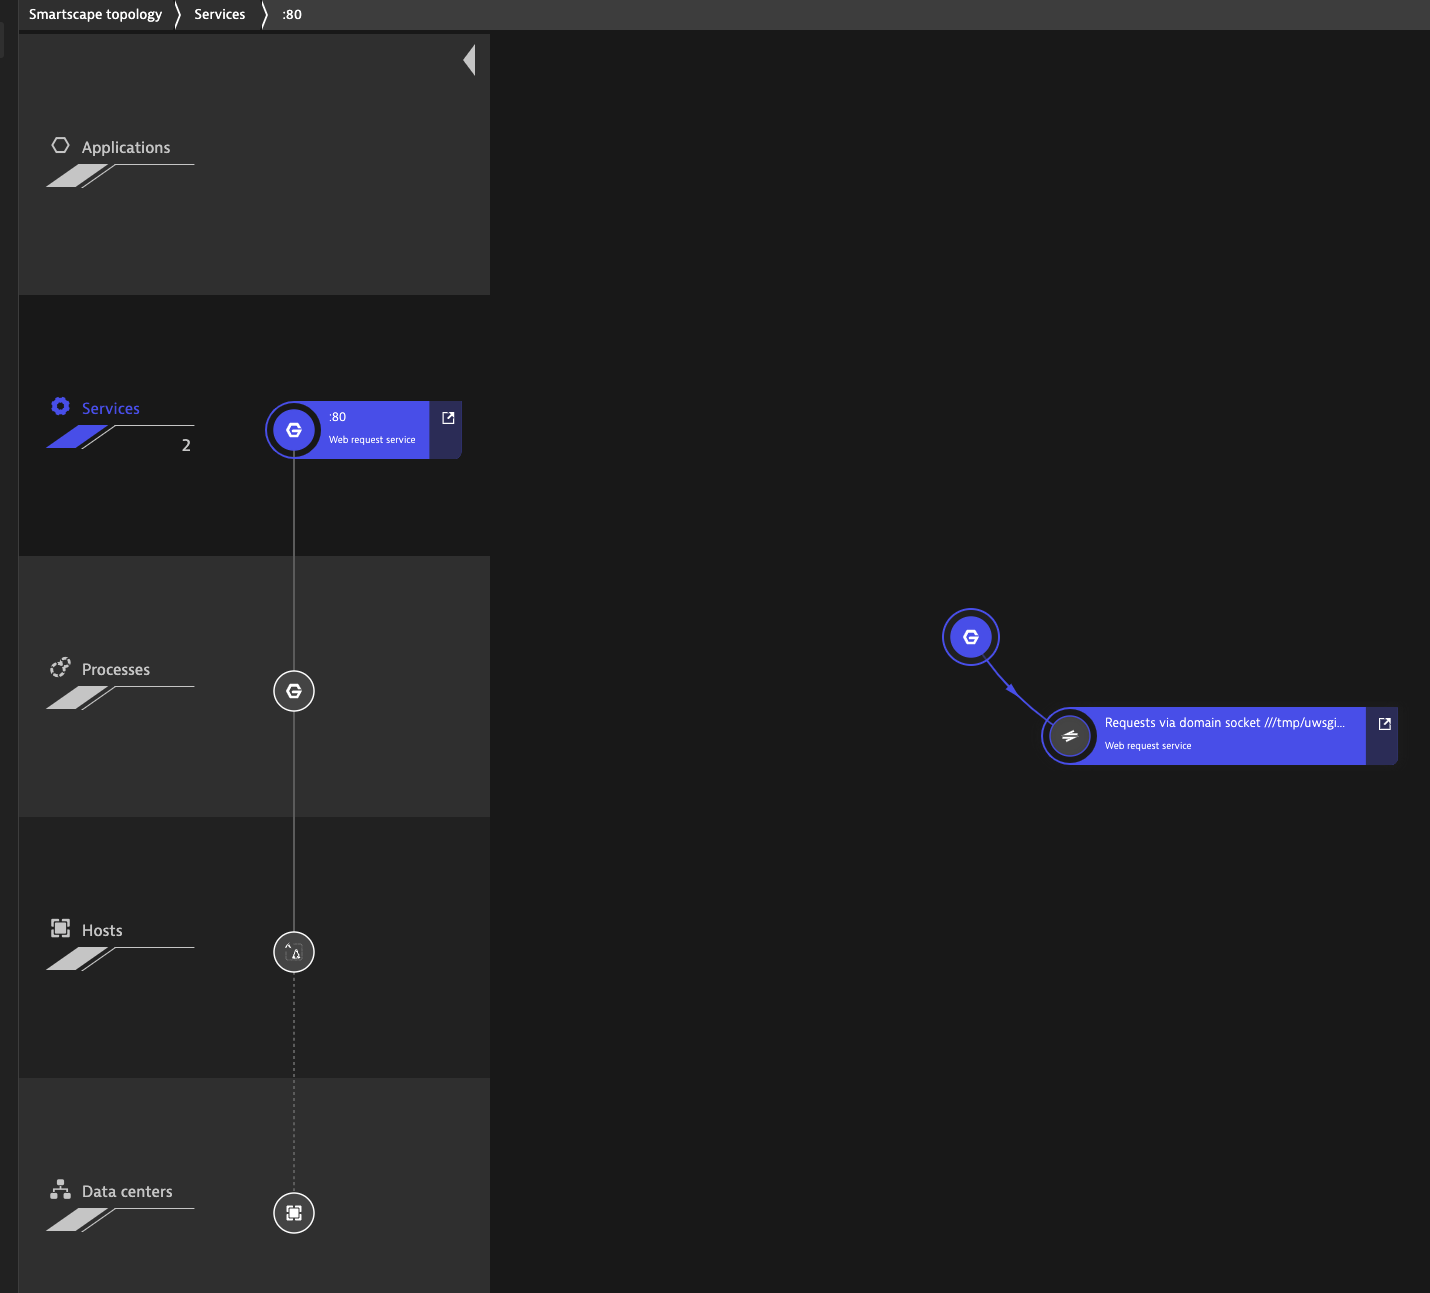
However there is not much to see as far as details
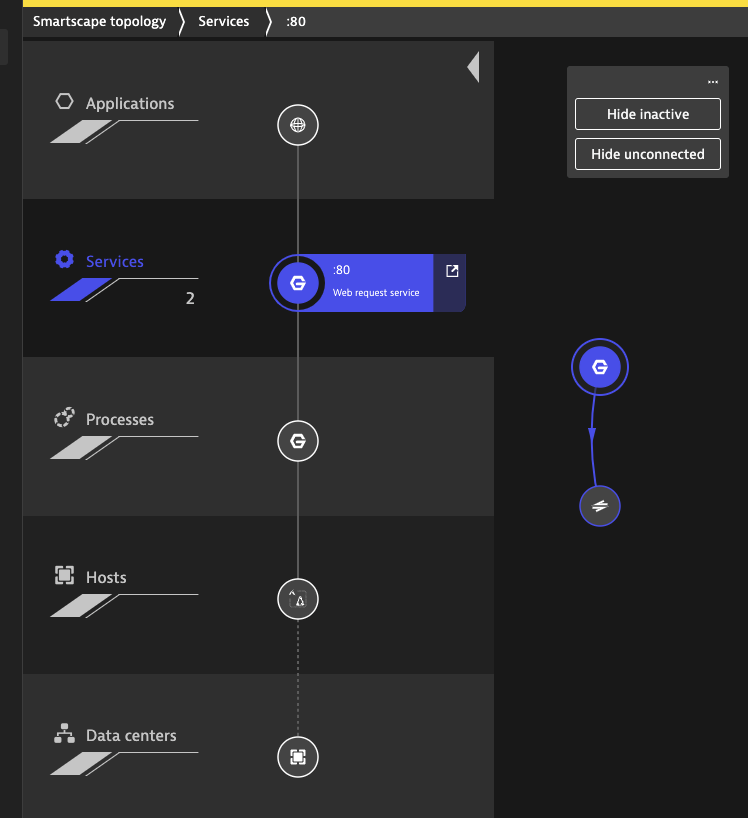
We can see (after hitting the endpoint a few times) that Dynatrace does map the connection between the Azure Frontend and Backend pods
And to illustrate the automatic Trace instrumentation, we see the endpoints I hit on the Vote app:
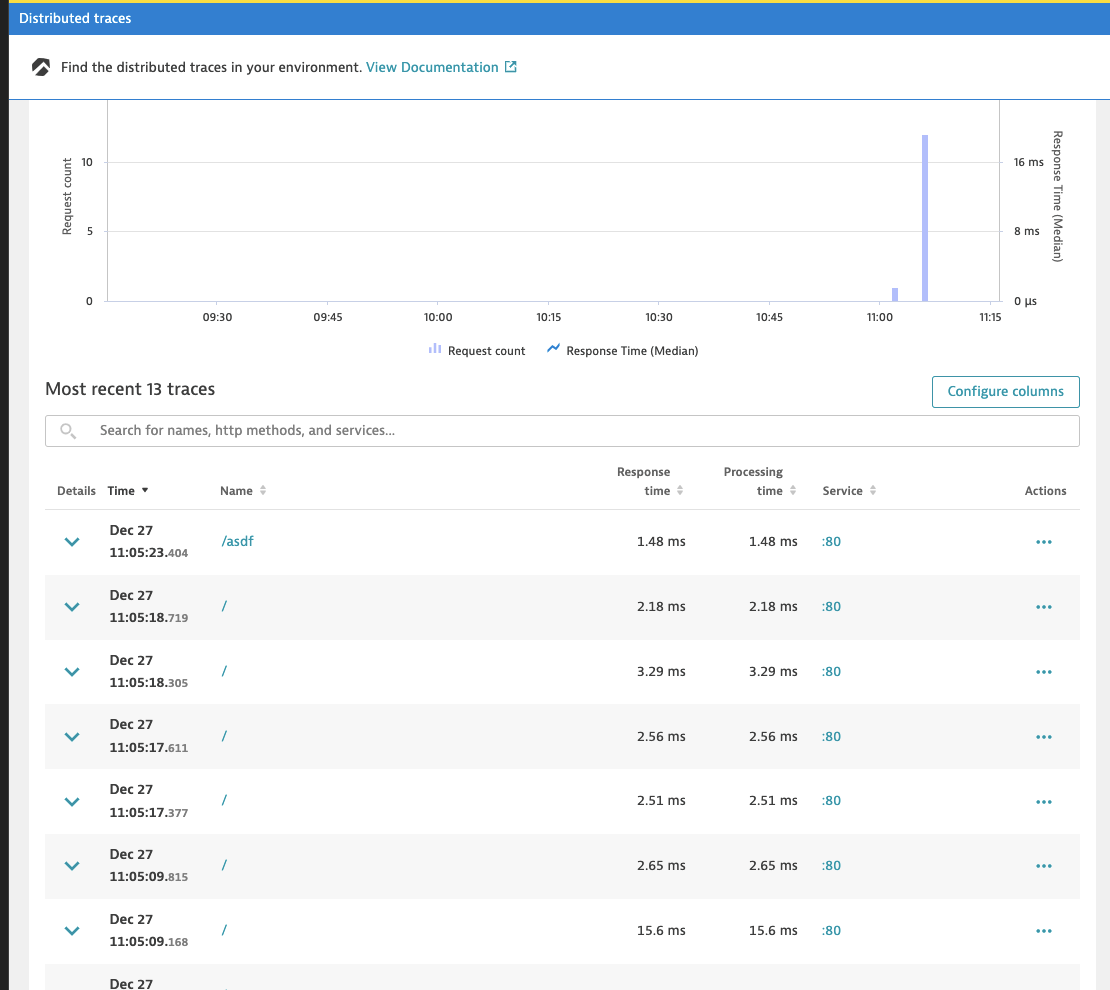
and details
Let’s now add Istio and the Istio book app
$ curl -L https://istio.io/downloadIstio | sh -
  % Total    % Received % Xferd  Average Speed   Time    Time     Time  Current
                                 Dload  Upload   Total   Spent    Left  Speed
100   102  100   102    0     0    228      0 --:--:-- --:--:-- --:--:--   274
100  4549  100  4549    0     0   6787      0 --:--:-- --:--:-- --:--:--  6787

Downloading istio-1.12.1 from https://github.com/istio/istio/releases/download/1.12.1/istio-1.12.1-osx.tar.gz ...
Istio 1.12.1 Download Complete!

Istio has been successfully downloaded into the istio-1.12.1 folder on your system.

Next Steps:
See https://istio.io/latest/docs/setup/install/ to add Istio to your Kubernetes cluster.

To configure the istioctl client tool for your workstation,
add the /Users/johnisa/Workspaces/dynatraceTest/istio-1.12.1/bin directory to your environment path variable with:
	 export PATH="$PATH:/Users/johnisa/Workspaces/dynatraceTest/istio-1.12.1/bin"

Begin the Istio pre-installation check by running:
	 istioctl x precheck

Need more information? Visit https://istio.io/latest/docs/setup/install/

$ cd istio-1.12.1/
$ export PATH=$PWD/bin:$PATH

$ istioctl install --set profile=demo -y
✔ Istio core installed
✔ Istiod installed
✔ Egress gateways installed
✔ Ingress gateways installed
✔ Installation complete                                                                                                                                    Making this installation the default for injection and validation.

Thank you for installing Istio 1.12.  Please take a few minutes to tell us about your install/upgrade experience!  https://forms.gle/Fasdf

$ kubectl label namespace default istio-injection=enabled
namespace/default labeled


$ kubectl apply -f https://raw.githubusercontent.com/istio/istio/release-1.12/samples/bookinfo/platform/kube/bookinfo.yaml
service/details created
serviceaccount/bookinfo-details created
deployment.apps/details-v1 created
service/ratings created
serviceaccount/bookinfo-ratings created
deployment.apps/ratings-v1 created
service/reviews created
serviceaccount/bookinfo-reviews created
deployment.apps/reviews-v1 created
deployment.apps/reviews-v2 created
deployment.apps/reviews-v3 created
service/productpage created
serviceaccount/bookinfo-productpage created
deployment.apps/productpage-v1 created

$ kubectl apply -f https://raw.githubusercontent.com/istio/istio/release-1.12/samples/bookinfo/networking/bookinfo-gateway.yaml
gateway.networking.istio.io/bookinfo-gateway created
virtualservice.networking.istio.io/bookinfo created

$ kubectl -n istio-system get service istio-ingressgateway -o jsonpath='{.status.loadBalancer.ingress[0].ip}'
13.89.107.162
I’ll browse http://13.89.107.162/productpage a bit to generate some traffic in the Cluster.
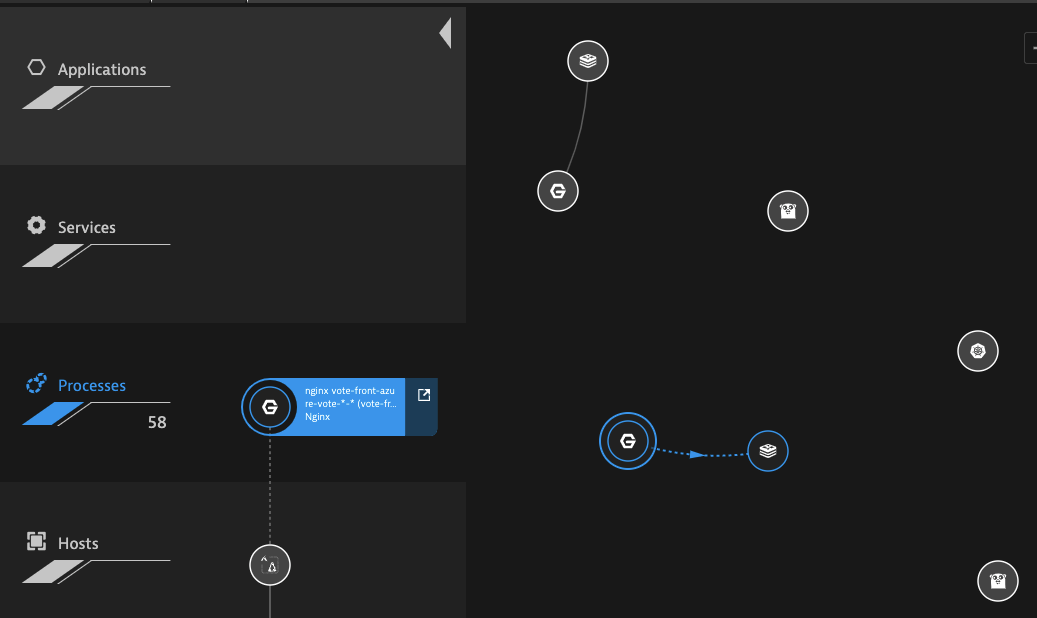
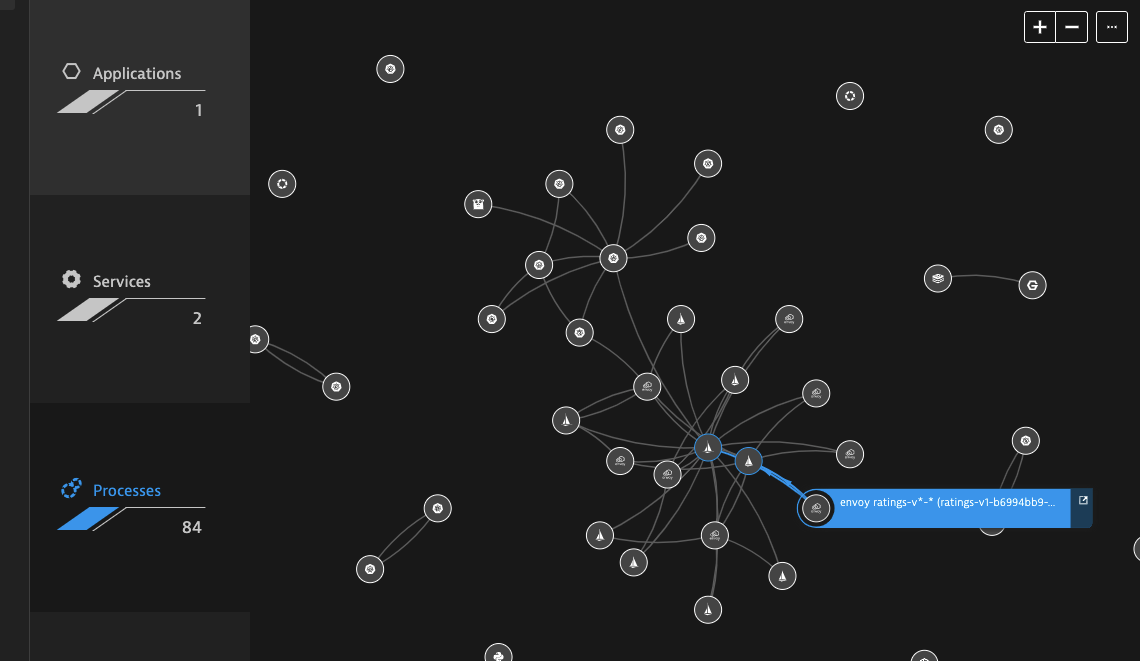
We can see the services as they interrelate in the Processes section of Smartscape Topology
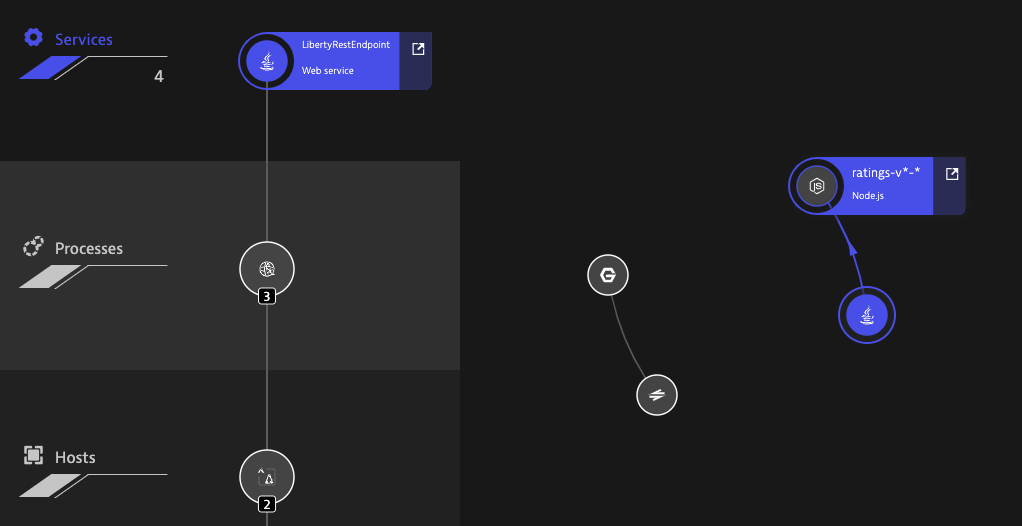
and we can see at least two services added to the Services section of Smartscape
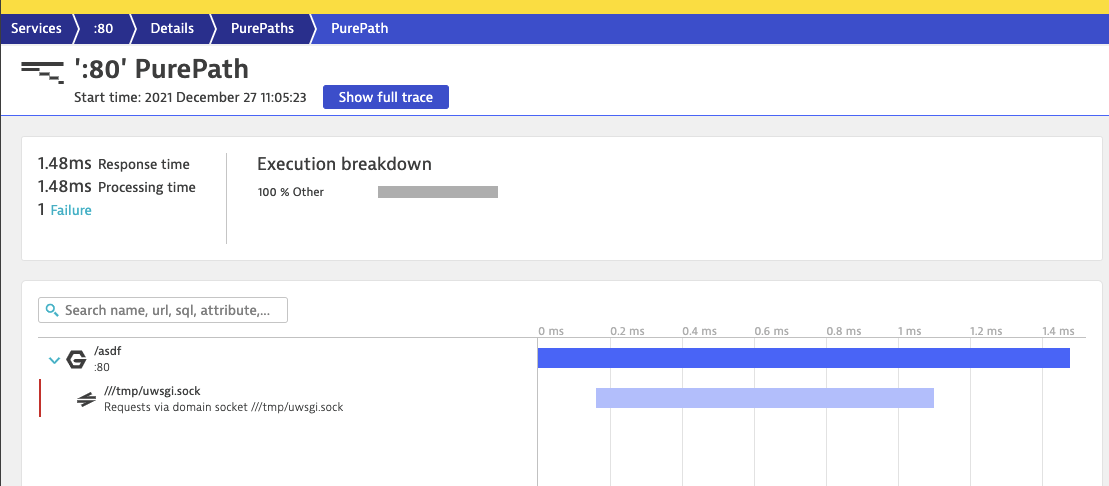
And while the traces don’t show all the nested details as I would expect from the istio documentation, I do see instrumentation of the underlying NodeJS container as done via PurPaths
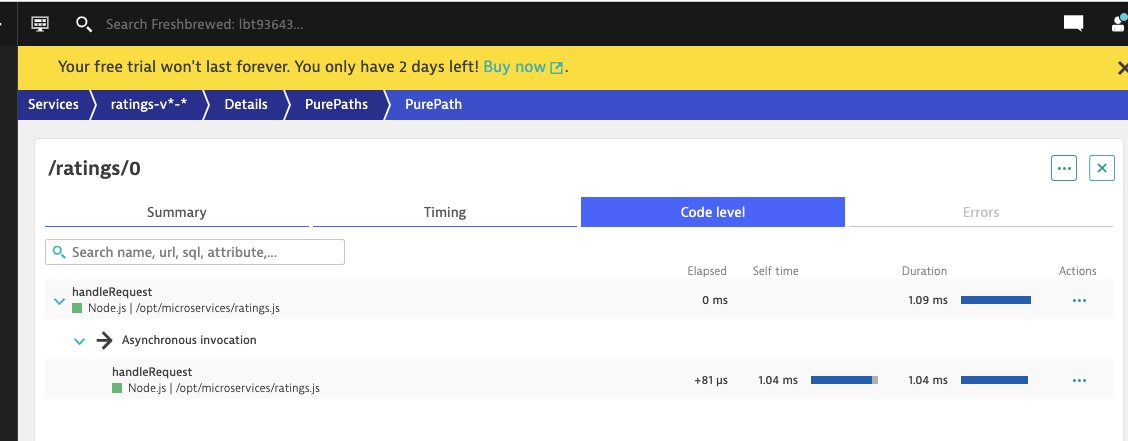
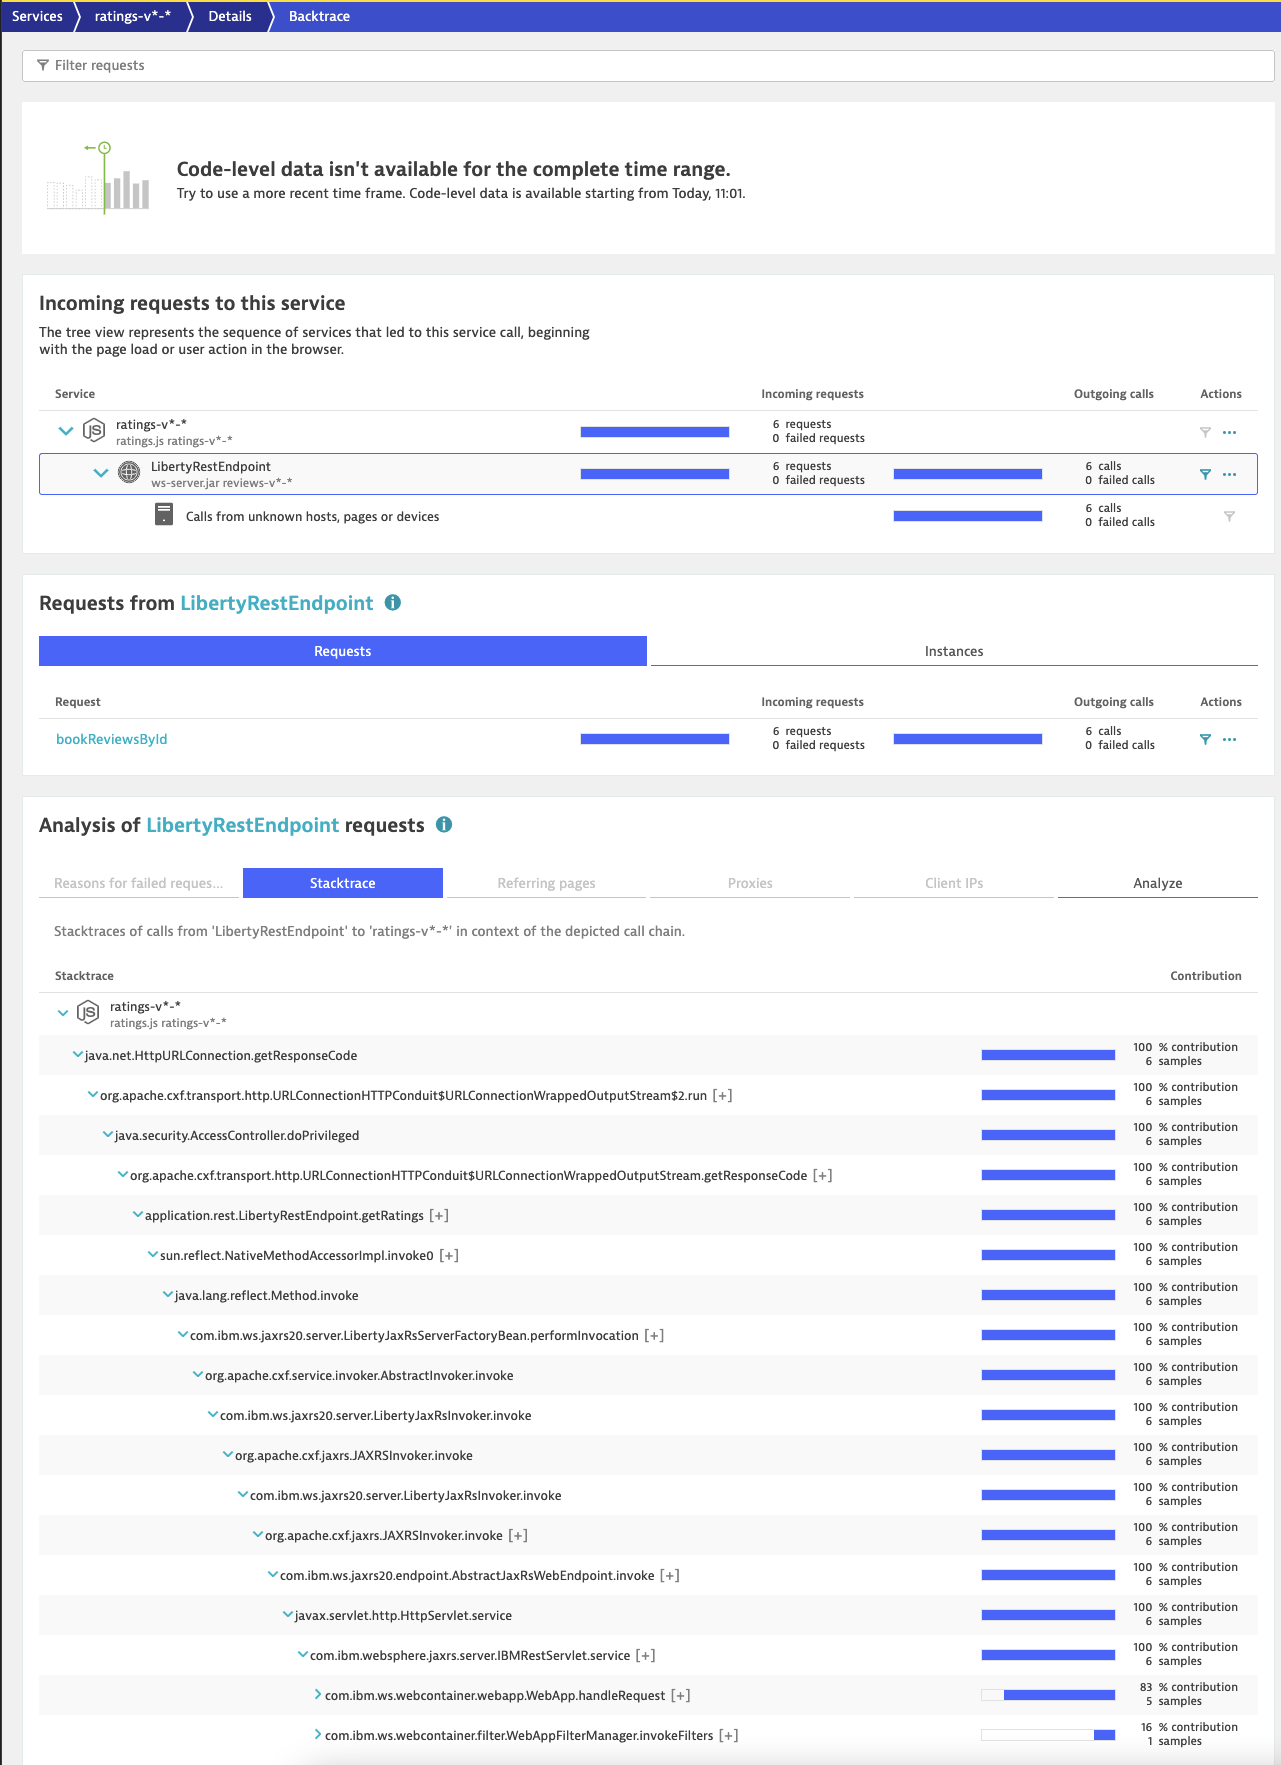
If we go into Backtrace, we can see how the Java App calls break down as traced from the frontend:
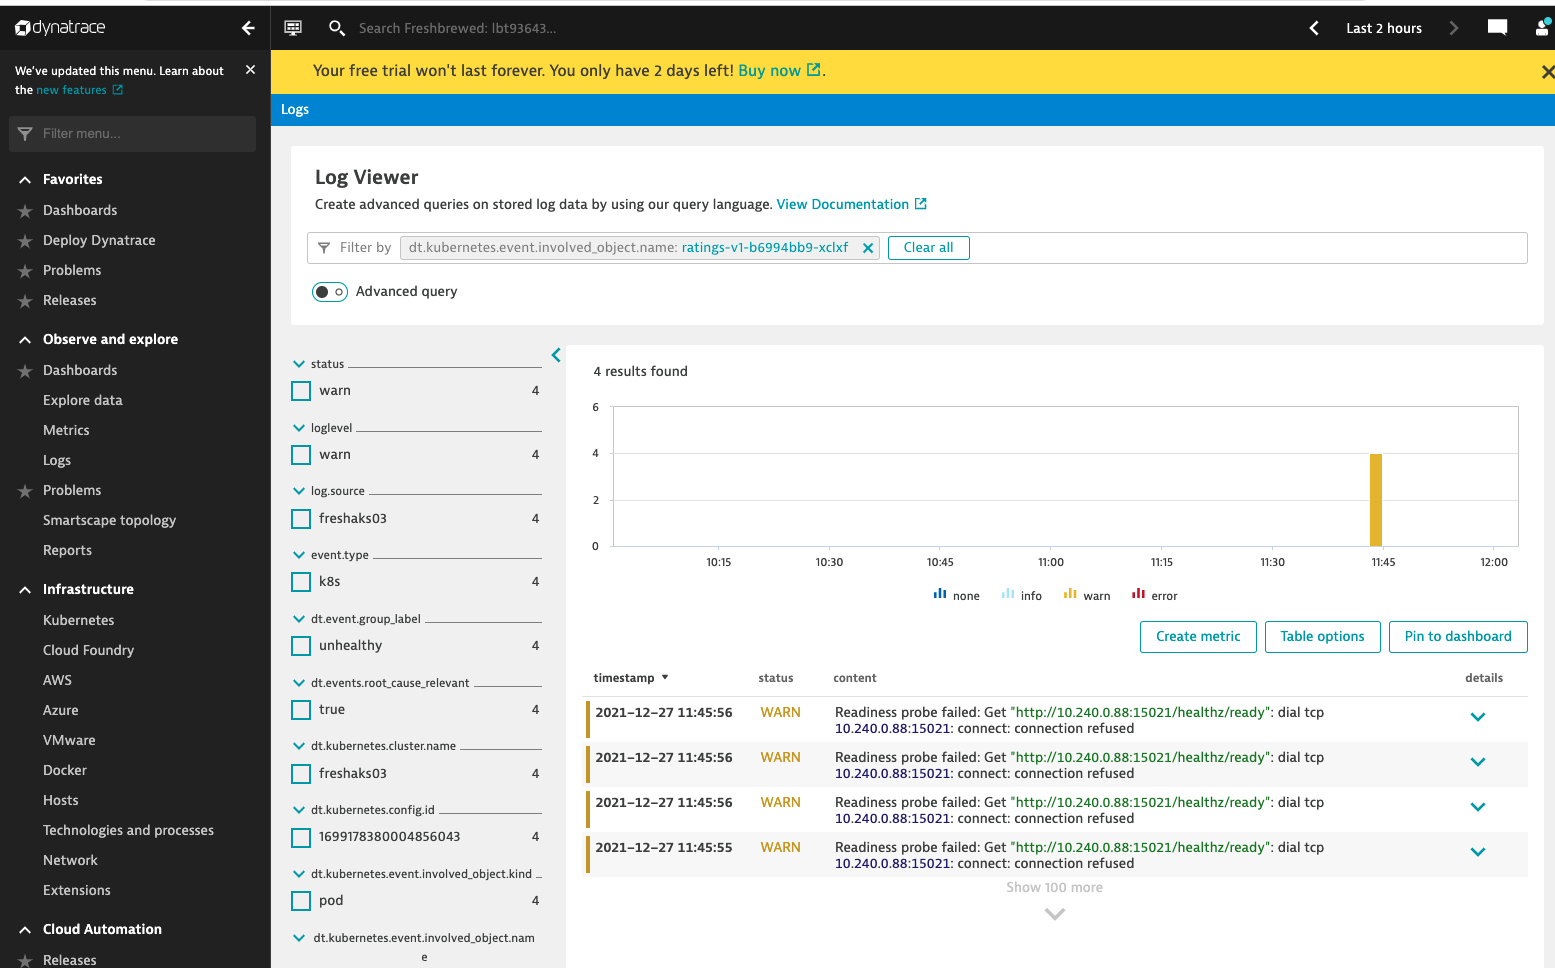
I should point out, as I really haven’t touched on it yet, that there are of course logs as well:
Demos with Techs
I had a chance to meet with Sales and some very solid Techs to review their offering.
They have detailed AAT testing windows that can show where and when errors happened. The most impressive feature I saw was a timeline showing an incident and how it interconnected the services affected
(please forgive small screenshot, error in capture)
But as shown above the slider can show what was affected through the duration of an incident. The connections made with their AI engine behind the scenes.
They also focused on Anomoly detection (again AI/ML) that finds ‘out of norms’ automatically.
The techs also answered my questions on Networking and Service Mapping.
Lastly, they told me they could instrument code in containers without recompiling. I flat out told them in a big call that “i don’t believe you”. So we enabled that feature and I was blown away to see my NodeJS React container actually instrumented with OneAgent without recompiling (just needed to enable feature and bounce my pods). I, frankly, still cannot understand how they did that. (see the example above in AKS section using backtrace on Istio Book sample app)
Summary
Overall Dyantrace is a pretty rich suite and I’m certain I only glossed the surface of the offering. However, I am somewhat limited by the trial. That is, there is no free tier. Which means when my trial expires that will be it.
I find this to be a big problem as the major competitors all have a free or community tier which lets developers such as myself continue to test features, even if confined in a hobbled or very scaled back account. When a company has a “try it, now you must buy it”, it better be absolutely over the top amazing.
Another of the challenges I found was that the documentation did not match the UI. I continually had to do searches and finds. Menus to enable features were buried in many nested menus or cluster configurations that had to be adjusted in the SaaS UI.
At first I complained that the trace data does not match what I could get in Azure ALM, Datadog or New Relic. With some tweaking (and help from a Tech) I did manage to collect service maps as I desired under a “Smartscape Topology” area. However, that seems to be a live (or recent) mapping as they have since dissappared.
In the end, for my own K3s, I had to remove Dynatrace since the auto-instrumentation was taking down my Github action runners. (they stopped talking to Github.. when Dyantrace OneAgent removed and containers rotated, we were fine again.. i think it might be the comlexity of the dual container pod with a DinD sidecar)
Lastly, the pricing is confusing to me. When I look at the pricing page:
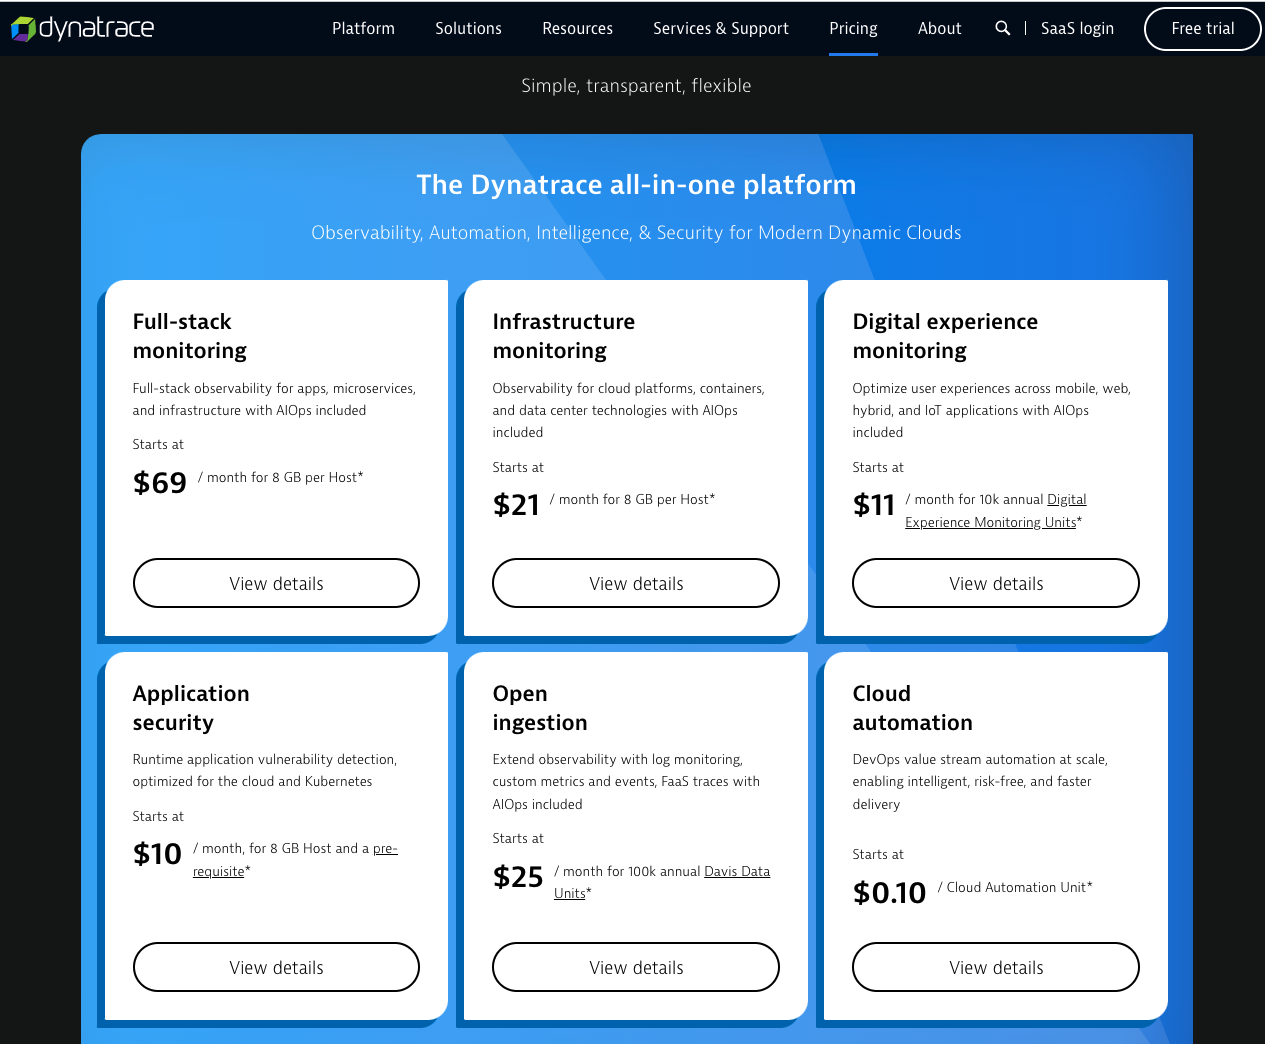
The prices are for what appears to be varied tiers of monitoring. It uses things like a Digital Experience Monitoring (DEM) Unit:
“Dynatrace Synthetic Monitoring, Real User Monitoring, and Session Replay are flexibly consumed based on Digital Experience Management (DEM) units. The amount of DEM Units you need depends on how many synthetic monitors you want to run and how many user sessions you need to monitor.”
And a “Davis Data Unit (DDU)”:
Dynatrace Log Monitoring Custom Metrics and Events, and FaaS Traces are flexibly consumed on Davis Data Units (DDUs). The amount of DDUs you need depends on the volume of external data you ingest into the platform. For example, number of log lines and events, number of custom metrics from cloud services, etc.
It’s fine to say something costs $11/mo (annually, no idea monthly) for a 10k “DEMs” when really I have no idea what a DEM is. Seems one would gamble and see what the tally is.
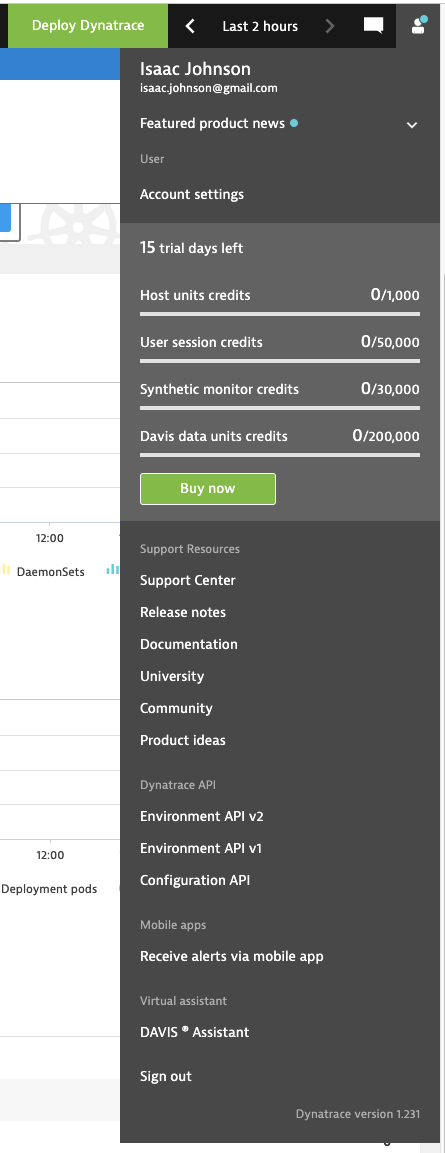
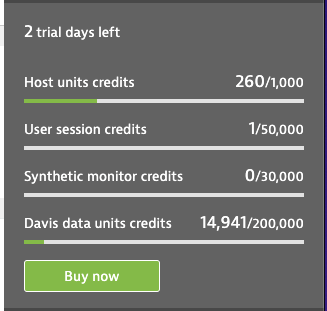
The other method might be to use a trial account and monitor some things and see what comes up as we are able to see the consumed “credits” in our User pane after 12 days:
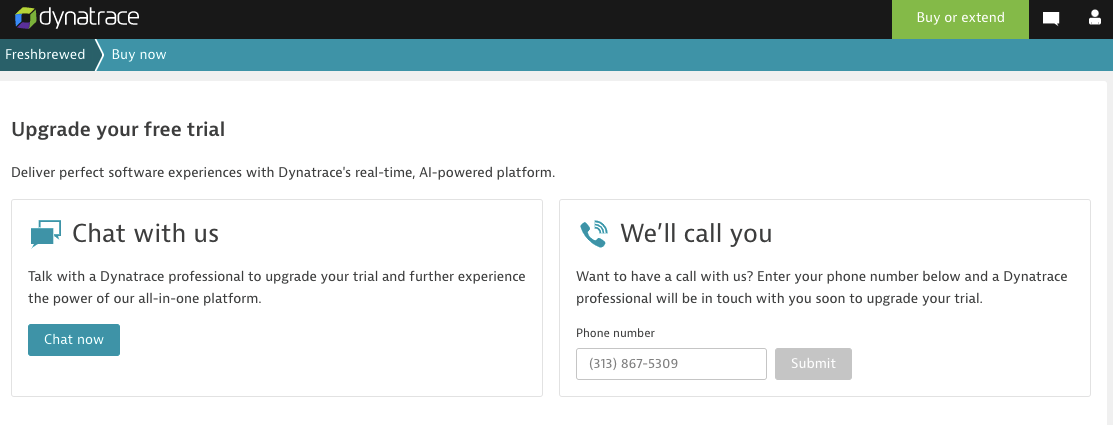
And again, if I liked this and wanted to click that “Buy now”, invariably I’m routed to a “let’s talk” menu, not to an actual purchase option:
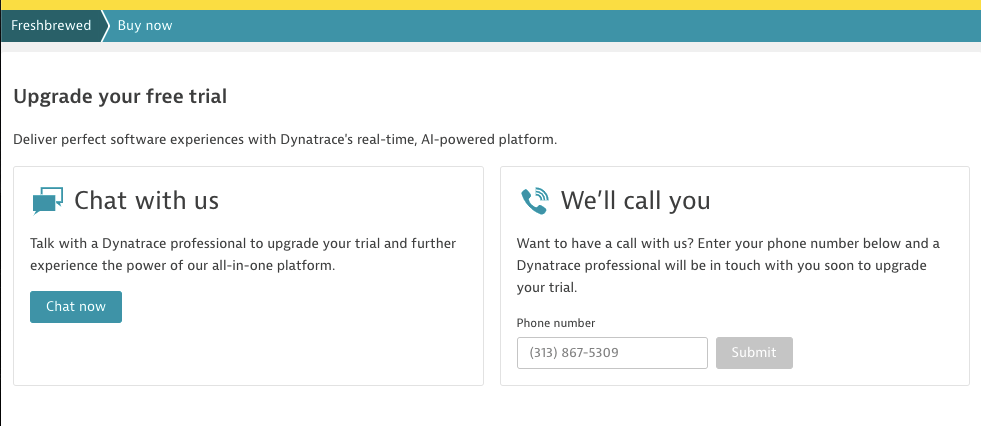
I do not know if I am alone in this viewpoint. So perhaps I am a stodgy old grump set in my ways; I can own that. However, I fundamentally put forward a distrust of offerings that make purchasing an activity that requires a phone conversation. Additionally, I have real issues if there is no clear and calculatable sticker price.
I’m okay if an Enterprise Agreement brings a discount or a Sales rep wants to give us a better deal on a longer pre-pay option. However, I need to be able to sit with a body of deciders at work and layout an ROI position without saying “geez, I don’t really know what it will cost”. That is a large hurdle in trying to ‘land’ at a new enterprise and certainly hard to sell internally if one likes a suite such as Dynatrace and wishes to pursue an engagement.