
Last time I talked about Datadog it was to focus on how Datadog helps us track deployments into AKS and tie to Azure DevOps data from builds. Today I want to dig in to how Datadog can help track and expose metrics and logs from builds as a really complimentary tool to Azure DevOps. To make it more interesting, I’ll be using just the free tier of Datadog to show how easy it is to get started.
Setting up WebHooks for Events
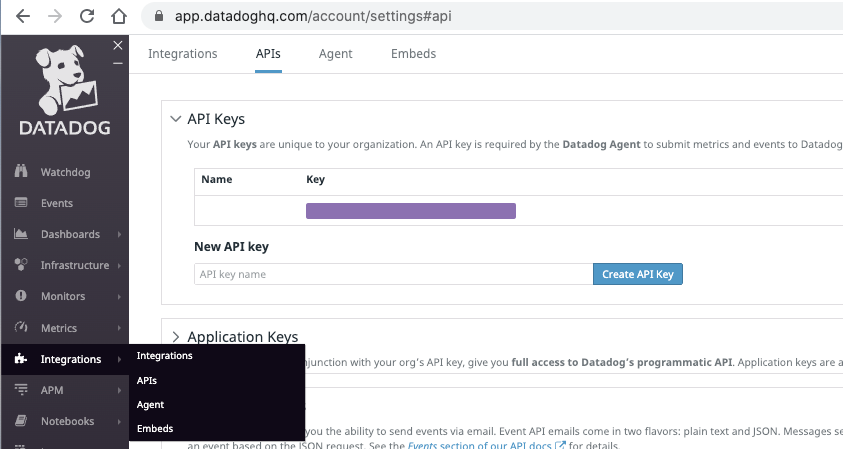
This is a bit of an overview of what I already covered, but the first piece of information you’ll need after signing up for DataDog is the API key. This is the unique identifier you can use for all your agents and integrations. It’s also easy to revoke. You’ll find it under “Integrations/APIs”.
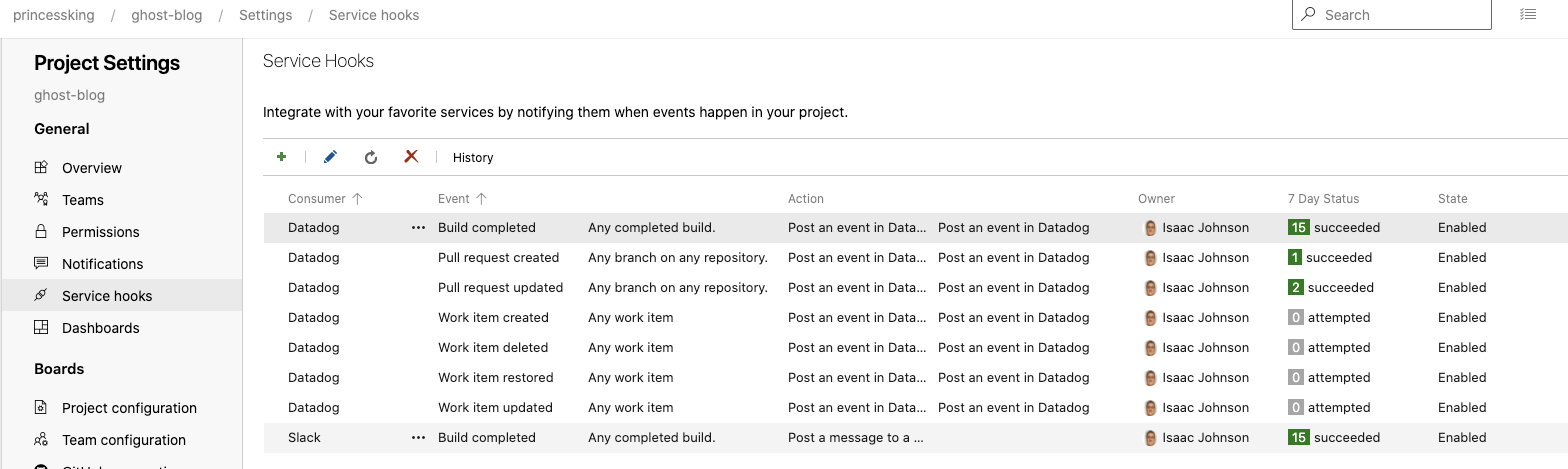
We can now add service hooks for any events we wish to tracks natively in Azure DevOps. You’ll find those under Project/General/Service Hooks:
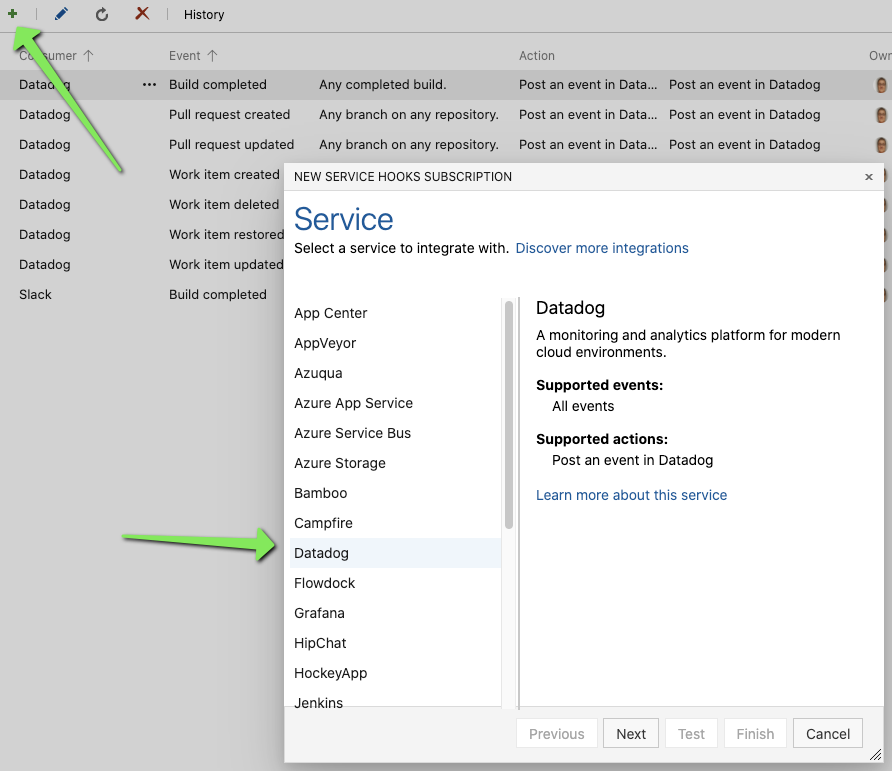
Adding a new event just requires hitting the “+” to add an event and selecting Datadog:
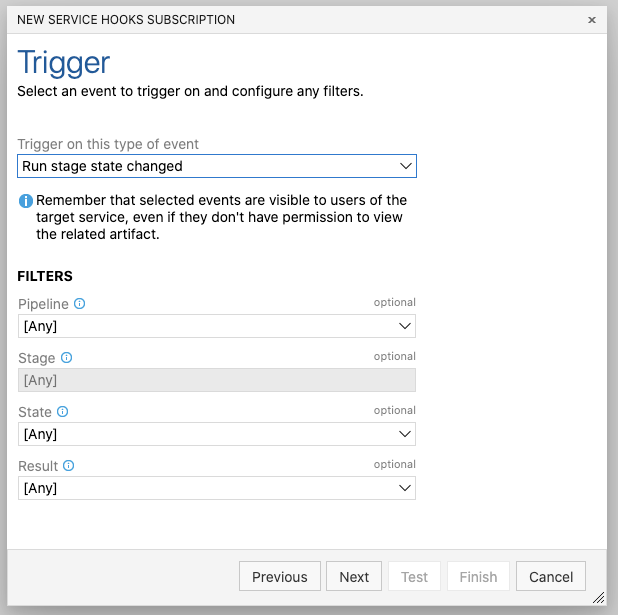
Then choose the event type and any filters (perhaps you only wish to monitor one pipeline):
You can then set the key and click Test to verify:
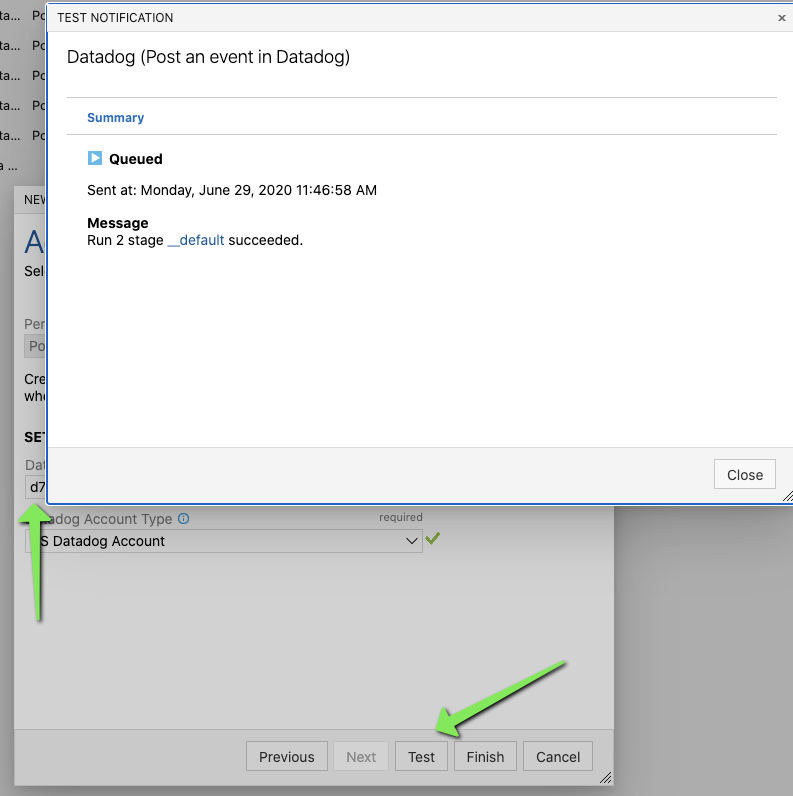
Just click Finish to add the hook:

But what about custom events?
Sometimes as a release engineer I want to more tightly control my notifications. This can be useful in a multi-tenant organization (where my project team has a datadog instance but not necessarily for use by others).
In this case I can send data several ways.
DataDog Event AzDO plugin.
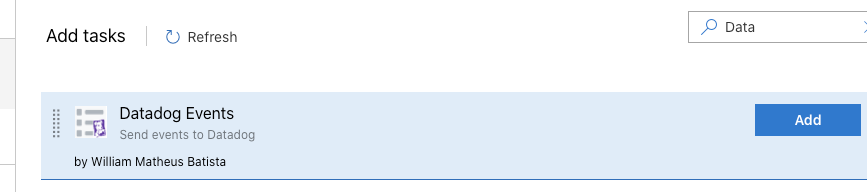
Here we can use the “Datadog Events” plugin from William Matheus Batista. It’s a pretty functional off-the-shelf utility function:
You can then add to your pipeline and expose any message output captured into a variable:
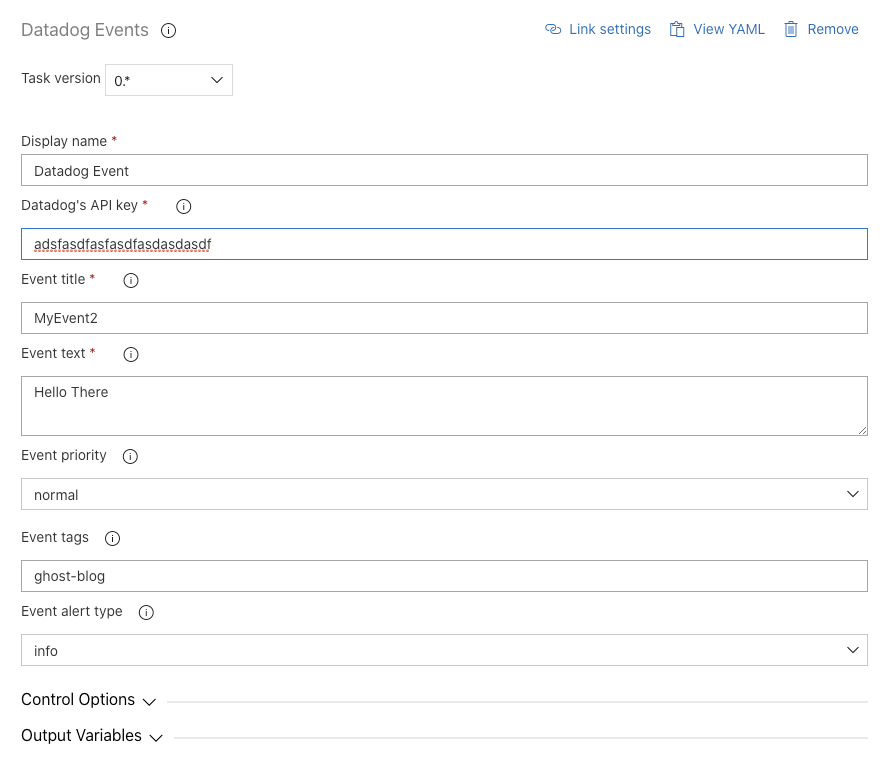
In YAML syntax:
steps:
- task: WilliamMatheusBatista.vsts-datadogevents.vsts-datadogevents.DatadogEvents@0
  displayName: 'Datadog Event'
  inputs:
    ddApiKey: asdfasdfasdfasdf
    ddEventTitle: MyEvent2
    ddEventText: 'Hello There'
    ddEventTags: 'ghost-blog'
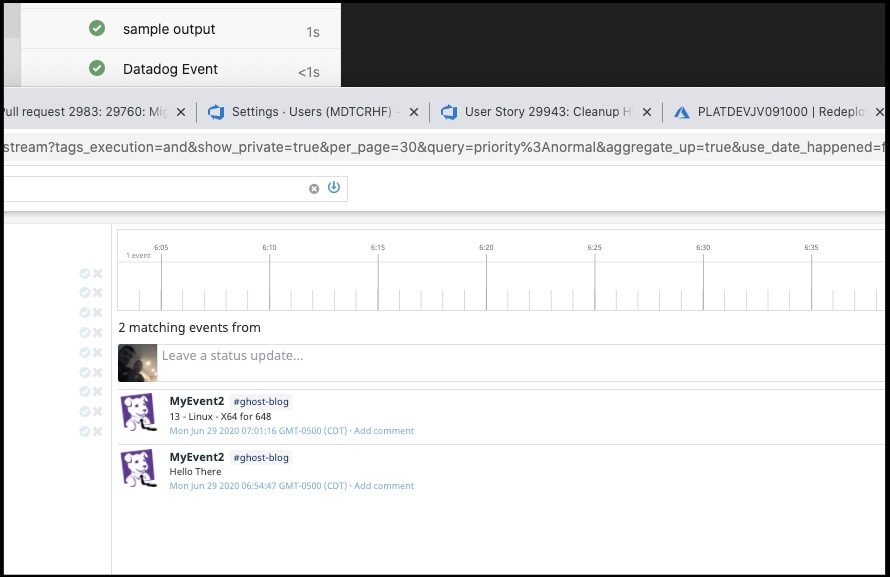
Here we can see the event pushed to Datadog:
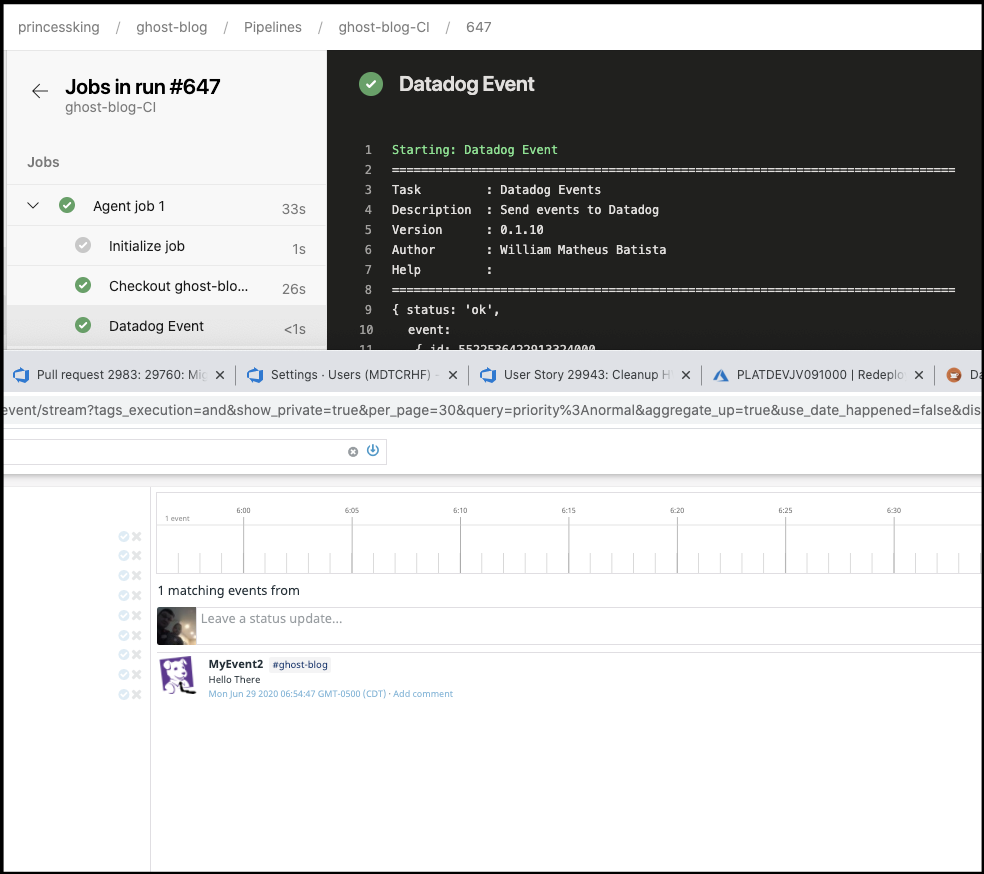
This can be useful for simple one-line outputs.
For example, perhaps we want to capture some basics about the Agent in use so later i could check event logs for problems associated to an agent or OS type:
#!/bin/bash
set +x
echo "##vso[task.setvariable variable=AGENTDETAILS]"$(Agent.Id) - $(Agent.OS) - $(Agent.OSArchitecture) for $(Build.BuildId) > t.o
set -x

cat t.o
Which in YAML syntax:
steps:
- bash: |
   #!/bin/bash
   set +x
   echo "##vso[task.setvariable variable=AGENTDETAILS]"$(Agent.Id) - $(Agent.OS) - $(Agent.OSArchitecture) for $(Build.BuildId) > t.o
   set -x

   cat t.o
  displayName: 'sample output'

- task: WilliamMatheusBatista.vsts-datadogevents.vsts-datadogevents.DatadogEvents@0
  displayName: 'Datadog Event'
  inputs:
    ddApiKey: asdfasdfasdfasdfasdasdfasdf
    ddEventTitle: MyEvent2
    ddEventText: '$(AGENTDETAILS)'
    ddEventTags: 'ghost-blog'
The results of which:
But what about Multi-line outputs?
We can actually use the catch-all Log POST url for things like this. That is also useful for integrating Datadog into our containerized service. As long as the ‘thing’ running can reach the internet and run an HTTP POST, you can get log data into Datadog.
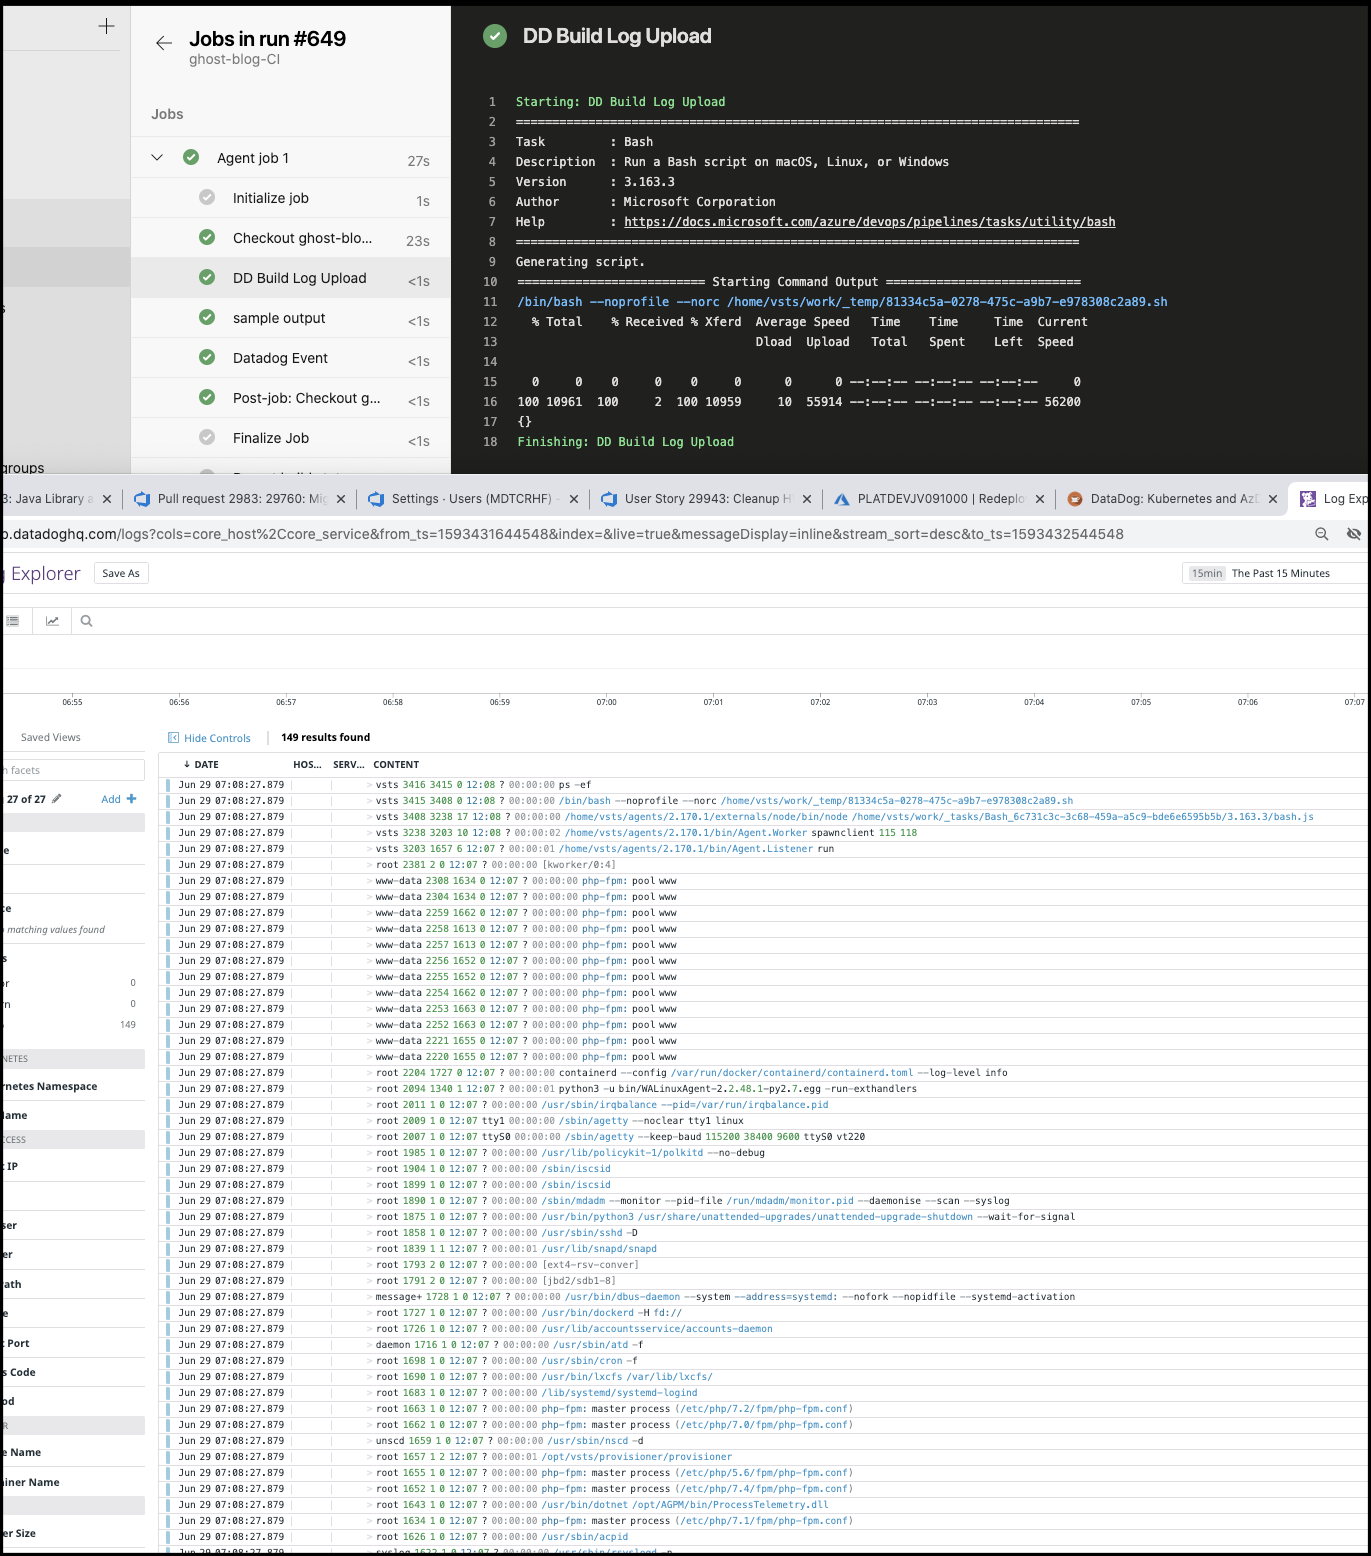
Here, we’ll capture all the running processes on the agent (which serves as some good multiline output) and push it to Datadog:
steps:
- bash: |
   #!/bin/bash -x

   ps -ef > ps.log

   curl -X POST https://http-intake.logs.datadoghq.com/v1/input \
        -H "Content-Type: text/plain" \
        -H "DD-API-KEY: 08ce42ae942840eaa60ab9a893964229" \
        --data-binary @./ps.log

  displayName: 'DD Build Log Upload'
  enabled: false
  condition: succeededOrFailed()
Once run, in logs we can now see log details. With the free tier of Datadog, they won’t persist that long, but that’s okay - for now we are mostly interested in showing the abilities and perhaps we would use this for debugging build outputs on remote unmanaged instances.
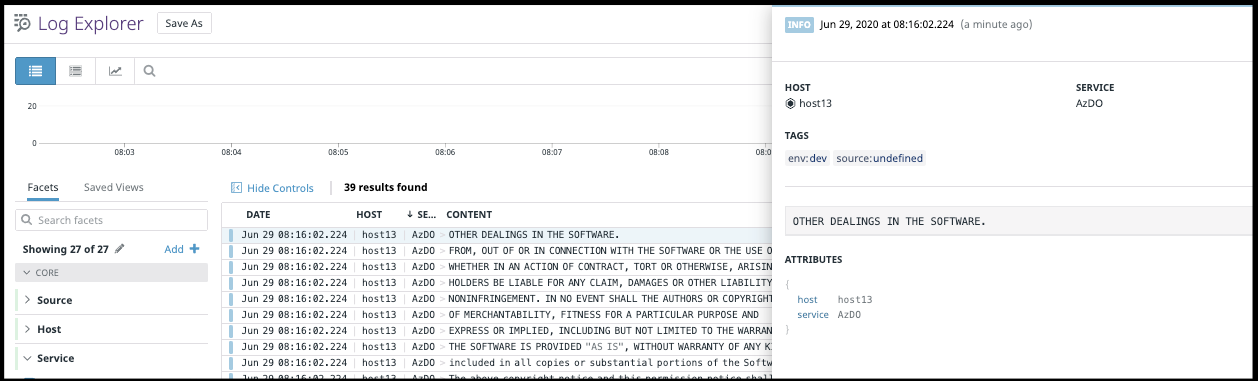
We can also include things like Host, App and Tags in the URL (while i didn’t find this in the documentation, this article inspired me);
$ curl -X POST 'https://http-intake.logs.datadoghq.com/v1/input?host=host13&service=AzDO&ddtags=env:dev' -H "Content-Type: text/plain" -H "DD-API-KEY: 08ce42ae942840eaa60ab9a893964229" --data-binary @./LICENSE
$
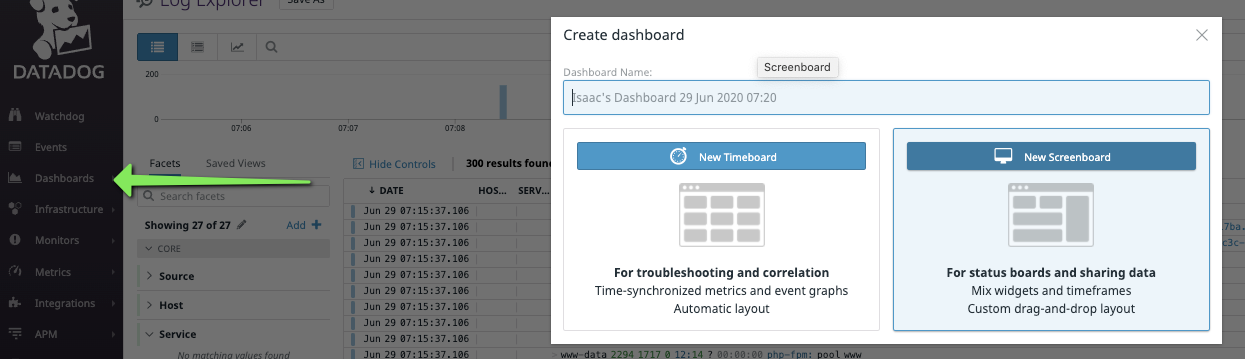
Dashboards
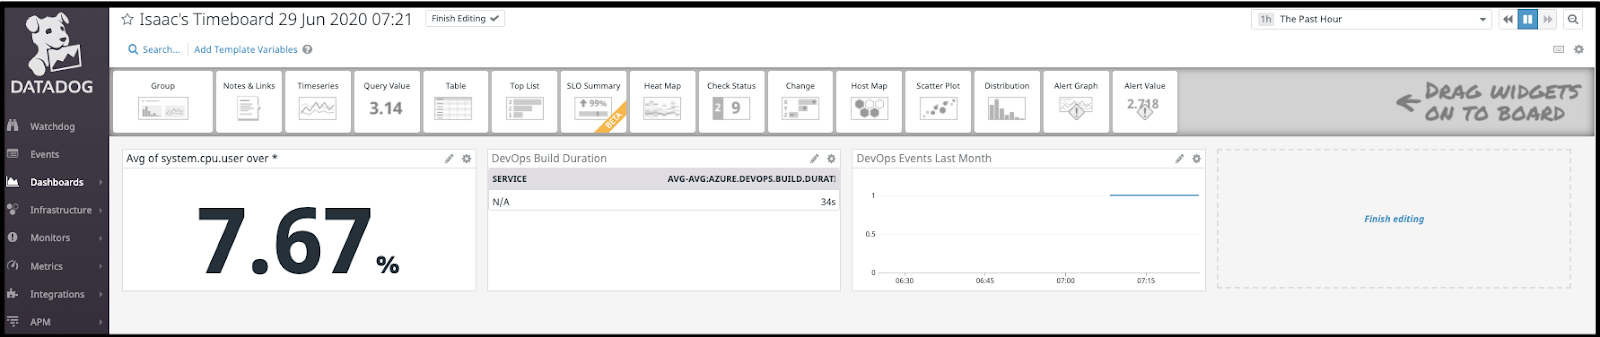
We can create Dashboards to share data. You’ll find them, of course, under Dashboards:
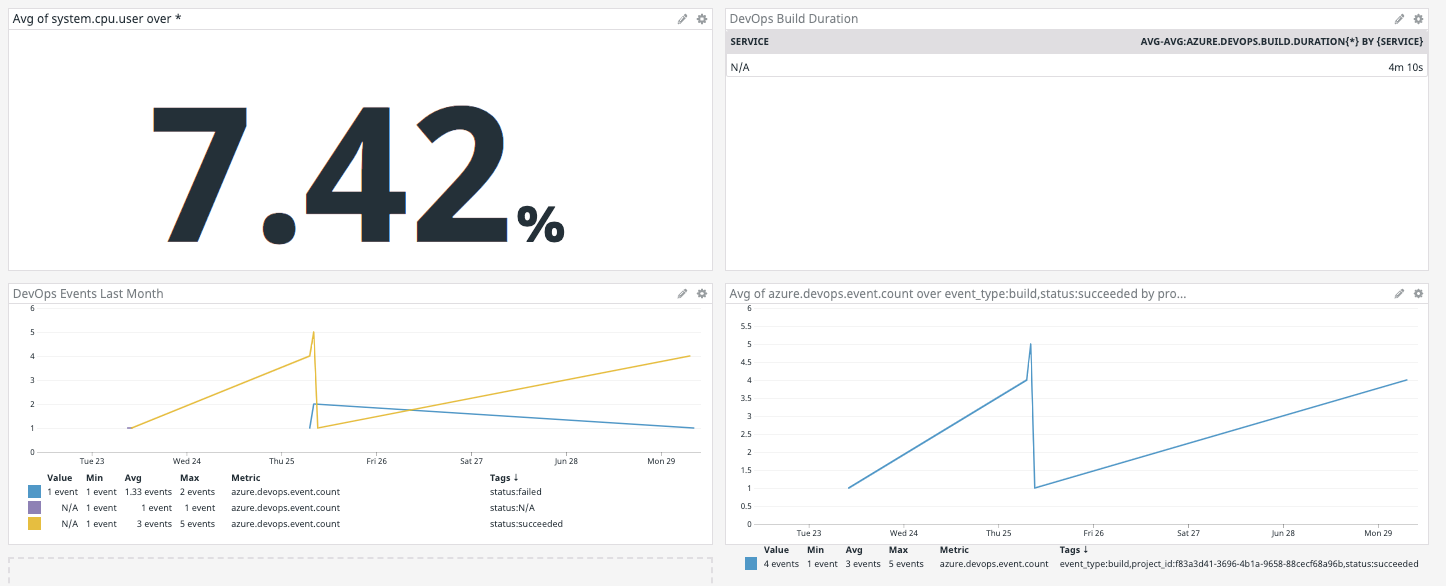
Here I’ll just add a few metrics. CPU percentage on agents, build duration and build events:
Next, under the gear in the upper right, i can get a public URL for this dashboard as well as set the Widget size. This can be useful for Confluence/Wiki pages that expose build details:
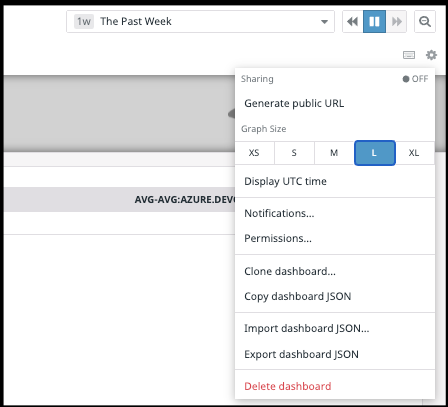
You can decide on whether to let the users change time frames - in this case I’m fine with that:
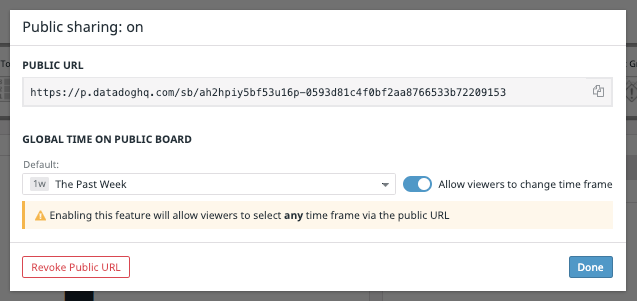
And you should be able to view this live dashboard right now:
https://p.datadoghq.com/sb/ah2hpiy5bf53u16p-0593d81c4f0bf2aa8766533b72209153
Another example: say we wished to add a graph of "passing builds". We could add that metric as another graph:
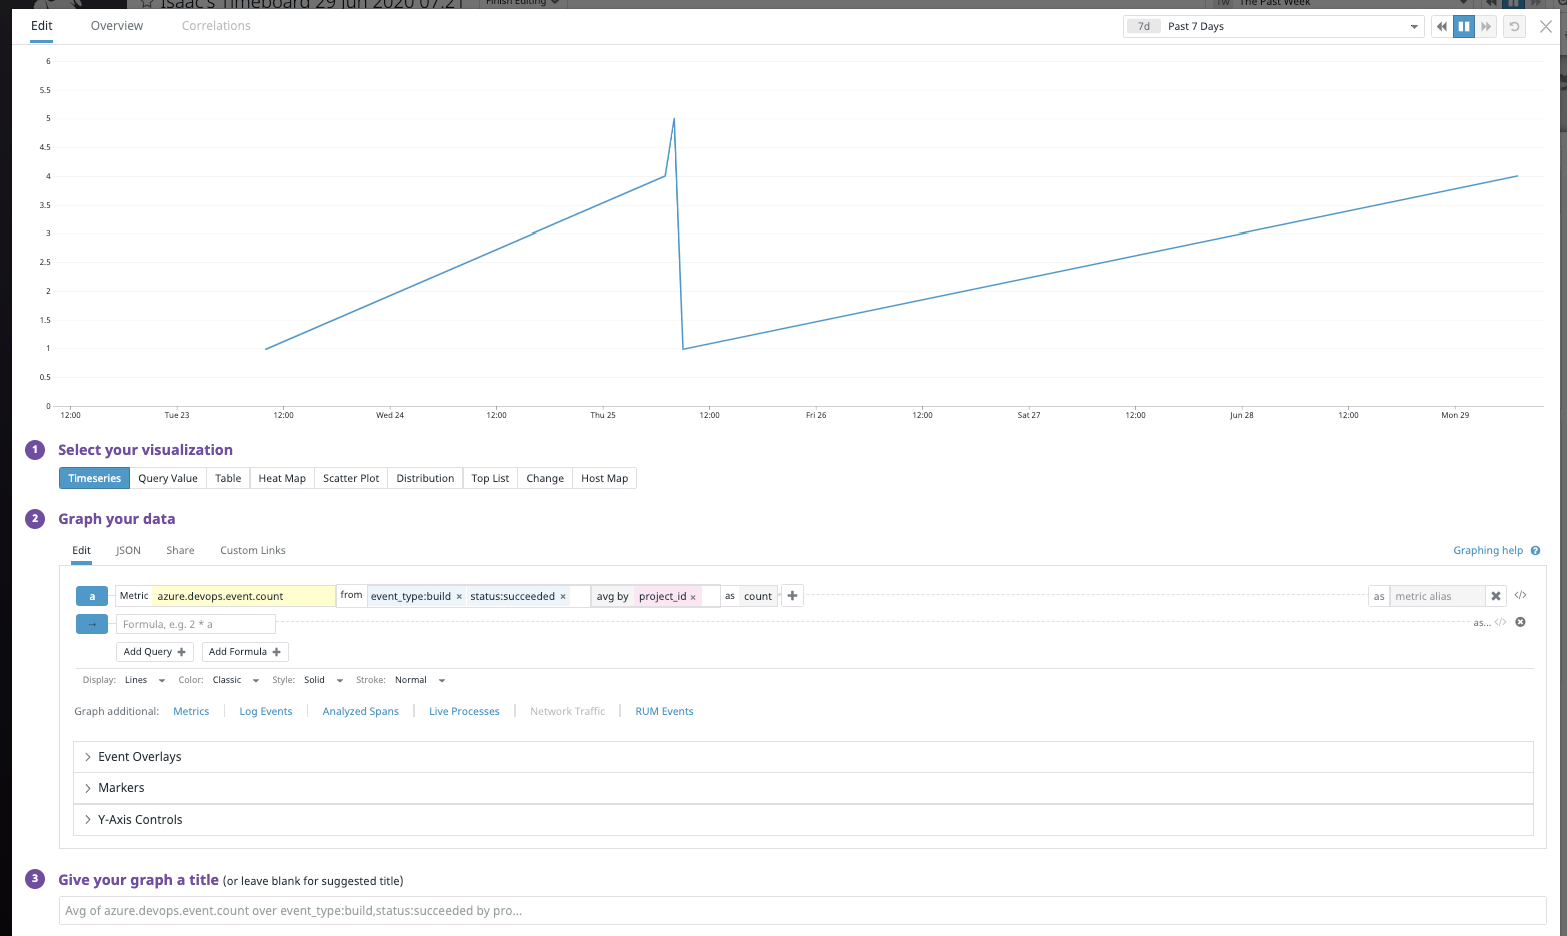
and then see it immediately added to the dashboard:
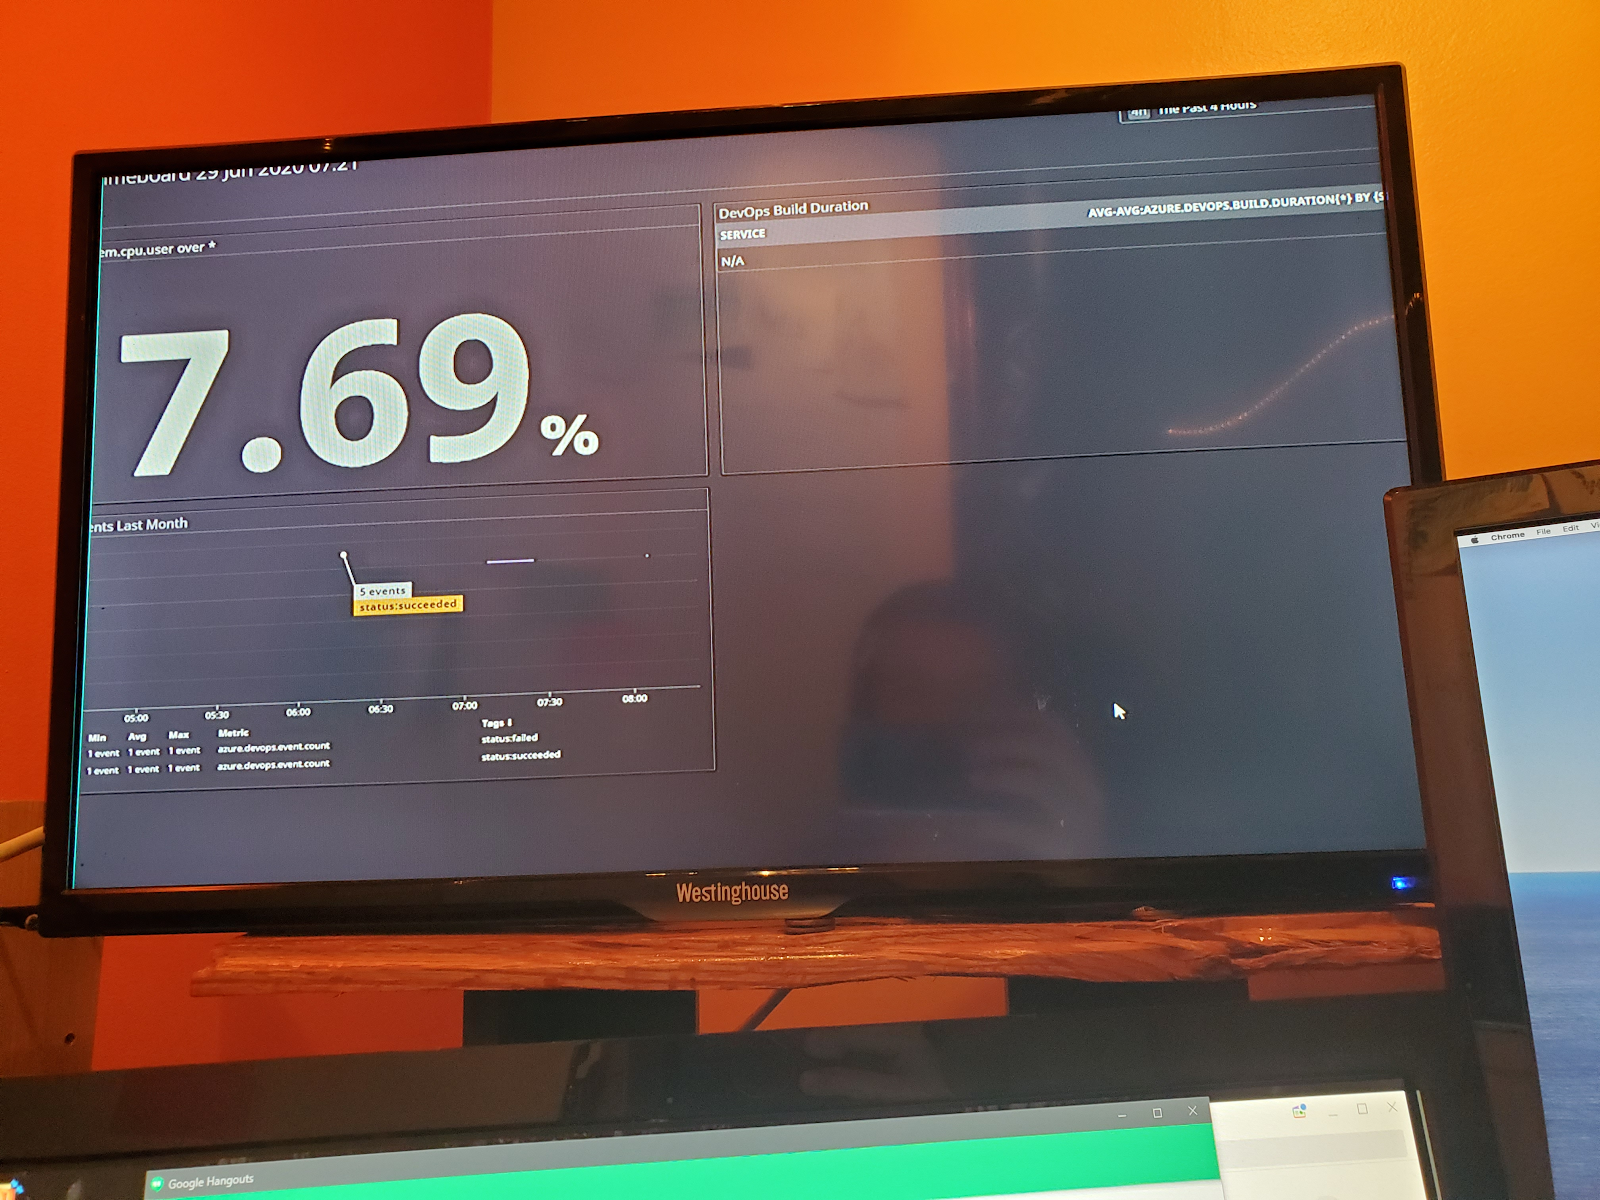
One of the really nice features is the “TV Mode” which is great for 2nd screens and public displays:
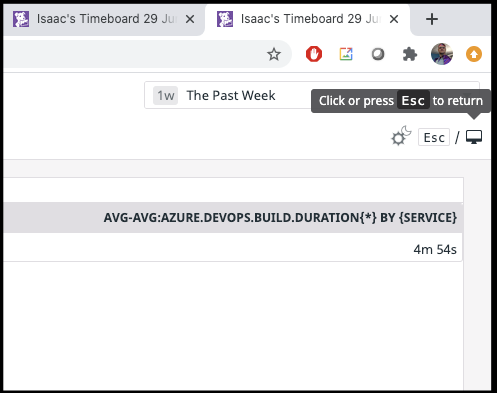
There is also a Dark mode there as well.
An example might look like this (the latter on a display my eldest daughter fished out of a nearby small lake)
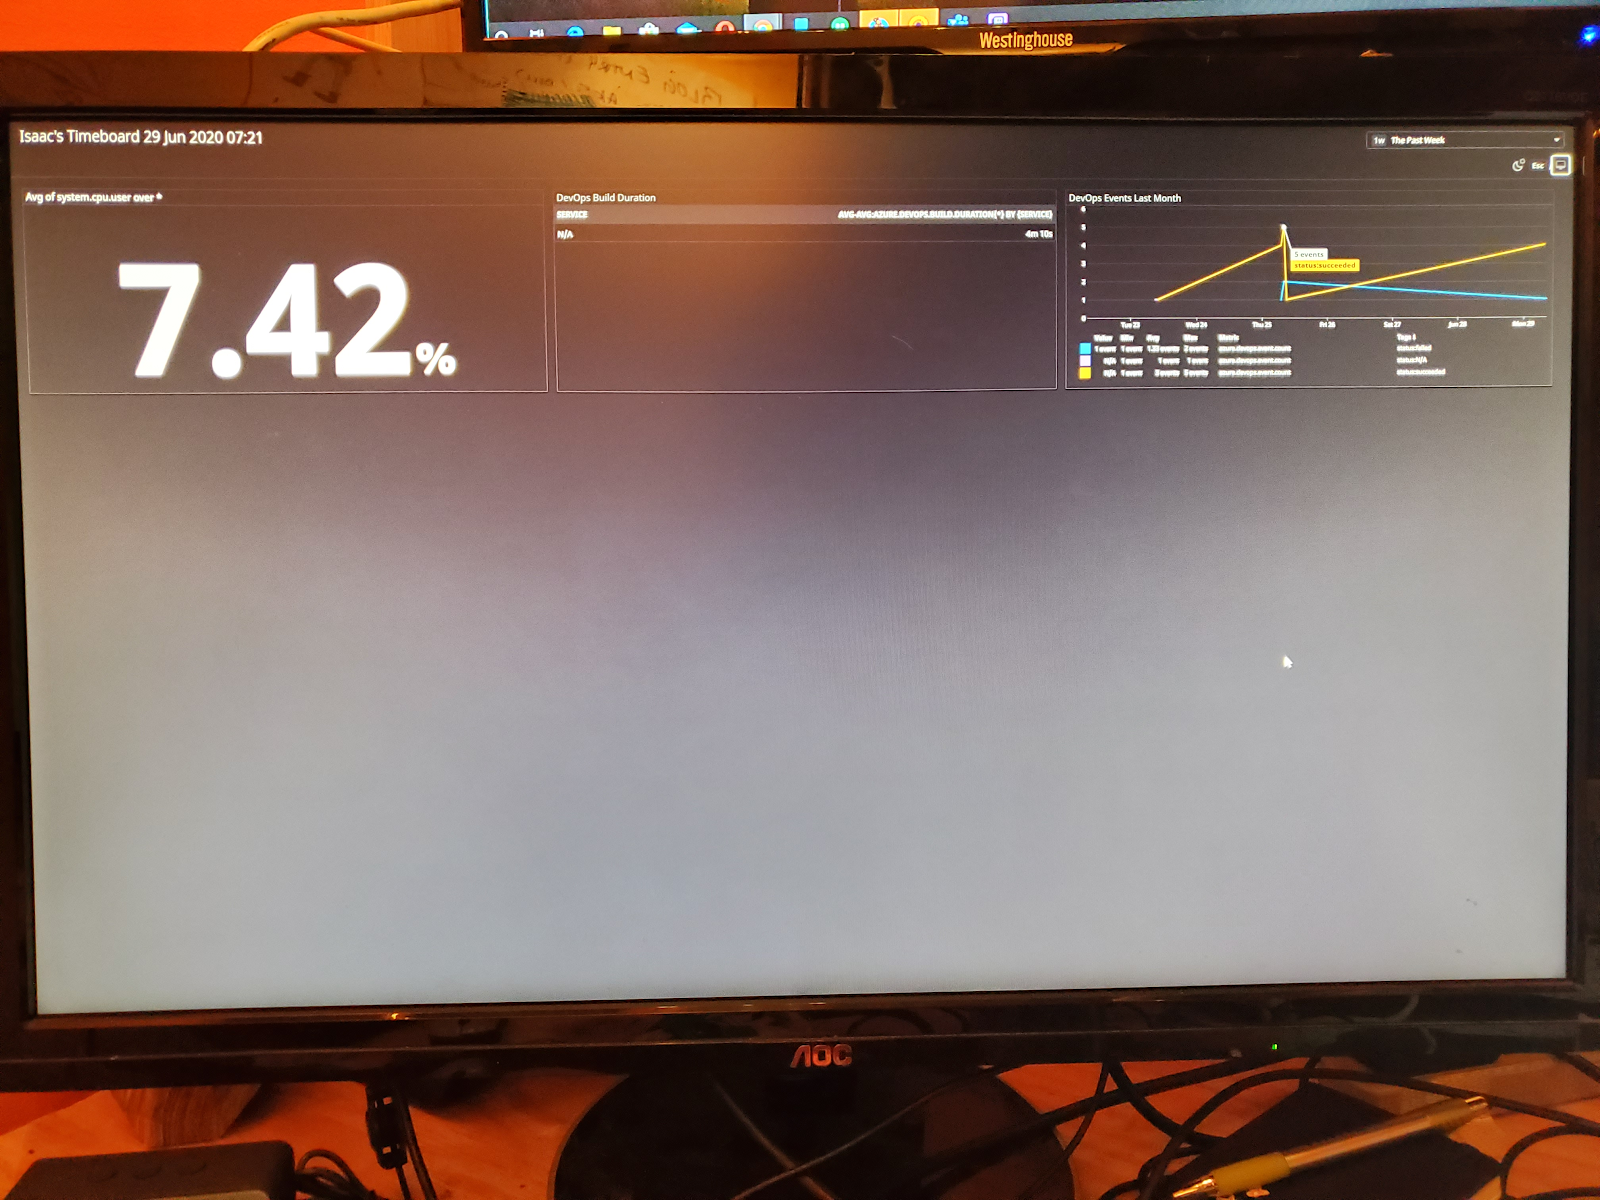
and the "pond" monitor:
Monitoring and Alerts
So once we've got some metrics, one might realize that a dashboard showing pass/failed builds is good, but can we get alerts directly from Datadog?
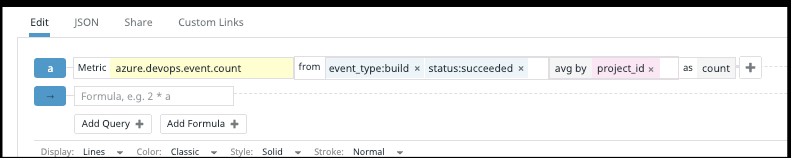
For instance, say we have a graph of Succeeding and Failing builds:
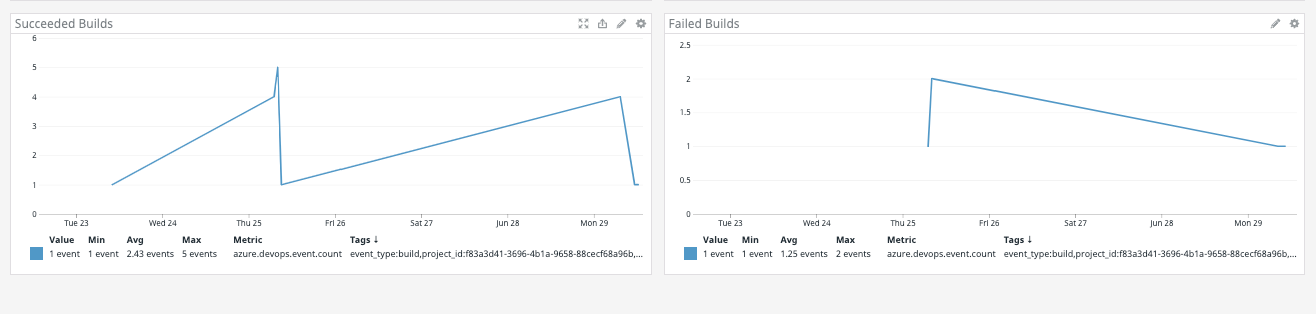
And the only difference in the Metric query is the "status" parameter:
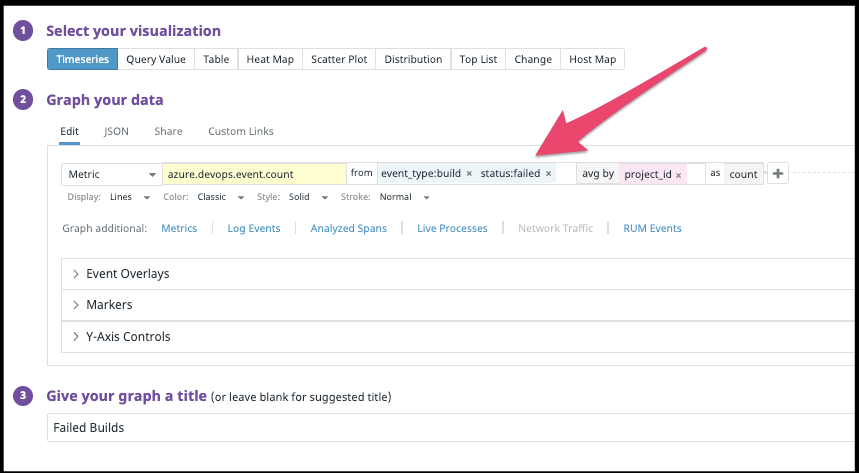
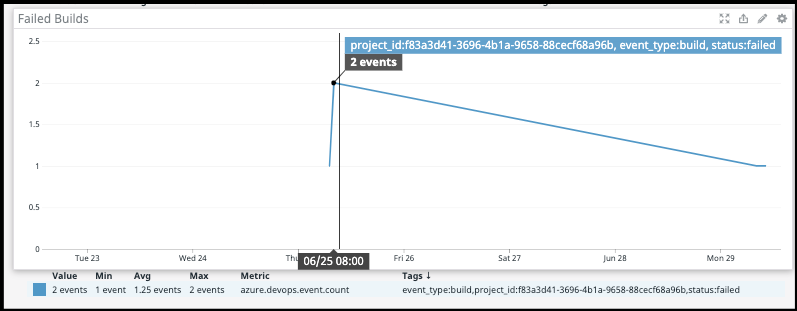
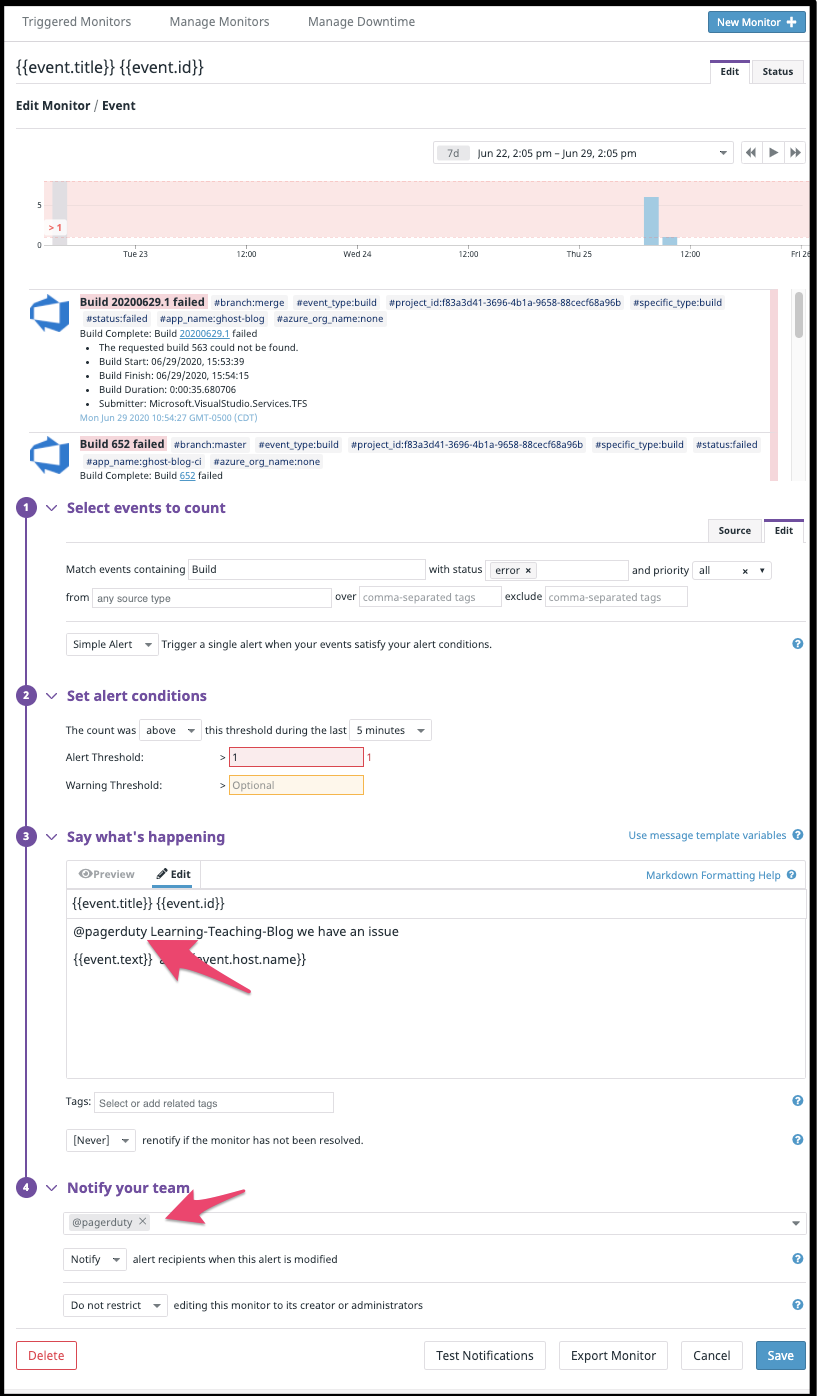
Now we can create a monitor that would be triggered on any build or just failed builds:
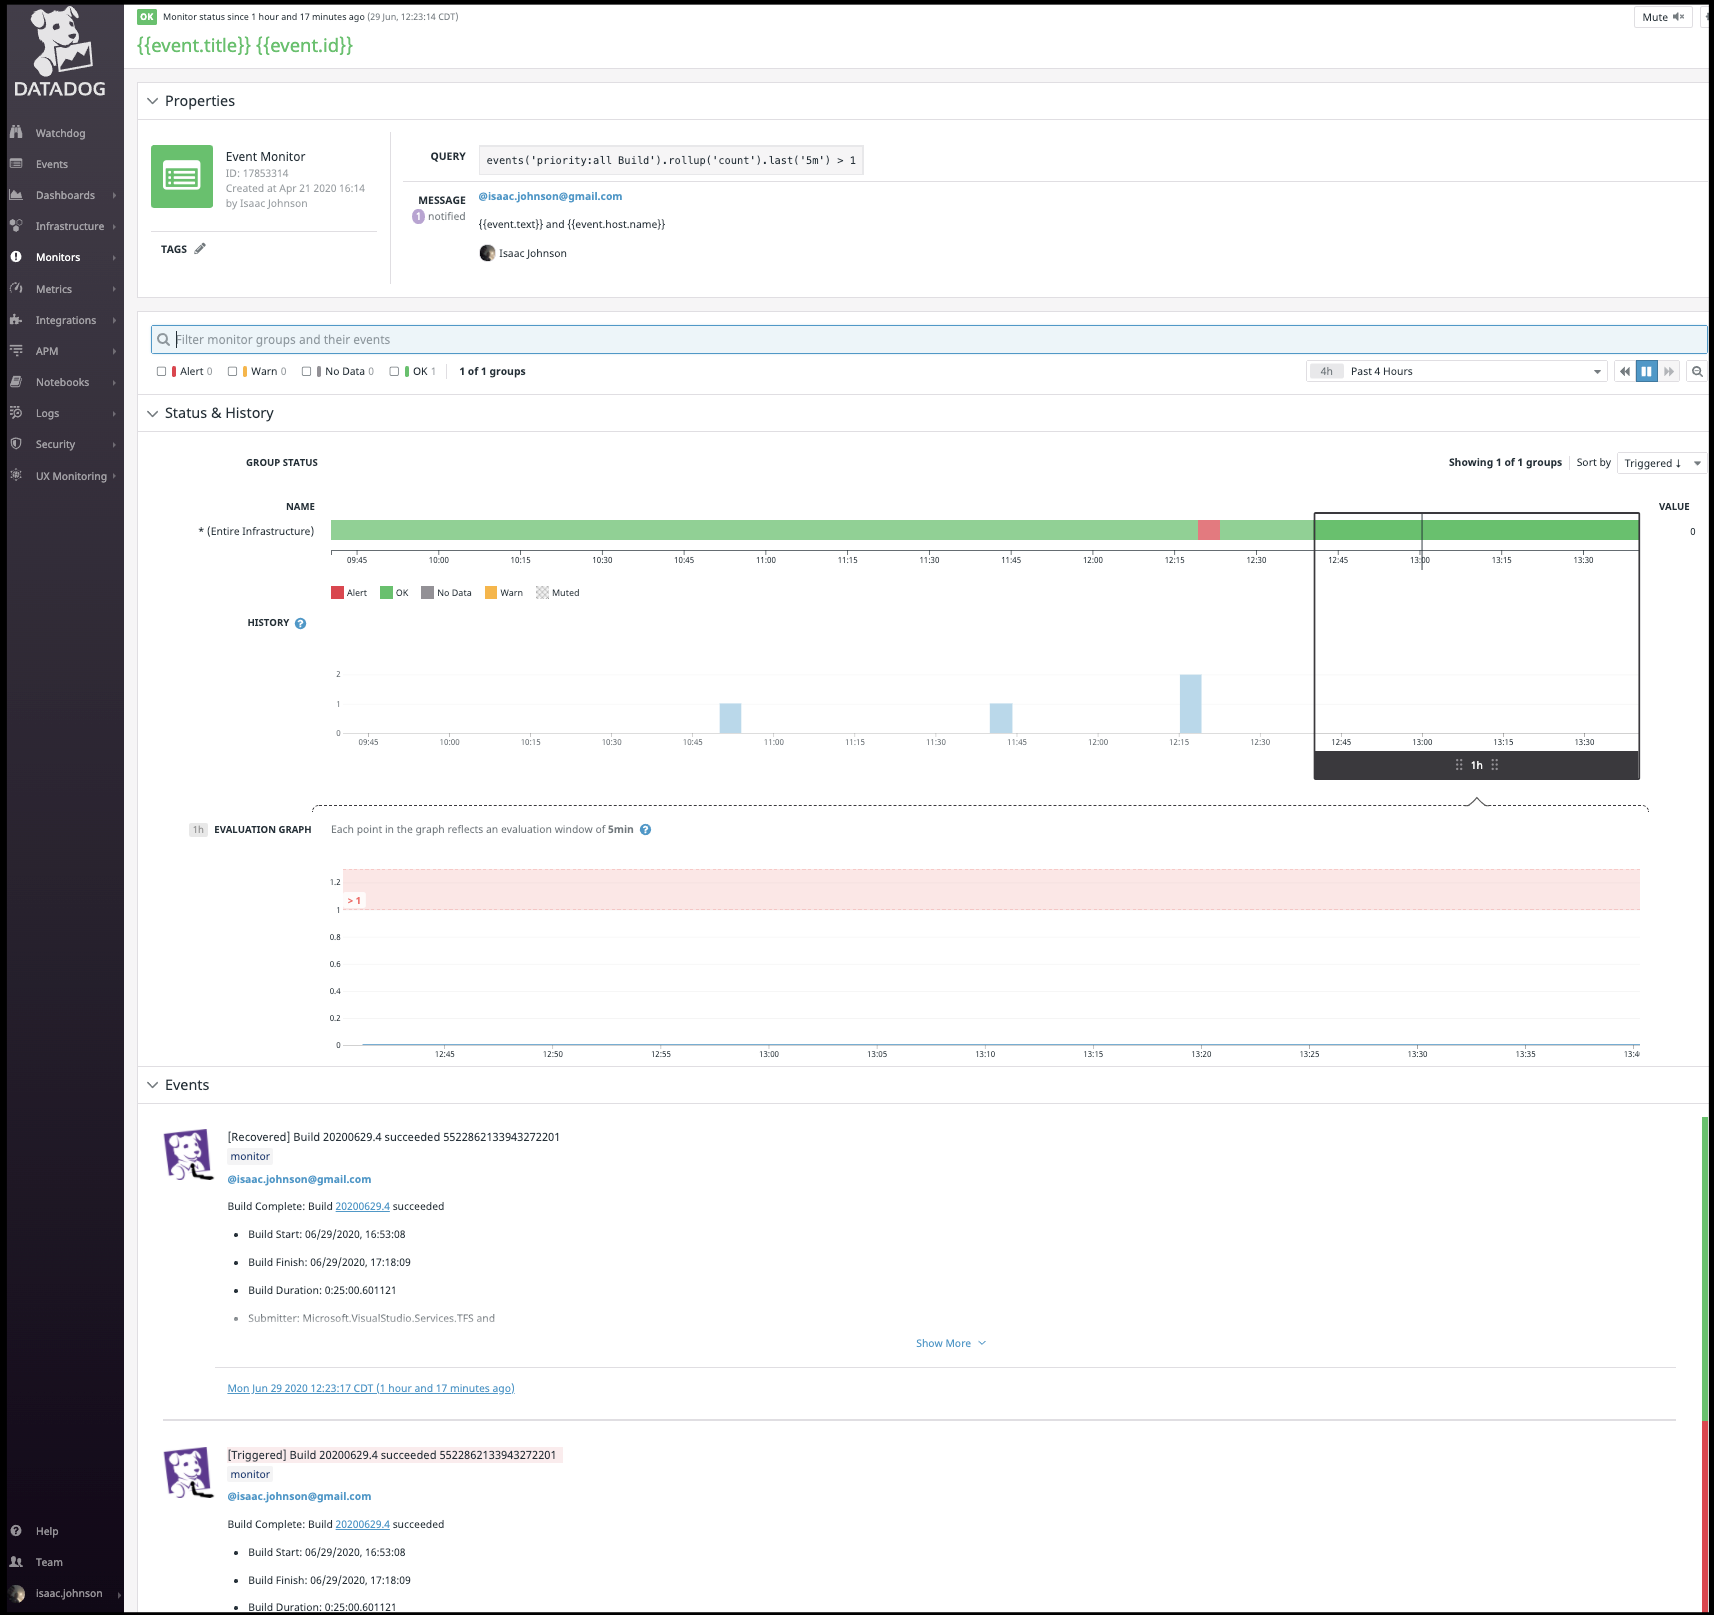
For instance, say I wish to determine why we had failed builds. I can mouse over the graph to see the time window:
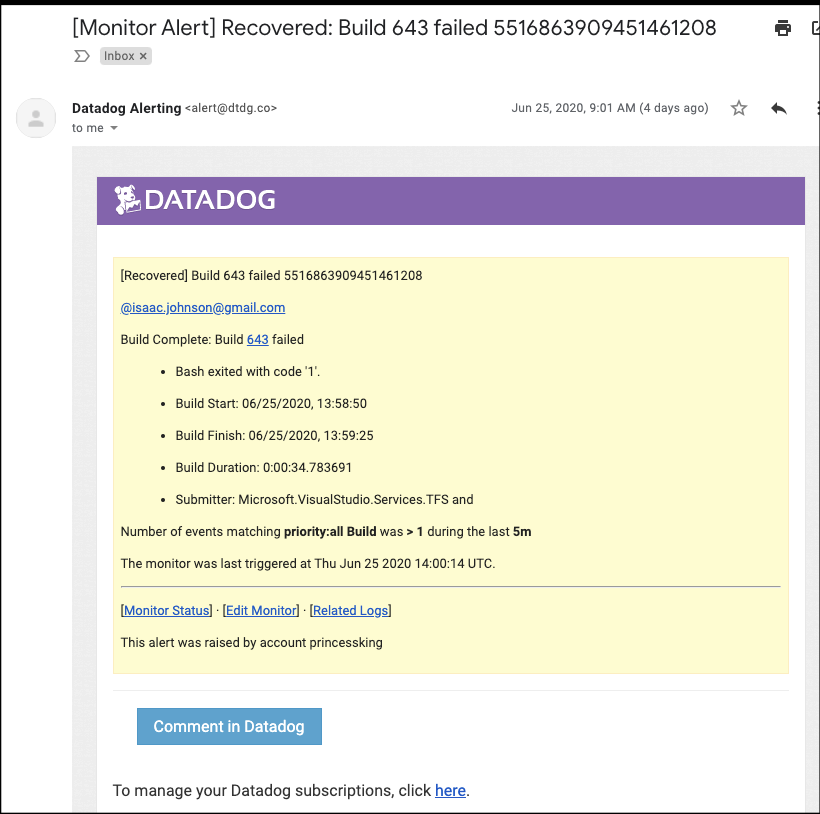
And checking my inbox, indeed i see an alert from AzDO and from Datadog:
And indeed I can lookup build 643 to see it failed:
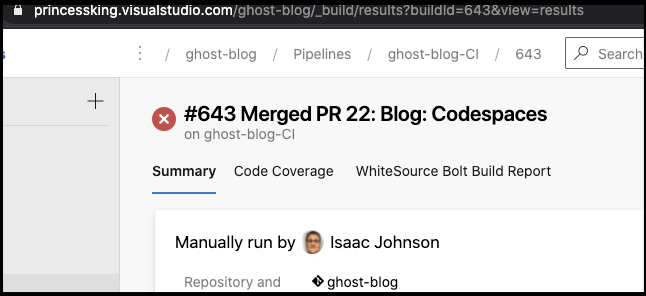
To be fair, the link in the Datadog alert is bad (must use some depricated _build and has URLEncoding issues). (i.e. it listed https://princessking.visualstudio.com/_build?amp%3Bbuilduri=vstfs%3A%2F%2F%2FBuild%2FBuild%2F643&_a=completed instead of https://princessking.visualstudio.com/ghost-blog/_build/results?buildId=643&view=results - likely based on older VSTS pattern)
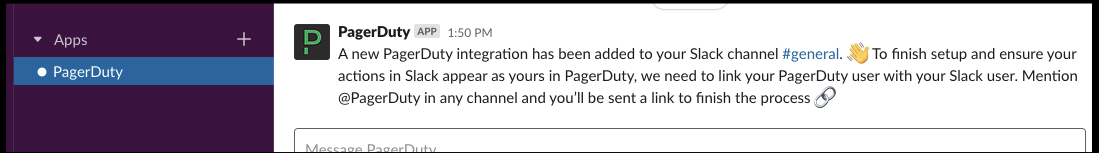
Alerting through PagerDuty
To really understand the power of what we have here, let's setup PagerDuty with Slack integration.
And a triggered alert example
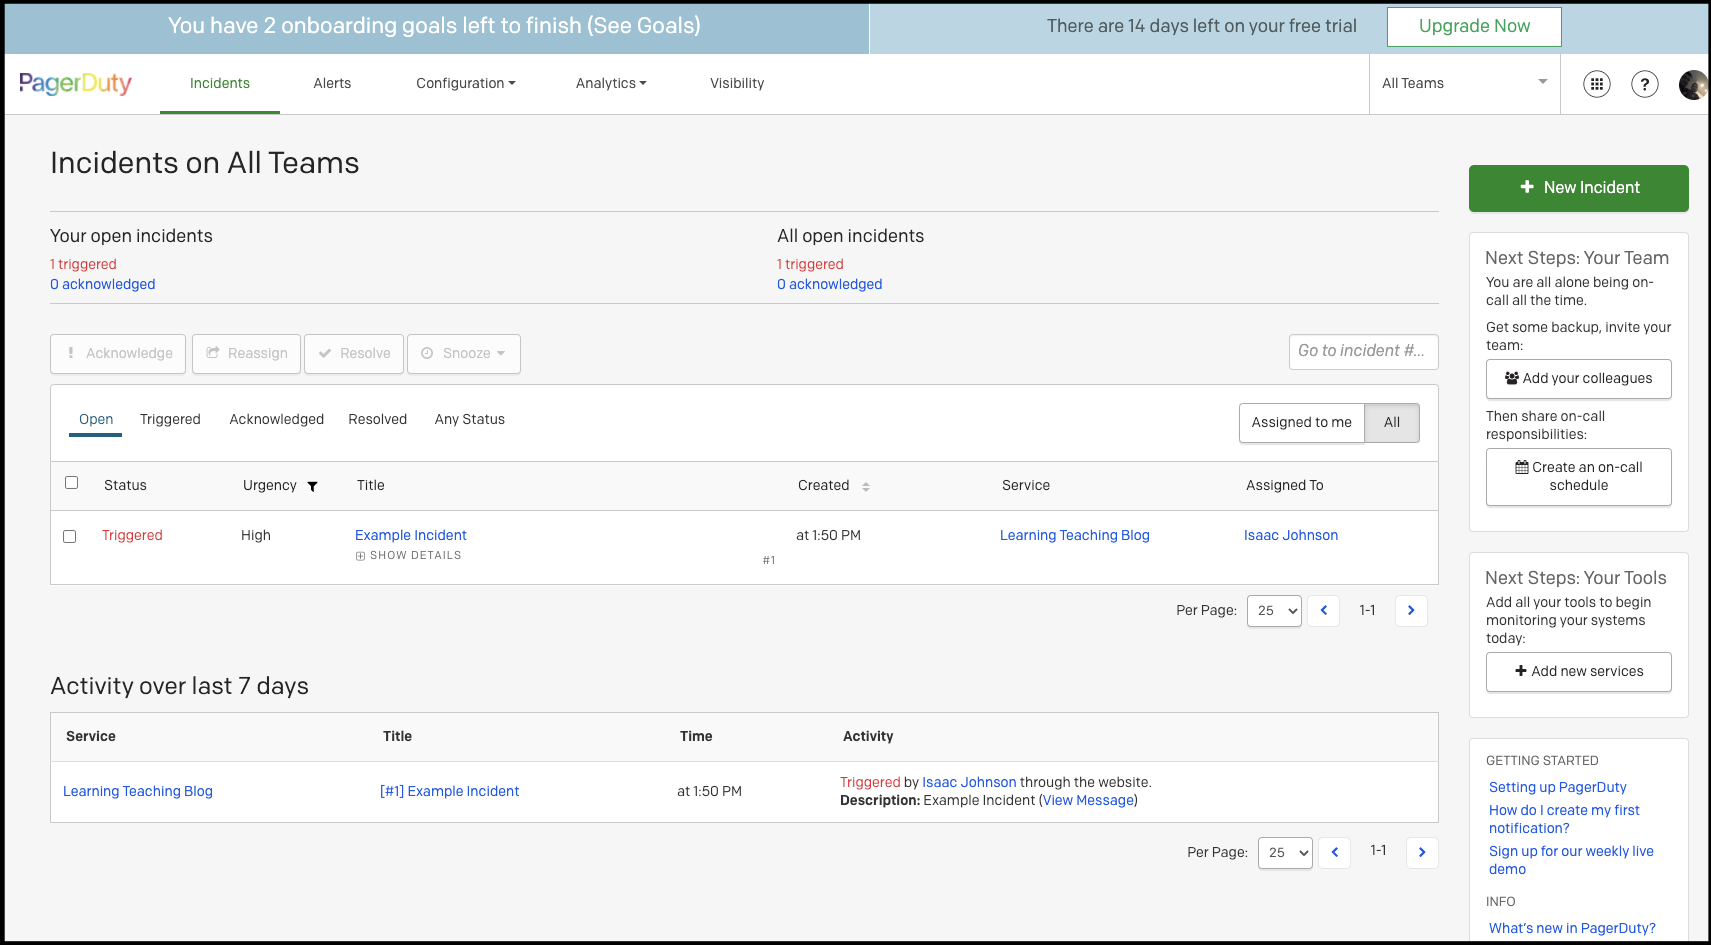
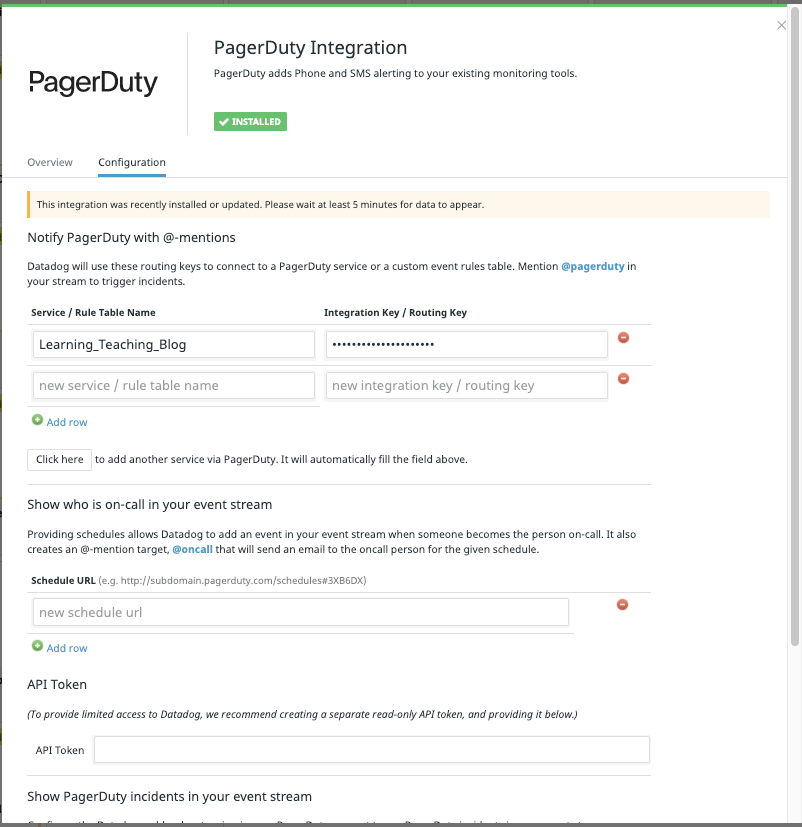
In integrations, add PagerDuty
We now have an event rule we can trigger a monitor on:
We can now test it:
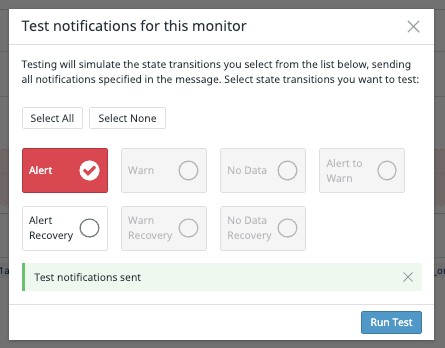
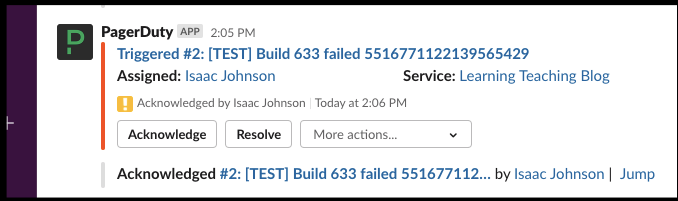
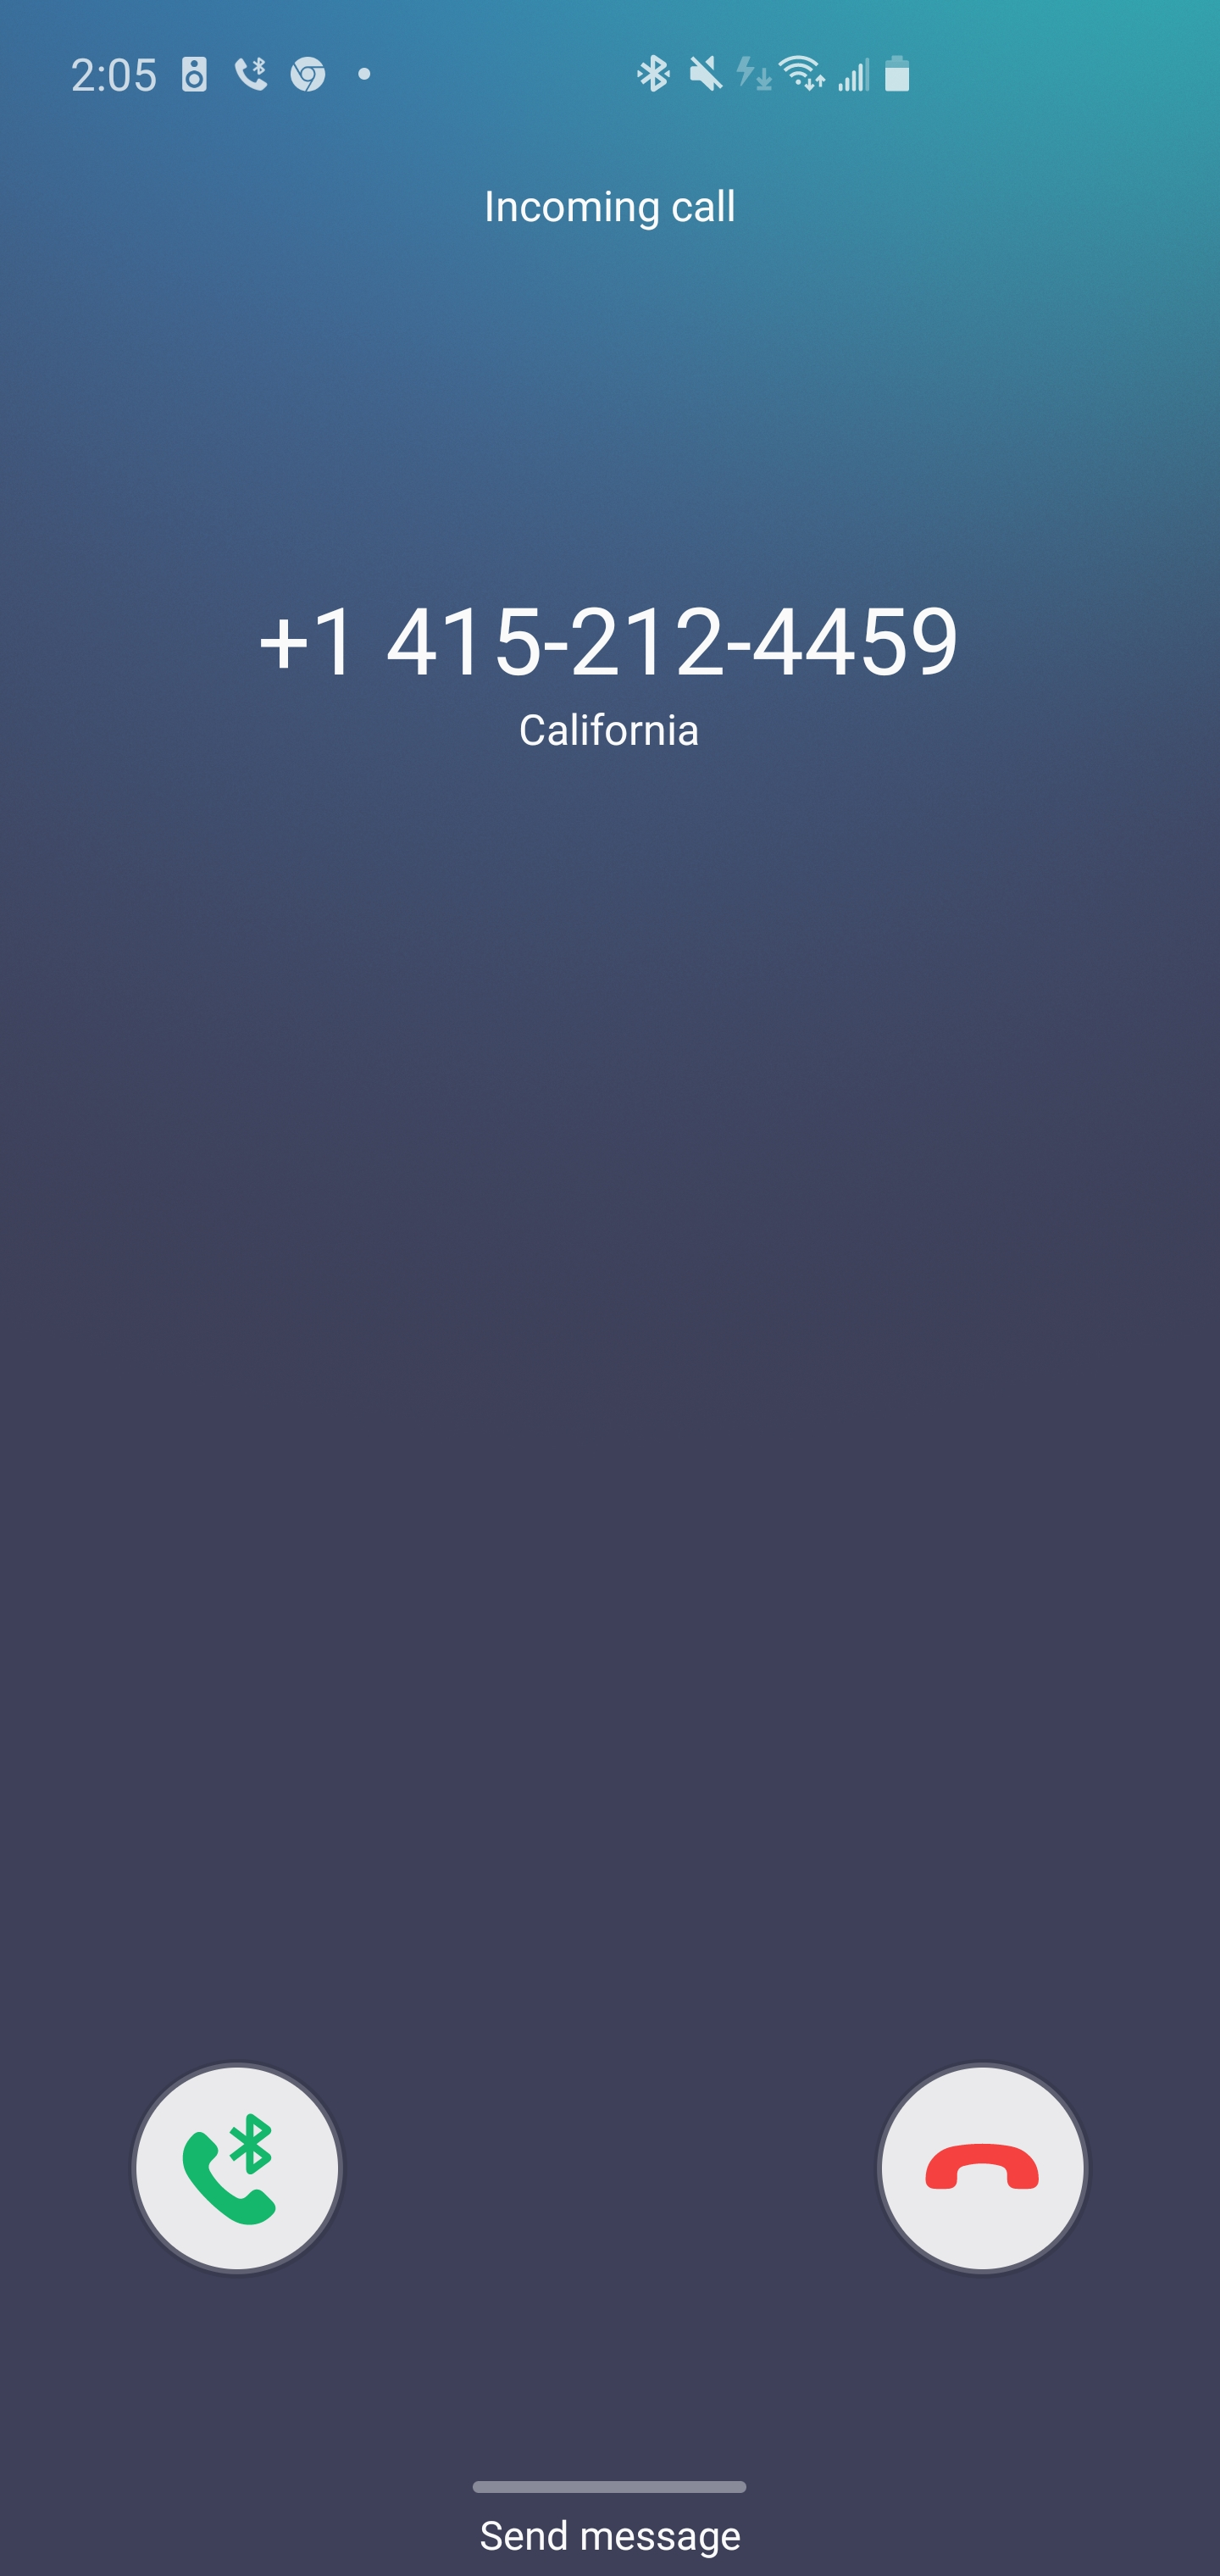
Which not only called me, as PD can page the on-call resource, it also posted to Slack where i could acknowledge or resolve:
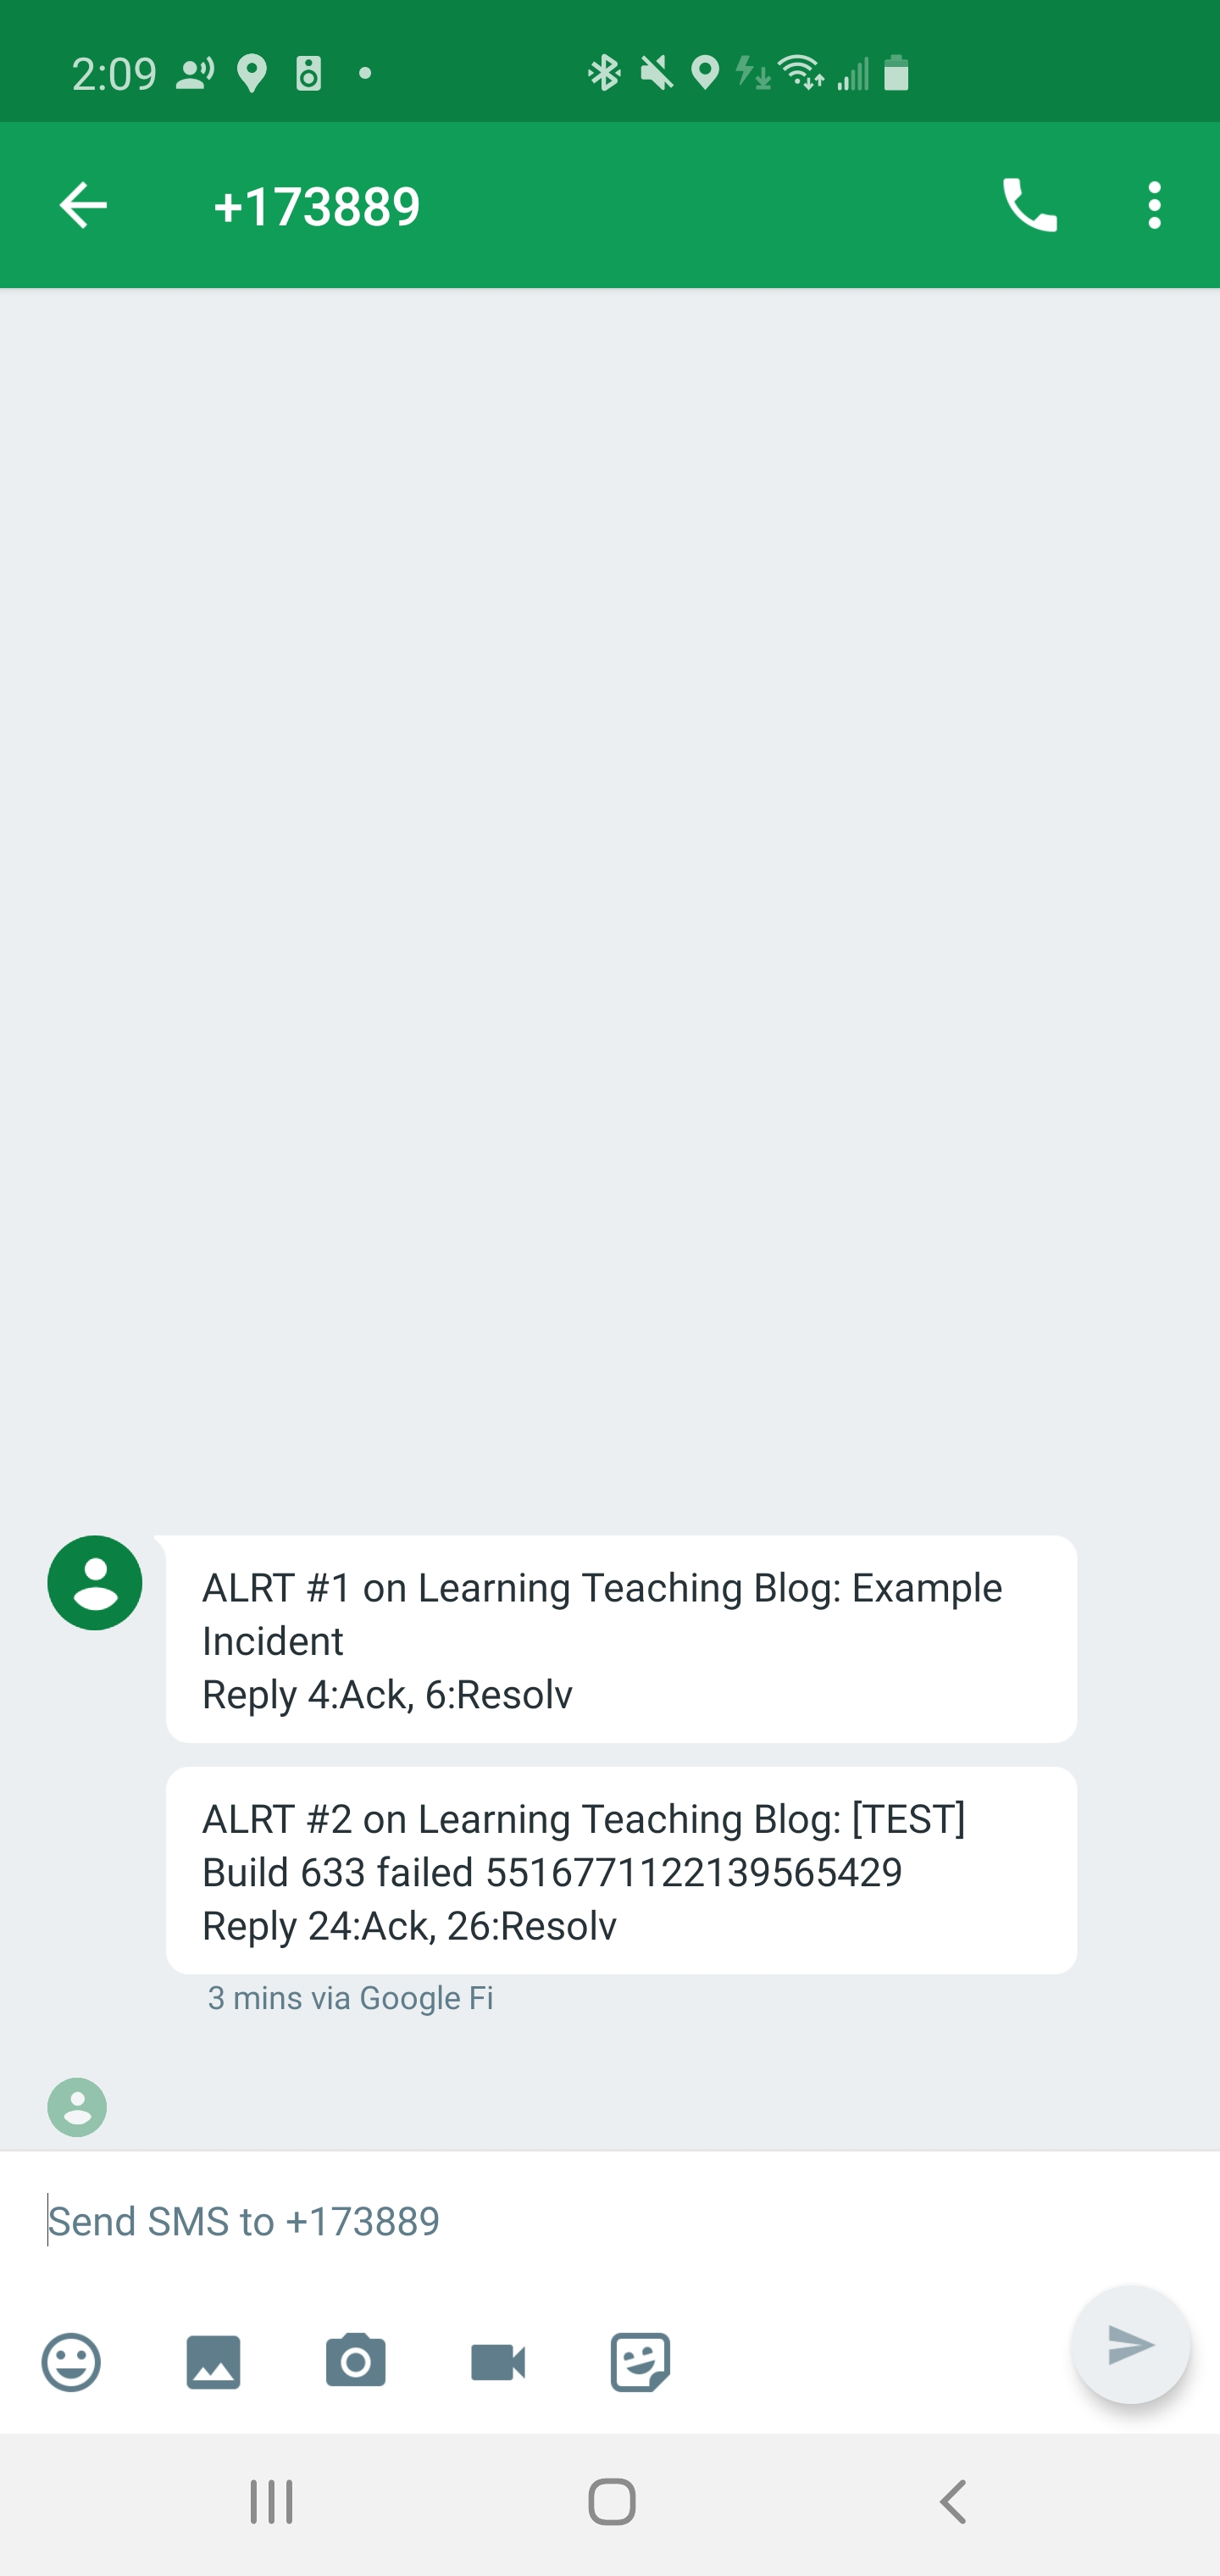
And texted and emailed me as well:
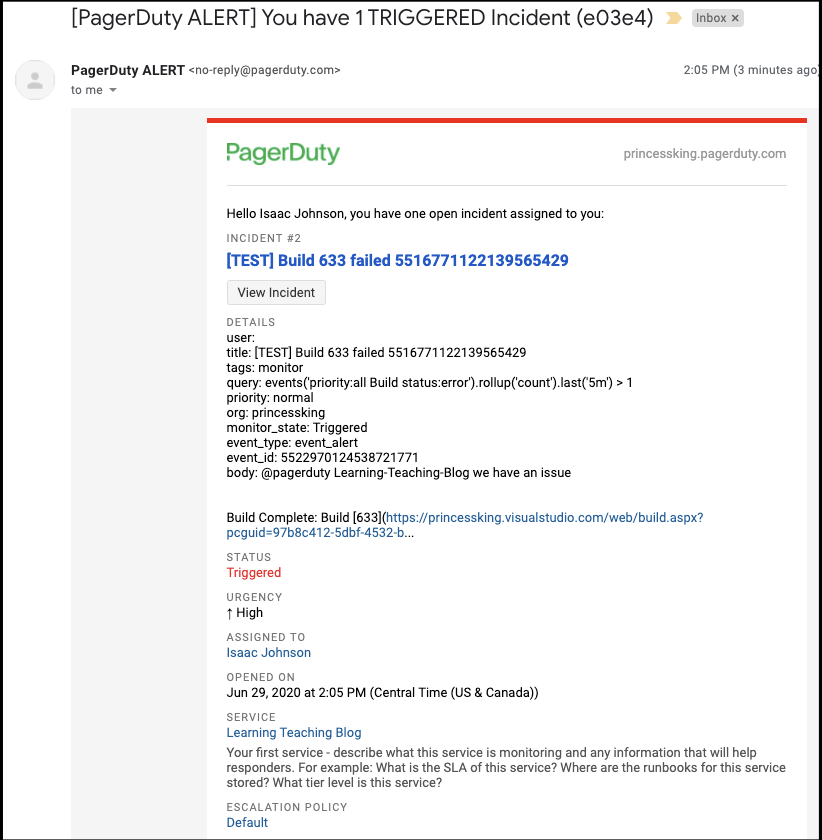
Since the routing is using PD via APIs, the alerts from Datadog would be routed to the appropriate oncall technician:
Summary
Datadog as an APM and Logging tool is great. As I blogged about before, it’s one of the few that can give us end-to-end traceability from code to through to the performance of running services. However, many don’t realize how it’s also a solid metrics, alerting and dashboarding tool that compliments Azure DevOps.
While I demoed this with AzDO, as it’s my primary pipelining tool, the examples I showed of custom events could be tied into any CI/CD tool as well. For those smaller shops and individual developers, everything demoed above was done with the free tier so really there is no reason not to try it out. While Pagerduty isn't exactly free (it has a free tier without alerting, and a cheap $10 starter that would cover 6 users that includes phone and SMS) it does illustrate a great low-cost solution to SLA enforcement and response escalation.
Leveraging Datadog as a metrics, logging and alerting hub we can have SLA enforced CICD ensuring any build issues are tracked and escalated.