One of the features of Dapr.io we have yet to explore is the logging and performance management component. Dapr uses OpenTelemtry to forward tracing data to the tool of your choice.
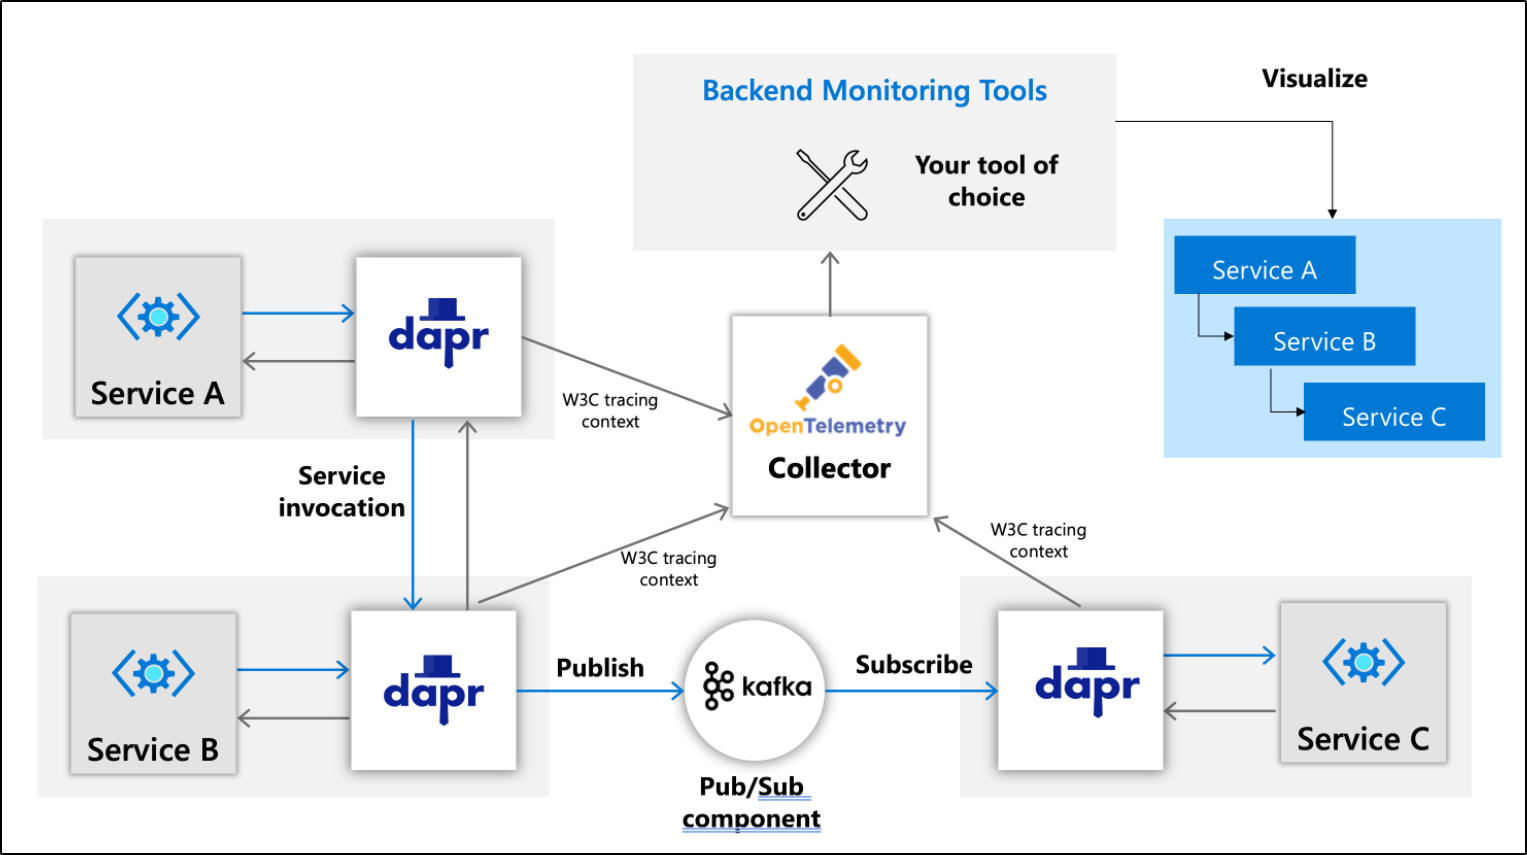
Knowing that Dapr sends to OpenTelemetry means we can use any of the plugins OpenTelemetry supports, including one of my favourites, Datadog.
Setup
First thing we need to do is install the OpenTelemetry configmap. This controls how OpenTelemetry works. The key part is the exporters. Here we see we added datadog with our API key. We also added Datadog to the list in pipelines.traces.exporters.
The rest of the YAML defines the Service and Deployment of OT:
$ cat open-telemtry-collector-datadog.yaml
apiVersion: v1
kind: ConfigMap
metadata:
  name: otel-collector-conf
  labels:
    app: opentelemetry
    component: otel-collector-conf
data:
  otel-collector-config: |
    receivers:
      zipkin:
        endpoint: 0.0.0.0:9411
    extensions:
      health_check:
      pprof:
        endpoint: :1888
      zpages:
        endpoint: :55679
    exporters:
      logging:
        loglevel: debug
      # Depending on where you want to export your trace, use the
      # correct OpenTelemetry trace exporter here.
      #
      # Refer to
      # https://github.com/open-telemetry/opentelemetry-collector/tree/main/exporter
      # and
      # https://github.com/open-telemetry/opentelemetry-collector-contrib/tree/main/exporter
      # for full lists of trace exporters that you can use, and how to
      # configure them.
      datadog:
        api:
          key: "bm90IHJlYWxseSBteSBkZCBrZXkK"

    service:
      extensions: [pprof, zpages, health_check]
      pipelines:
        traces:
          receivers: [zipkin]
          # List your exporter here.
          exporters: [datadog,logging]
    # datadog/api maybe?
---
apiVersion: v1
kind: Service
metadata:
  name: otel-collector
  labels:
    app: opencesus
    component: otel-collector
spec:
  ports:
  - name: zipkin # Default endpoint for Zipkin receiver.
    port: 9411
    protocol: TCP
    targetPort: 9411
  selector:
    component: otel-collector
---
apiVersion: apps/v1
kind: Deployment
metadata:
  name: otel-collector
  labels:
    app: opentelemetry
    component: otel-collector
spec:
  replicas: 1  # scale out based on your usage
  selector:
    matchLabels:
      app: opentelemetry
  template:
    metadata:
      labels:
        app: opentelemetry
        component: otel-collector
    spec:
      containers:
      - name: otel-collector
        image: otel/opentelemetry-collector-contrib-dev:latest
        command:
          - "/otelcontribcol"
          - "--config=/conf/otel-collector-config.yaml"
        resources:
          limits:
            cpu: 1
            memory: 2Gi
          requests:
            cpu: 200m
            memory: 400Mi
        ports:
          - containerPort: 9411 # Default endpoint for Zipkin receiver.
        volumeMounts:
          - name: otel-collector-config-vol
            mountPath: /conf
        livenessProbe:
          httpGet:
            path: /
            port: 13133
        readinessProbe:
          httpGet:
            path: /
            port: 13133
      volumes:
        - configMap:
            name: otel-collector-conf
            items:
              - key: otel-collector-config
                path: otel-collector-config.yaml
          name: otel-collector-config-vol
Then apply it
$ kubectl apply -f open-telemtry-collector-datadog.yaml
configmap/otel-collector-conf created
service/otel-collector created
deployment.apps/otel-collector created
Verification
We can see OT is running:
$ kubectl get pods | grep otel
Otel-collector-67f645b9b7-4shss                      1/1     Running   0          2m9s
Configuration
The next item we set is the zipkin endpoint for the OTel service. Dapr.io uses the Zipkin format to forward telemetry data.
$ cat collector-config.yaml
apiVersion: dapr.io/v1alpha1
kind: Configuration
metadata:
  name: appconfig
  namespace: default
spec:
  tracing:
    samplingRate: "1"
    zipkin:
      endpointAddress: "http://otel-collector.default.svc.cluster.local:9411/api/v2/spans"

$ kubectl apply -f collector-config.yaml
configuration.dapr.io/appconfig created
Lastly, we enable APM logging by adding an annotation to the deployment yaml
$ cat perl-subscriber.yaml | grep appconfig
        dapr.io/config: "appconfig"
In context:
$ cat perl-subscriber.yaml
apiVersion: apps/v1
kind: Deployment
metadata:
  name: perl-subscriber
  labels:
    app: perl-subscriber
spec:
  replicas: 1
  selector:
    matchLabels:
      app: perl-subscriber
  template:
    metadata:
      labels:
        app: perl-subscriber
      annotations:
        dapr.io/enabled: "true"
        dapr.io/app-id: "perl-subscriber"
        dapr.io/app-port: "8080"
        dapr.io/config: "appconfig"
    spec:
      containers:
      - name: perl-subscriber
        image: idjohnson/dapr-perl:v18
        env:
          - name: WEBHOOKURL
            valueFrom:
              secretKeyRef:
                name: teamshook
                key: hookURL
        ports:
        - containerPort: 8080
        imagePullPolicy: Always
Once applied, we can use portforward to see it in results
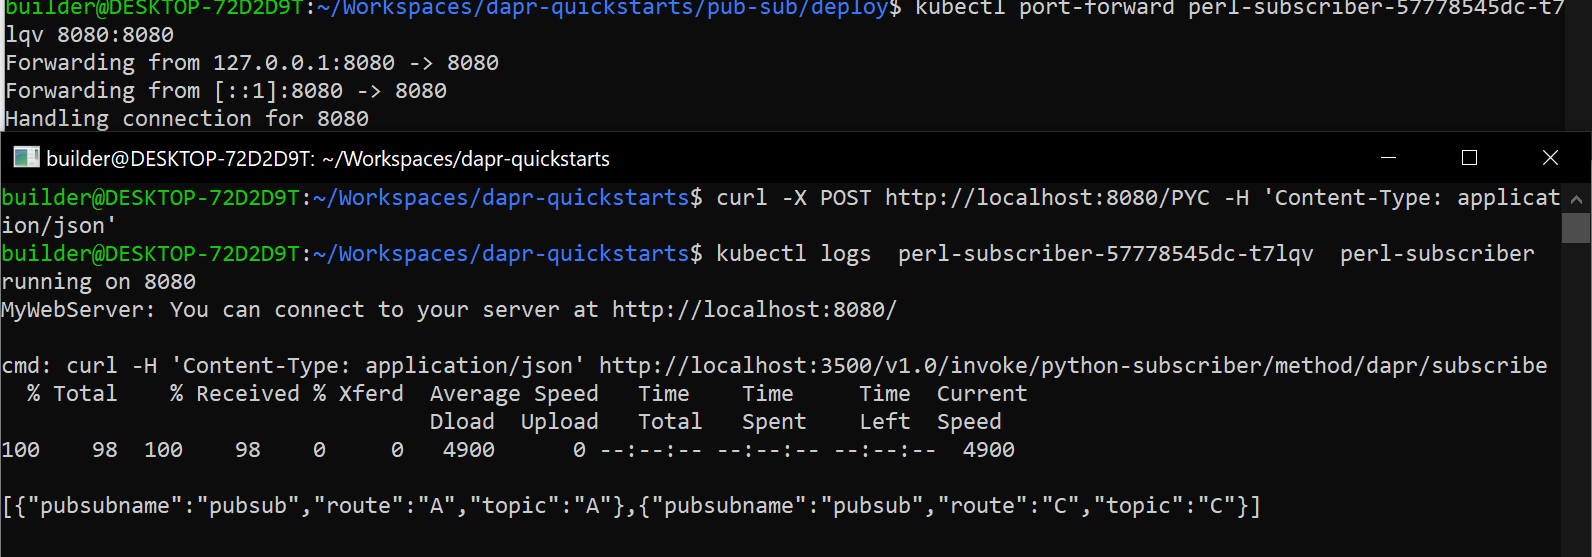
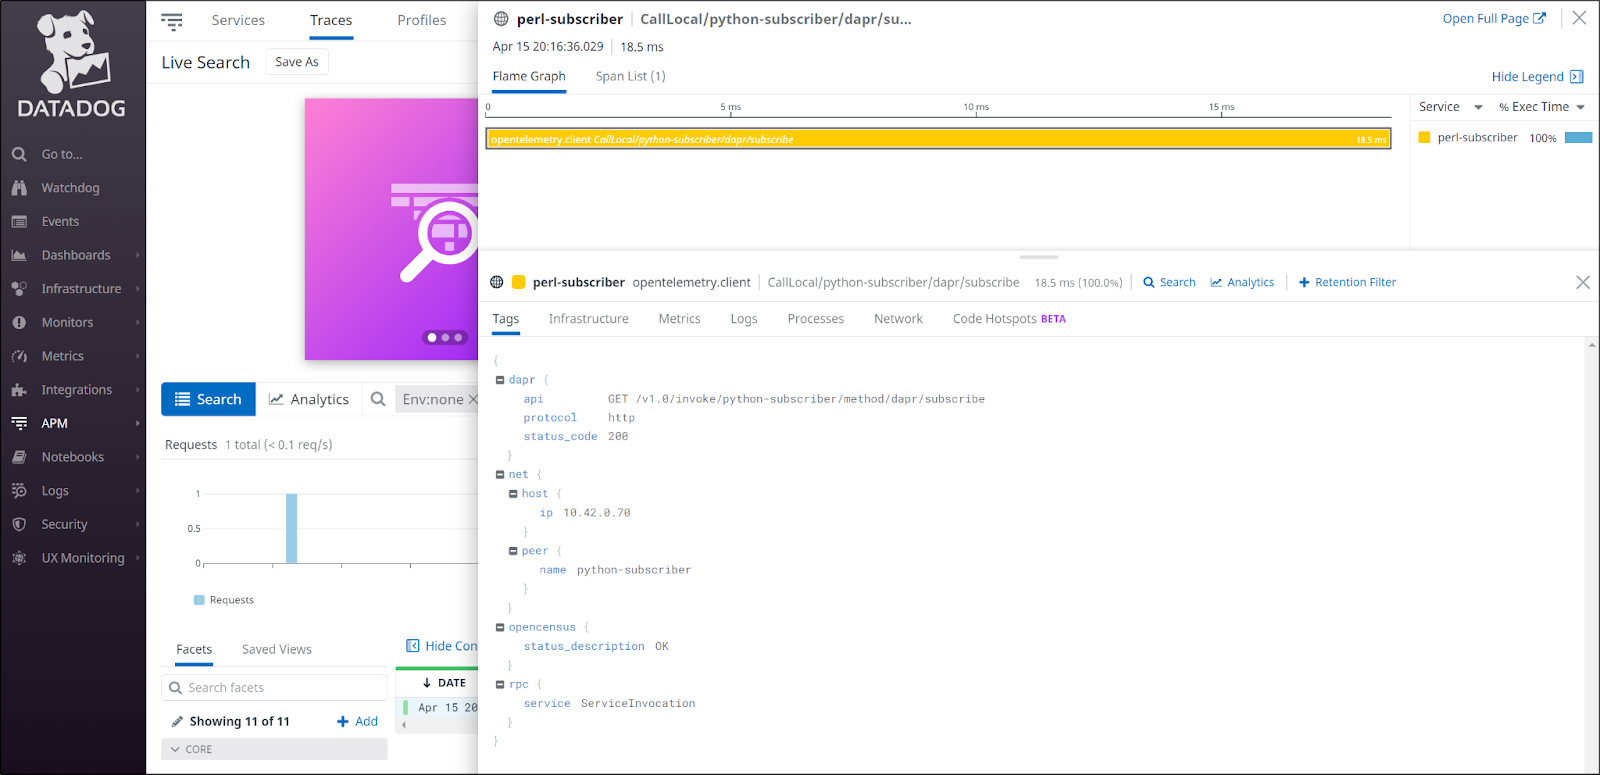
We can see an entry now in Datadog APM
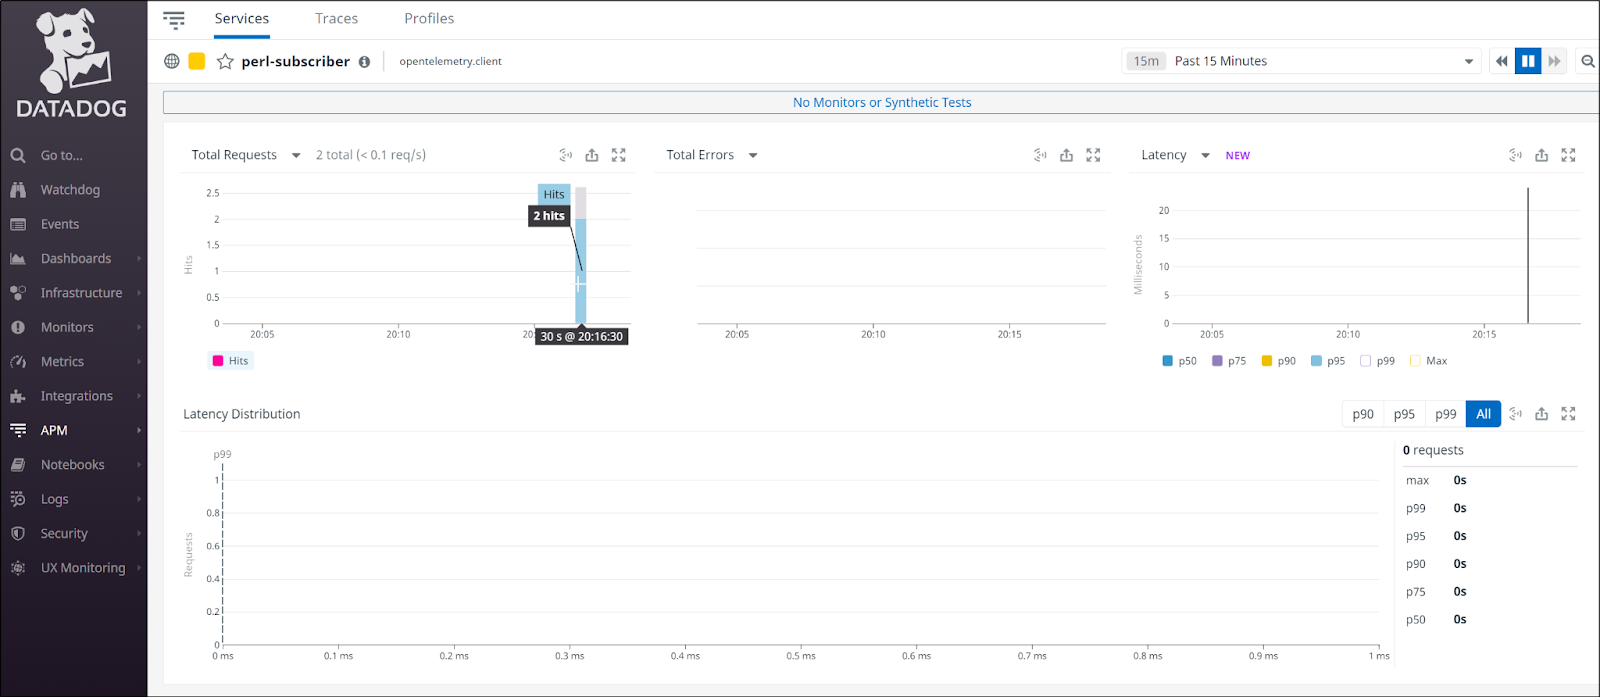
We can then view related traces to see that indeed the perl subscriber properly called out to the python subscriber.
We can instrumentation to the rest of our pub-sub services just as easy
builder@DESKTOP-72D2D9T:~/Workspaces/dapr-quickstarts/pub-sub/deploy$ git diff .
diff --git a/pub-sub/deploy/node-subscriber.yaml b/pub-sub/deploy/node-subscriber.yaml
index de1b848..b78beaf 100644
--- a/pub-sub/deploy/node-subscriber.yaml
+++ b/pub-sub/deploy/node-subscriber.yaml
@@ -17,10 +17,11 @@ spec:
         dapr.io/enabled: "true"
         dapr.io/app-id: "node-subscriber"
         dapr.io/app-port: "3000"
+        dapr.io/config: "appconfig"
     spec:
       containers:
       - name: node-subscriber
         image: dapriosamples/pubsub-node-subscriber:latest
         ports:
         - containerPort: 3000
-        imagePullPolicy: Always
\ No newline at end of file
+        imagePullPolicy: Always
diff --git a/pub-sub/deploy/perl-subscriber.yaml b/pub-sub/deploy/perl-subscriber.yaml
index c104f89..39296a6 100644
--- a/pub-sub/deploy/perl-subscriber.yaml
+++ b/pub-sub/deploy/perl-subscriber.yaml
@@ -17,6 +17,7 @@ spec:
         dapr.io/enabled: "true"
         dapr.io/app-id: "perl-subscriber"
         dapr.io/app-port: "8080"
+        dapr.io/config: "appconfig"
     spec:
       containers:
       - name: perl-subscriber
diff --git a/pub-sub/deploy/python-subscriber.yaml b/pub-sub/deploy/python-subscriber.yaml
index e8e9497..bd460bb 100644
--- a/pub-sub/deploy/python-subscriber.yaml
+++ b/pub-sub/deploy/python-subscriber.yaml
@@ -17,10 +17,11 @@ spec:
         dapr.io/enabled: "true"
         dapr.io/app-id: "python-subscriber"
         dapr.io/app-port: "5000"
+        dapr.io/config: "appconfig"
     spec:
       containers:
       - name: python-subscriber
         image: dapriosamples/pubsub-python-subscriber:latest
         ports:
         - containerPort: 5000
-        imagePullPolicy: Always
\ No newline at end of file
+        imagePullPolicy: Always
diff --git a/pub-sub/deploy/react-form.yaml b/pub-sub/deploy/react-form.yaml
index 3b1b93f..2cd0271 100644
--- a/pub-sub/deploy/react-form.yaml
+++ b/pub-sub/deploy/react-form.yaml
@@ -33,6 +33,7 @@ spec:
         dapr.io/enabled: "true"
         dapr.io/app-id: "react-form"
         dapr.io/app-port: "8080"
+        dapr.io/config: "appconfig"
     spec:
       containers:
       - name: react-form
builder@DESKTOP-72D2D9T:~/Workspaces/dapr-quickstarts/pub-sub/deploy$
And apply
builder@DESKTOP-72D2D9T:~/Workspaces/dapr-quickstarts/pub-sub/deploy$ kubectl apply -f python-subscriber.yaml
deployment.apps/python-subscriber configured
builder@DESKTOP-72D2D9T:~/Workspaces/dapr-quickstarts/pub-sub/deploy$ kubectl apply -f react-form.yaml
service/react-form unchanged
deployment.apps/react-form configured
builder@DESKTOP-72D2D9T:~/Workspaces/dapr-quickstarts/pub-sub/deploy$ kubectl apply -f node-subscriber.yaml
deployment.apps/node-subscriber configured
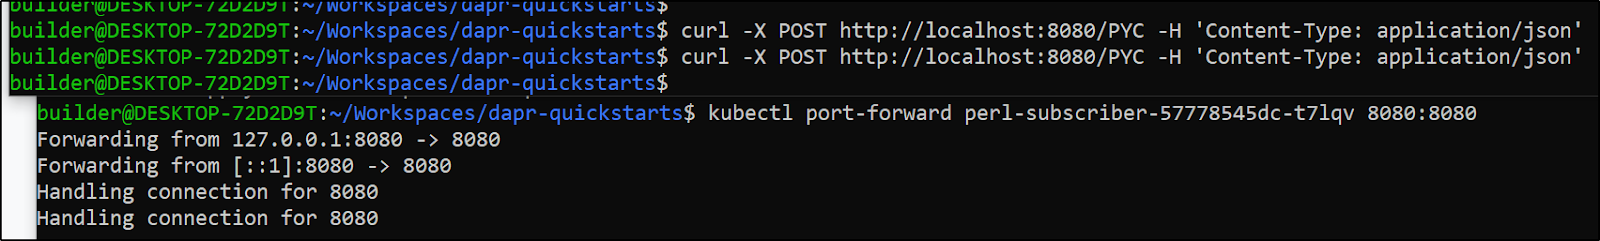
We can port forward and try again
builder@DESKTOP-72D2D9T:~/Workspaces/dapr-quickstarts$ curl -X POST http://localhost:8080/PYC -H 'Content-Type: application/json'In a few moments we see two services now show up in the services pane
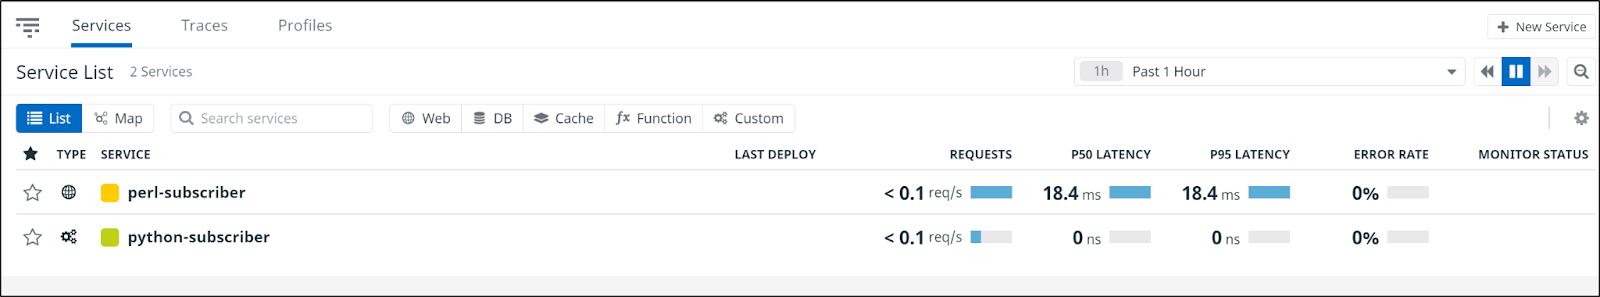
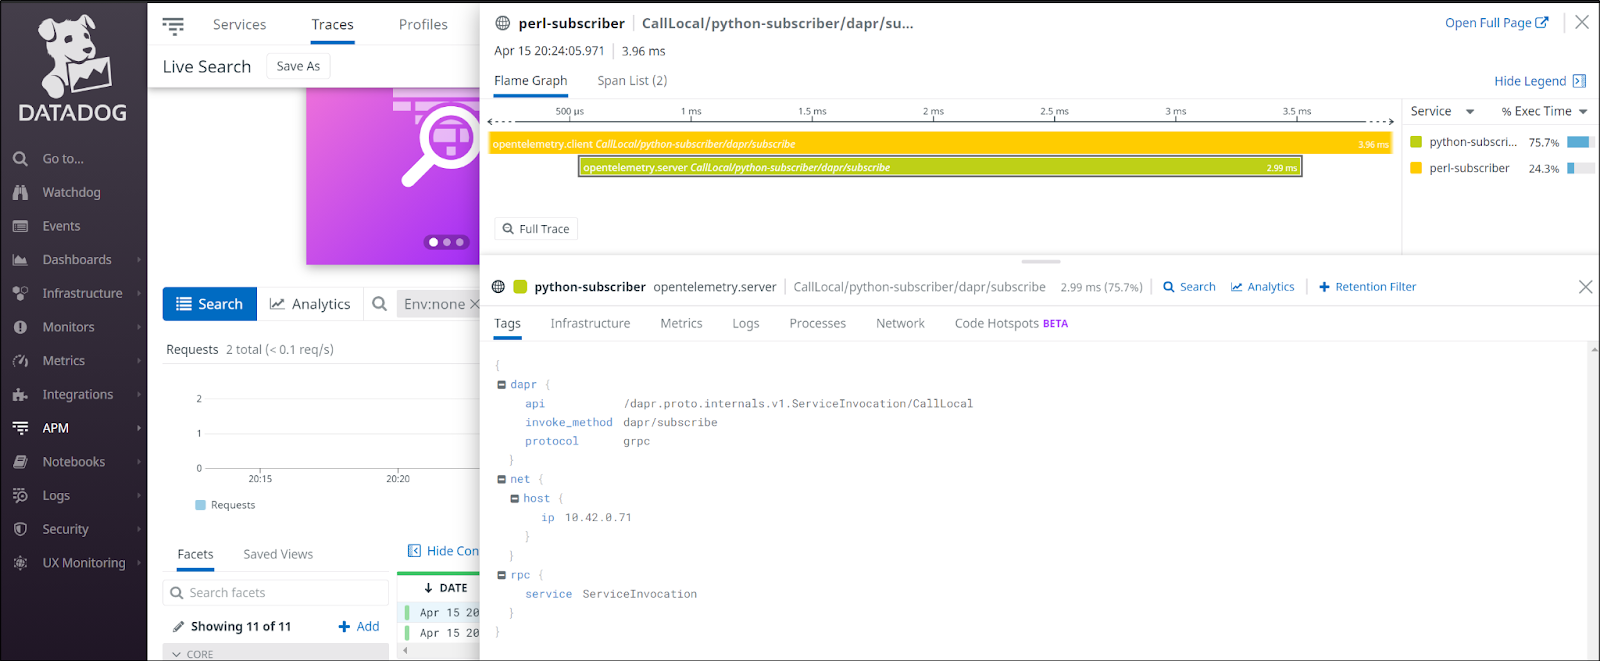
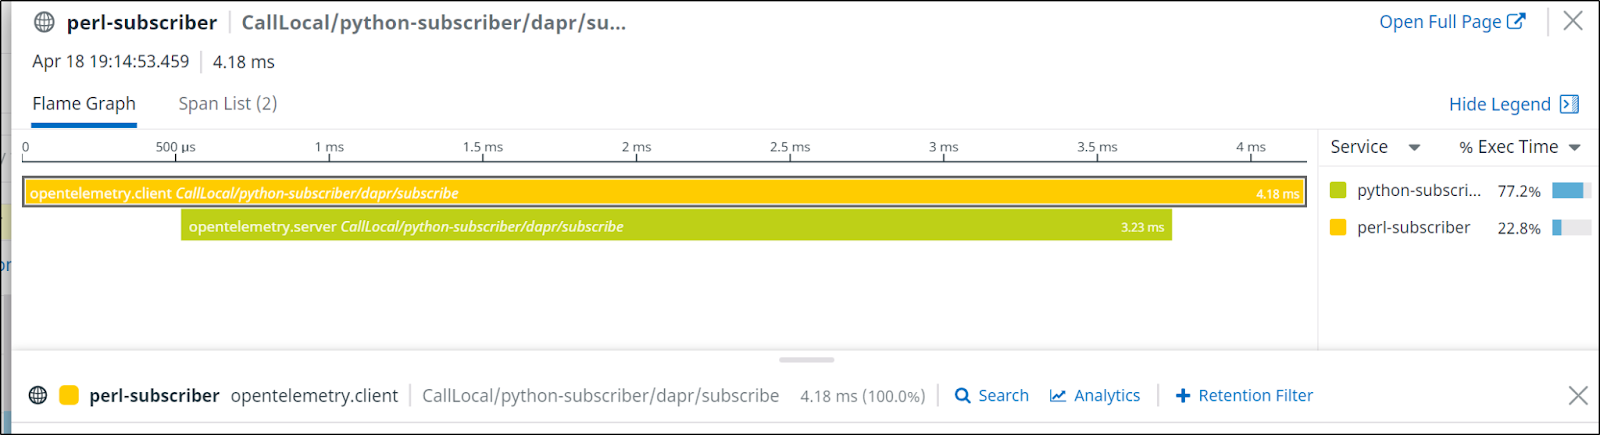
And if we dig in, we can actually see how the Perl subscriber actually called the python subscriber via traces
Using Application Insights
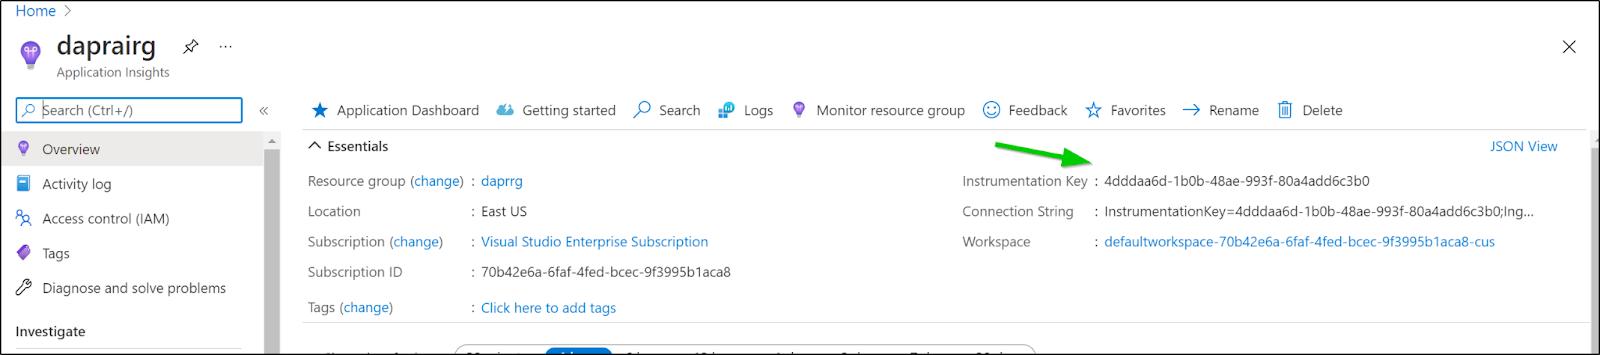
We can create a new Azure Application Insights instance from the portal

When created, we need the AI Instrumentation Key
Next, we need to download and modify the configmap from OT
$ kubectl get cm otel-collector-conf
NAME                  DATA   AGE
otel-collector-conf   1      2d22h

$ diff otelconfig.yaml otelconfig.yaml.bak
31,33d30
<       azuremonitor:
<         instrumentation_key: "4dddaa6d-1b0b-ffff-ffff-80a4add6c3b0"
<         endpoint: "https://eastus-8.in.applicationinsights.azure.com/v2/track"
44c41
<           exporters: [datadog,azuremonitor,logging]
---
>           exporters: [datadog,logging]

$ kubectl apply -f otelconfig.yaml
configmap/otel-collector-conf configured
Then we can rotate the pod
builder@DESKTOP-72D2D9T:~/Workspaces/dapr-quickstarts$ kubectl get pods | grep otel
otel-collector-67f645b9b7-4nswn                      1/1     Running   0          2d10h
builder@DESKTOP-72D2D9T:~/Workspaces/dapr-quickstarts$ kubectl delete pod otel-collector-67f645b9b7-4nswn
pod "otel-collector-67f645b9b7-4nswn" deleted
builder@DESKTOP-72D2D9T:~/Workspaces/dapr-quickstarts$ kubectl get pods | grep otel
otel-collector-67f645b9b7-648gh                      0/1     ContainerCreating   0          11s
builder@DESKTOP-72D2D9T:~/Workspaces/dapr-quickstarts$ kubectl get pods | grep otel
otel-collector-67f645b9b7-648gh                      1/1     Running   0          21s
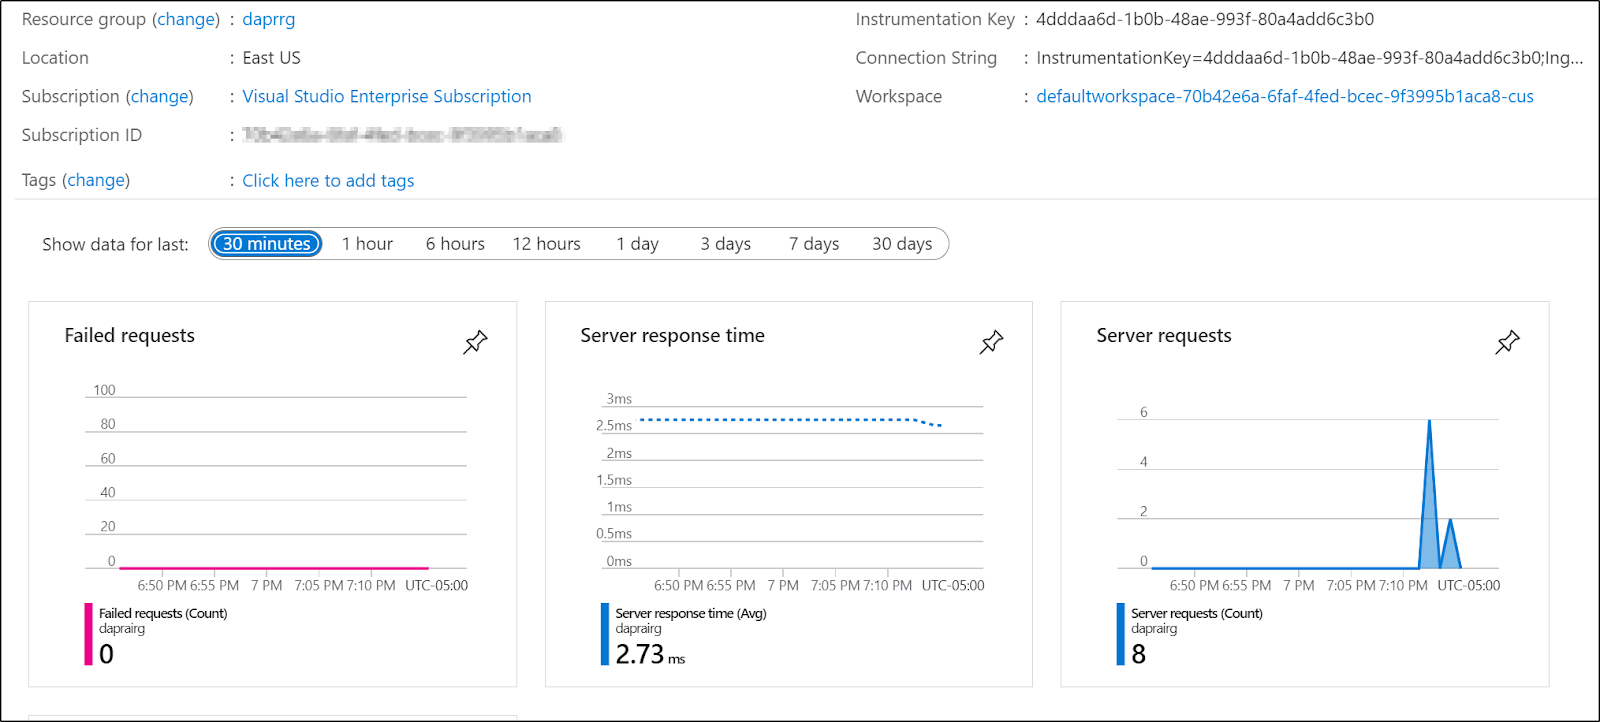
Using the portal, the connection string will look like InstrumentationKey=4dddaa6d-1b0b-ffff-ffff-80a4add6c3b0;IngestionEndpoint=https://eastus-8.in.applicationinsights.azure.com/
Just remember to add "v2/track" to the ingestion endpoint for the configmap.
We can now see results in Application Insights.
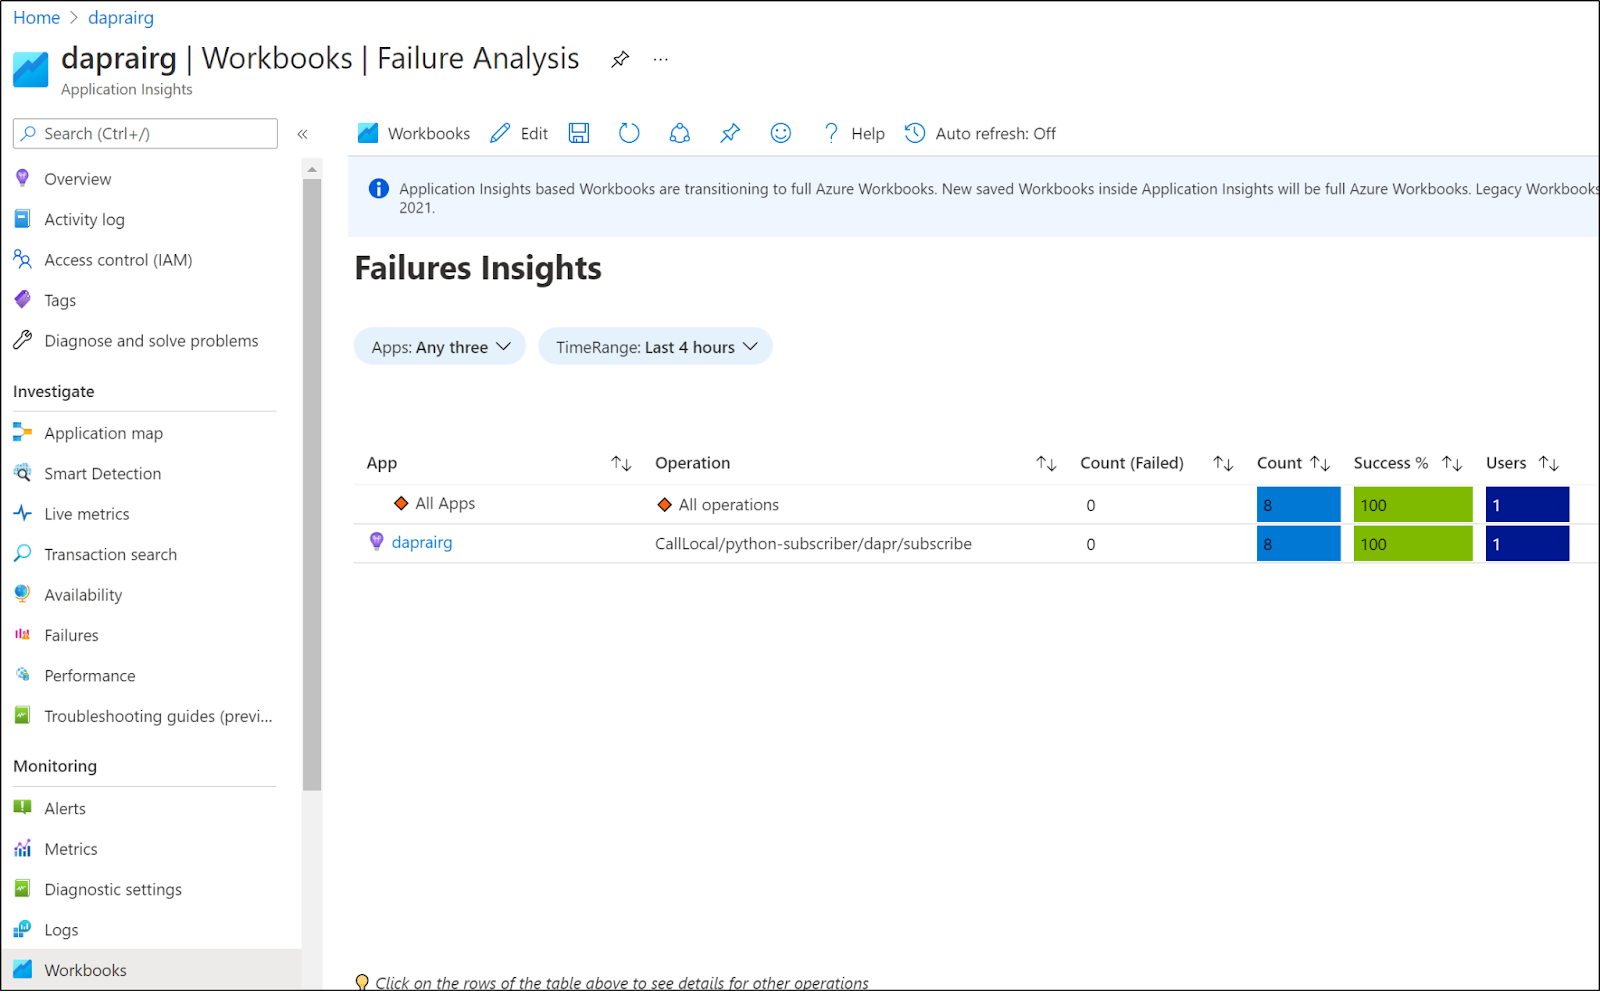
And then we can see results in the workspace as well
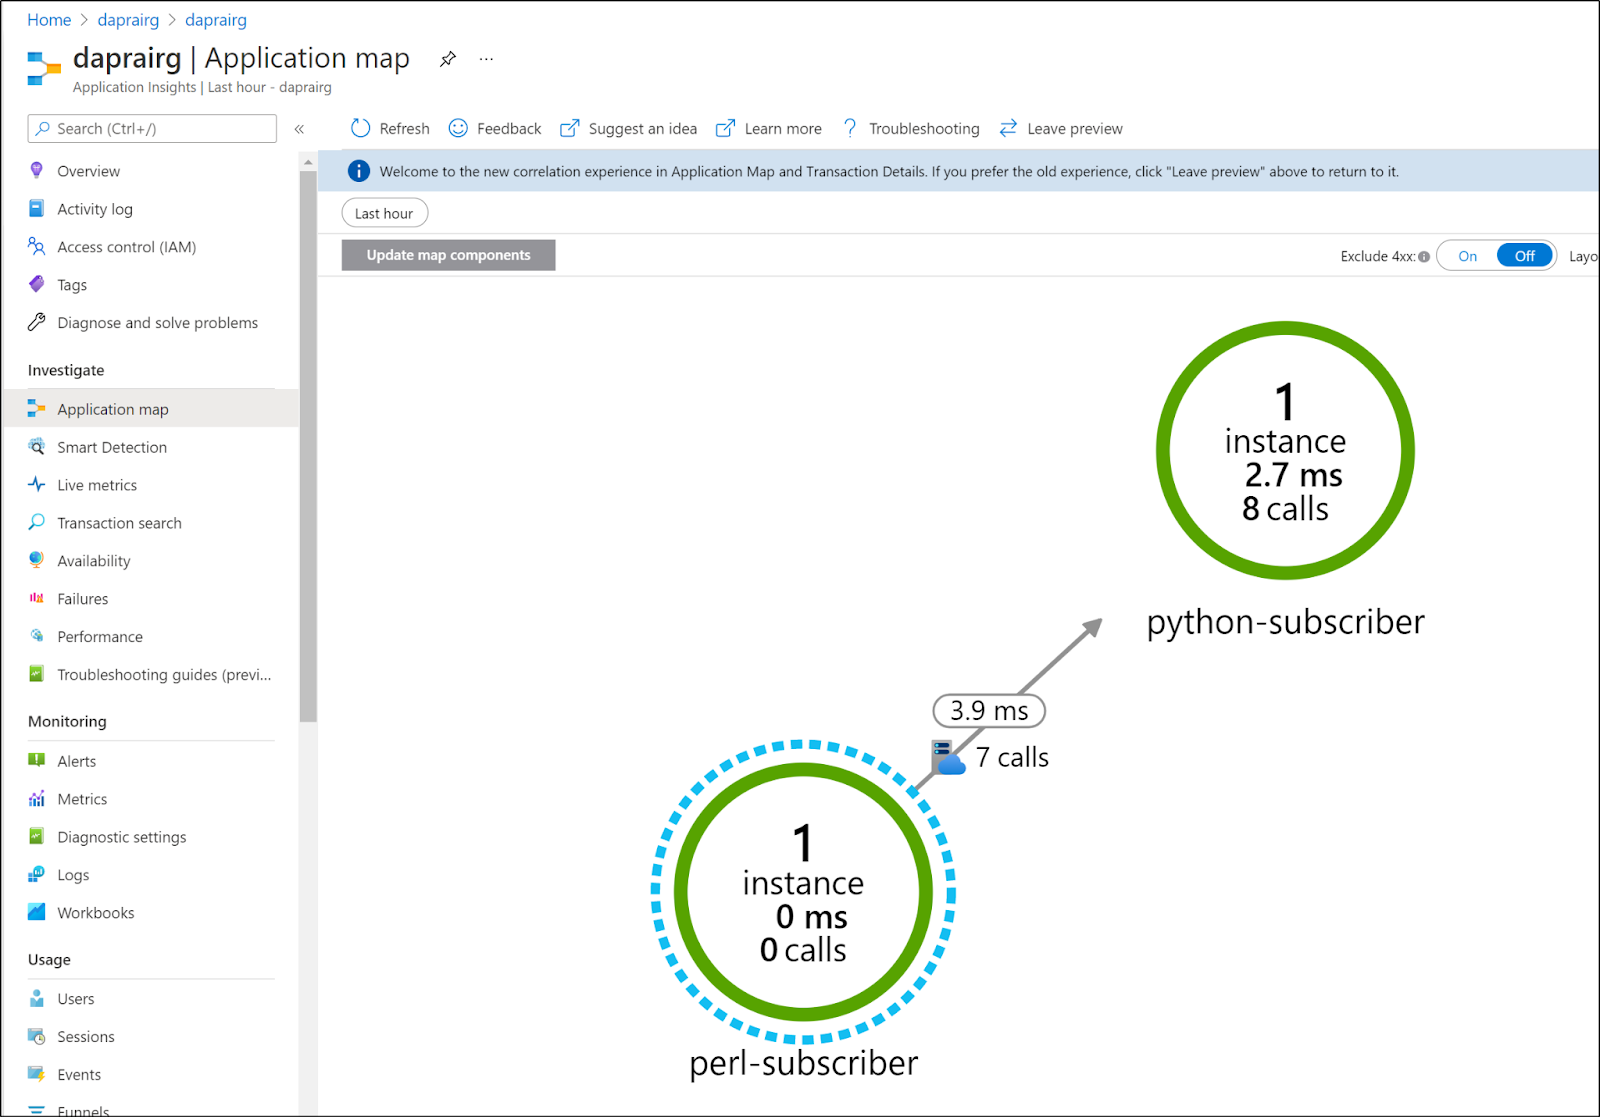
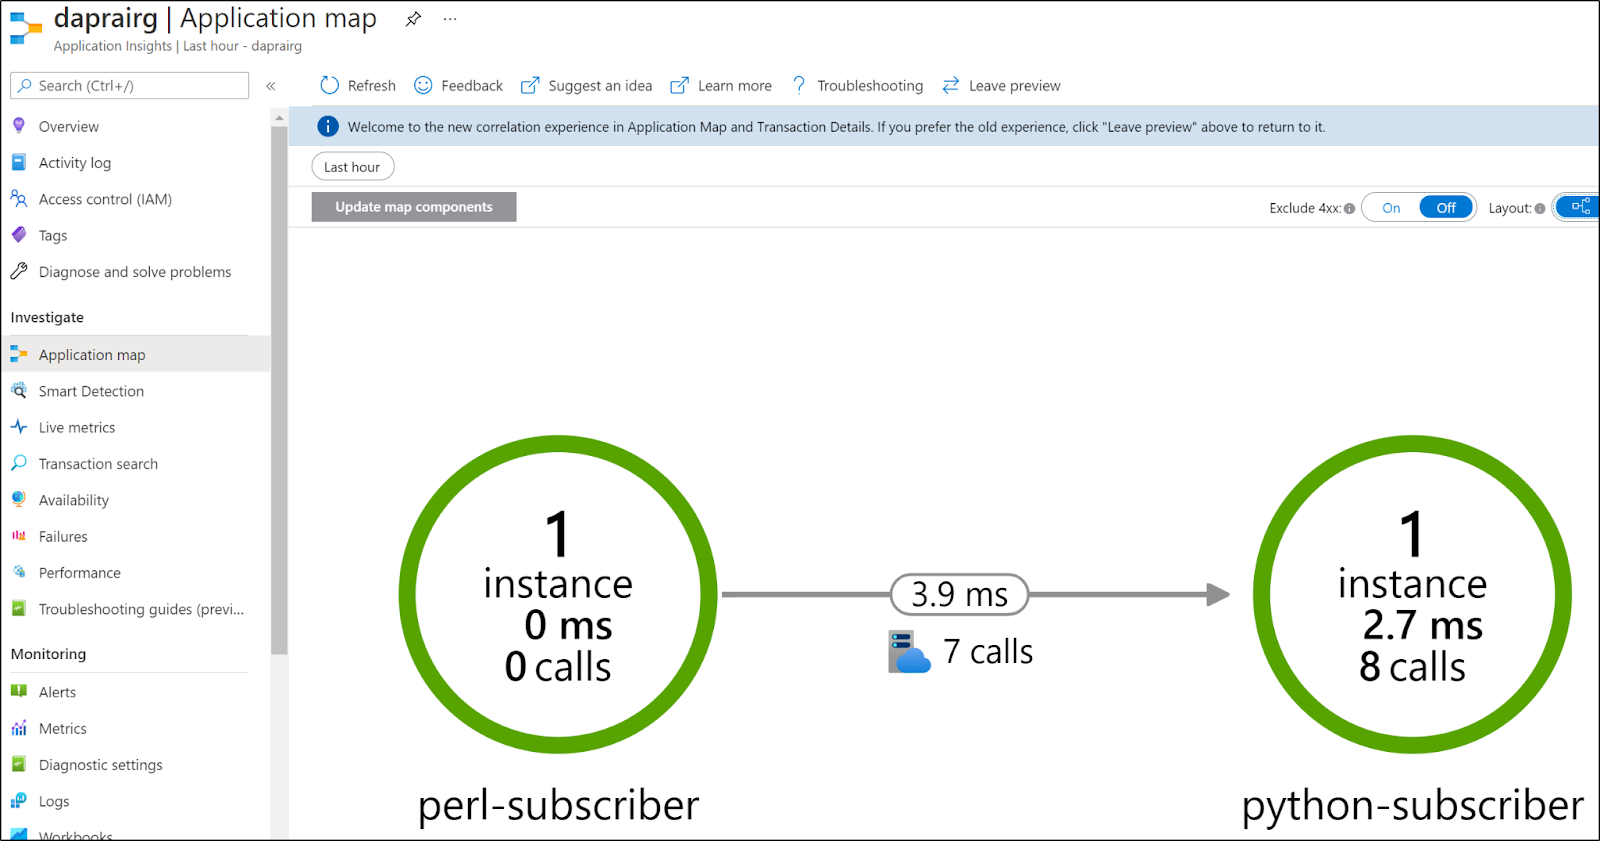
We can also see a map in the Application Map
I should point out that we can see the same kind of map in Datadog as well:

We can also Live traces as well to debug performance in Datadog too.
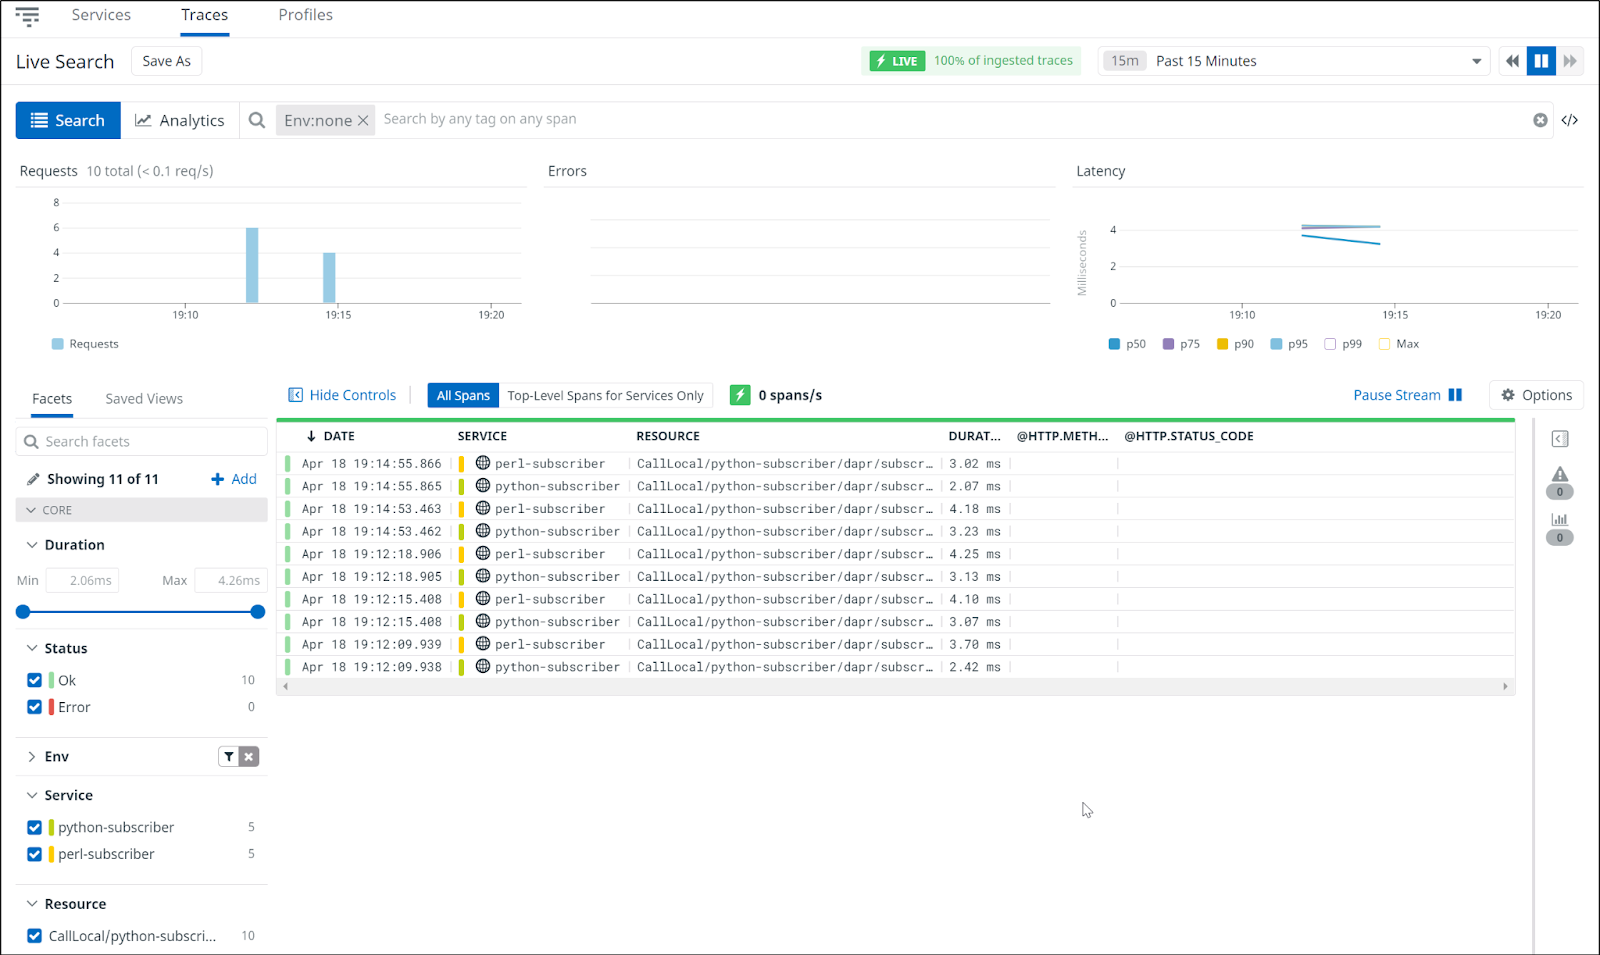
Summary
This was a quick guide just on adding automatic instrumentation of our service using Dapr. This really just covers the Dapr sidecar usage. That is, you might still need to instrument your code if you want non-dapr related calls covered in you APM.
The OT exporters page lists a lot of other APM options as well such as Elastic (for ELK) or Azure Monitor. We explored sending data to Datadog and Azure Monitor simultaneously.
In comparing the two exporters we tried, I really liked the Spans in Datadog and the Service Map in Azure Monitor.
Using Dapr.io to send to OpenTelemetry that pushes to multiple exporters is a great way to instrument our services without having to modify code. For instance, we could start with a simple Open Source ELK stack in Development but move onto Datadog in production. Perhaps we start with Azure Monitor when in Azure but in moving to AWS, we use Cloudwatch EMF.