Published: May 9, 2023 by Isaac Johnson
Today we’ll look at Uptime Kuma and Rundeck again. Unlike the last time, we’ll focus on running these via Docker on a Linux host (instead of Kubernetes). We’ll handle exposing Uptime via an “External IP” route in Kubernetes (which will route external TLS traffic through Kubernetes onto a private VM in my network). We’ll setup and configure Discord notifications and PagerDuty service integrations. Then lastly, we’ll setup a simple docker based RunDeck service to act as internal webhook runner.
Uptime Kuma (docker)
Last time I focused on exposing Uptime Kuma via Helm and Kubernetes.
How might we do it with just a local Linux VM or machine?
First, check if you have Docker
builder@builder-T100:~$ docker ps

Command 'docker' not found, but can be installed with:

sudo snap install docker     # version 20.10.17, or
sudo apt  install docker.io  # version 20.10.21-0ubuntu1~20.04.2

See 'snap info docker' for additional versions.
Clearly, I need to add Docker first
Remove any old versions
builder@builder-T100:~$ sudo apt-get remove docker docker-engine docker.io containerd runc
[sudo] password for builder:
Reading package lists... Done
Building dependency tree
Reading state information... Done
E: Unable to locate package docker-engine
Install the package index required libraries
$ sudo apt-get update && sudo apt-get install ca-certificates curl gnupg
Get the official docker gpg key
builder@builder-T100:~$ sudo install -m 0755 -d /etc/apt/keyrings
builder@builder-T100:~$ curl -fsSL https://download.docker.com/linux/ubuntu/gpg | sudo gpg --dearmor -o /etc/apt/keyrings/docker.gpg
builder@builder-T100:~$ sudo chmod a+r /etc/apt/keyrings/docker.gpg
Add the Docker repo
echo \
  "deb [arch="$(dpkg --print-architecture)" signed-by=/etc/apt/keyrings/docker.gpg] https://download.docker.com/linux/ubuntu \
  "$(. /etc/os-release && echo "$VERSION_CODENAME")" stable" | \
  sudo tee /etc/apt/sources.list.d/docker.list > /dev/null
Then we can install Docker
$ sudo apt-get update && sudo apt-get install docker-ce docker-ce-cli containerd.io docker-buildx-plugin docker-compose-plugin
Get:2 https://download.docker.com/linux/ubuntu focal InRelease [57.7 kB]
Hit:3 http://security.ubuntu.com/ubuntu focal-security InRelease
Hit:4 http://us.archive.ubuntu.com/ubuntu focal-updates InRelease
Hit:5 http://us.archive.ubuntu.com/ubuntu focal-backports InRelease
... snip ...
0 upgraded, 11 newly installed, 0 to remove and 6 not upgraded.
Need to get 115 MB of archives.
After this operation, 434 MB of additional disk space will be used.
Do you want to continue? [Y/n] Y
Get:1 http://us.archive.ubuntu.com/ubuntu focal/universe amd64 pigz amd64 2.4-1 [57.4 kB]
... snip ...
Setting up gir1.2-javascriptcoregtk-4.0:amd64 (2.38.6-0ubuntu0.20.04.1) ...
Setting up libwebkit2gtk-4.0-37:amd64 (2.38.6-0ubuntu0.20.04.1) ...
Setting up gir1.2-webkit2-4.0:amd64 (2.38.6-0ubuntu0.20.04.1) ...
Processing triggers for libc-bin (2.31-0ubuntu9.9) ...
Unless we want to use sudo everytime, let’s add ourselves to the docker group
builder@builder-T100:~$ sudo groupadd docker
groupadd: group 'docker' already exists
builder@builder-T100:~$ sudo usermod -aG docker builder
I’ll logout and login to see I can run docker commands
builder@builder-T100:~$ exit
logout
Connection to 192.168.1.100 closed.
builder@DESKTOP-QADGF36:~$ ssh builder@192.168.1.100
Welcome to Ubuntu 20.04.6 LTS (GNU/Linux 5.15.0-71-generic x86_64)

 * Documentation:  https://help.ubuntu.com
 * Management:     https://landscape.canonical.com
 * Support:        https://ubuntu.com/advantage

Expanded Security Maintenance for Applications is not enabled.

0 updates can be applied immediately.

9 additional security updates can be applied with ESM Apps.
Learn more about enabling ESM Apps service at https://ubuntu.com/esm

New release '22.04.2 LTS' available.
Run 'do-release-upgrade' to upgrade to it.

Your Hardware Enablement Stack (HWE) is supported until April 2025.
Last login: Tue May  9 06:27:47 2023 from 192.168.1.160
builder@builder-T100:~$ docker ps
CONTAINER ID   IMAGE     COMMAND   CREATED   STATUS    PORTS     NAMES
Now let’s create a Docker volume for Uptime Kuma
builder@builder-T100:~$ docker volume create uptime-kuma
uptime-kuma
Lastly, launch a fresh Docker instance on port 3001
builder@builder-T100:~$ docker run -d --restart=always -p 3001:3001 -v uptime-kuma:/app/data --name uptime-kuma louislam/uptime-kuma:1
Unable to find image 'louislam/uptime-kuma:1' locally
1: Pulling from louislam/uptime-kuma
9fbefa337077: Pull complete
c119feee8fd1: Pull complete
b3c823584bd9: Pull complete
460e41fb6fee: Pull complete
6834ffbb754a: Pull complete
784b2d9bfd2e: Pull complete
edeeb5ae0fb9: Pull complete
d6f2928f0ccc: Pull complete
4f4fb700ef54: Pull complete
08a0647bce64: Pull complete
Digest: sha256:1630eb7859c5825a1bc3fcbea9467ab3c9c2ef0d98a9f5f0ab0aec9791c027e8
Status: Downloaded newer image for louislam/uptime-kuma:1
0d276b3055232a1bec04f141501039c1809522ea0ff94d5de03643e19c91b152
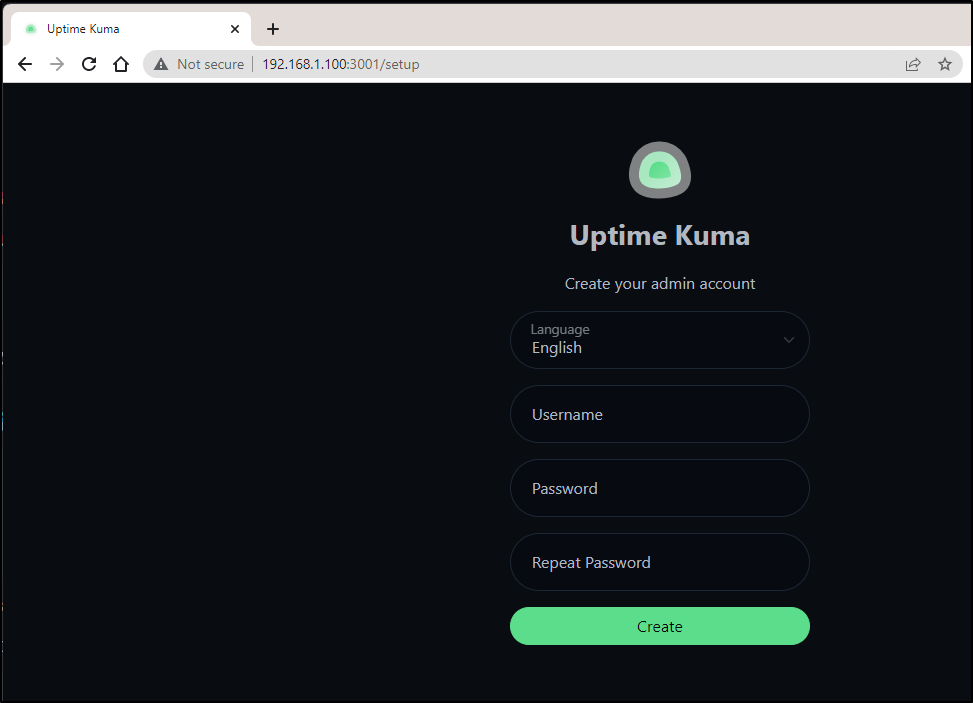
We can now create an account
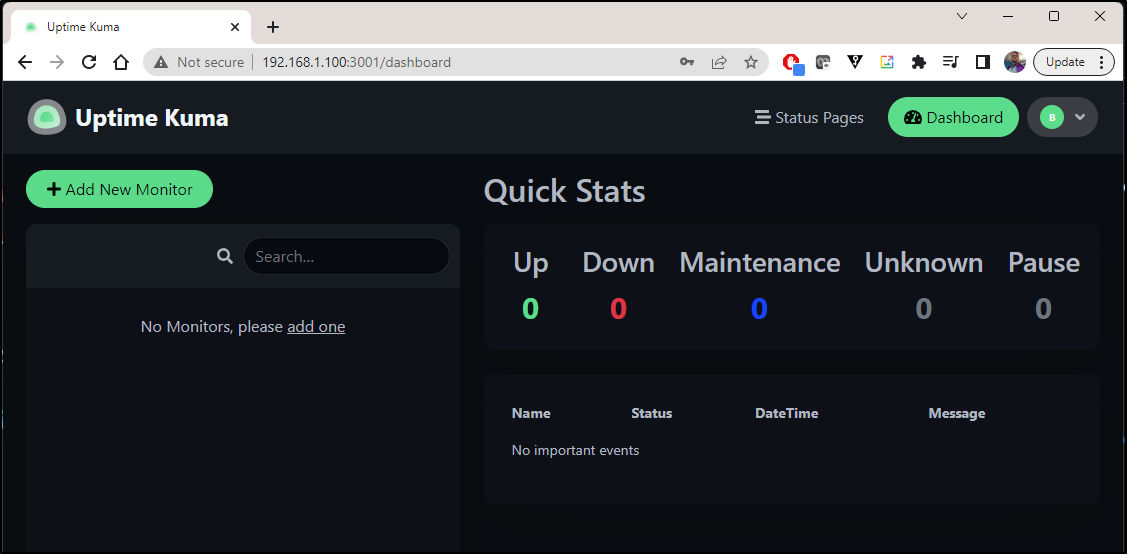
We now have a functional local instance
However, what if I want to reach it externally? Do I need to add a helm chart?
External routing via Kubernetes Ingress
Actually, this is easier than it may seem
Some time ago I had already setup an A record to the ingress external IP
$ cat r53-uptimekuma.json
{
  "Comment": "CREATE uptime fb.s A record ",
  "Changes": [
    {
      "Action": "CREATE",
      "ResourceRecordSet": {
        "Name": "uptime.freshbrewed.science",
        "Type": "A",
        "TTL": 300,
        "ResourceRecords": [
          {
            "Value": "73.242.50.46"
          }
        ]
      }
    }
  ]
}
My cluster is still listening, even though no such service is set up
The first bit we need is an Ingress setup with TLS
apiVersion: networking.k8s.io/v1
kind: Ingress
metadata:
  annotations:
    cert-manager.io/cluster-issuer: letsencrypt-prod
    kubernetes.io/ingress.class: nginx
    kubernetes.io/tls-acme: "true"
  labels:
    app.kubernetes.io/instance: uptimeingress
  name: uptimeingress
spec:
  rules:
  - host: uptime.freshbrewed.science
    http:
      paths:
      - backend:
          service:
            name: uptime-external-ip
            port:
              number: 80
        path: /
        pathType: ImplementationSpecific
  tls:
  - hosts:
    - uptime.freshbrewed.science
    secretName: uptime-tls
That assumes some service of “uptime-external-ip” is exposed on 80.
We then define that service
apiVersion: v1
kind: Service
metadata:
  name: uptime-external-ip
spec:
  ports:
  - name: utapp
    port: 80
    protocol: TCP
    targetPort: 3001
  clusterIP: None
  type: ClusterIP
Unlike regular k8s services, there is no label to send traffic to some pods… This looks sort of strange.
We lastly create an endpoint that would tie to this
apiVersion: v1
kind: Endpoints
metadata:
  name: uptime-external-ip
subsets:
- addresses:
  - ip: 192.168.1.100
  ports:
  - name: utapp
    port: 3001
    protocol: TCP
We can now see the whole YAML file and apply it
$ cat setup-fwd-uptime.yaml
apiVersion: networking.k8s.io/v1
kind: Ingress
metadata:
  annotations:
    cert-manager.io/cluster-issuer: letsencrypt-prod
    kubernetes.io/ingress.class: nginx
    kubernetes.io/tls-acme: "true"
  labels:
    app.kubernetes.io/instance: uptimeingress
  name: uptimeingress
spec:
  rules:
  - host: uptime.freshbrewed.science
    http:
      paths:
      - backend:
          service:
            name: uptime-external-ip
            port:
              number: 80
        path: /
        pathType: ImplementationSpecific
  tls:
  - hosts:
    - uptime.freshbrewed.science
    secretName: uptime-tls
---
apiVersion: v1
kind: Service
metadata:
  name: uptime-external-ip
spec:
  ports:
  - name: utapp
    port: 80
    protocol: TCP
    targetPort: 3001
  clusterIP: None
  type: ClusterIP
---
apiVersion: v1
kind: Endpoints
metadata:
  name: uptime-external-ip
subsets:
- addresses:
  - ip: 192.168.1.100
  ports:
  - name: utapp
    port: 3001
    protocol: TCP

$ kubectl apply -f setup-fwd-uptime.yaml
ingress.networking.k8s.io/uptimeingress created
service/uptime-external-ip created
endpoints/uptime-external-ip created
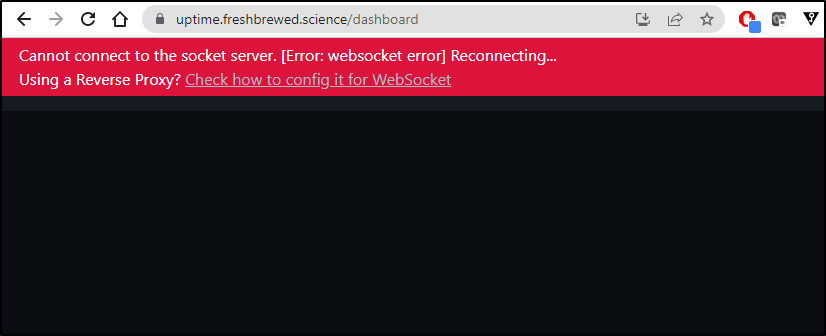
This got me closer
I need to tell NGinx this is a Websockets service.
This is just an annotation. I moved the Ingress YAML to a file so i could easily delete/update/add back
$ cat uptime-ingress.yaml
apiVersion: networking.k8s.io/v1
kind: Ingress
metadata:
  annotations:
    cert-manager.io/cluster-issuer: letsencrypt-prod
    kubernetes.io/ingress.class: nginx
    kubernetes.io/tls-acme: "true"
  labels:
    app.kubernetes.io/instance: uptimeingress
  name: uptimeingress
spec:
  rules:
  - host: uptime.freshbrewed.science
    http:
      paths:
      - backend:
          service:
            name: uptime-external-ip
            port:
              number: 80
        path: /
        pathType: ImplementationSpecific
  tls:
  - hosts:
    - uptime.freshbrewed.science
    secretName: uptime-tls
$ kubectl delete -f uptime-ingress.yaml
ingress.networking.k8s.io "uptimeingress" deleted
$ cat uptime-ingress.yaml
apiVersion: networking.k8s.io/v1
kind: Ingress
metadata:
  annotations:
    cert-manager.io/cluster-issuer: letsencrypt-prod
    kubernetes.io/ingress.class: nginx
    kubernetes.io/tls-acme: "true"
    nginx.ingress.kubernetes.io/proxy-read-timeout: "3600"
    nginx.ingress.kubernetes.io/proxy-send-timeout: "3600"
    nginx.org/websocket-services: uptime-external-ip
  labels:
    app.kubernetes.io/instance: uptimeingress
  name: uptimeingress
spec:
  rules:
  - host: uptime.freshbrewed.science
    http:
      paths:
      - backend:
          service:
            name: uptime-external-ip
            port:
              number: 80
        path: /
        pathType: ImplementationSpecific
  tls:
  - hosts:
    - uptime.freshbrewed.science
    secretName: uptime-tls
$ kubectl apply -f uptime-ingress.yaml
ingress.networking.k8s.io/uptimeingress created
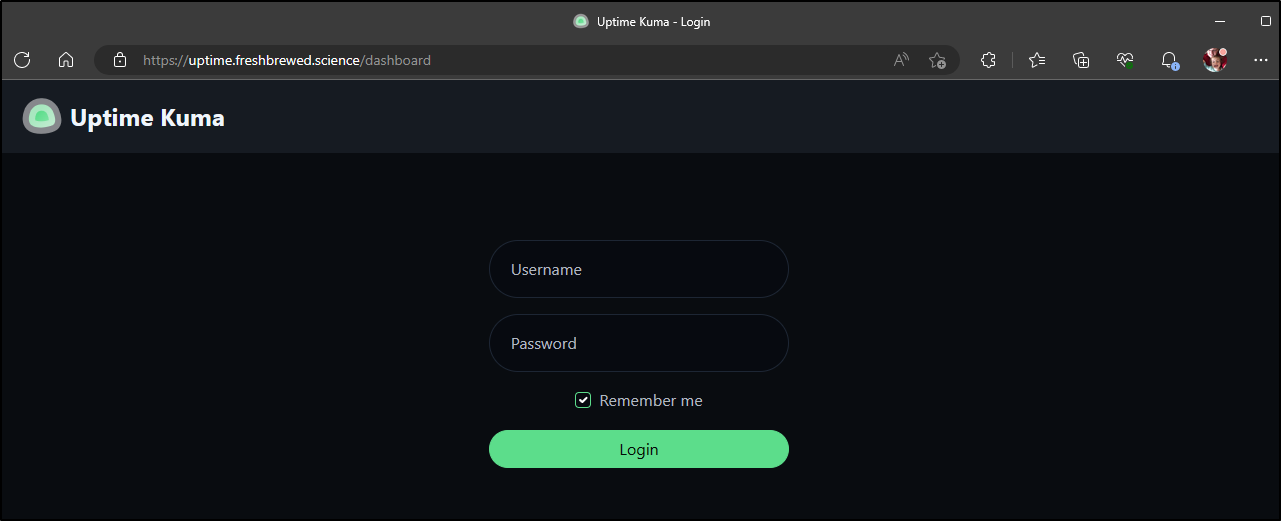
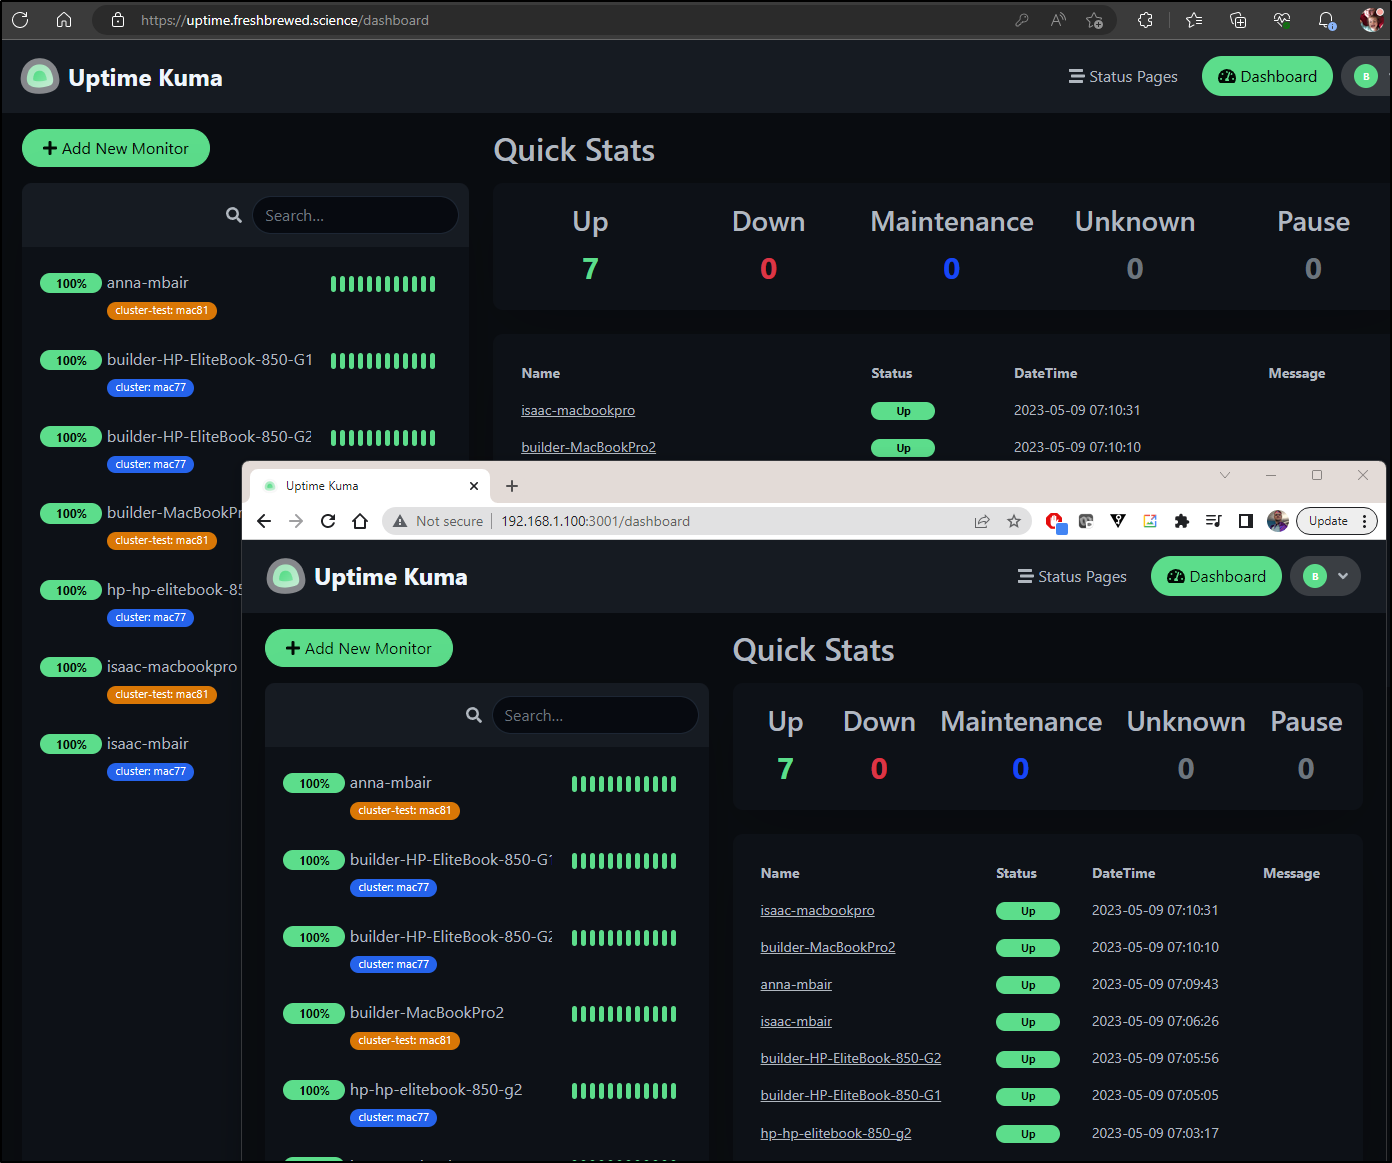
I now have a valid HTTPS ingress
Adding Monitors
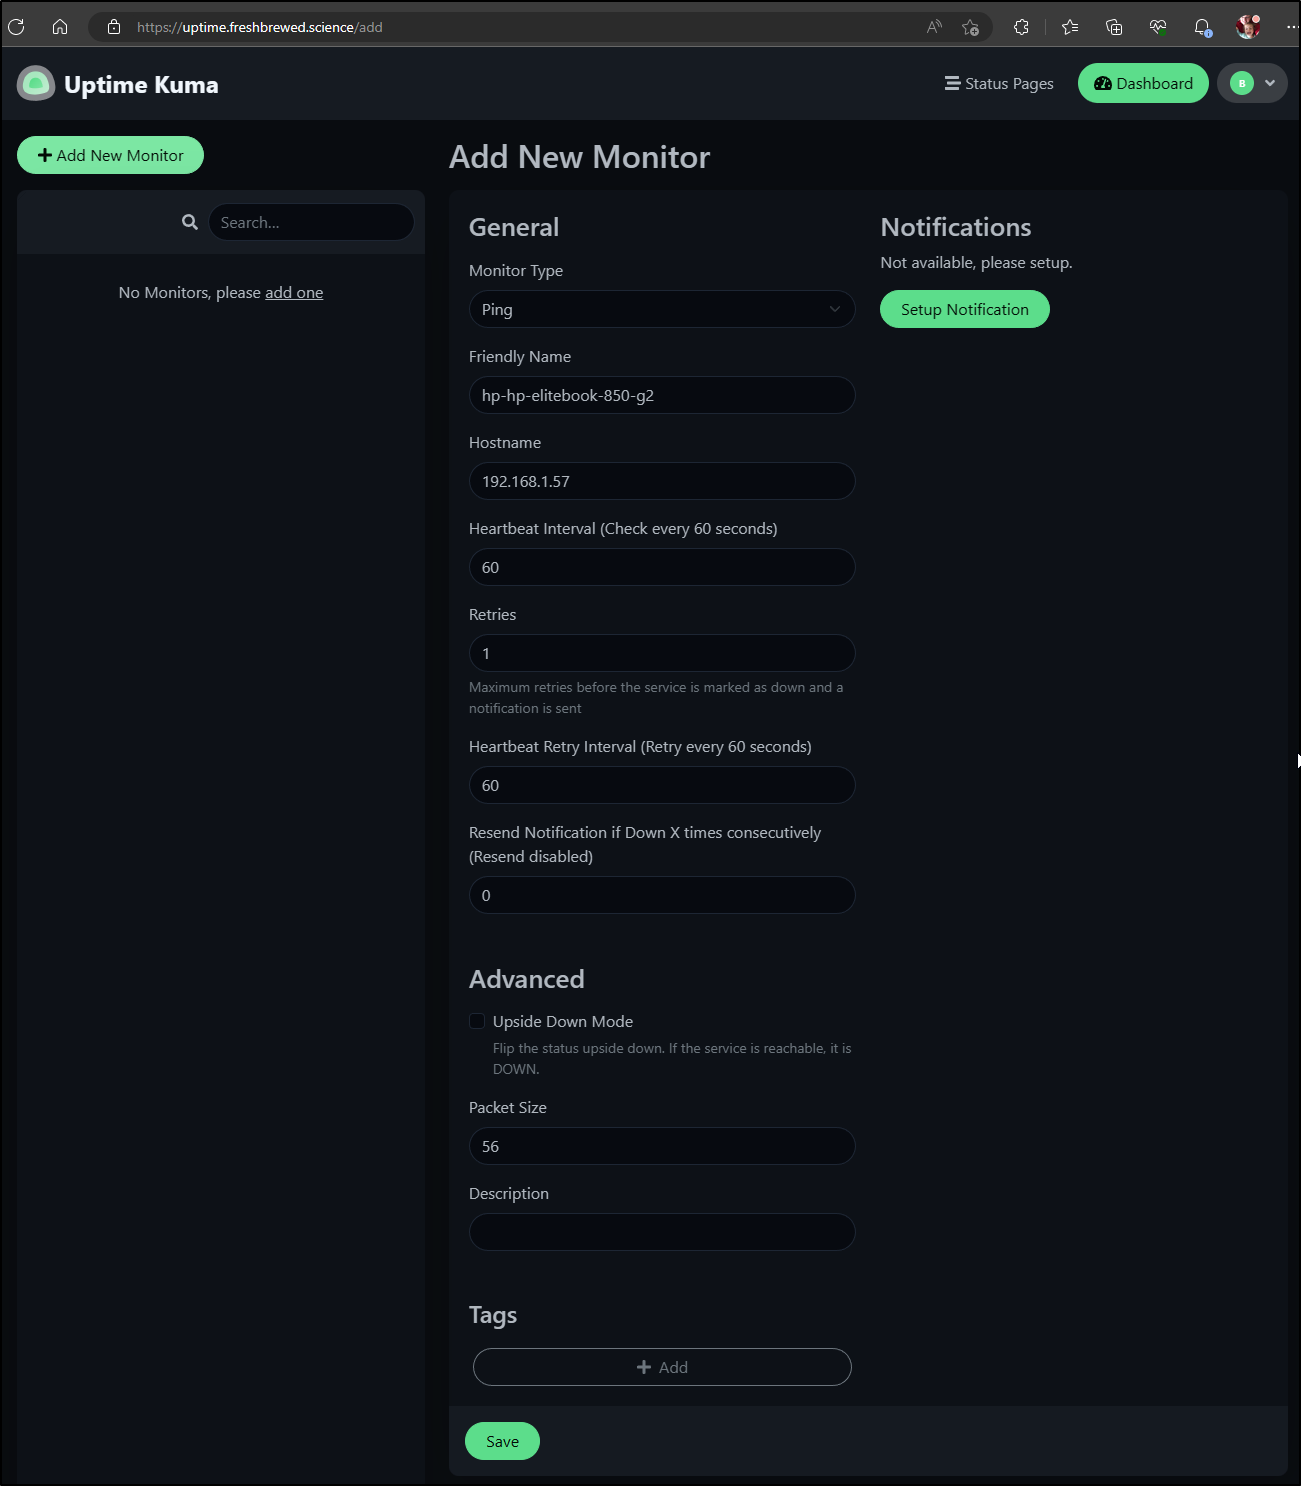
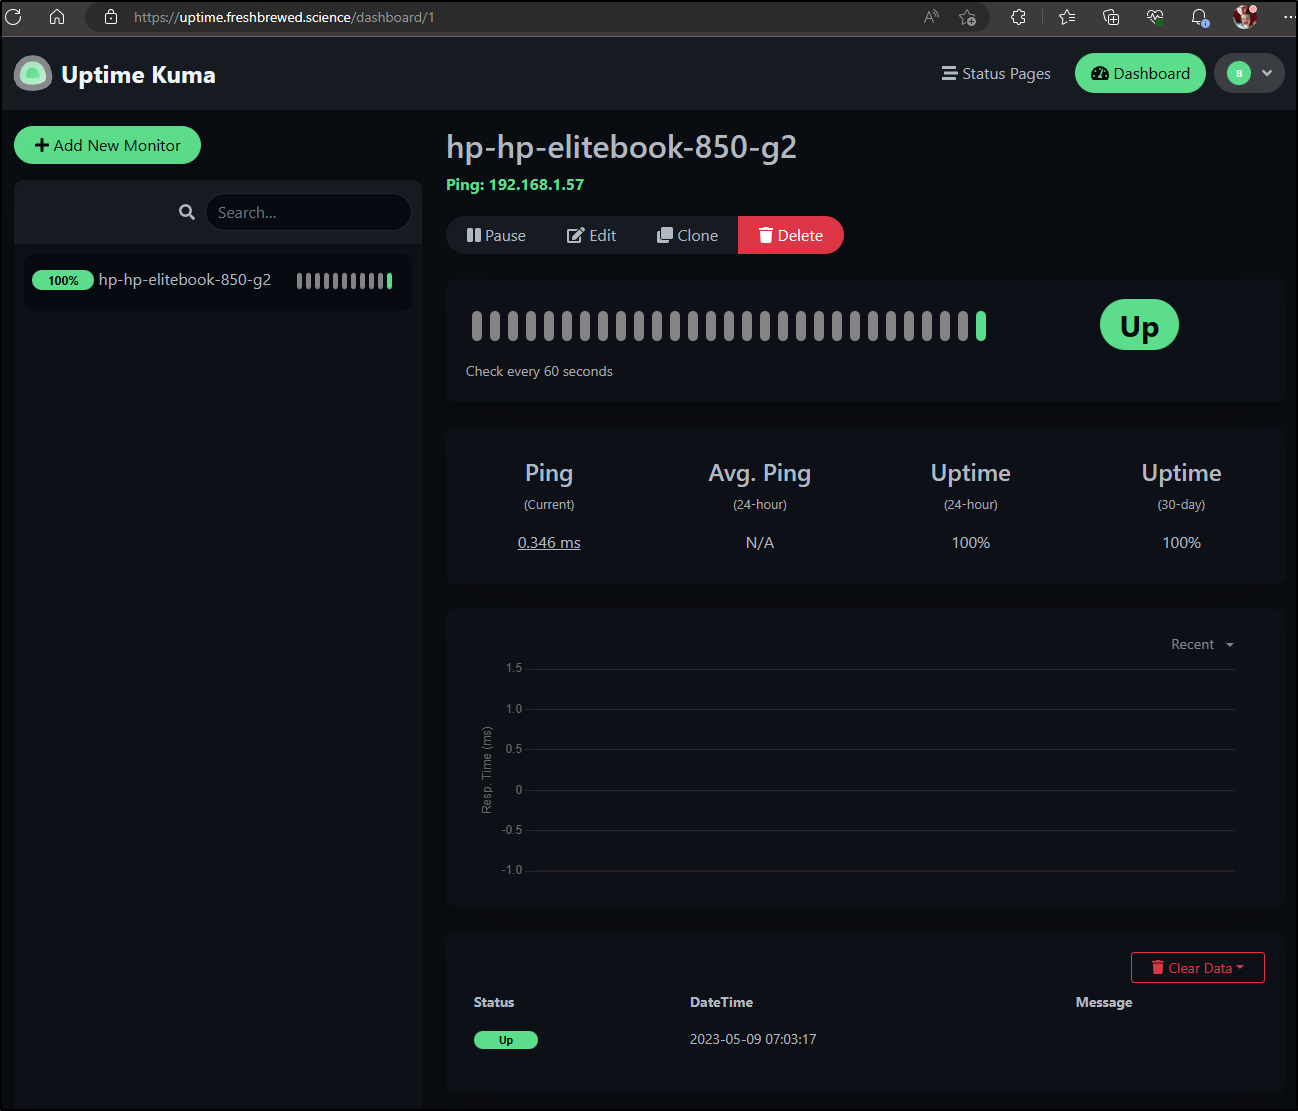
Let’s start with just monitoring some of my hosts
Since that worked
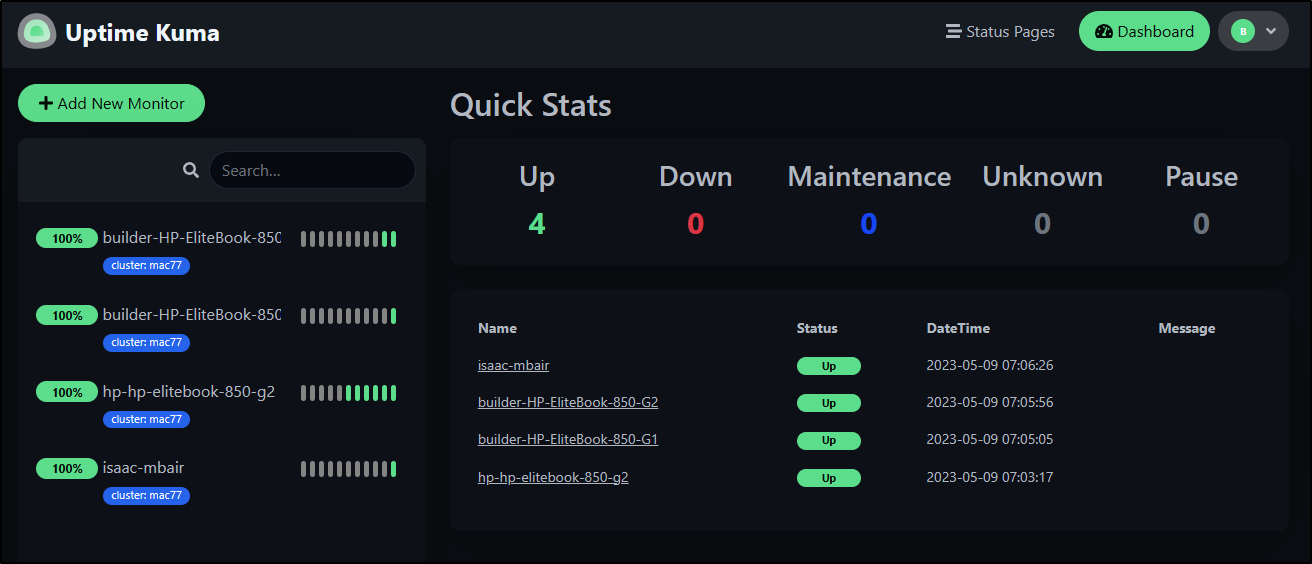
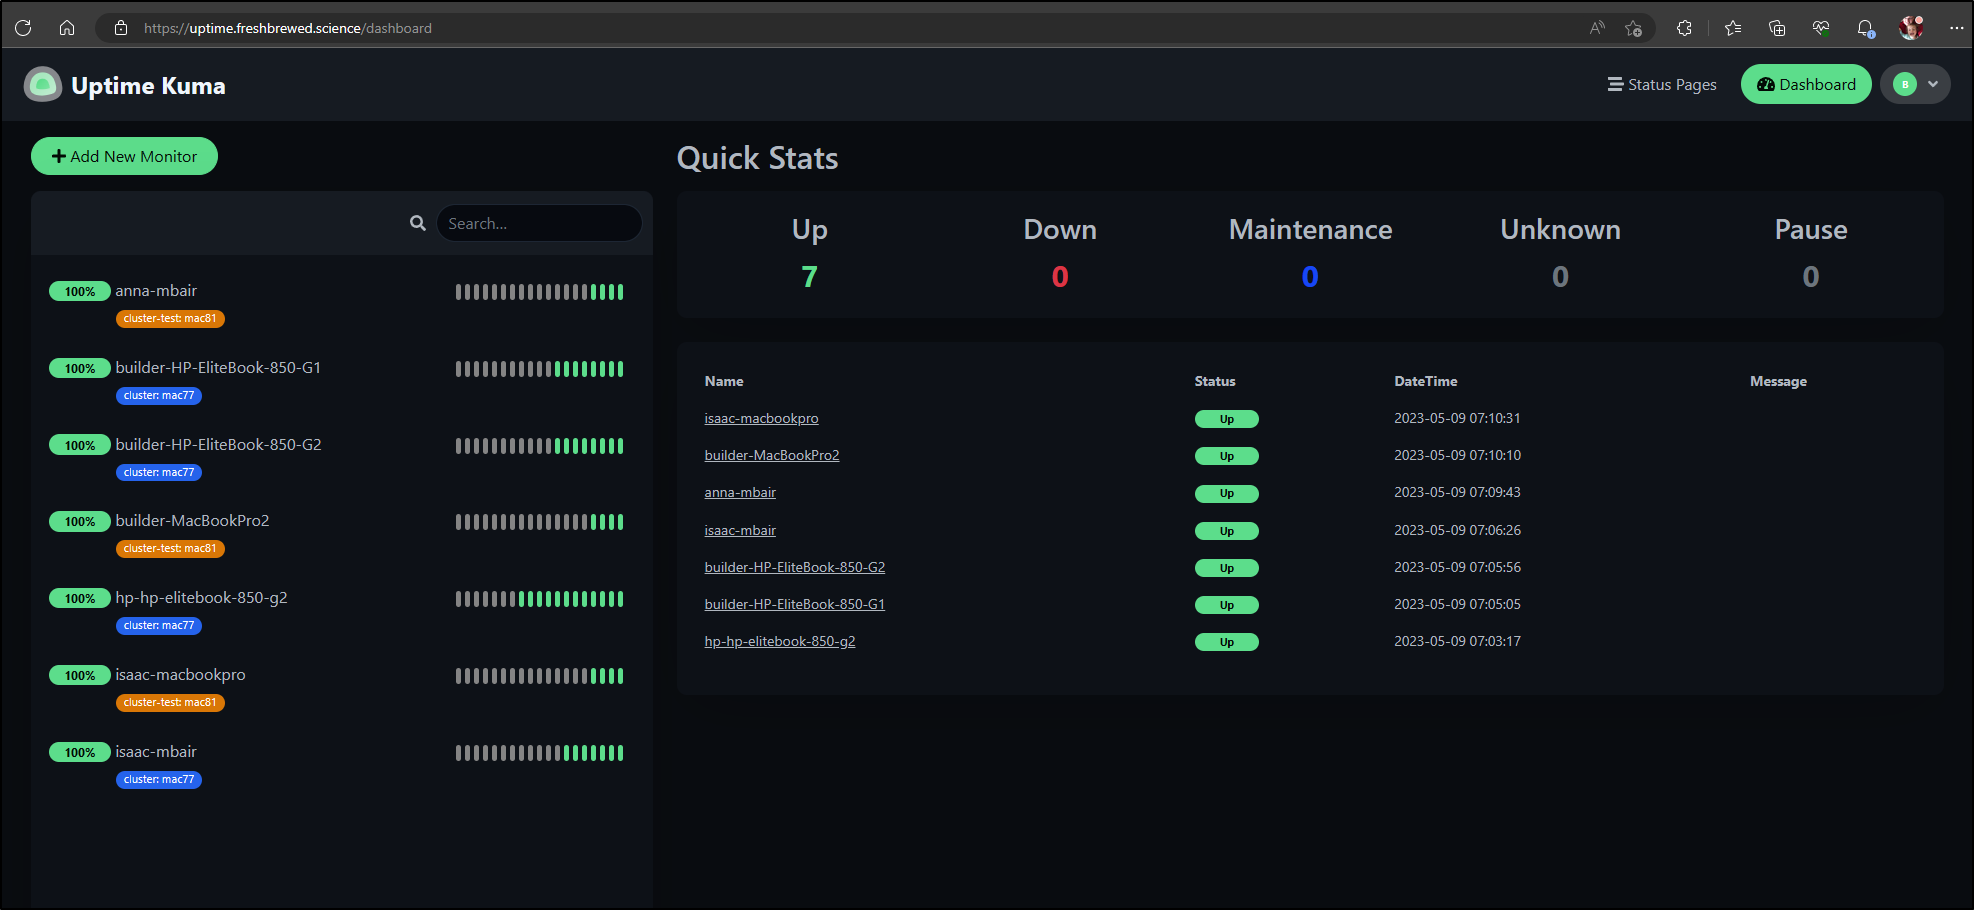
I can add the rest of the cluster
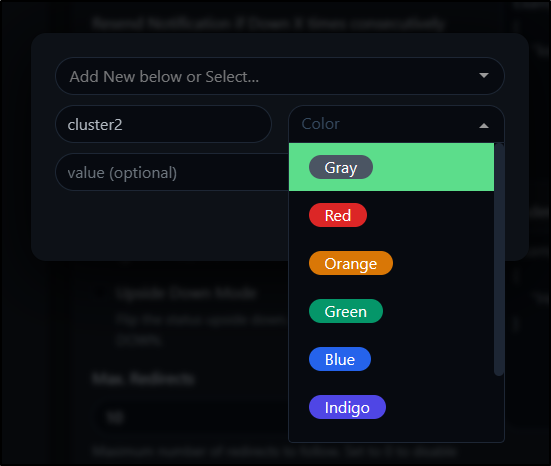
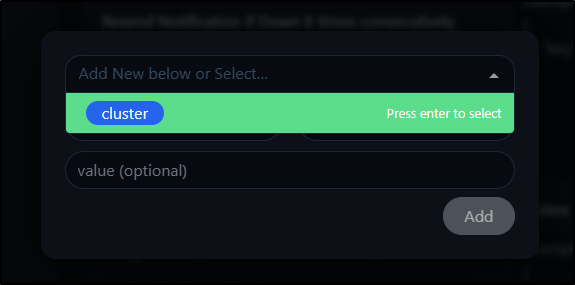
You can see I added a custom tag for cluster. just click “+” on the Tags
You can give a name, colour and value
Or pick from existing Tags
When I got done, I realized visually I didn’t like the tags co-mingled. I want my primary cluster different than my secondary/test cluster
That looks better
Status page
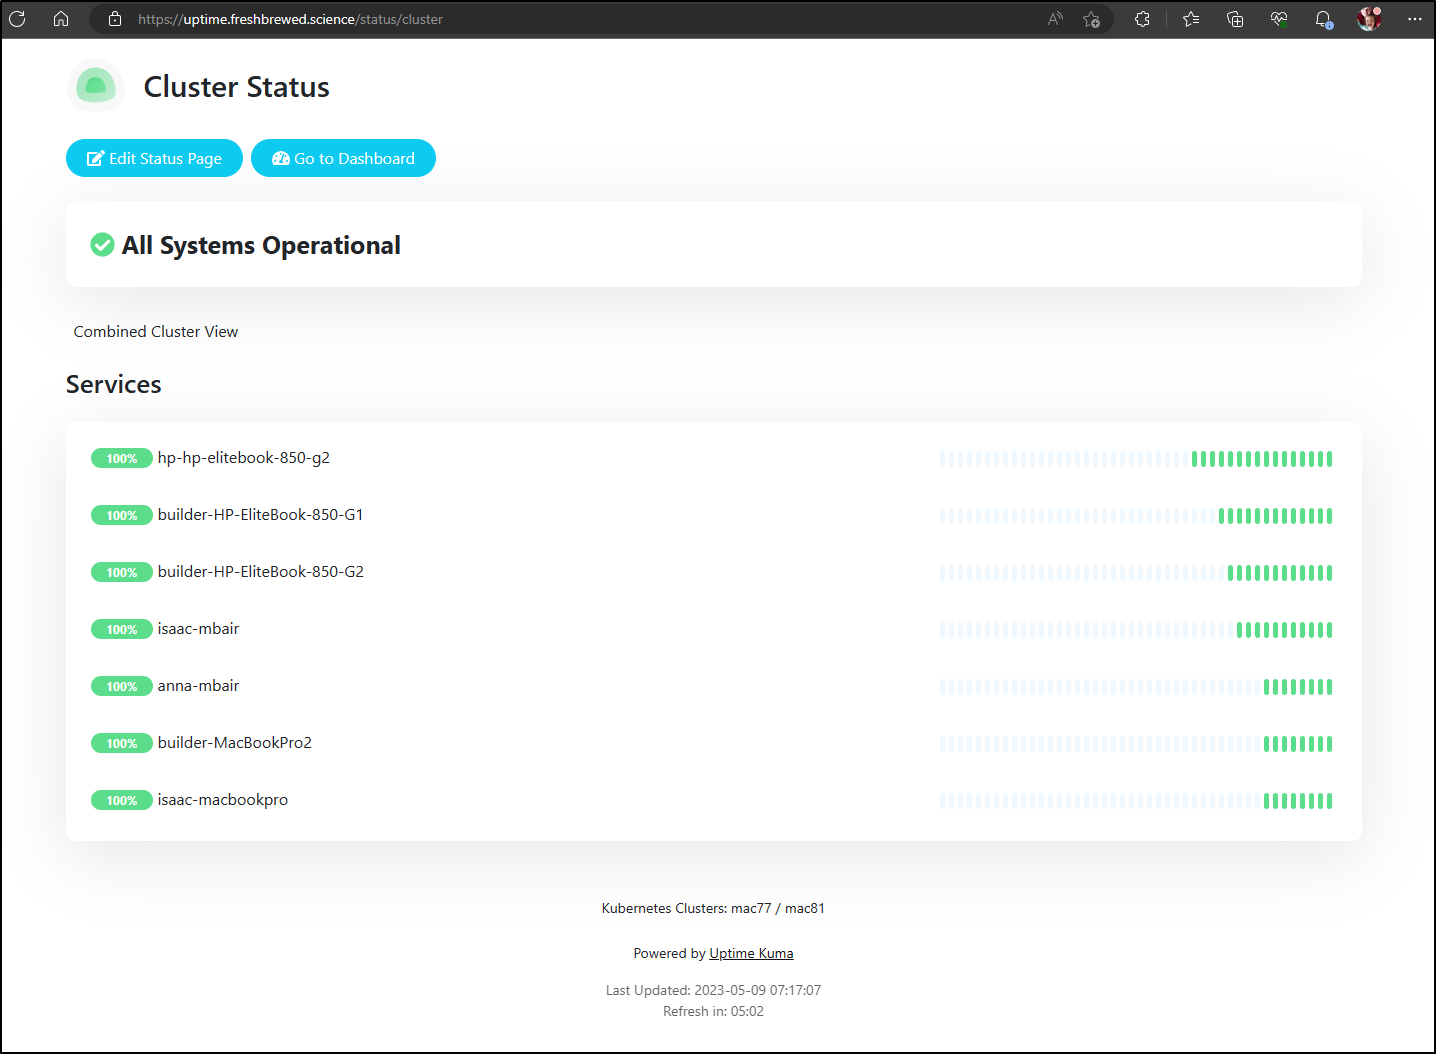
I could create a status page just for cluster compute.
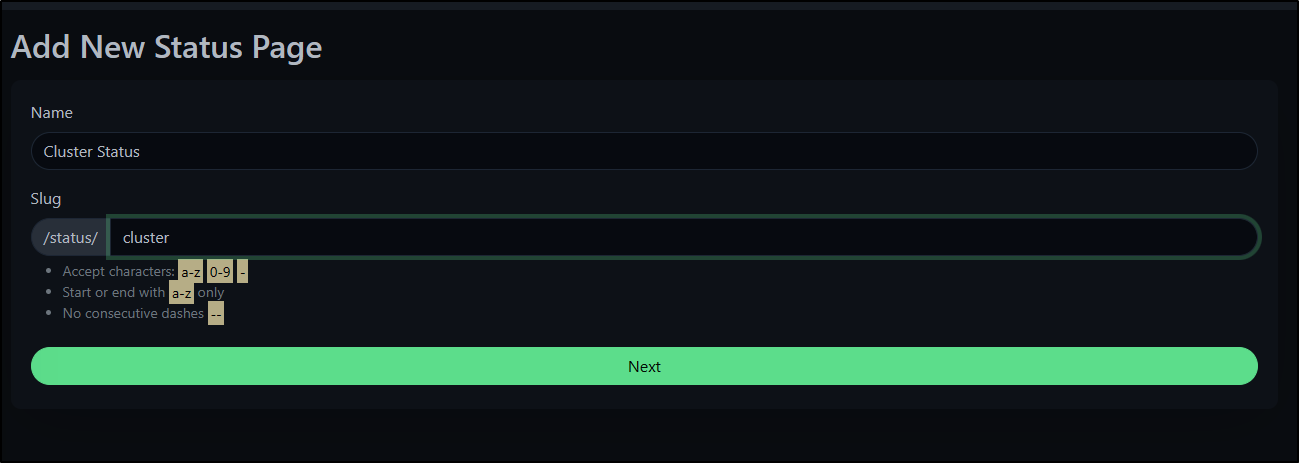
I click new status page
Give it a name
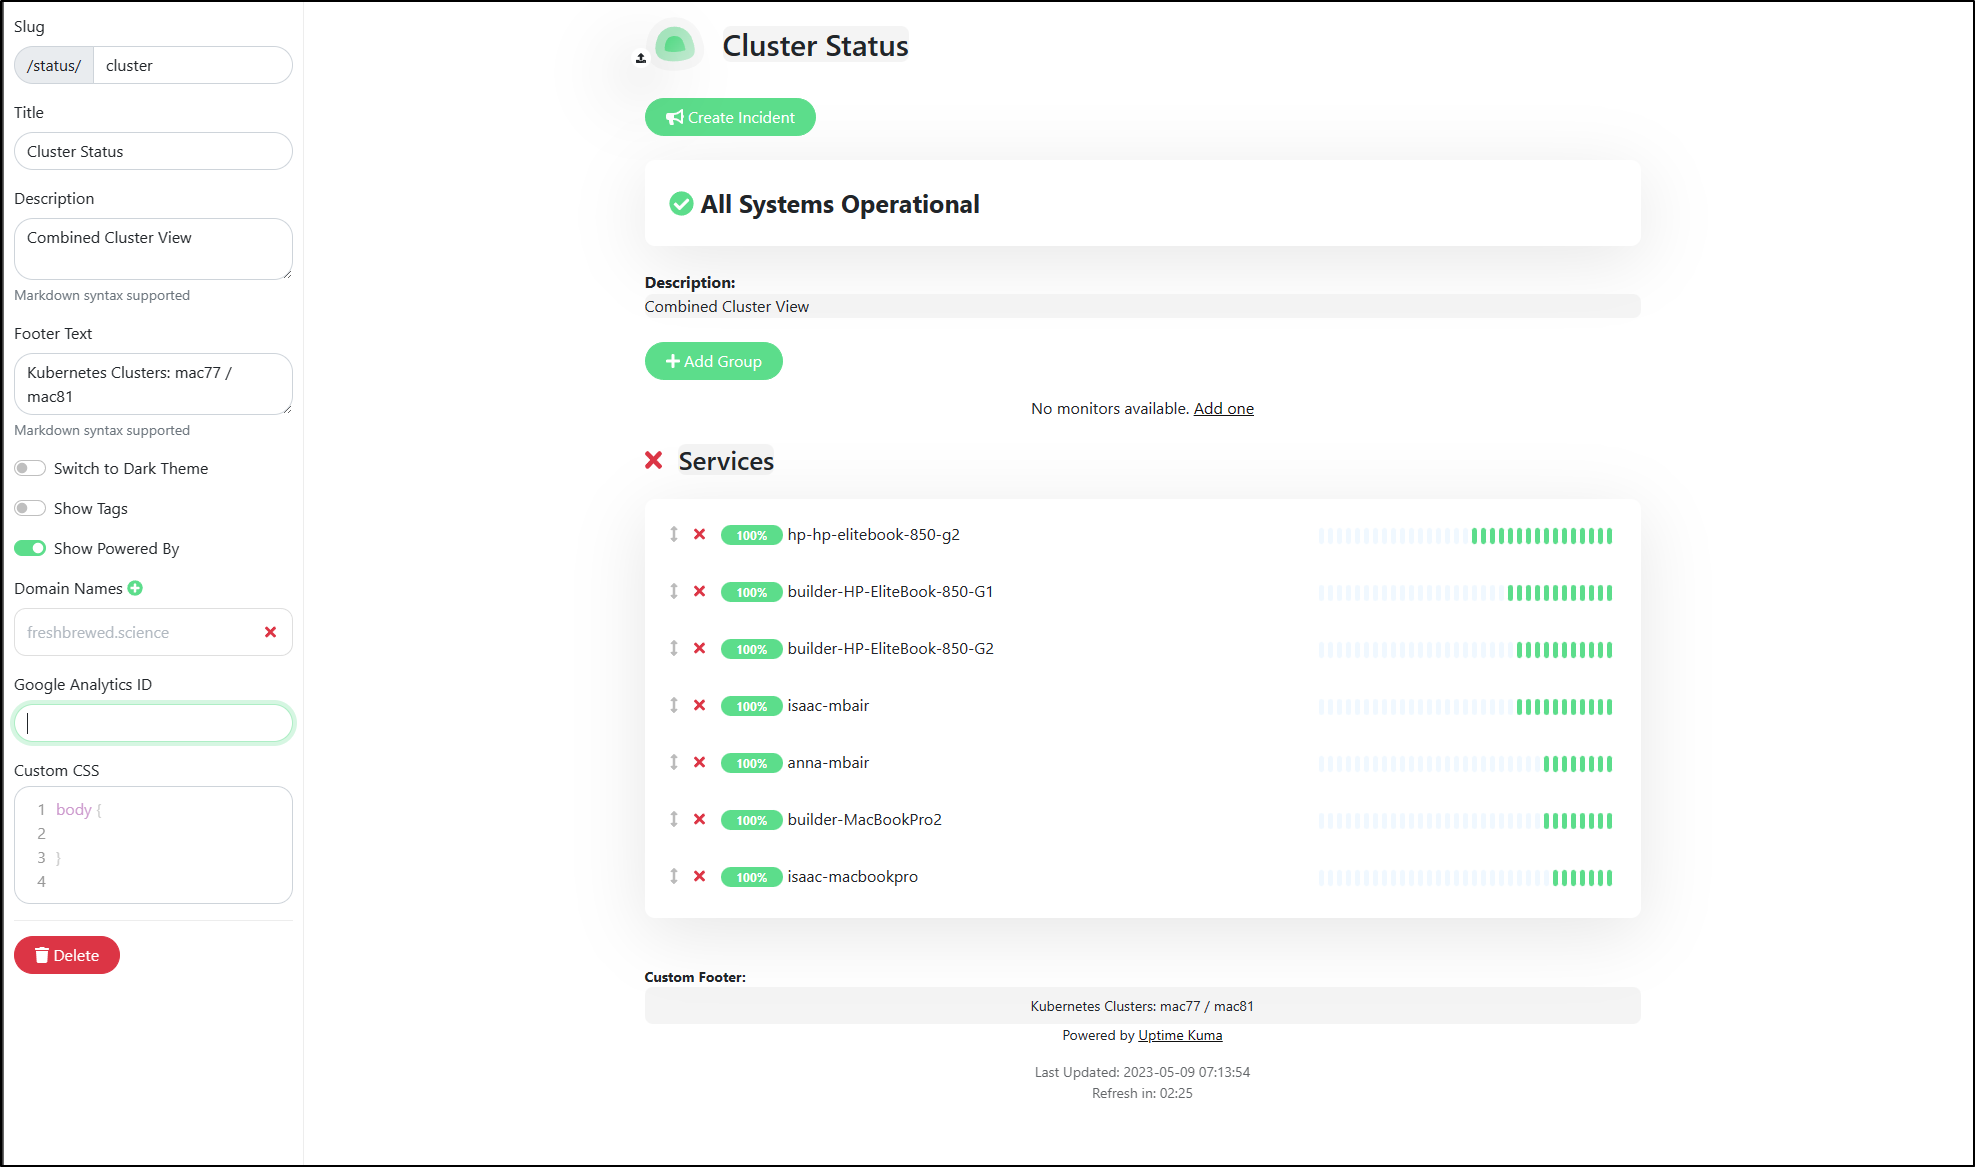
I’ll give it some details and save
I now have a nice dashboard status page to leave up in a window
Alerts
Since I’ve moved off Teams to Discord, adding a new alert should be easy
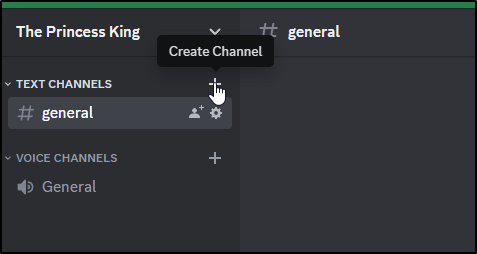
I’m going to create a Channel just for alerts
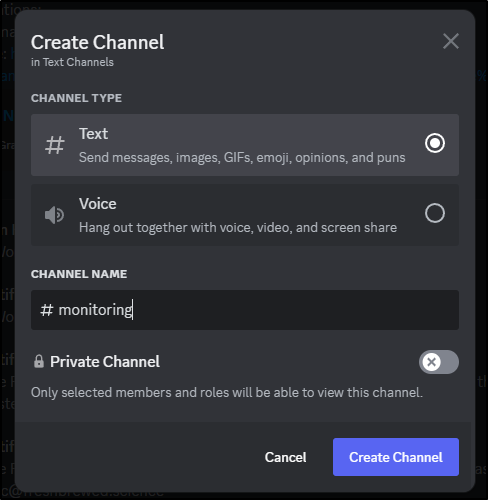
I’ll give it a name
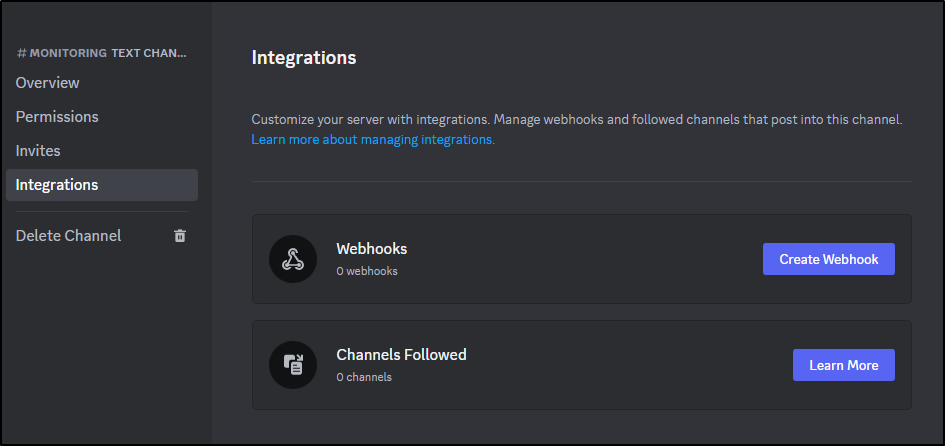
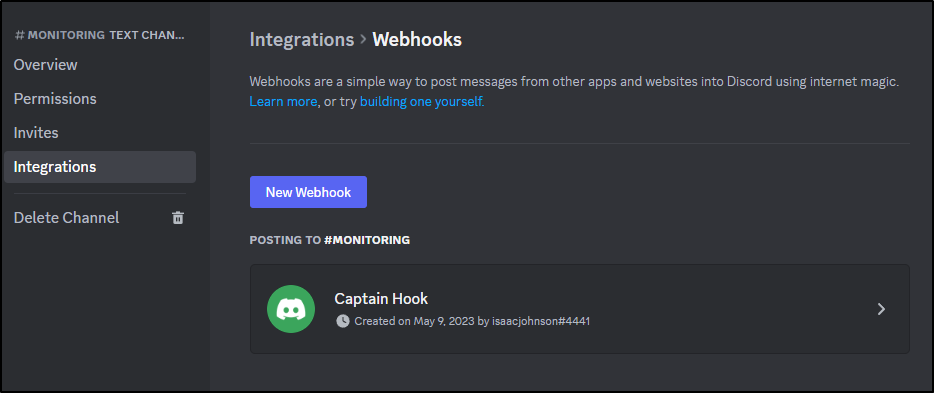
I can click the gear icon by it, and go to Integrations to “Create Webhook”
It automatically creates a new one named “Captain hook”
I’ll rename it and click “Copy Webhook URL” (and click “save changes” at the bottom)
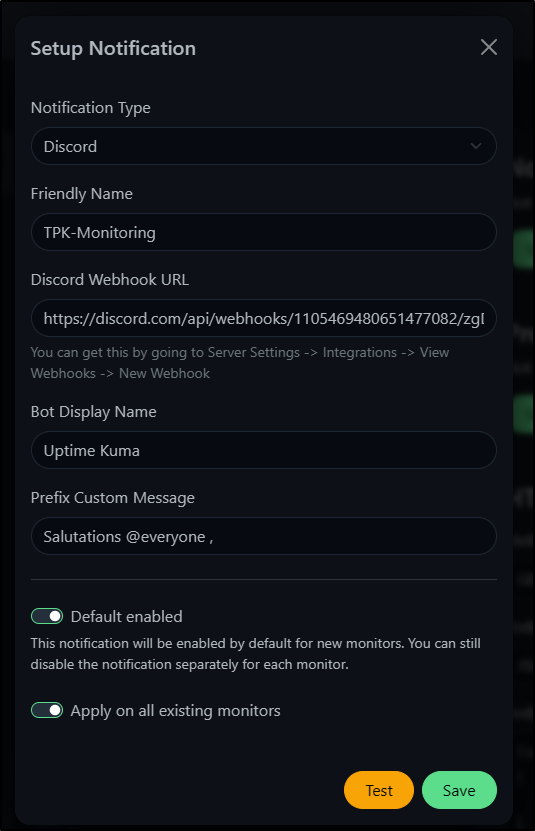
I’ll paste that into Uptime Kuma and set some fields.
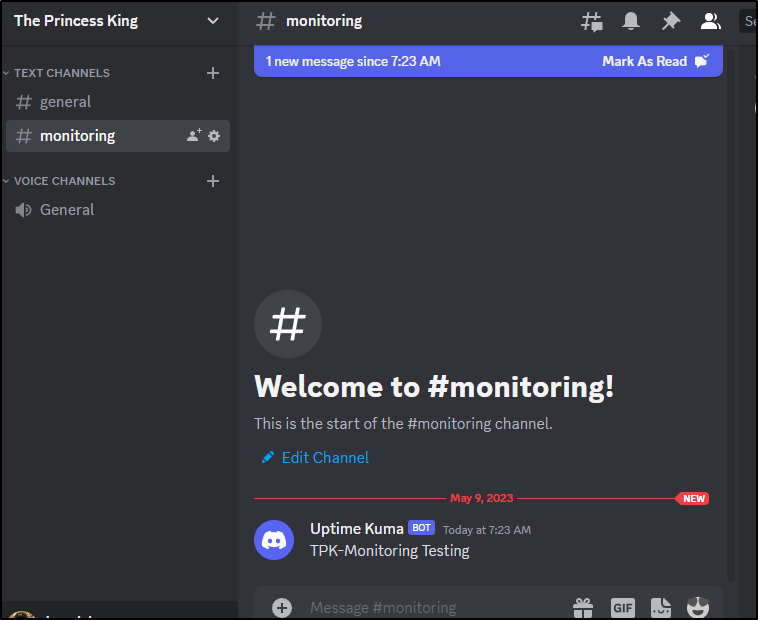
Clicking Test shows up in Discord
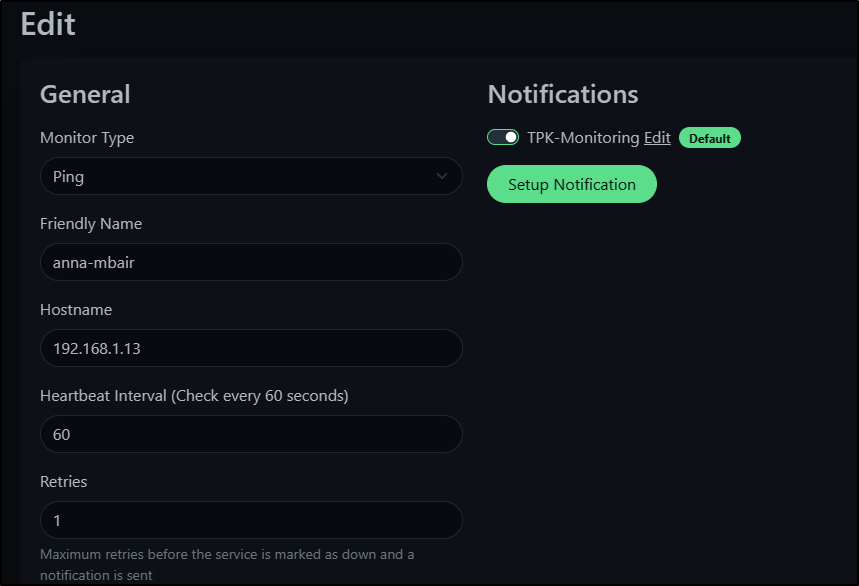
When I save it, with the settings to enable on all monitors, it will go and add to all the Monitors I setup thus far.
We can see that by clicking Edit and checking the right-hand side
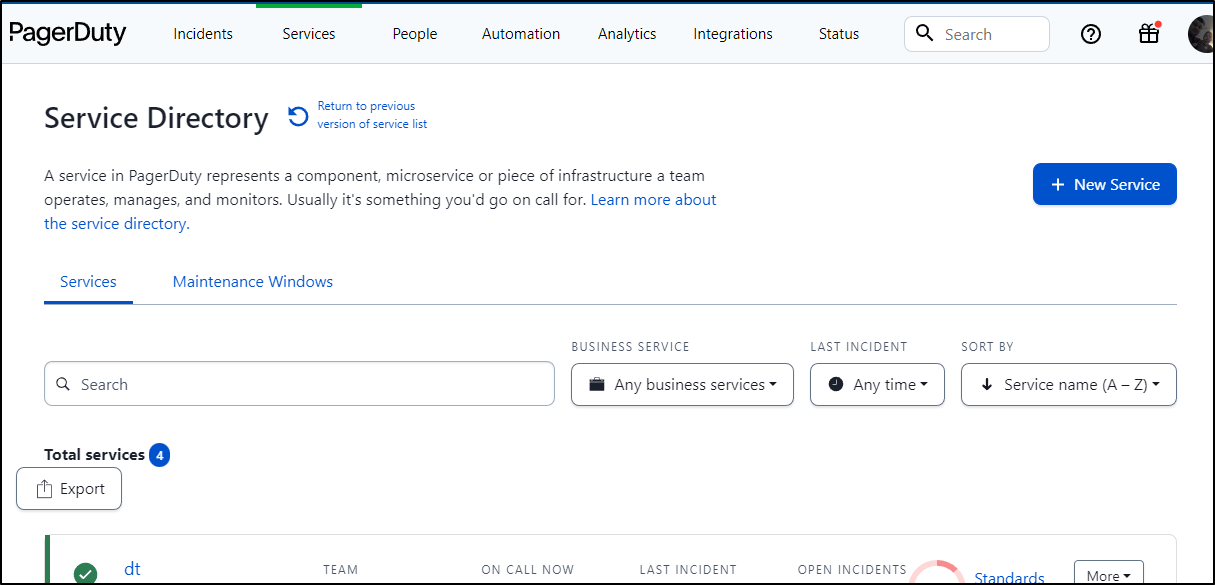
PagerDuty
We can go two ways on this. The first is to create a service with an integration key, the other is to use PagerDuty email.
Let’s start with the first.
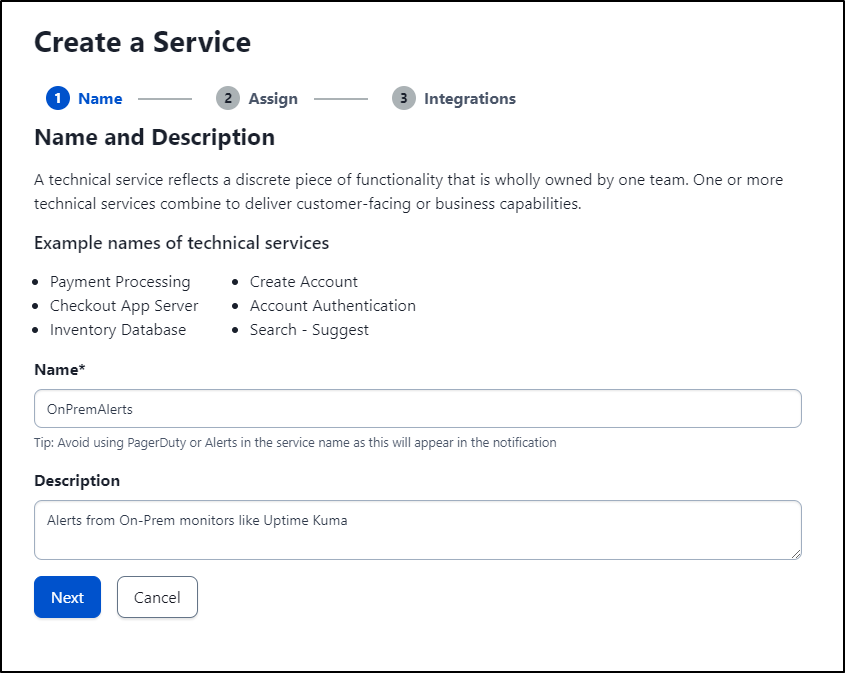
I’ll create a new service for UptimeKuma alerts
I’ll give it a name and description
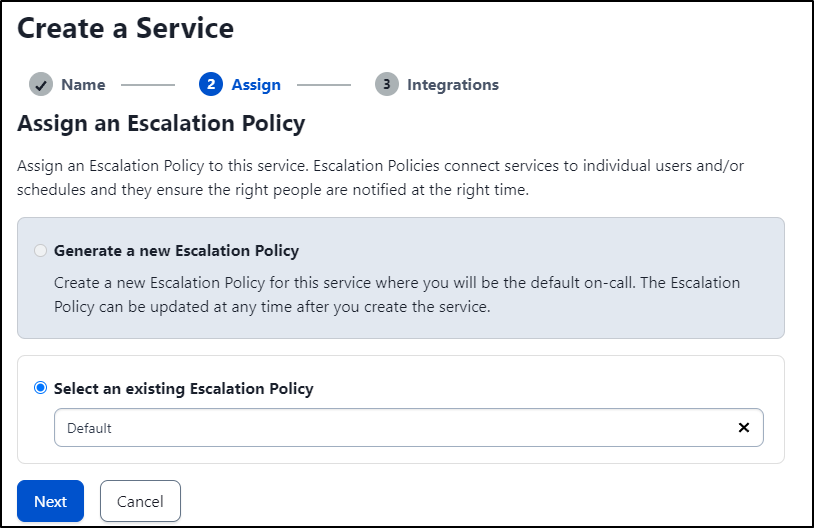
For now I’ll keep my default escalation policy
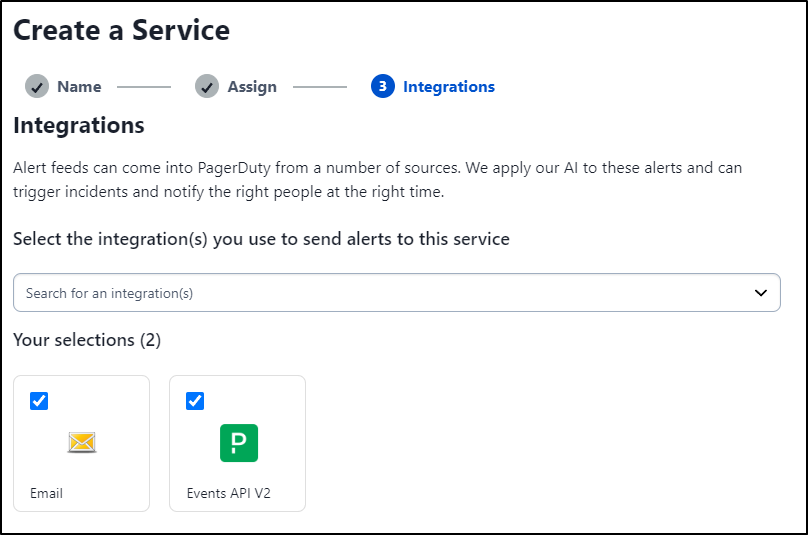
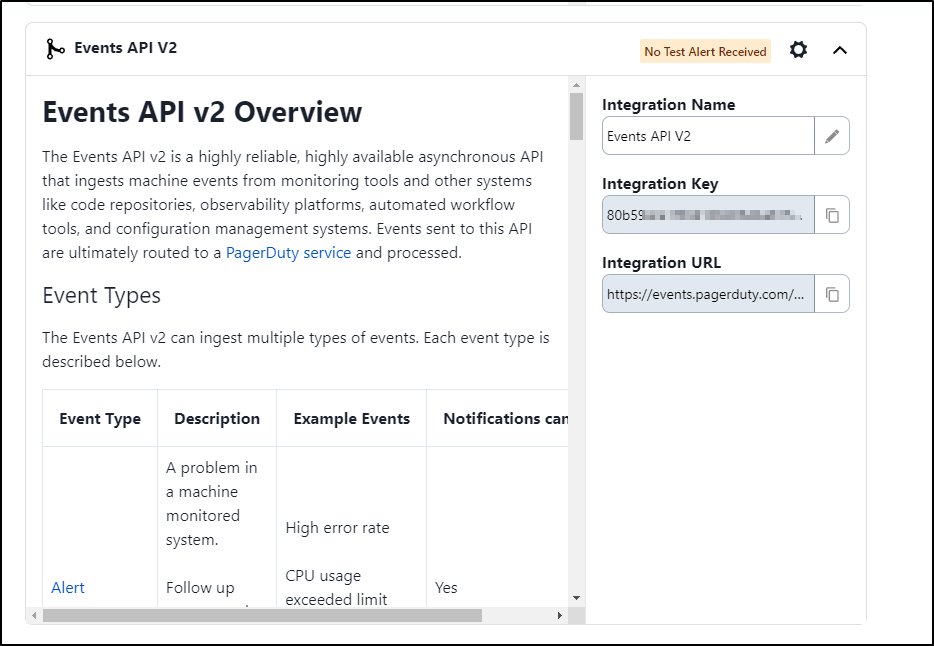
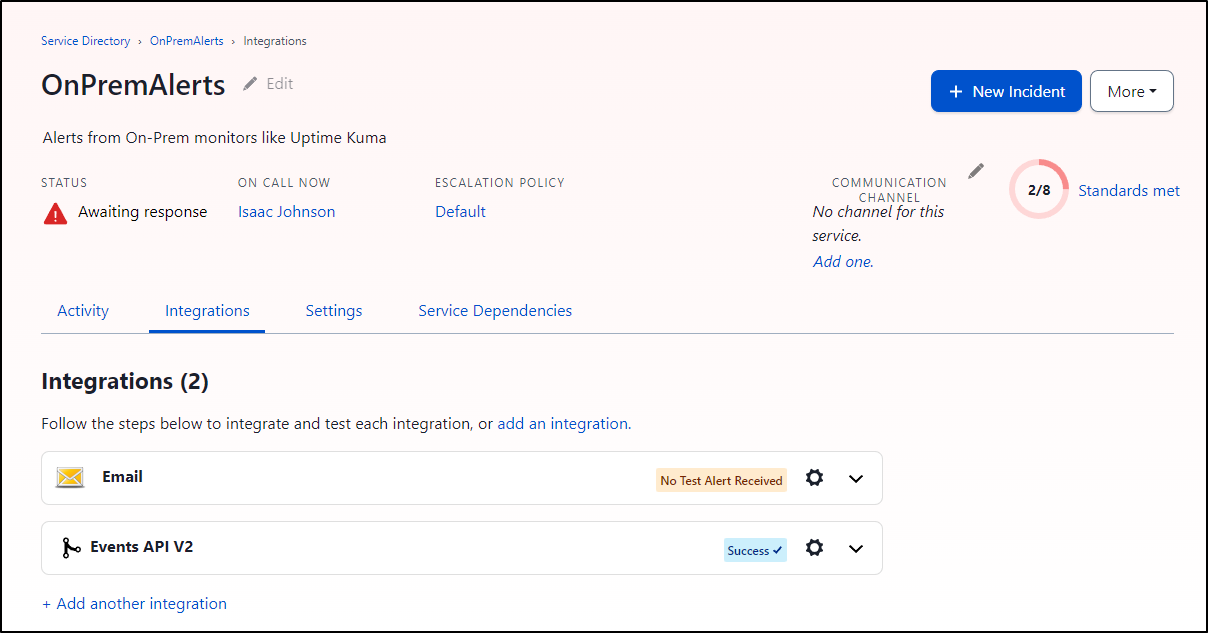
I’ll need the “Events API V2” for the Key, but I’ll also add Email while I’m at it
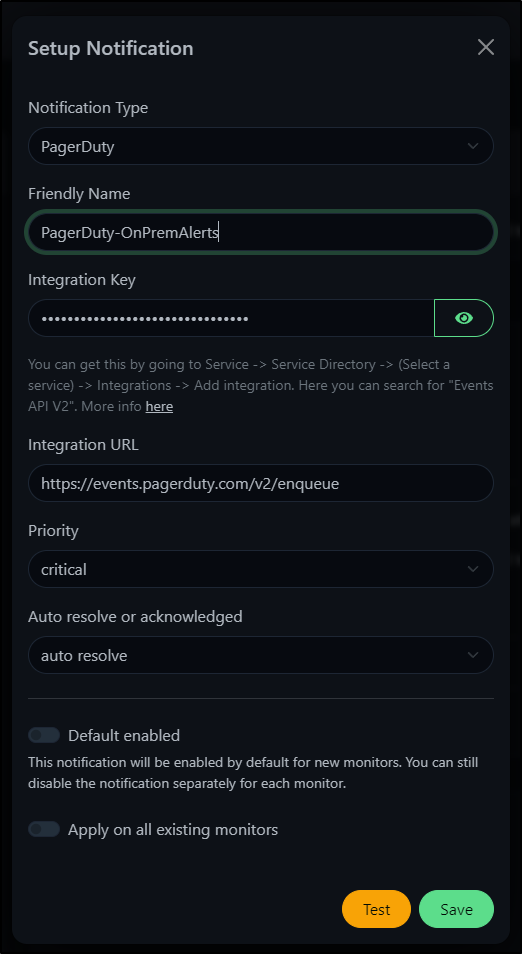
With the service created, I now have an Integration Key and URL
I can put those details into UptimeKuma and click Test
Which shows it hit PagerDuty
And I can see it worked in PagerDuty as well
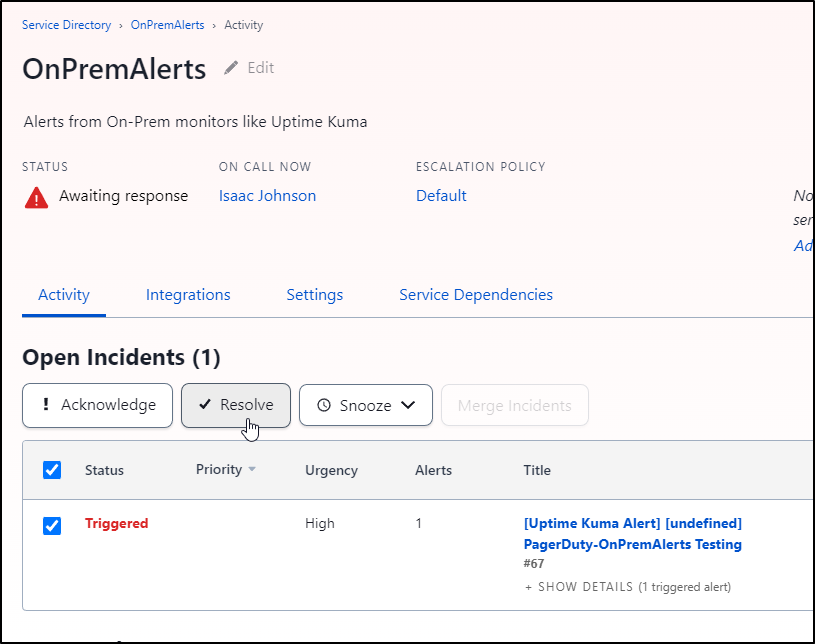
I’ll resolve the alert so we don’t stay in a bad state
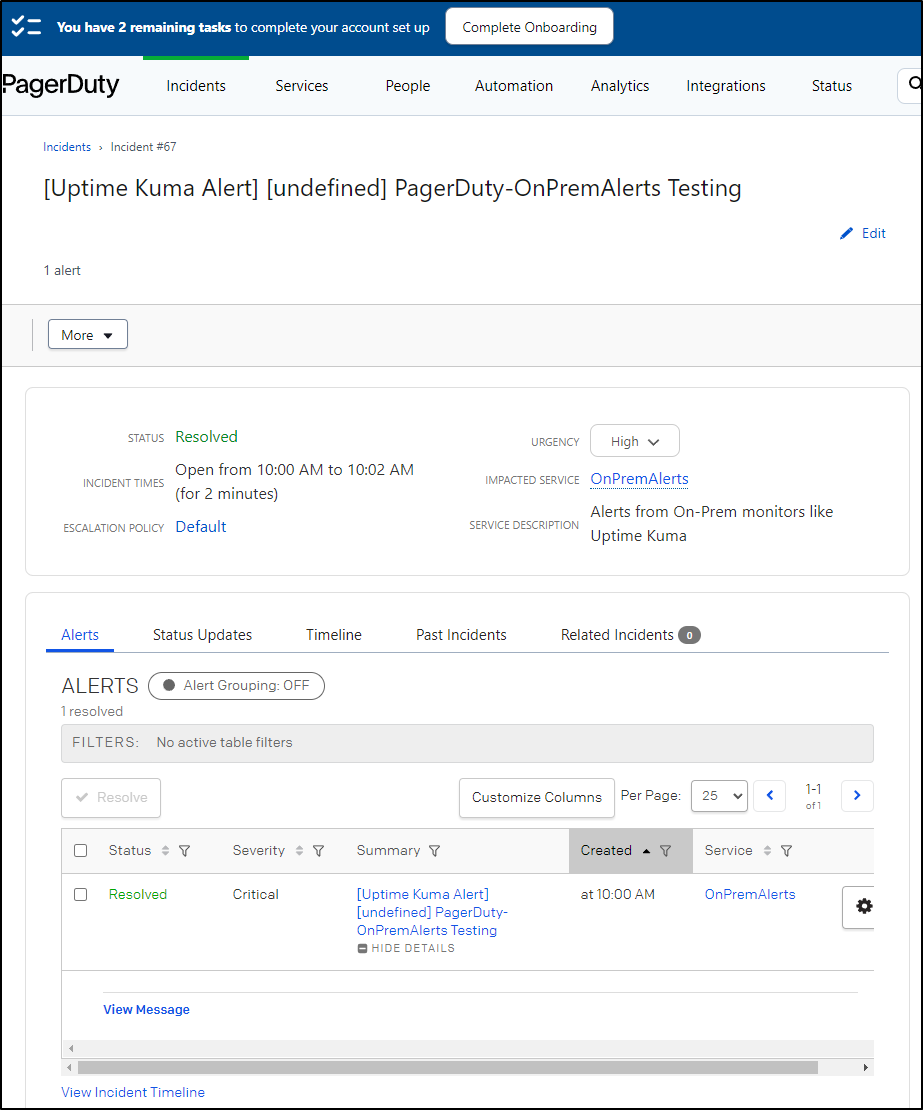
And we can see the Incident that was created and now resolved in PD as well
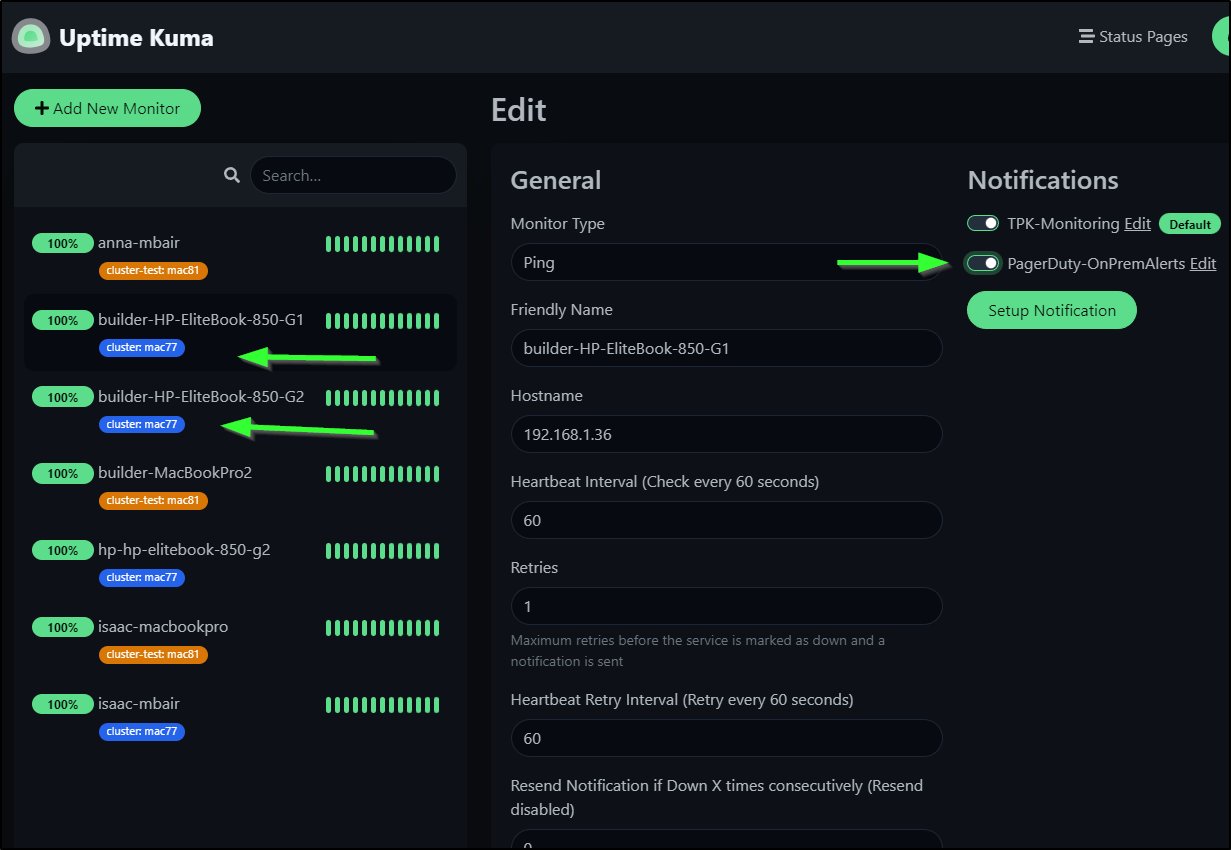
My last step is to enable this just on the Primary Cluster nodes. I specifically do not want PD to be alerted on my test cluster as I tend to cycle it often.
I’ll zip through the nodes in ‘mac77’ the primary and enable Pagerduty
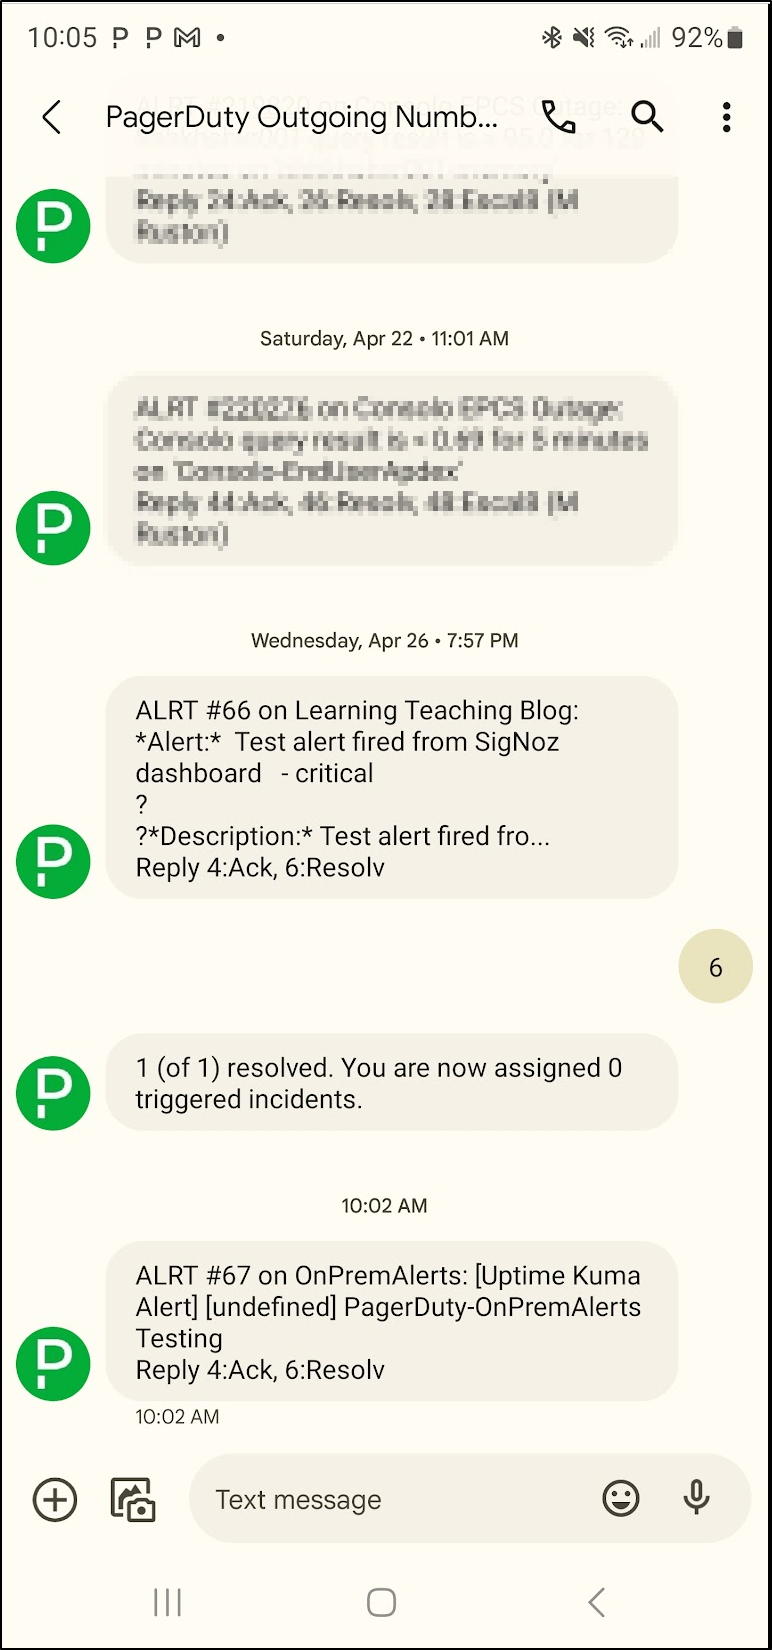
We can now see I get PD alerts just as I would for anything else - in fact I realized I had to mask some real work-related alerts that were co-mingled in the list
A few more settings
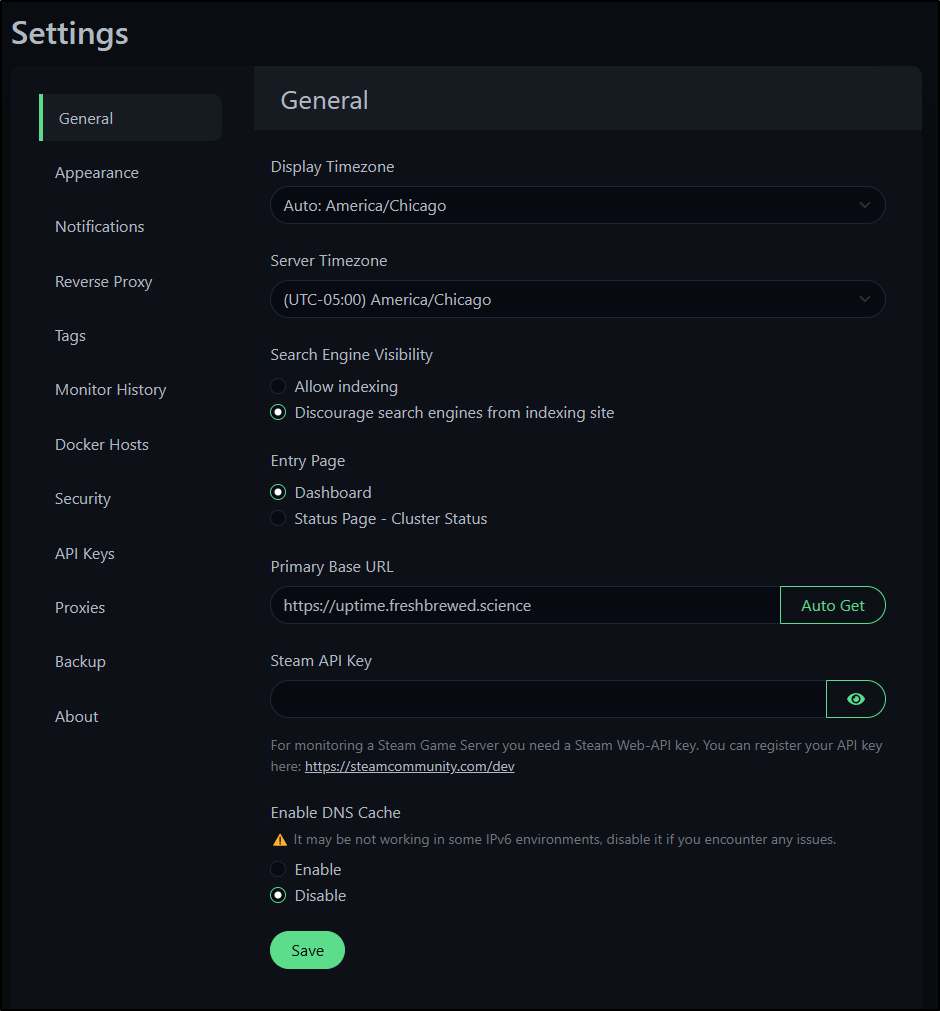
You may need to adjust the timezone or set the Base URL. You can find those settings in the “General” field
RunDeck
Let’s follow the same pattern with Rundeck
I’ll create a volume on the Utility Linux box, then launch Rundeck in daemon mode on port 4440
builder@builder-T100:~$ docker volume create rundeck
rundeck
builder@builder-T100:~$ docker run -d --restart=always -p 4440:4440 -v rundeck:/home/rundeck/server/data --name rundeck rundeck/rundeck:3.4.6
Unable to find image 'rundeck/rundeck:3.4.6' locally
3.4.6: Pulling from rundeck/rundeck
b5f4c6494e1c: Pull complete
4f4fb700ef54: Pull complete
Digest: sha256:9fa107d48e952ad743c6d2f90b8ee34ce66c73a6528c1c0093ef9300c4389fab
Status: Downloaded newer image for rundeck/rundeck:3.4.6
0c89872282f564ac1c5661f3b23a96ffd1f94419aa33db736db6f6cc42475842
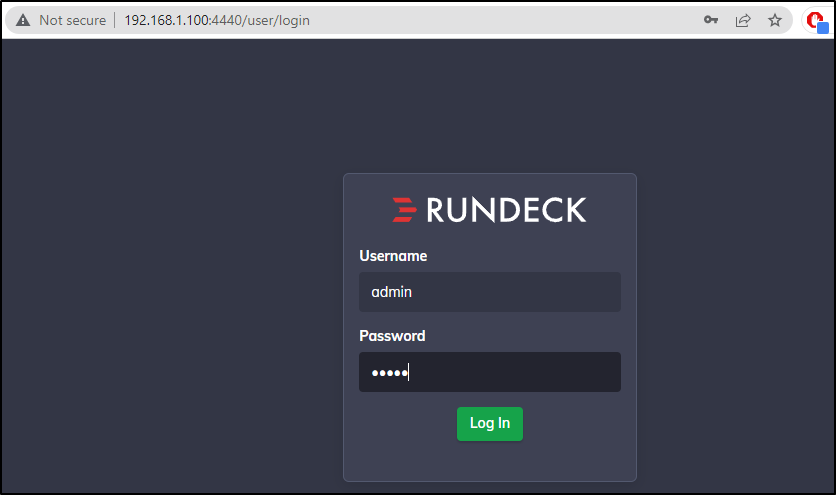
While I can login with admin/admin
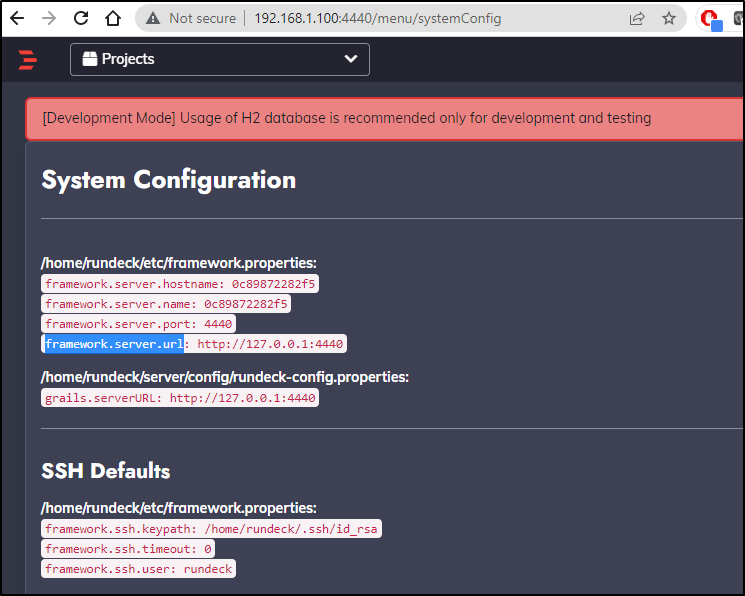
RunDeck kept redirecting to 127.0.0.1 because that is the default config
We can review all the env vars we can set including some SMTP ones for email. But the one that we need is the RUNDECK_GRAILS_URL setting
$ docker run -d --restart=always -p 4440:4440 -v rundeck:/home/rundeck/server/data -e RUNDECK_GRAILS_URL=http://192.168.1.100:4440 --name rundeck2 rundeck/rundeck:3.4.6
767c9377f238147fa85e1f1c7d194e22fd1eb16b1b1988c0537711da3e41ef7a
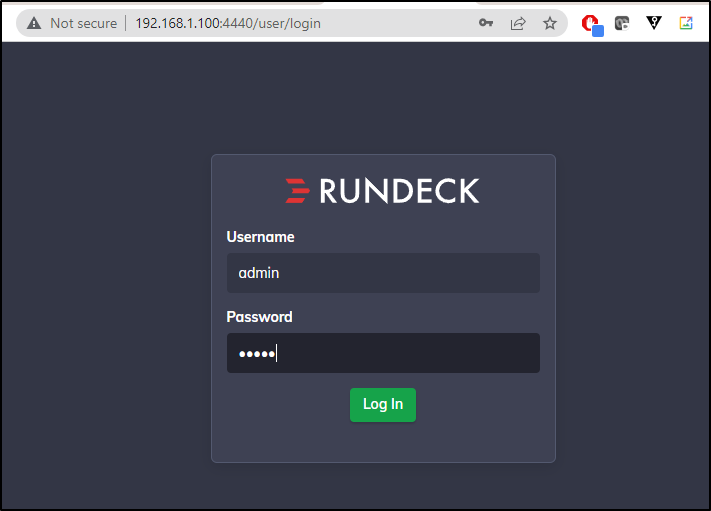
Now when I login
I get properly redirected.
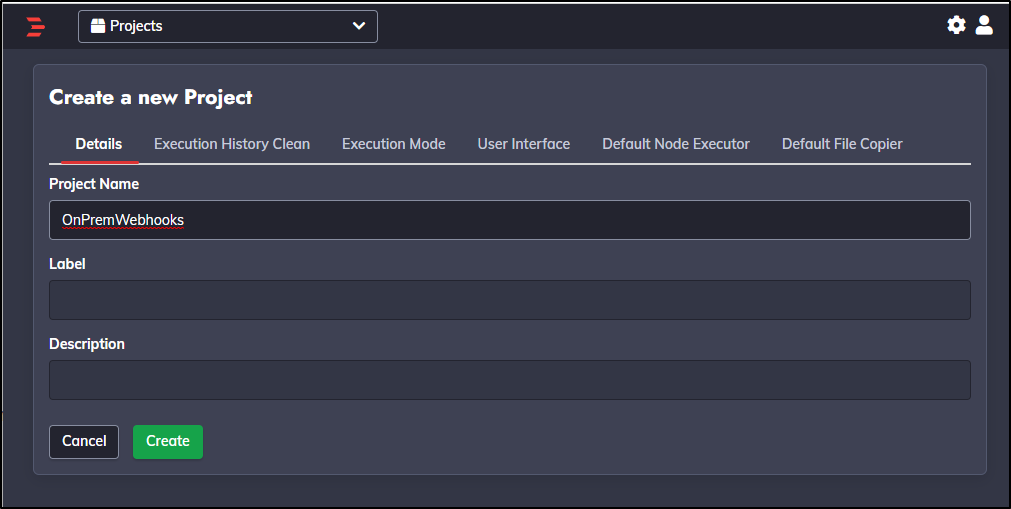
I’ll create a new project
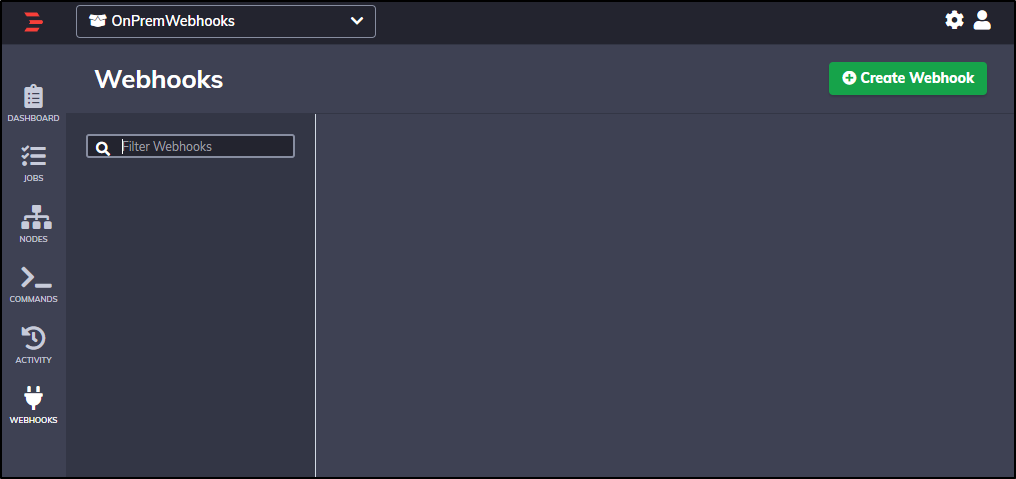
Then I can create webhooks
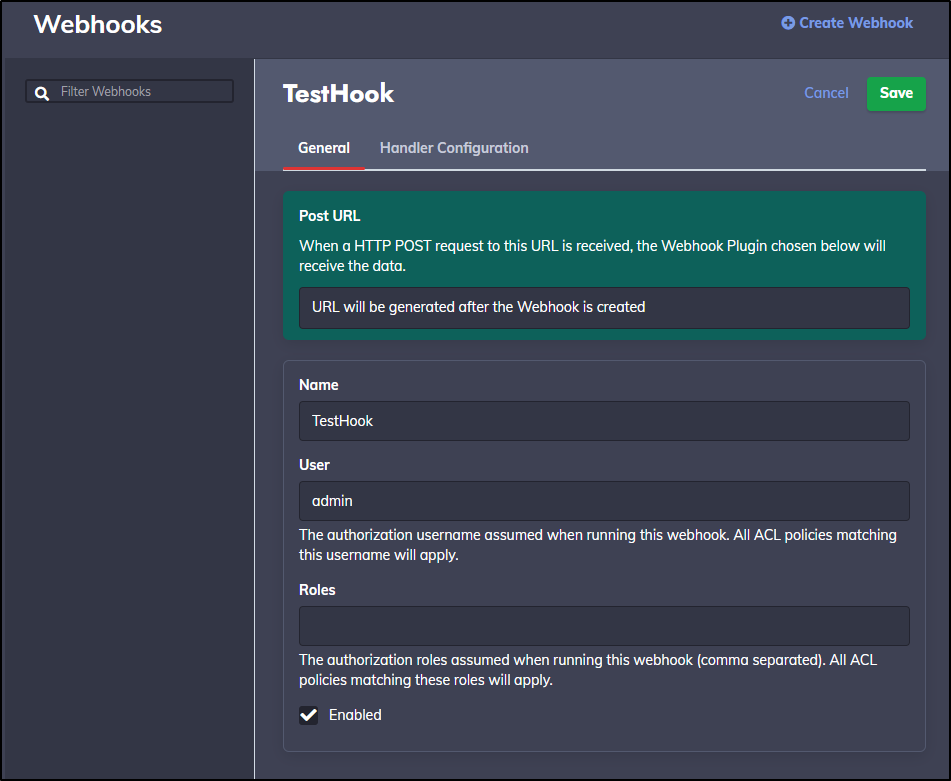
Give the webhook a name
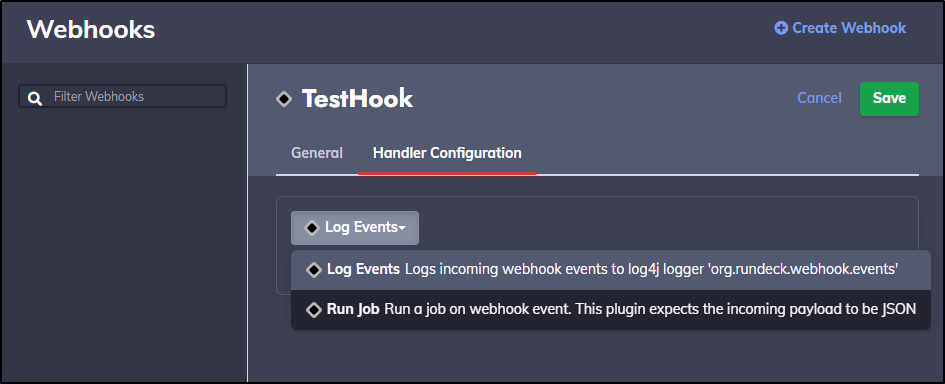
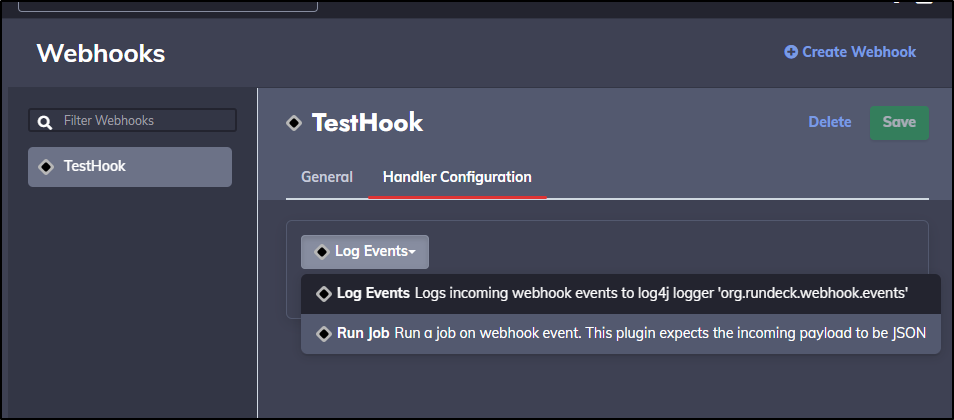
For handler, I’ll tell it to just log an event
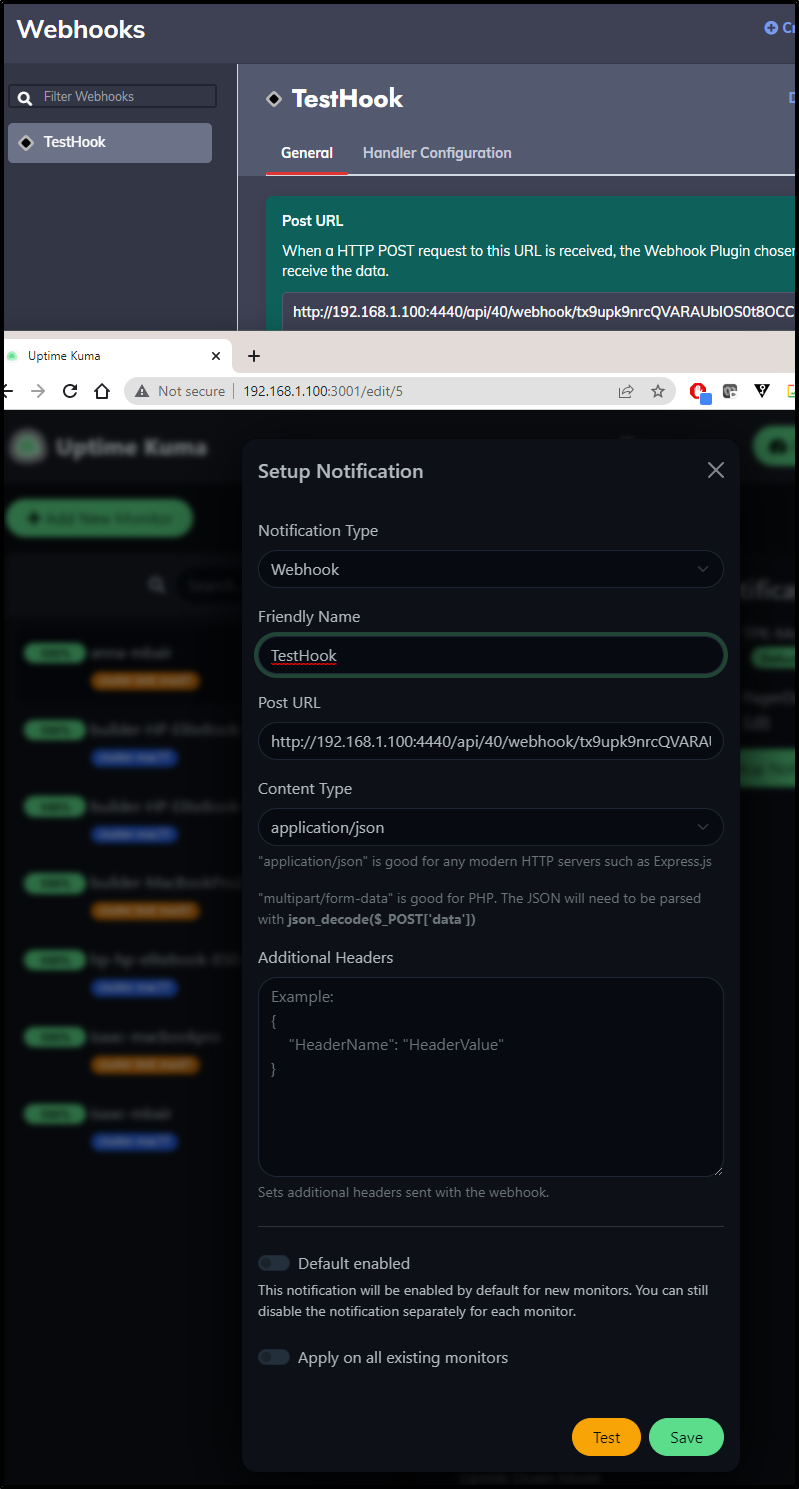
I’ll save and get a URL (http://192.168.1.100:4440/api/40/webhook/tx9upk9nrcQVARAUbIOS0t8OCCM484YD#TestHook)
I’ll save to RunDeck and Test
and if I do docker logs on the rundeck2 container (docker logs rundeck2) I can see the log was written
[2023-05-09T15:41:31,031] INFO  web.requests "GET /plugin/detail/WebhookEvent/log-webhook-event" 192.168.1.160 http admin form 14 OnPremWebhooks [application/json;charset=utf-8] (Mozilla/5.0 (Windows NT 10.0; Win64; x64) AppleWebKit/537.36 (KHTML, like Gecko) Chrome/112.0.0.0 Safari/537.36)
[2023-05-09T15:42:27,053] INFO  web.requests "POST /api/40/webhook/tx9upk9nrcQVARAUbIOS0t8OCCM484YD" 172.17.0.1 http admin token 9 ? [text/plain;charset=utf-8] (axios/0.27.2)
[2023-05-09T15:42:27,054] INFO  api.requests "POST /api/40/webhook/tx9upk9nrcQVARAUbIOS0t8OCCM484YD" 172.17.0.1 http admin token 10  (axios/0.27.2)
Let’s do something slightly more interesting…
Jobs
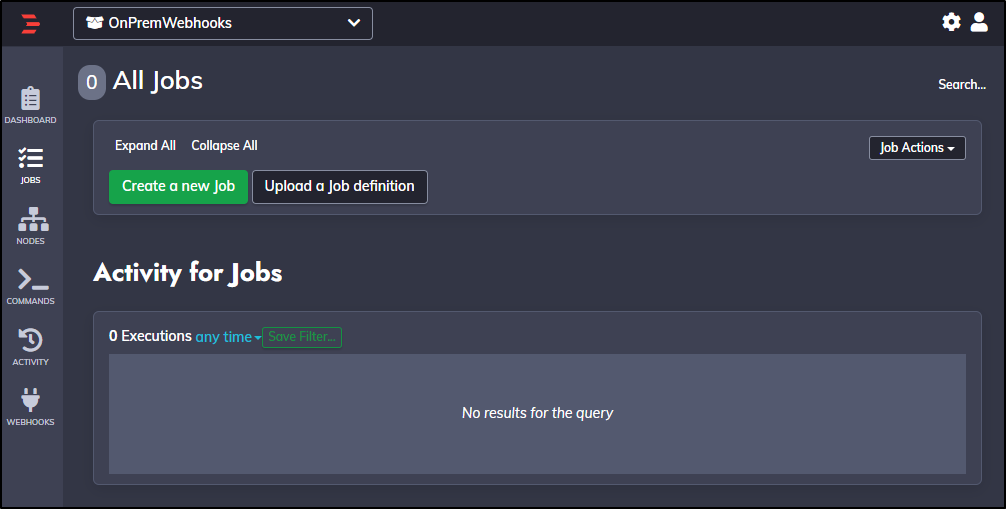
Let’s create a new Job under Jobs
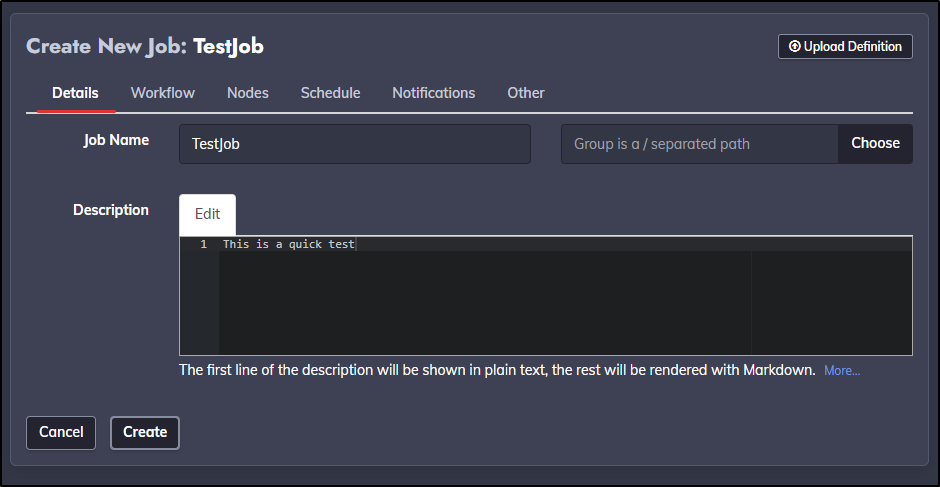
I’ll give it a name
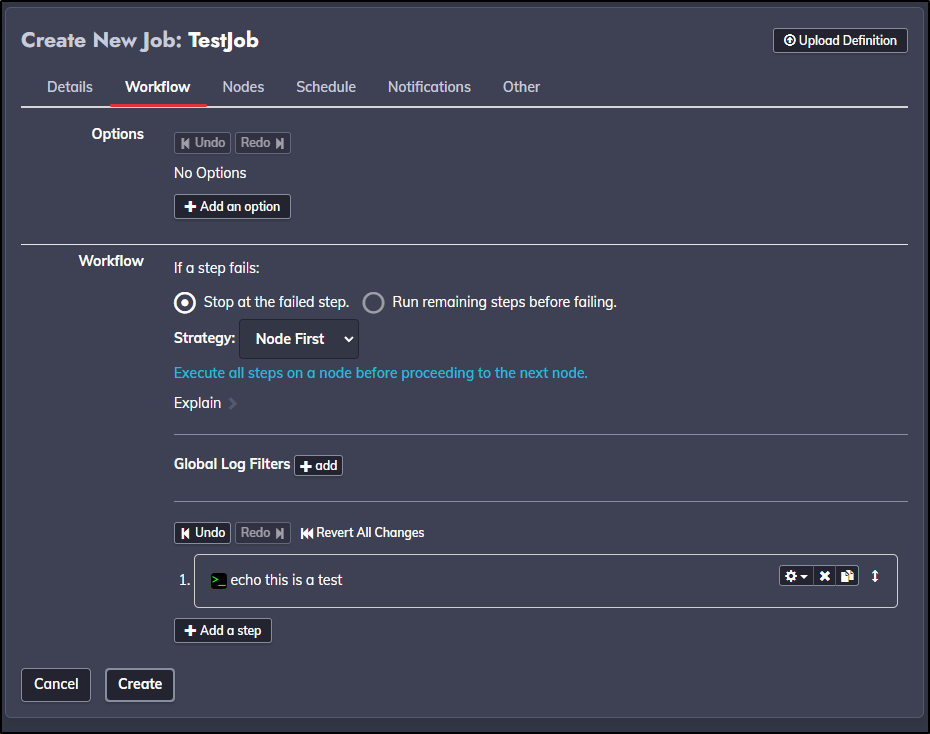
For a workflow, I’ll just have it echo a line
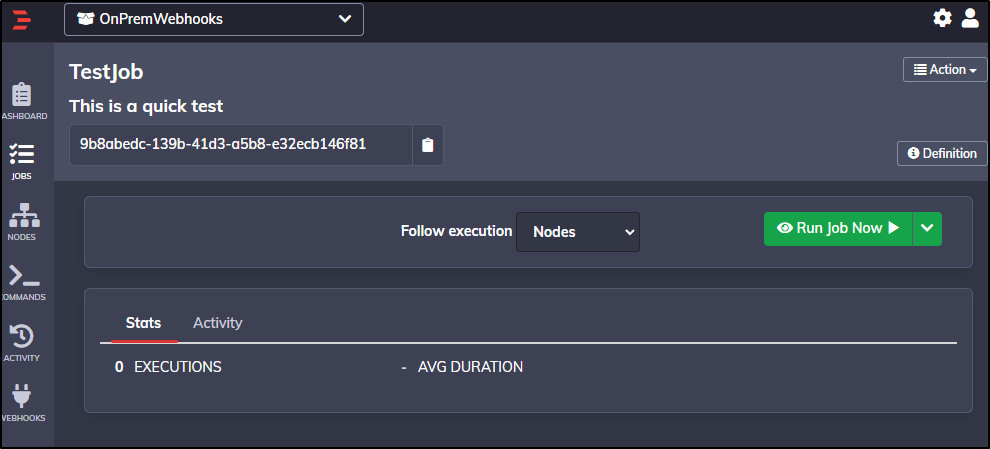
There are lots of other settings, including notifications, but for now, let’s just save it with defaults
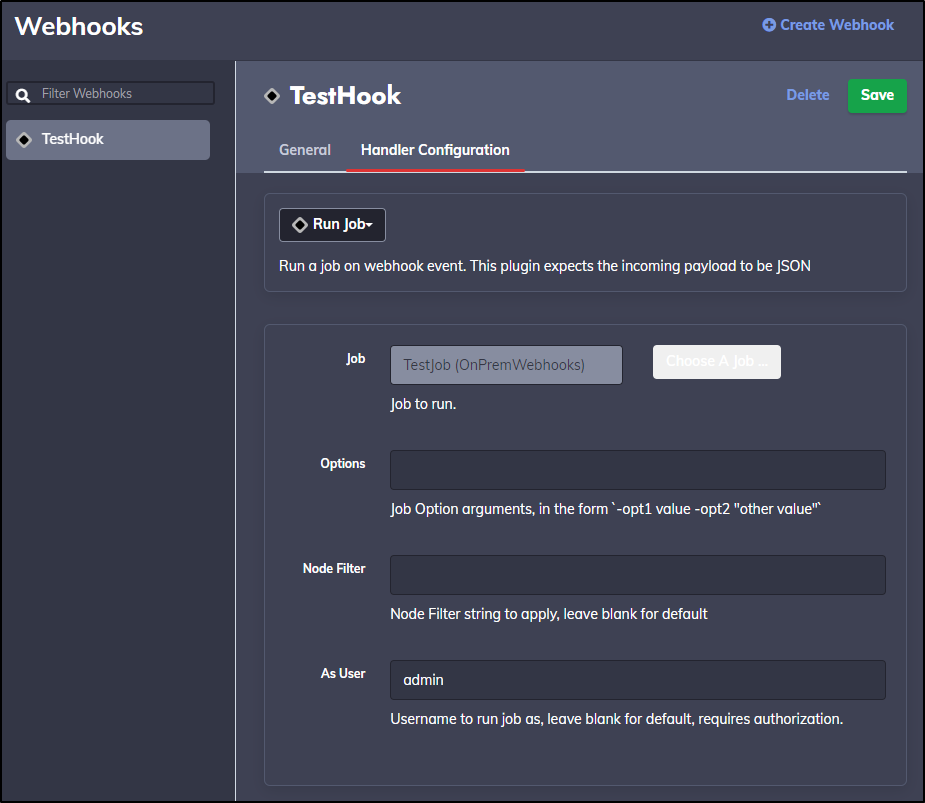
Back in our test webhook, let’s change from Log to Run Job
I’ll set it to TestJob and save
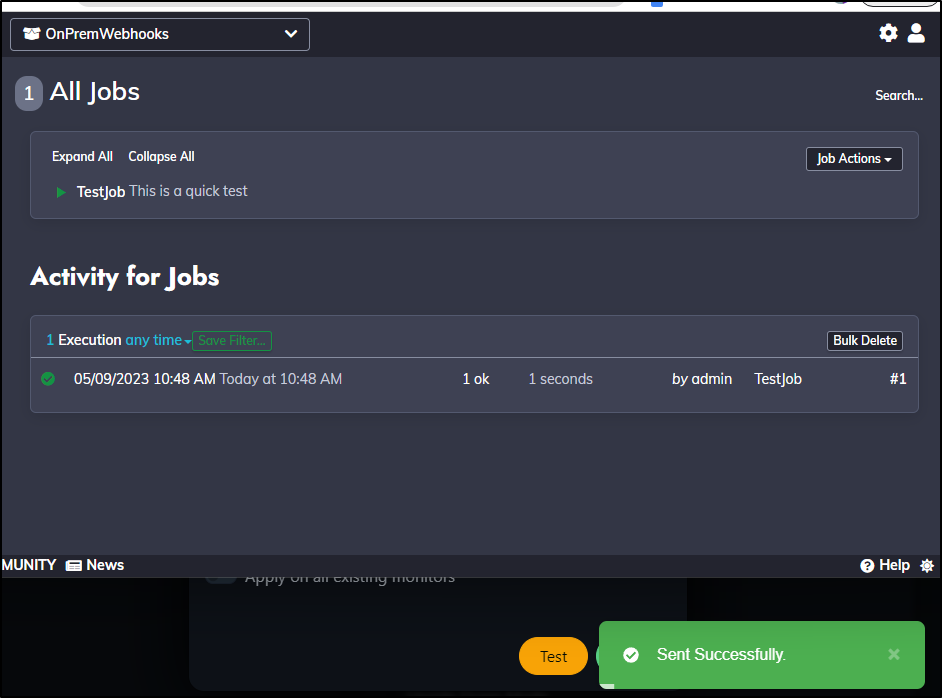
Now when I test from Uptime, I can see it fired
At this time, I really don’t need to perform any actions. However, this could be a place I trigger a lightswitch with pykasa, or update a webpage - pretty much any arbitrary workflow I might need to happen in response to a monitor.
Since, by its nature, I cannot reset the admin password without email being setup, I won’t expose this via external ingress. But it shows a straightforward webhook provider we can use in conjunction with UptimeKuma for automations.
Some notes
What is nice, compared to my last setup, is that I have this setup on a local machine tied to a battery backup which lasts for typical summer blips.
This means, IF my Kubernetes cluster has issues, this VM will still monitor and update discord. Moreover, I can hit this URL using the external TLS ingress but also, to minimize vectors, using the internal insecure IP as well (take Kubernetes out of the mix)
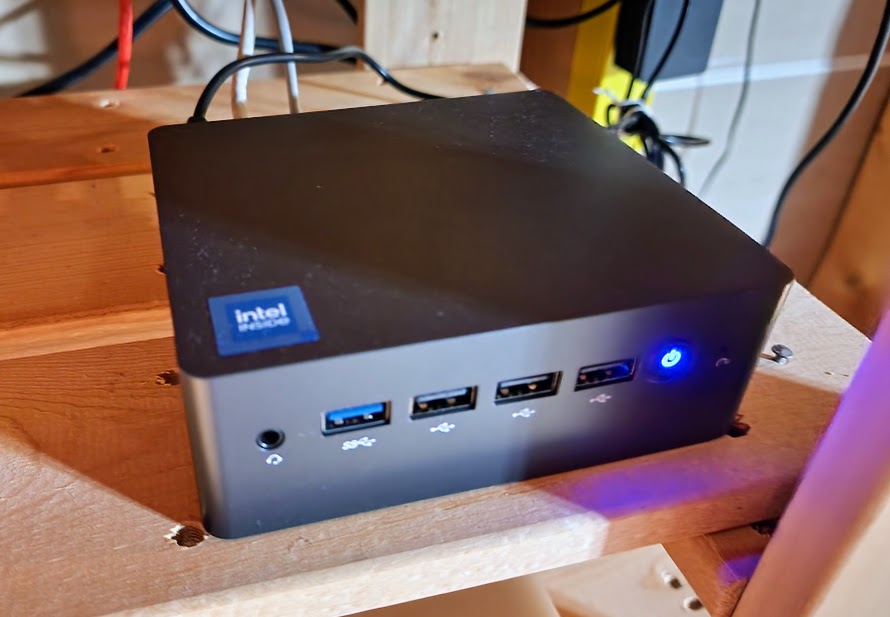
Fun mini PC
I got a Vine review item to play with. It was ~$130 I believe. They did the whole typical review-and-switch and now the listing points to a much more expensive model.
That said, this is all running quite well on a SkyBarium Mini Desktop N100.
Not a plug or referral link - just thought I would mention it.
Summary
Today we setup RunDeck and Uptime Kuma on a small i3-based Linux VM running Ubuntu and Docker. We setup external Ingress with TLS to Uptime Kuma and monitors for two different Kubernetes clusters. We configured a new PagerDuty service and set that up to trigger alerts on the primary cluster nodes. We configured alerts for all nodes to go to a new Discord channel. Lastly, we setup an internal RunDeck instance to act as a webhook provider we can use internally.
Overall, this was fun revisit of some well-loved Open Source tools. I hope you got some value and can use some of these in your own projects.


