Published: Jan 17, 2023 by Isaac Johnson
In the last post we covered setup, serverless and Open Telemetry. Today we’ll really dive into Alerts with a focus on Teams and PagerDuty. We’ll look at Instana on a cloud hosted cluster (AKS) and how that affects our Infrastructure views. We’ll look at log integration with Mezmo (LogDNA) and Coralogix. We’ll look at monitoring non-kubernetes Infrastructure like a Windows host and database monitoring with on-prem PostgreSQL. Lastly, we’ll wrap with a detailed look at GCP Monitoring including Storage, Cloud Run and CloudSQL.
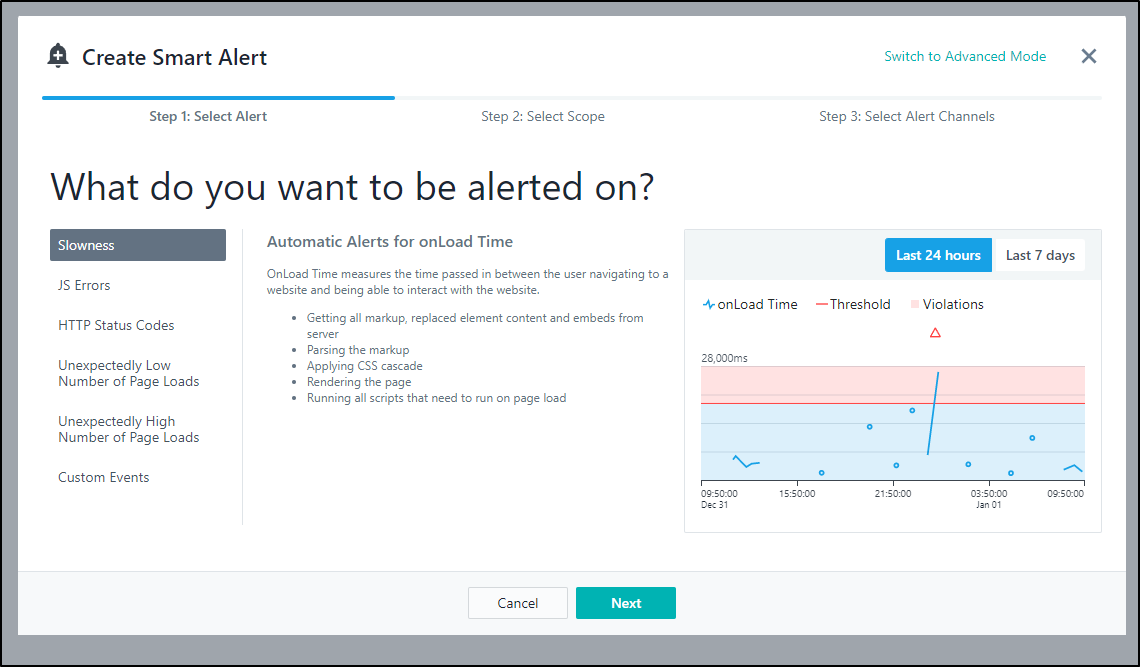
Smart Alerts
Say we wish to be notified on outages or excess slowness. We can create a smart alert on that.
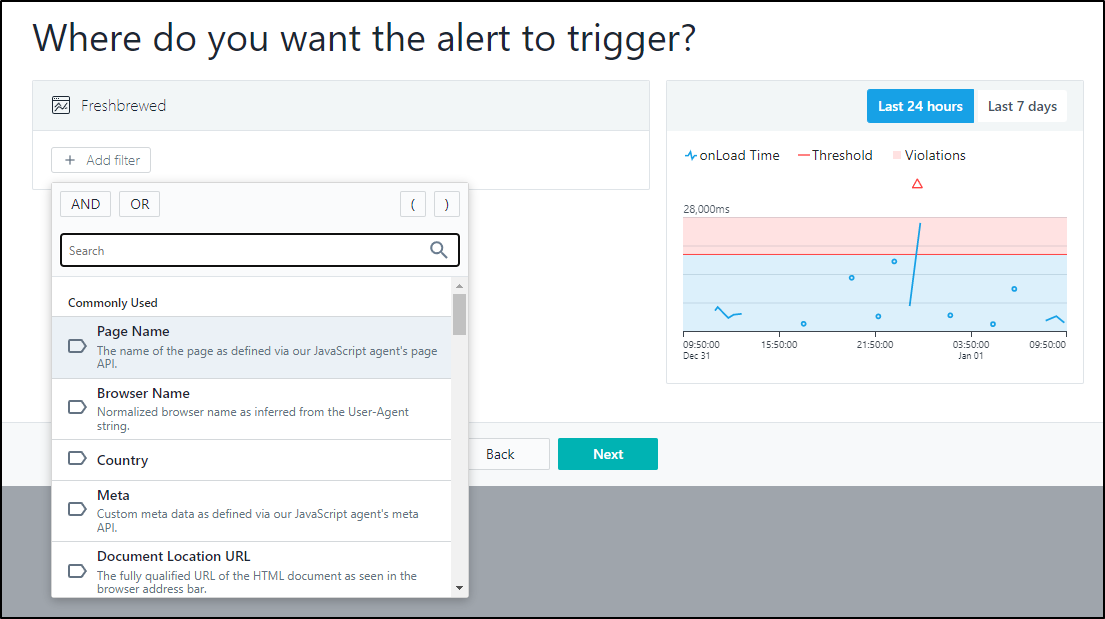
I could limit the Smart Alert to a specific browser or page
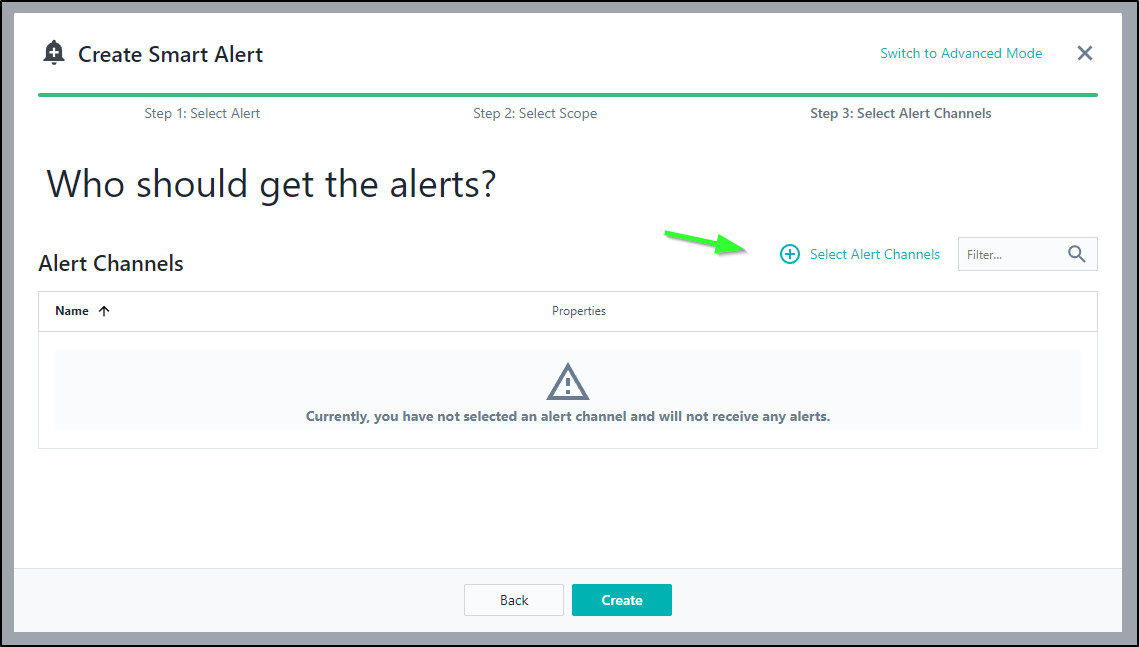
I’ll let it for all things in this case. Next, I’ll need to select the Alert Channel. As I haven’t created one, I can click the “+” near “Select Alert Channels”
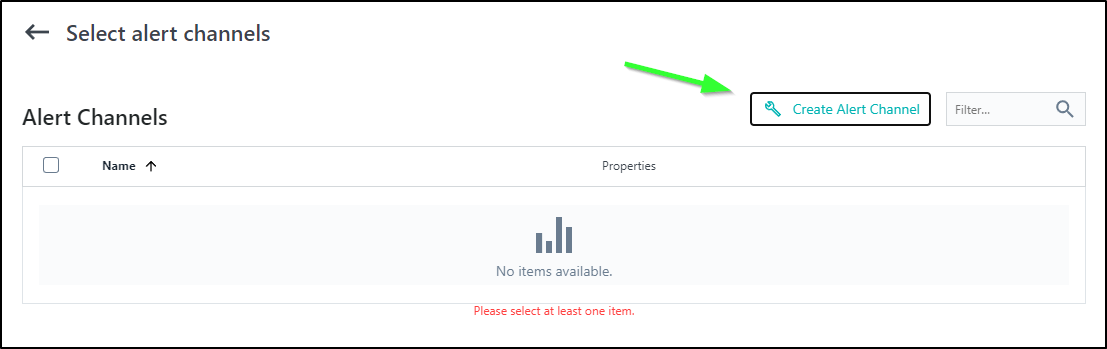
and from there, “Create Alert Channel”
The list looks fairly similar to Dynatrace’s selector (with the addition of WebEx and Watson).
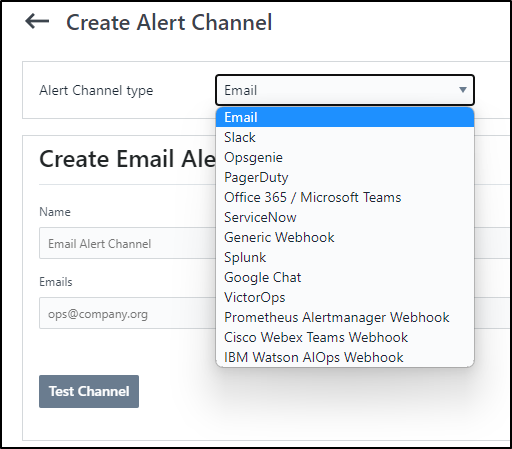
As we have Teams as a real option this time, Let’s create an Instana Teams channel then circle back
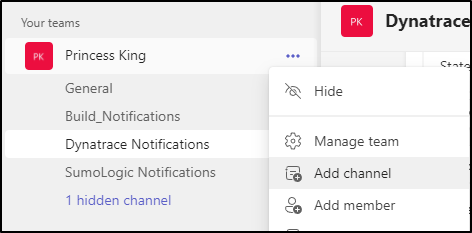
Teams Channel
We can use the dots to “Add channel”
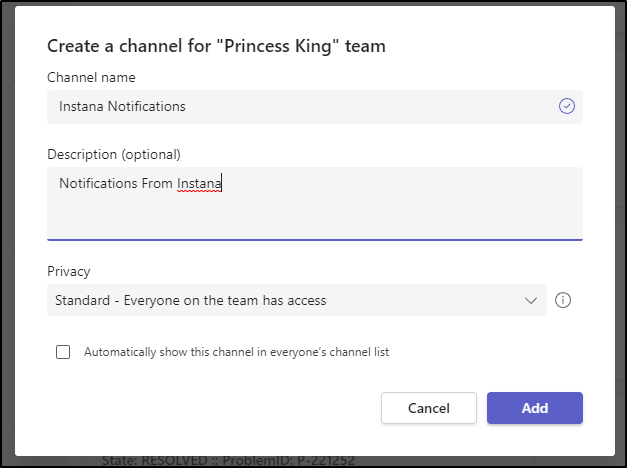
Then give it a name
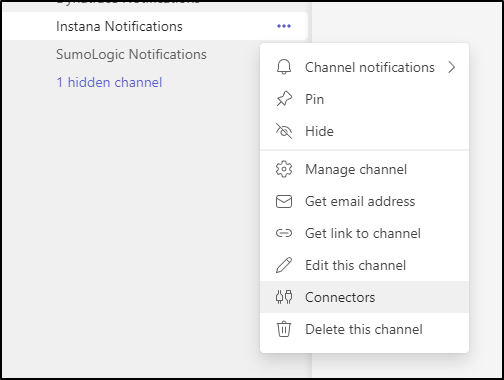
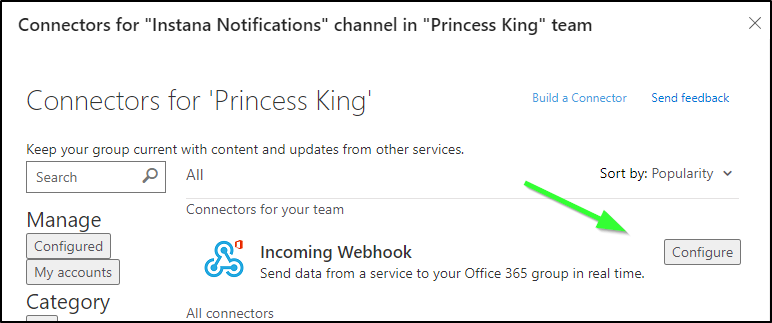
From there, we choose connectors
Then “configure webhook”
I made a cute little logo for Instana errors

Which I’ll use in the configuration
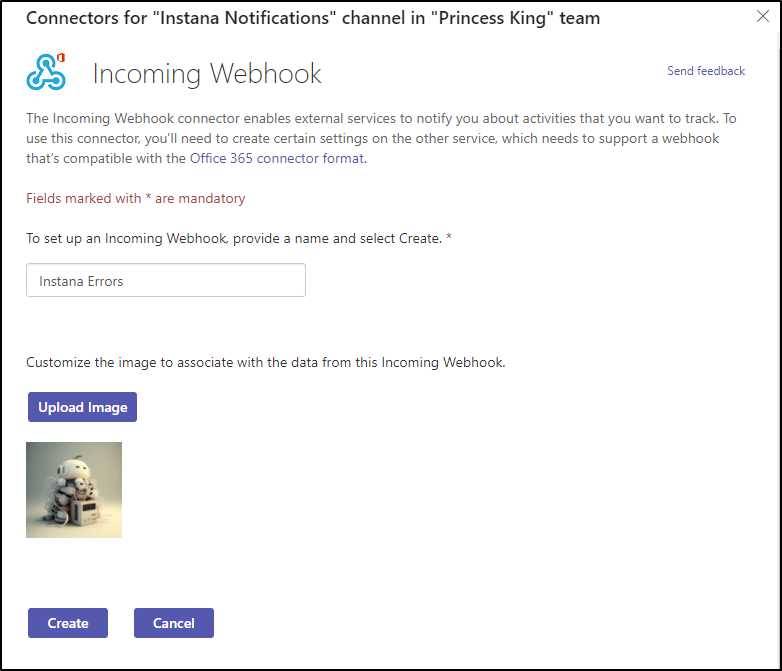
Clicking create gives us the URL to use for Webhooks
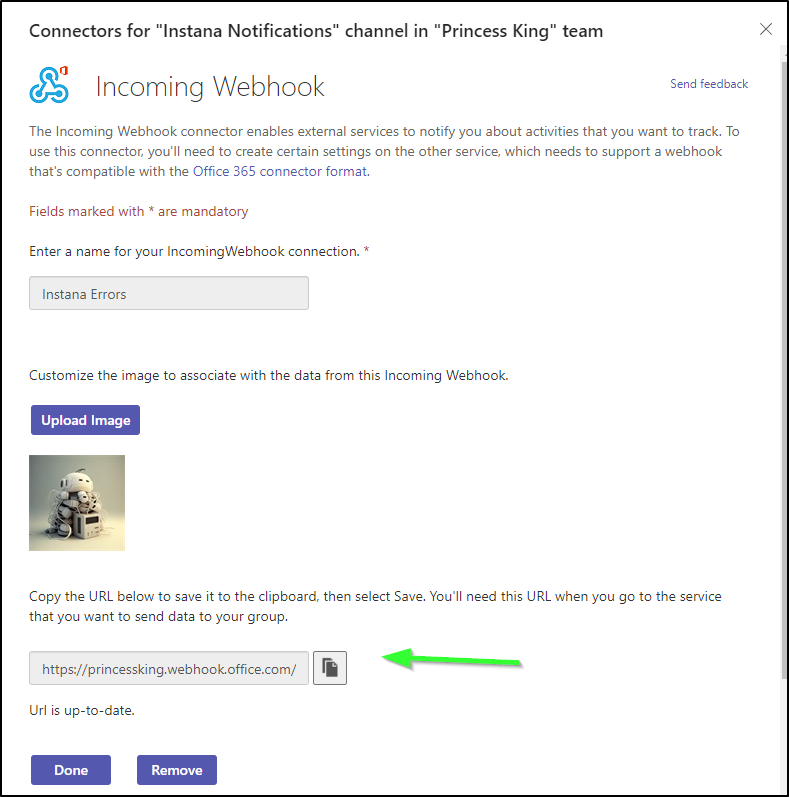
Which we can now use in the Alert Channel create page
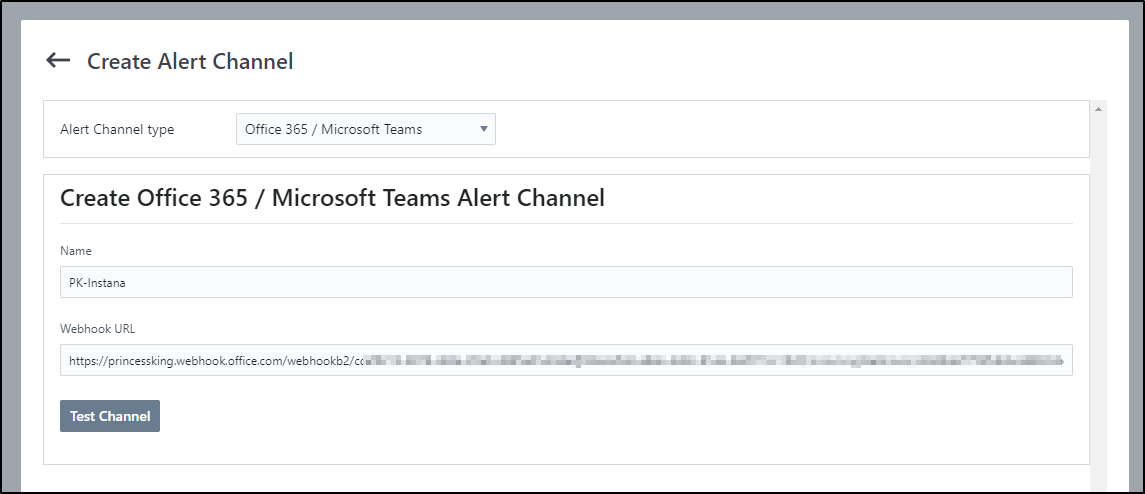
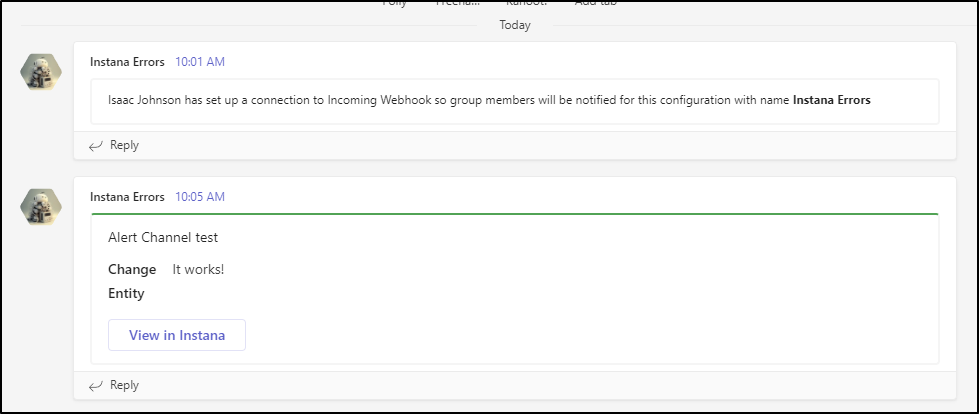
I’ll “Test Channel”
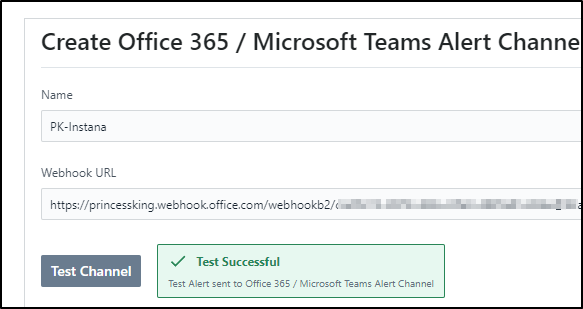
Which shows up in Teams
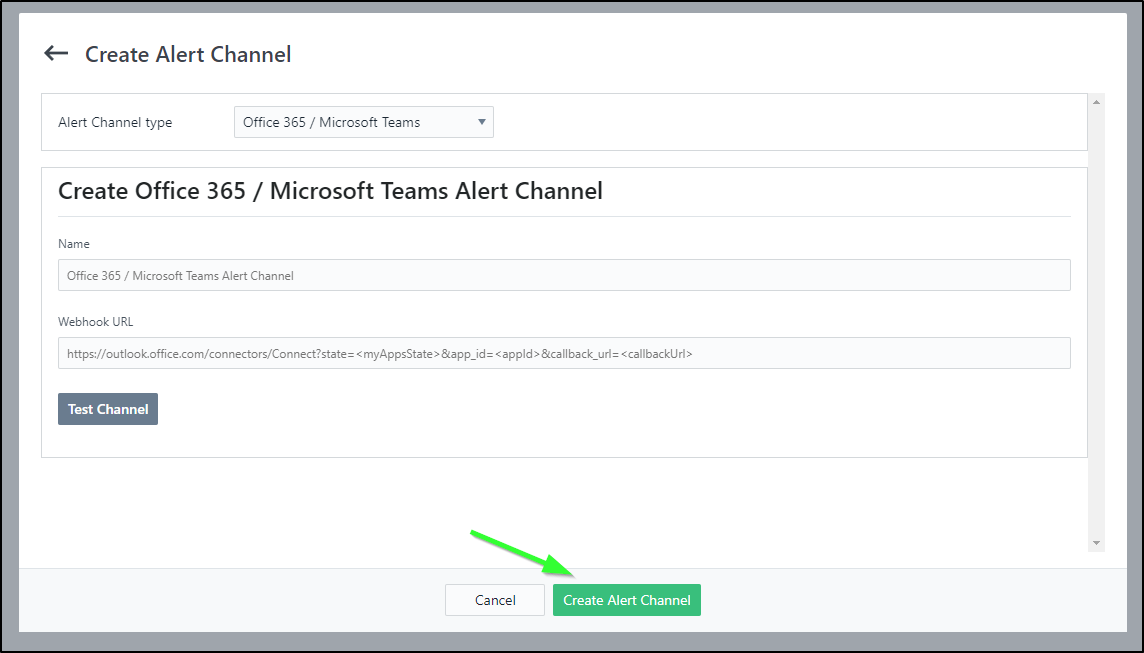
Now, I can create the Alert Channel
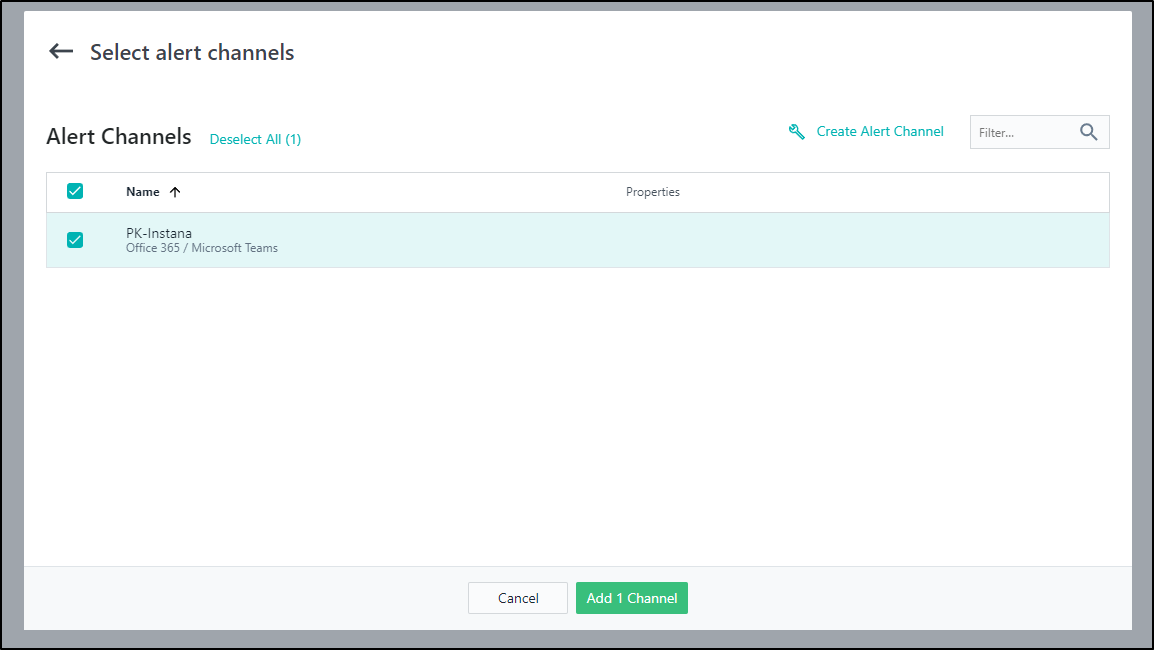
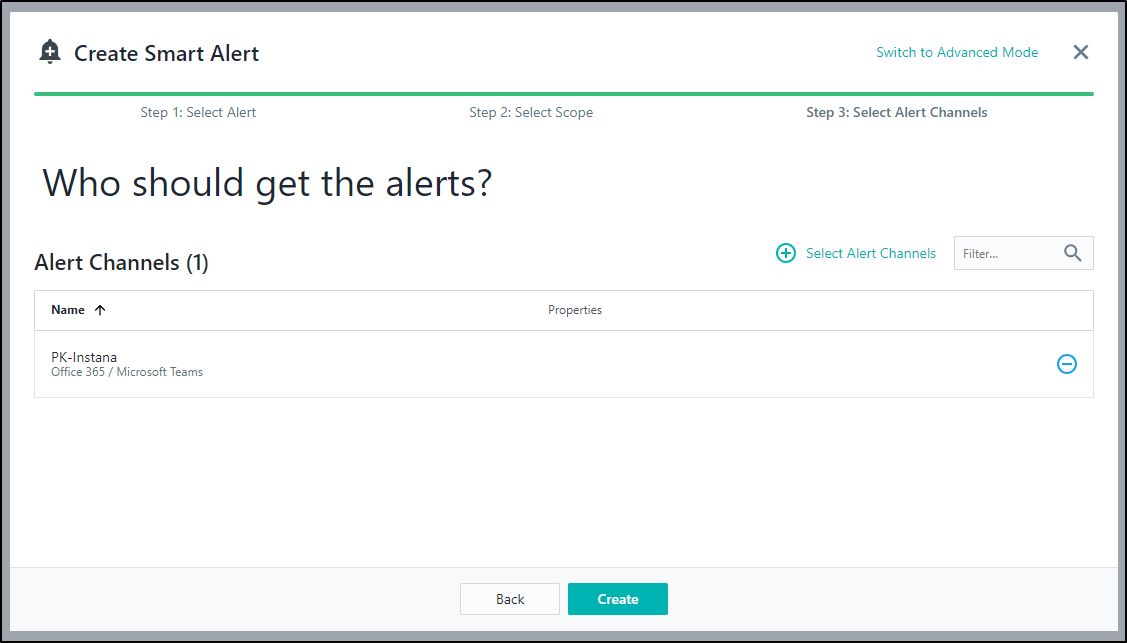
I can now select the Channel for the Alert
And lastly, create the alert
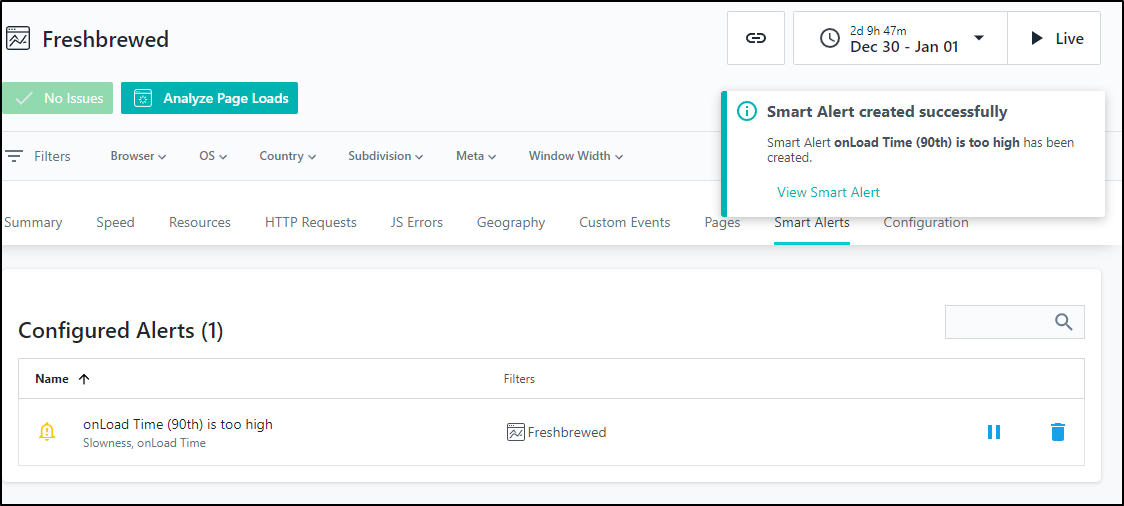
which we now see in Configured Alerts
Using Alerts
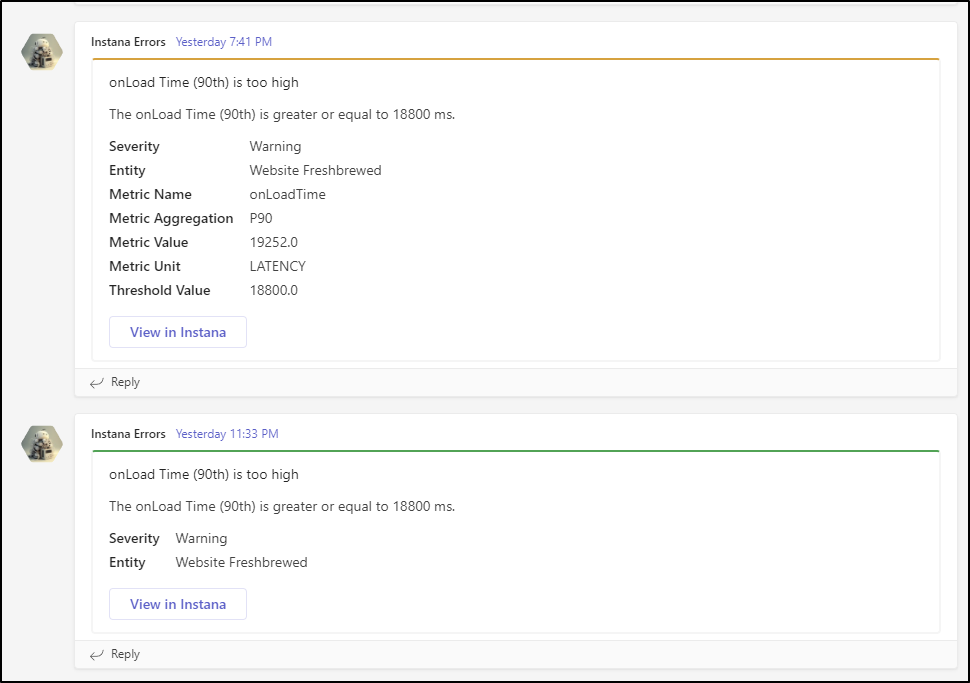
Letting it run overnight, I saw some warnings come up at 7:41pm and 11:33pm local time
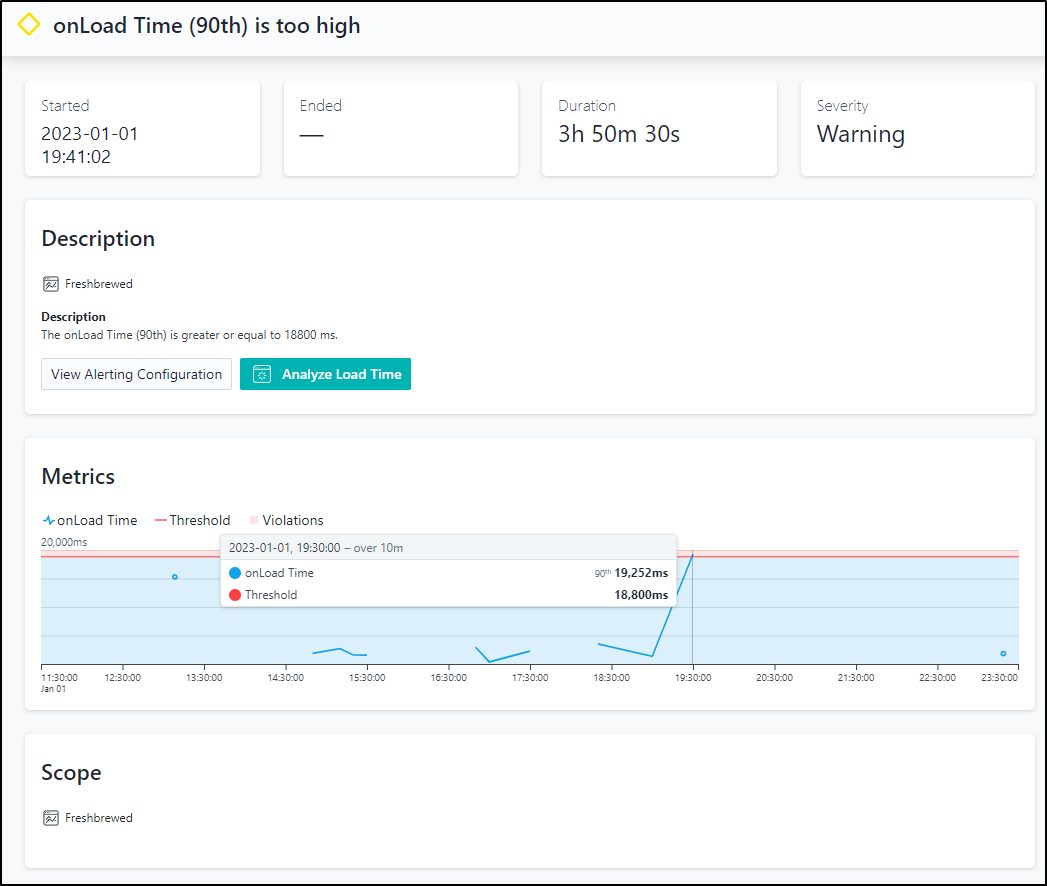
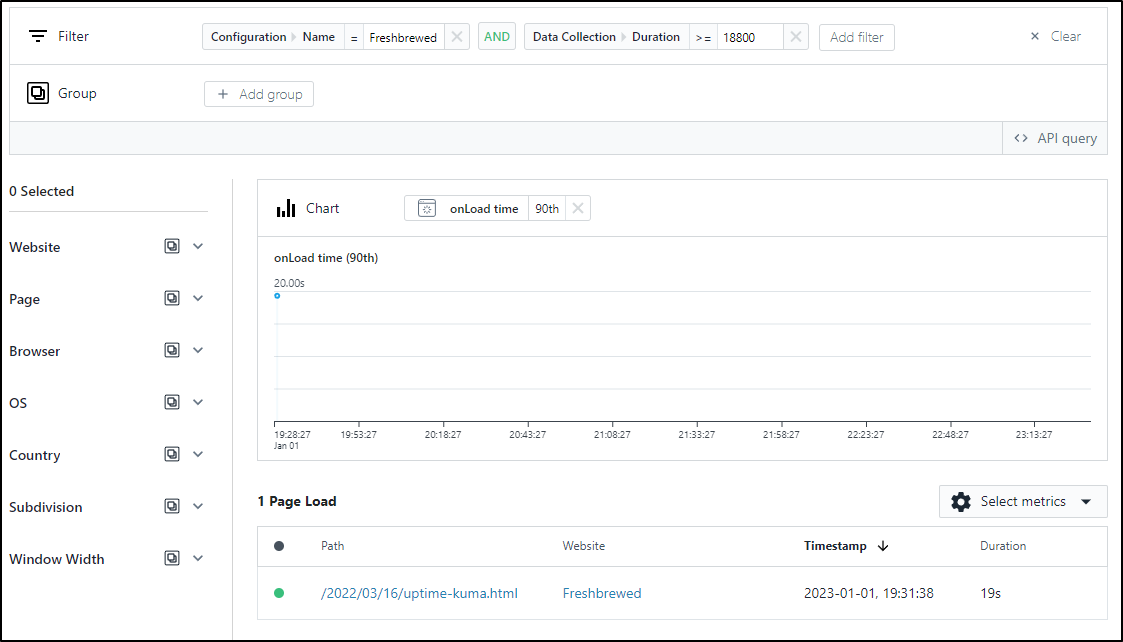
If I click “View in Instana” from the alert, I can see a page took 19s to load
I clicked the “Analyze Load Time” option and see it was someone pulling the older write up on Uptime Kuma
Lastly, clicking that link I can see details on the exact request including timings on specific files, users’ browser, and location
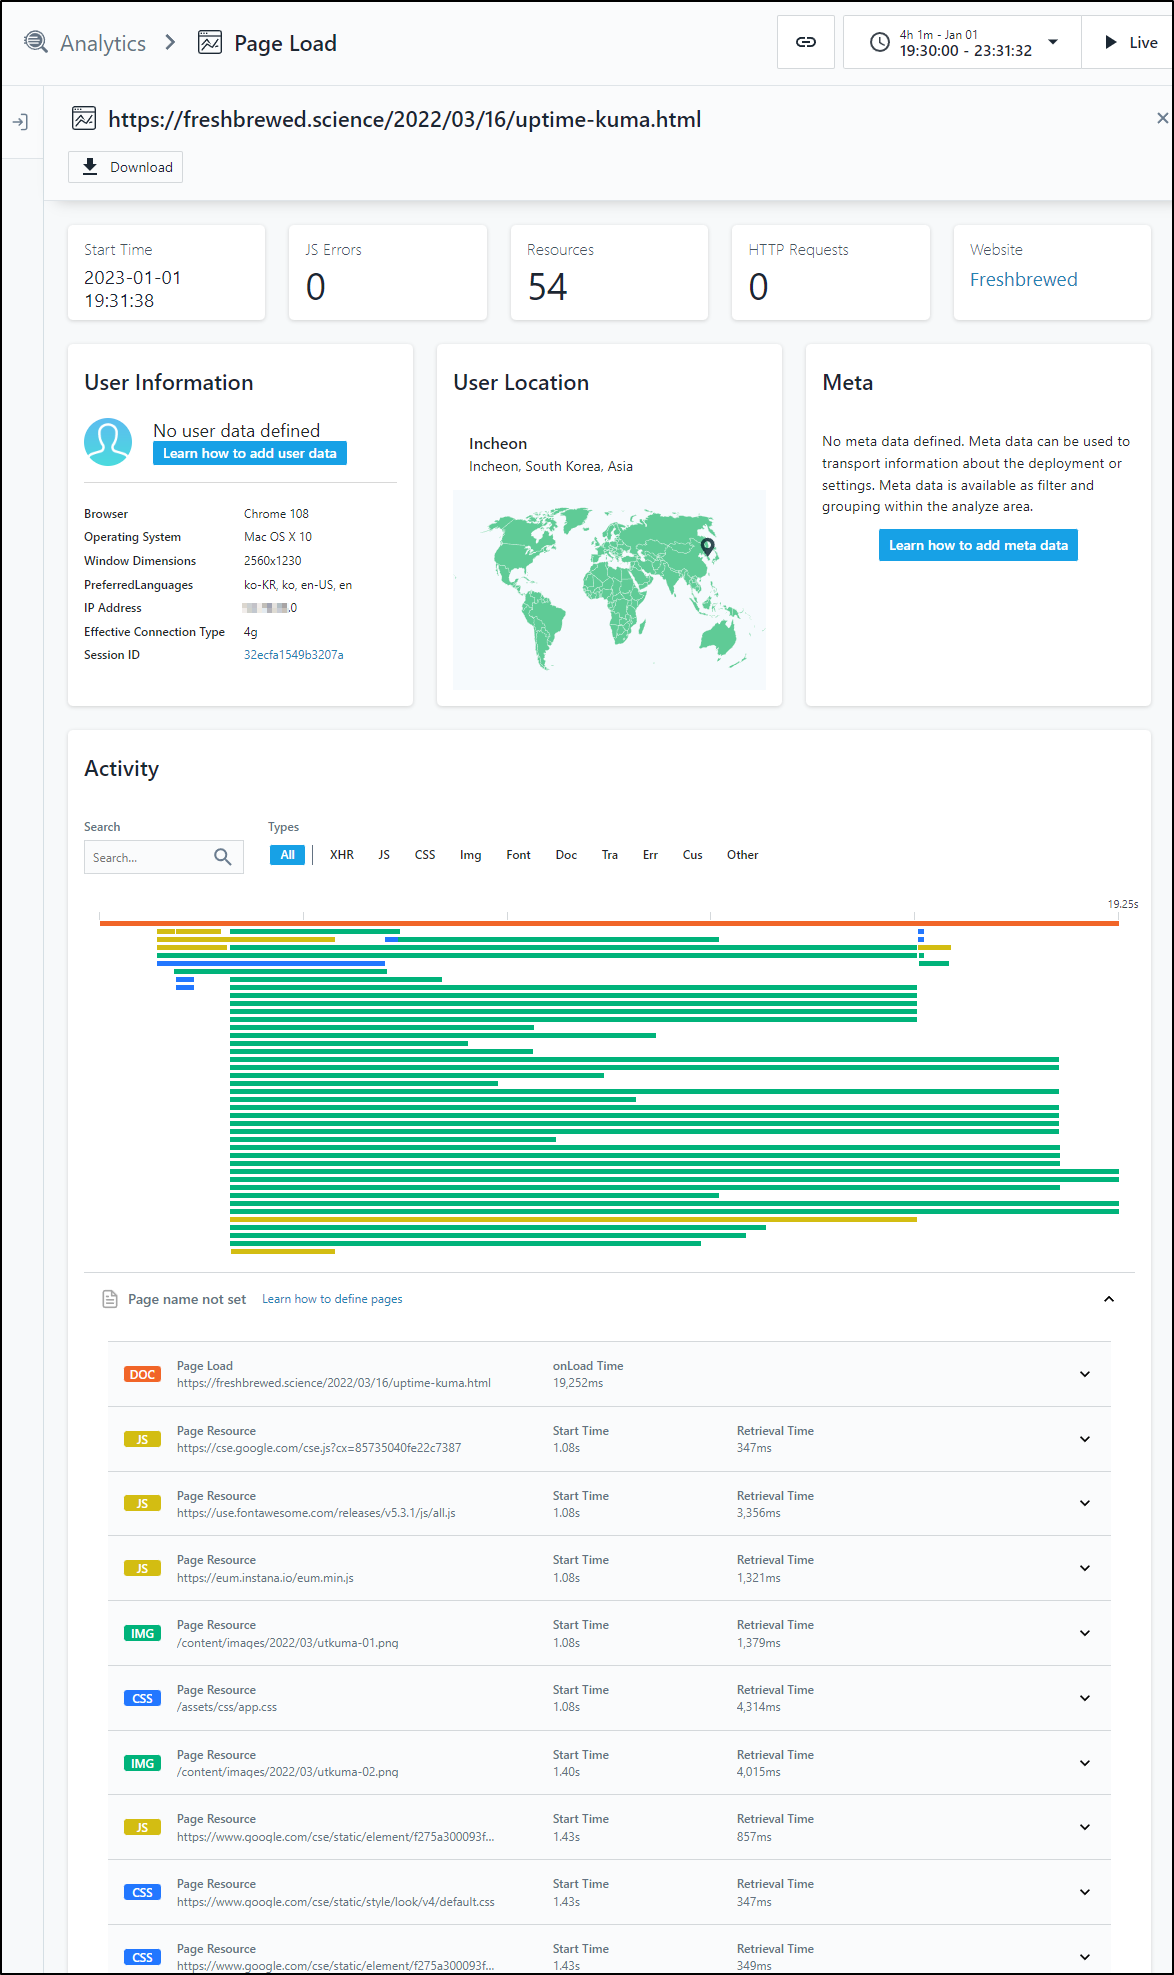
The IP Address was trimmed to ‘.0’, but I still don’t feel right showing even a /24. But what it does show me is that it was pulled to an AWS instance for someone on a Mac somewhere in South Korea. That said, Having an older blog post take a bit might just be an effect of CDN syncing.
Note: I don’t feel that comfortable pulling this number of details on people - so when this post is up, the tracking parts will be removed and all history deleted.
AKS
Let’s create a quick cluster.
First we make a RG
$ az group create -n aksinstanag --location centralus
{
  "id": "/subscriptions/d955c0ba-13dc-44cf-a29a-8fed74cbb22d/resourceGroups/aksinstanag",
  "location": "centralus",
  "managedBy": null,
  "name": "aksinstanag",
  "properties": {
    "provisioningState": "Succeeded"
  },
  "tags": null,
  "type": "Microsoft.Resources/resourceGroups"
}
Create a SP to use
$ az ad sp create-for-rbac --name aksinstana.isaacjohnsongmail.onmicrosoft.com --skip-assignment --output json > mysp.json
$ export SP_PASS=`cat mysp.json | jq -r .password`
$ export SP_ID=`cat mysp.json | jq -r .appId`
Then create
$ az aks create -n aksinstana -g aksinstanag --location centralus --node-count 3 --enable-cluster-autoscaler --min-count 2 --max-count 4 --generate-ssh-keys --network-plugin azure --network-policy azure --service-principal $SP_ID --client-secret $SP_PASS
{
  "aadProfile": null,
  "addonProfiles": null,
  "agentPoolProfiles": [
    {
      "availabilityZones": null,
      "count": 3,
      "creationData": null,
      "currentOrchestratorVersion": "1.23.12",
      "enableAutoScaling": true,
      "enableEncryptionAtHost": false,
      "enableFips": false,
      "enableNodePublicIp": false,
      "enableUltraSsd": false,
      "gpuInstanceProfile": null,
      "hostGroupId": null,
      "kubeletConfig": null,
      ...
Then create it
$ az aks get-credentials -n aksinstana -g aksinstanag --admin
Merged "aksinstana-admin" as current context in /home/builder/.kube/config
And verify we have access
$ kubectl get nodes
NAME                                STATUS   ROLES   AGE     VERSION
aks-nodepool1-25563308-vmss000000   Ready    agent   7m49s   v1.23.12
aks-nodepool1-25563308-vmss000001   Ready    agent   7m50s   v1.23.12
aks-nodepool1-25563308-vmss000002   Ready    agent   7m58s   v1.23.12
I’ll go to Instana and choose to “Deploy Instana” on Azure, the only option being AKS
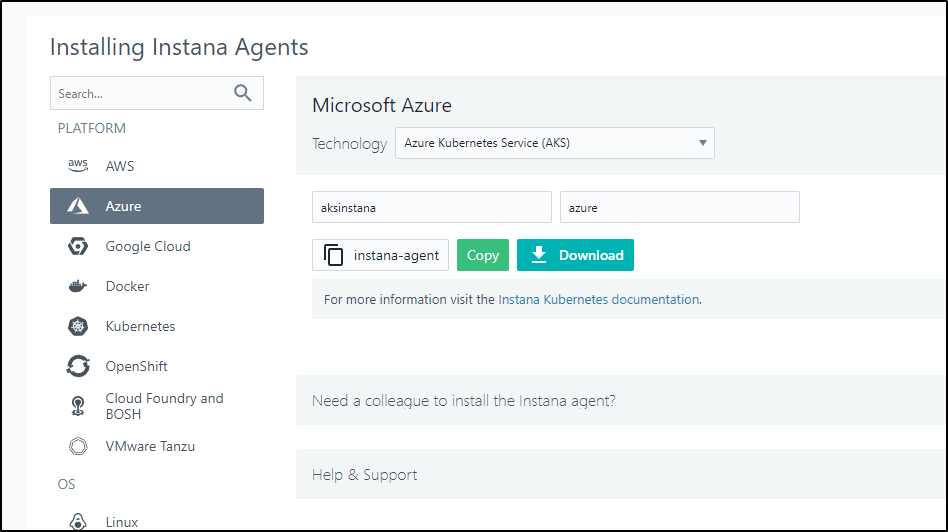
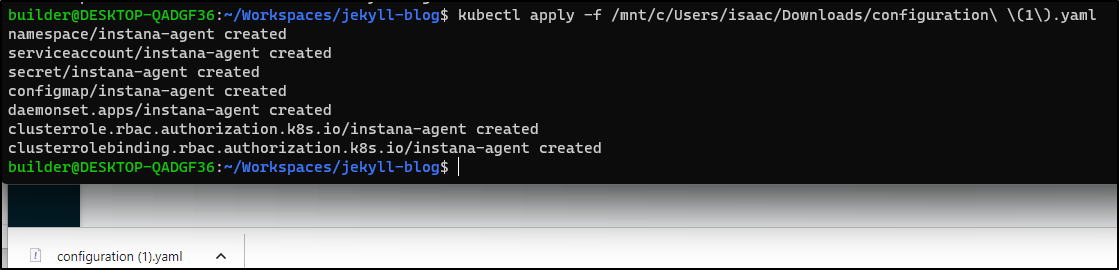
Then I’ll apply it
I’ll deploy a sample app so we have something to see
$ helm repo add azure-samples https://azure-samples.github.io/helm-charts/
"azure-samples" already exists with the same configuration, skipping
$ helm repo update
Hang tight while we grab the latest from your chart repositories...
...Successfully got an update from the "confluentinc" chart repository
...Successfully got an update from the "myharbor" chart repository
...Successfully got an update from the "dapr" chart repository
...Successfully got an update from the "azure-samples" chart repository
...Successfully got an update from the "actions-runner-controller" chart repository
...Successfully got an update from the "rhcharts" chart repository
...Successfully got an update from the "uptime-kuma" chart repository
...Successfully got an update from the "kuma" chart repository
...Successfully got an update from the "hashicorp" chart repository
...Successfully got an update from the "longhorn" chart repository
...Successfully got an update from the "epsagon" chart repository
...Successfully got an update from the "sonarqube" chart repository
...Successfully got an update from the "nginx-stable" chart repository
...Successfully got an update from the "rook-release" chart repository
...Successfully got an update from the "sumologic" chart repository
...Successfully got an update from the "open-telemetry" chart repository
...Successfully got an update from the "adwerx" chart repository
...Successfully got an update from the "lifen-charts" chart repository
...Successfully got an update from the "kubecost" chart repository
...Successfully got an update from the "harbor" chart repository
...Successfully got an update from the "datadog" chart repository
...Successfully got an update from the "argo-cd" chart repository
...Successfully got an update from the "rancher-latest" chart repository
...Successfully got an update from the "novum-rgi-helm" chart repository
...Successfully got an update from the "incubator" chart repository
...Successfully got an update from the "crossplane-stable" chart repository
...Successfully got an update from the "gitlab" chart repository
...Successfully got an update from the "newrelic" chart repository
...Successfully got an update from the "bitnami" chart repository
Update Complete. ⎈Happy Helming!⎈

$ helm install azure-samples/azure-vote --generate-name
NAME: azure-vote-1672668857
LAST DEPLOYED: Mon Jan  2 08:14:18 2023
NAMESPACE: default
STATUS: deployed
REVISION: 1
TEST SUITE: None
NOTES:
The Azure Vote application has been started on your Kubernetes cluster.

Title: Azure Vote App
Vote 1 value: Cats
Vote 2 value: Dogs

The externally accessible IP address can take a minute or so to provision. Run the following command to monitor the provisioning status. Once an External IP address has been provisioned, brows to this IP address to access the Azure Vote application.

kubectl get service -l name=azure-vote-front -w
We can now see the cluster listed
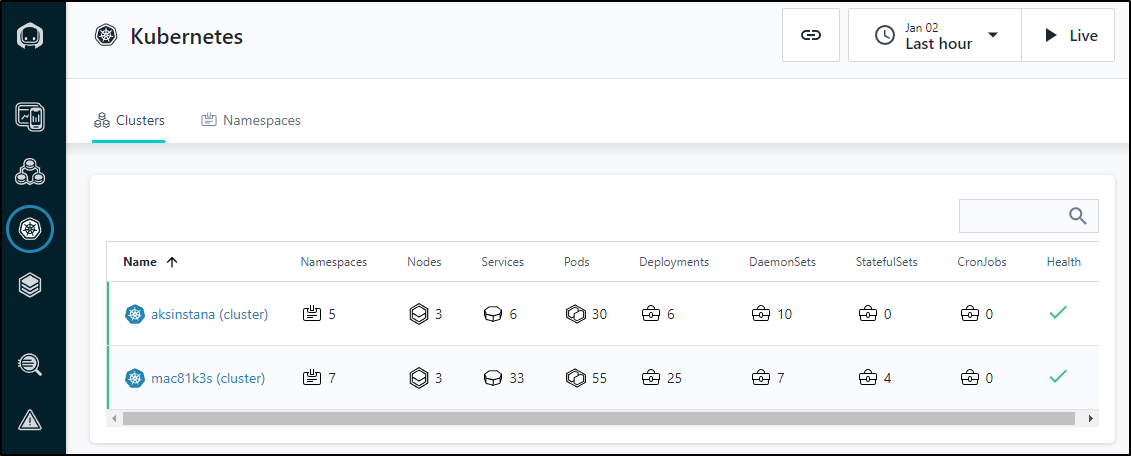
And it lists our namespaces and deployments
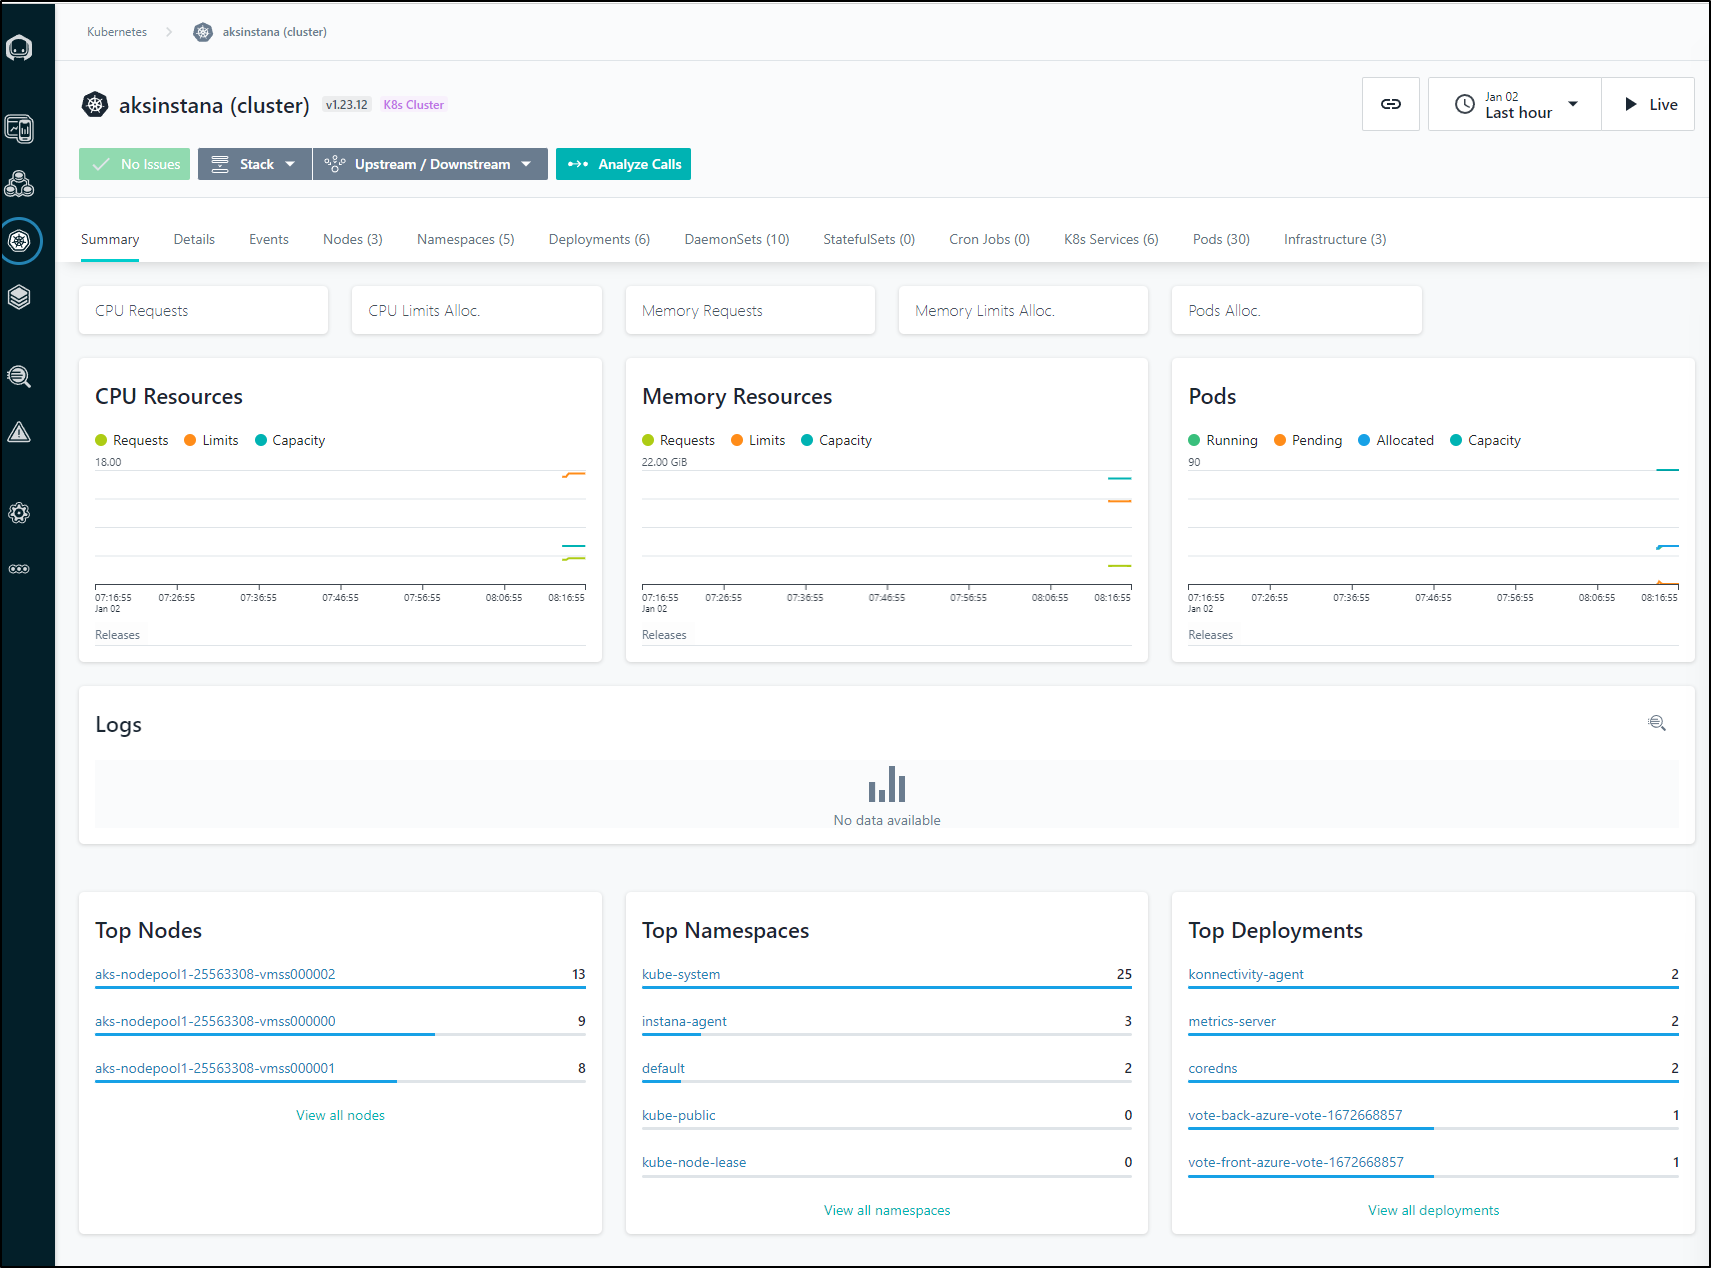
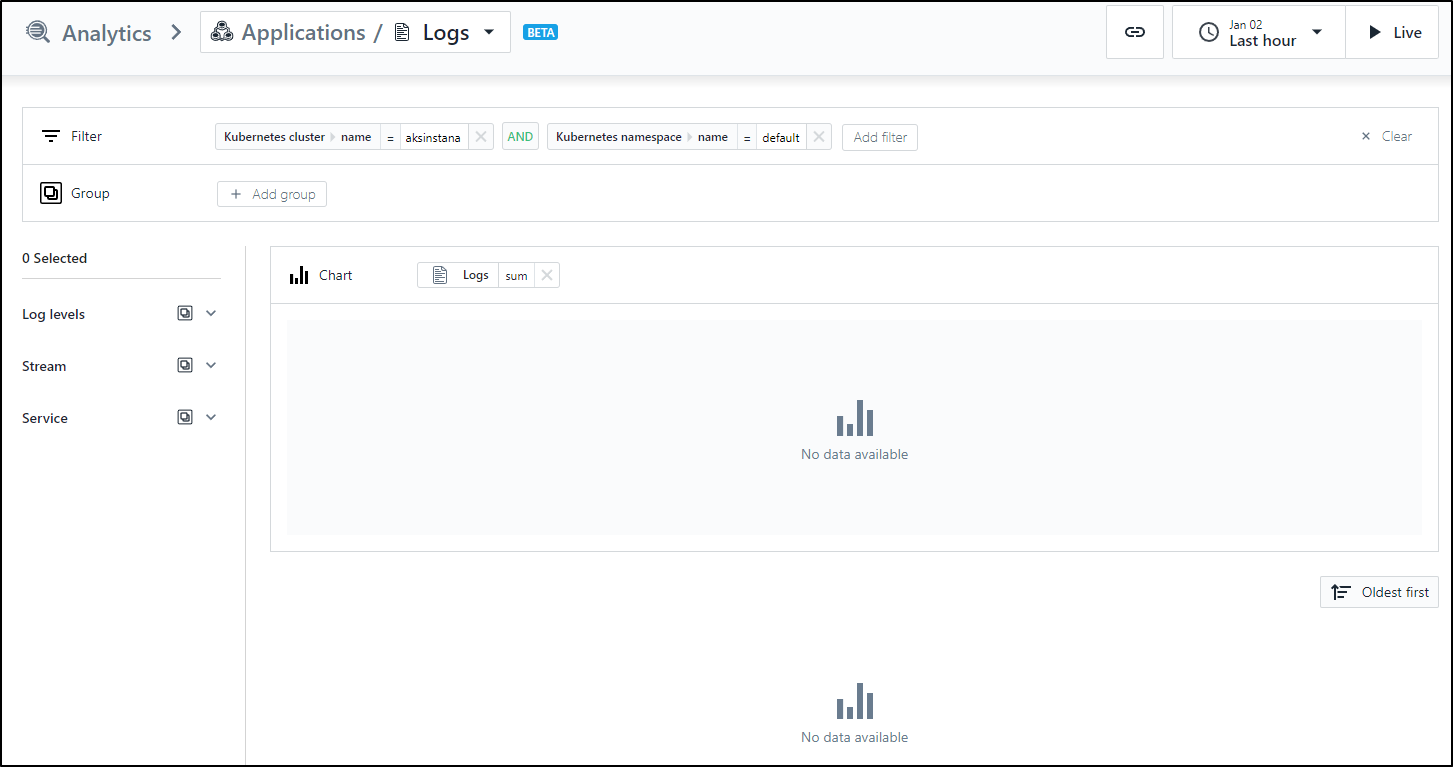
I don’t get logs, which doesn’t surprise me
We can drill into it and see details of the containers
Mezmo (LogDNA) action
We’ll go to logs and choose LogDNA
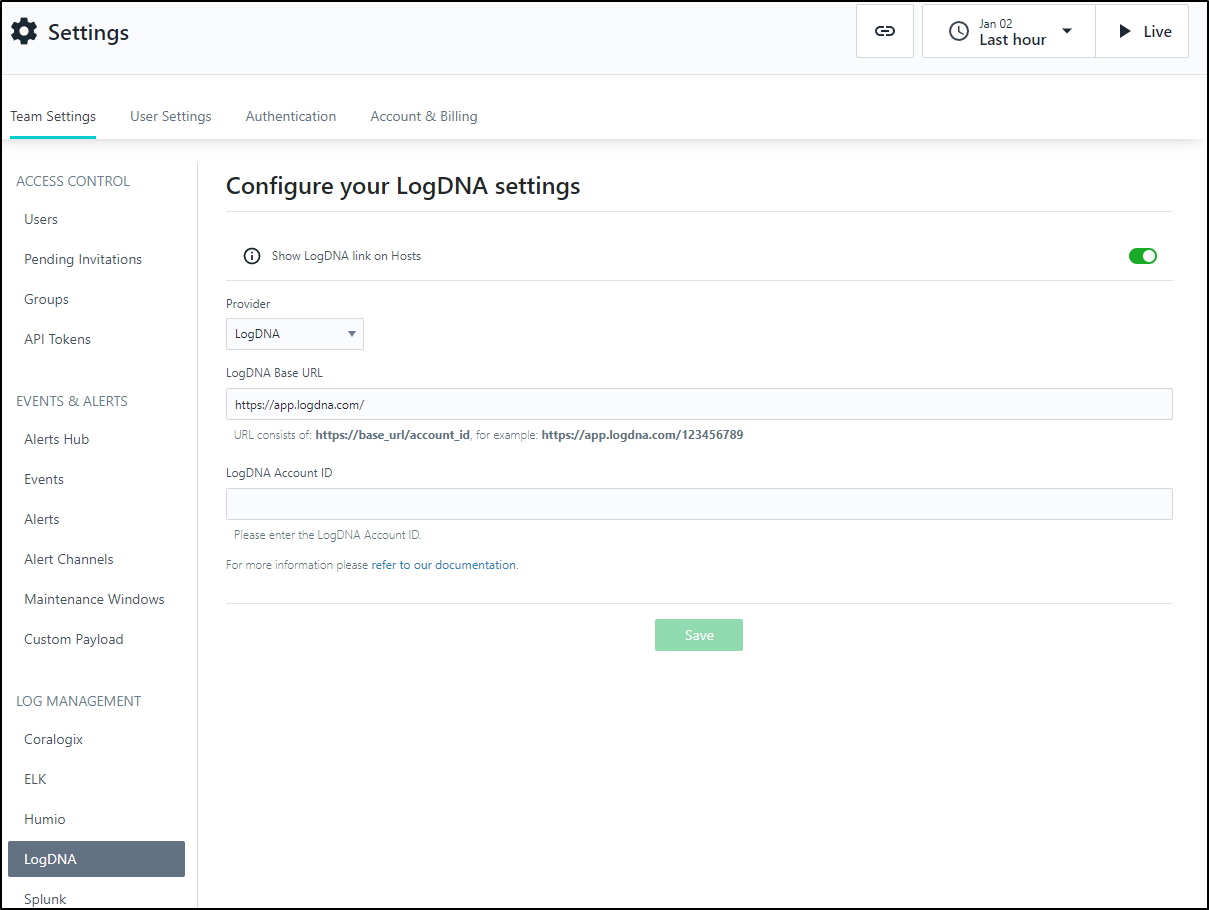
we can pull that from our Mezmo URL
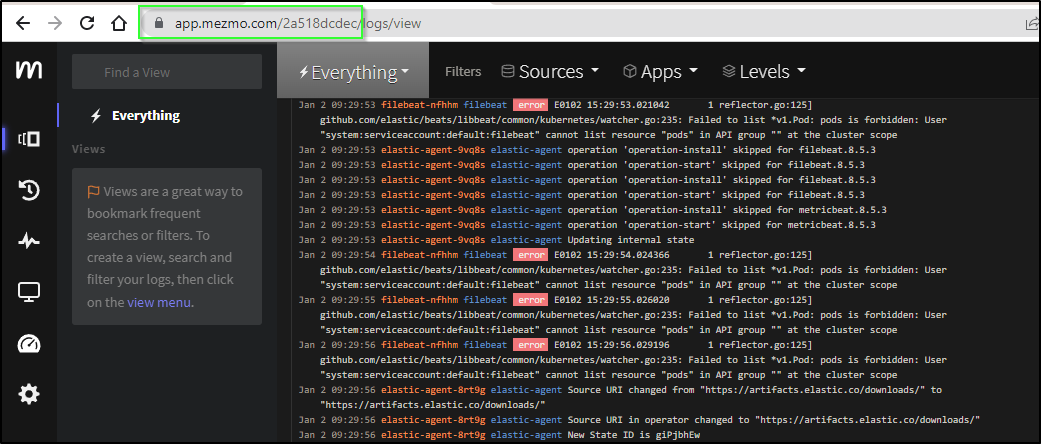
and add that as our base and account id
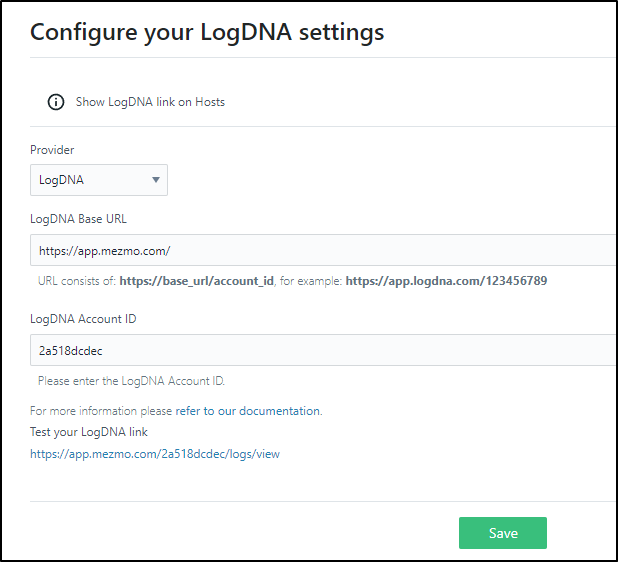
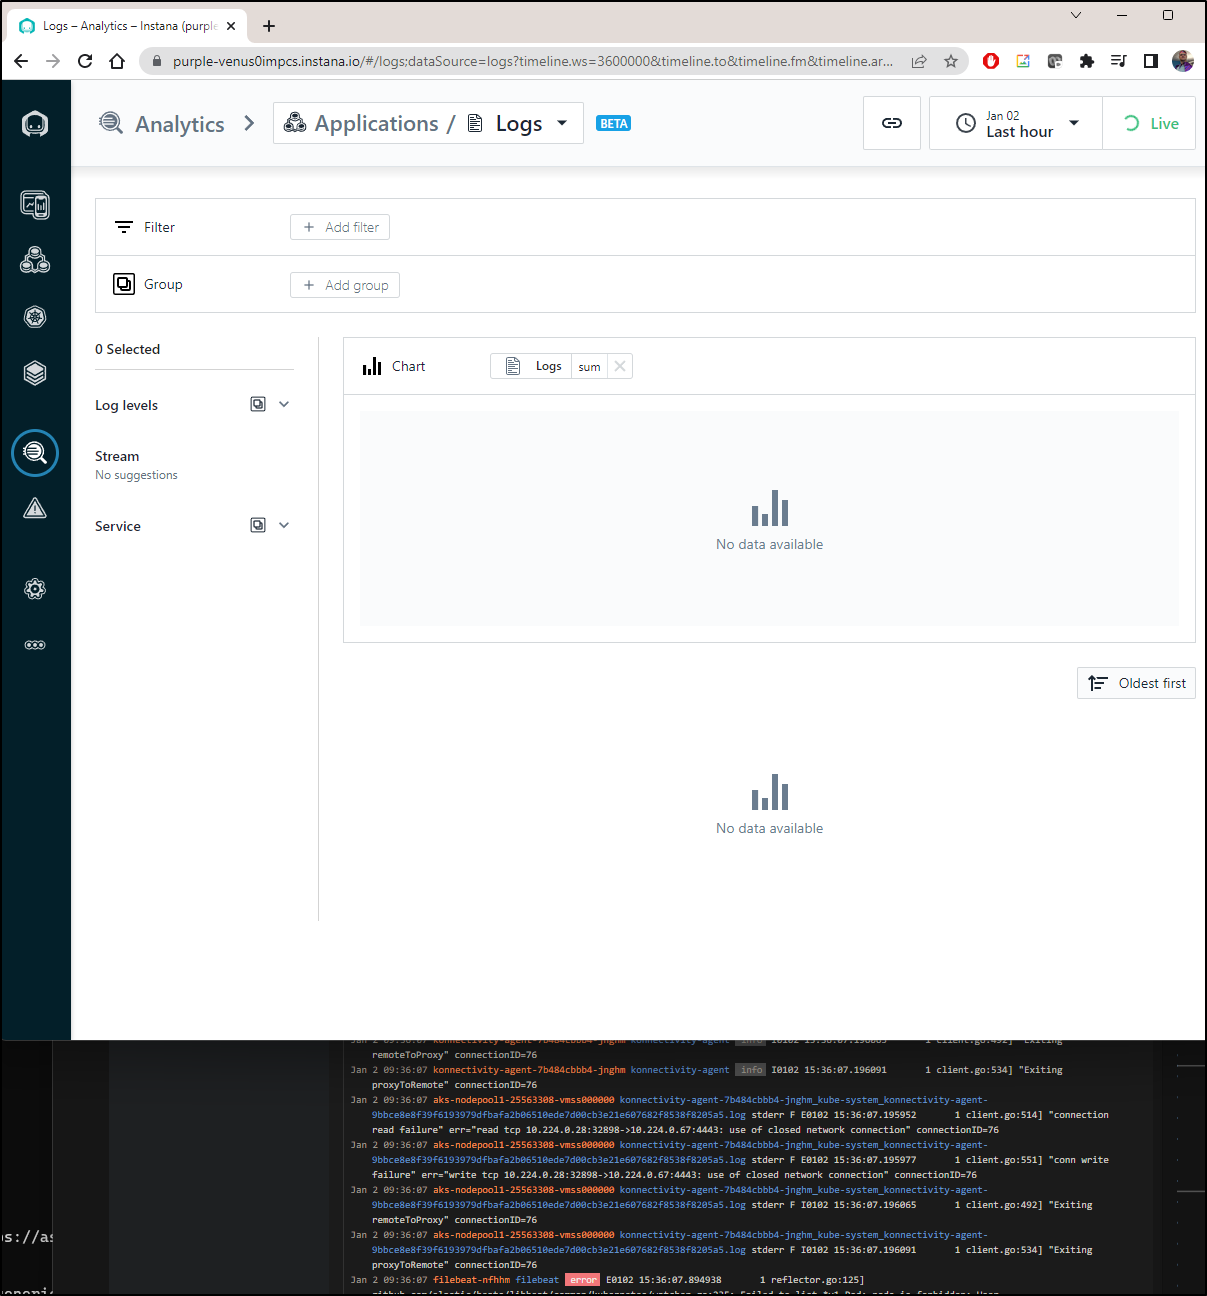
I can see logs in Mezmo but not reflected in Instana
Coralogix
I can add a Coralogix endpoint as well
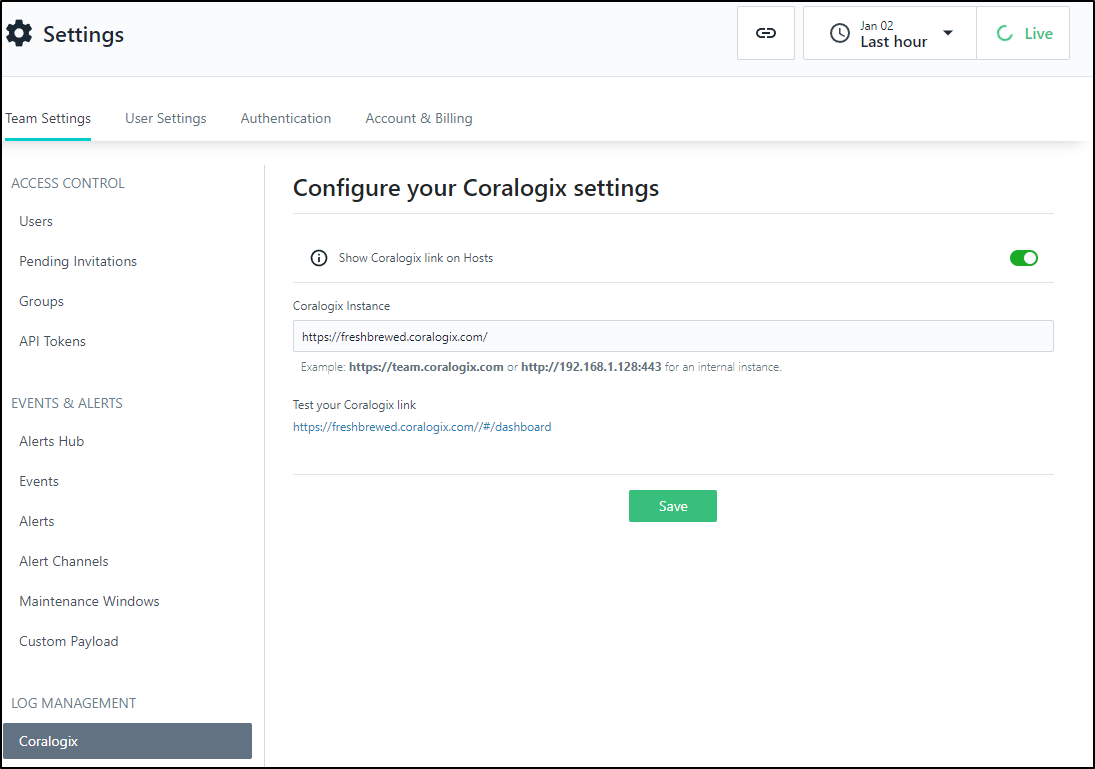
Using external log providers
You only see these on Hosts, not containers.
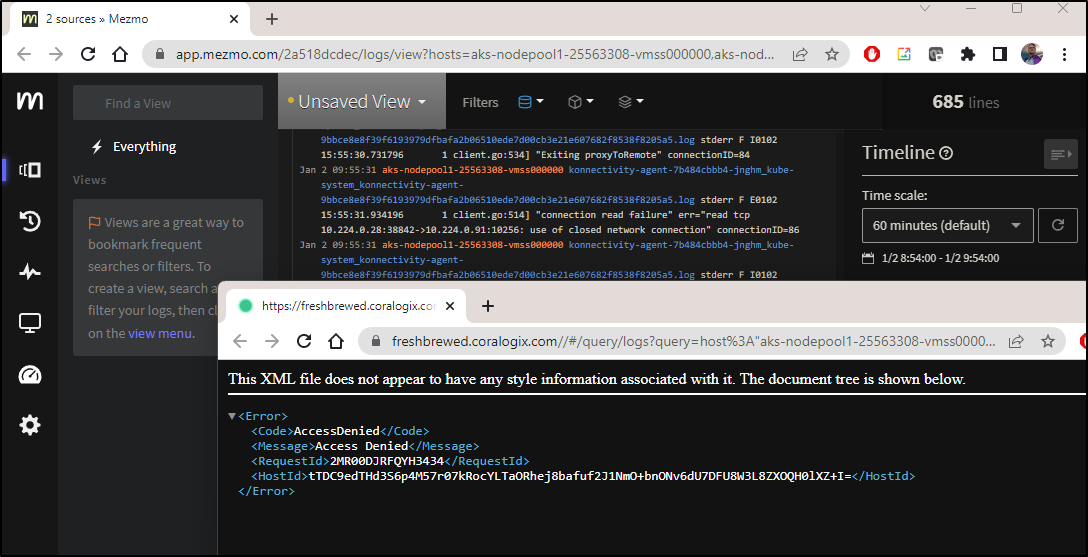
When looking at a host, there is a “Go To Logs” button that will just pop up a window to the external log provider, assuming you have logs collected on that host name
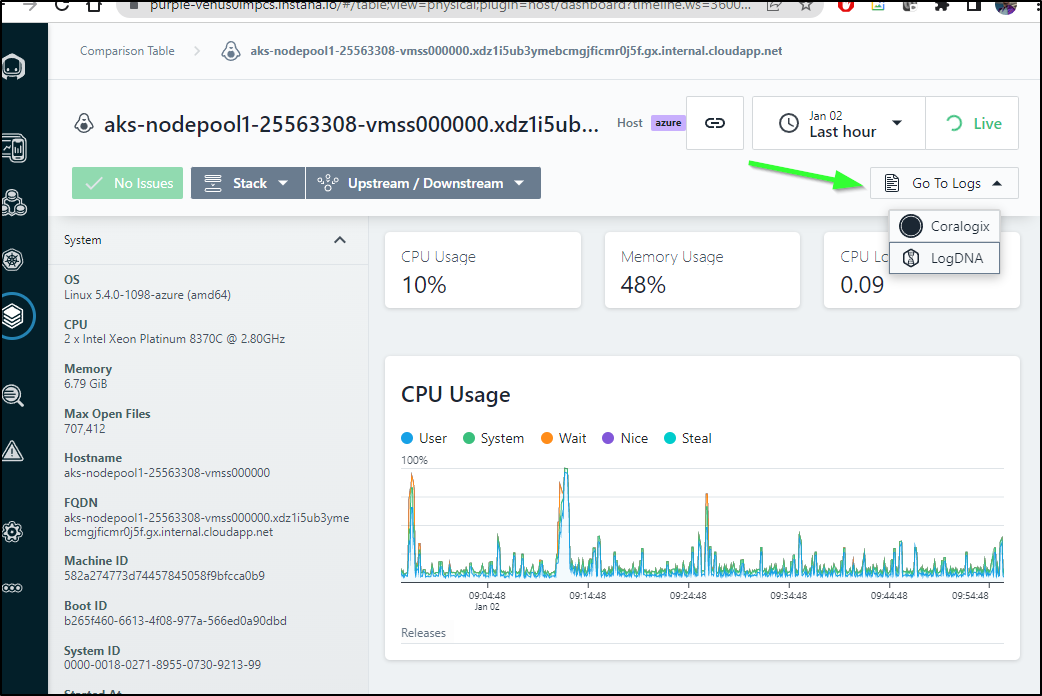
As I do have these captured in Mezmo, we can see logs. In Coralogix, we see the usual error page for an AWS hosted app
Hosts
Let’s add a Windows host first
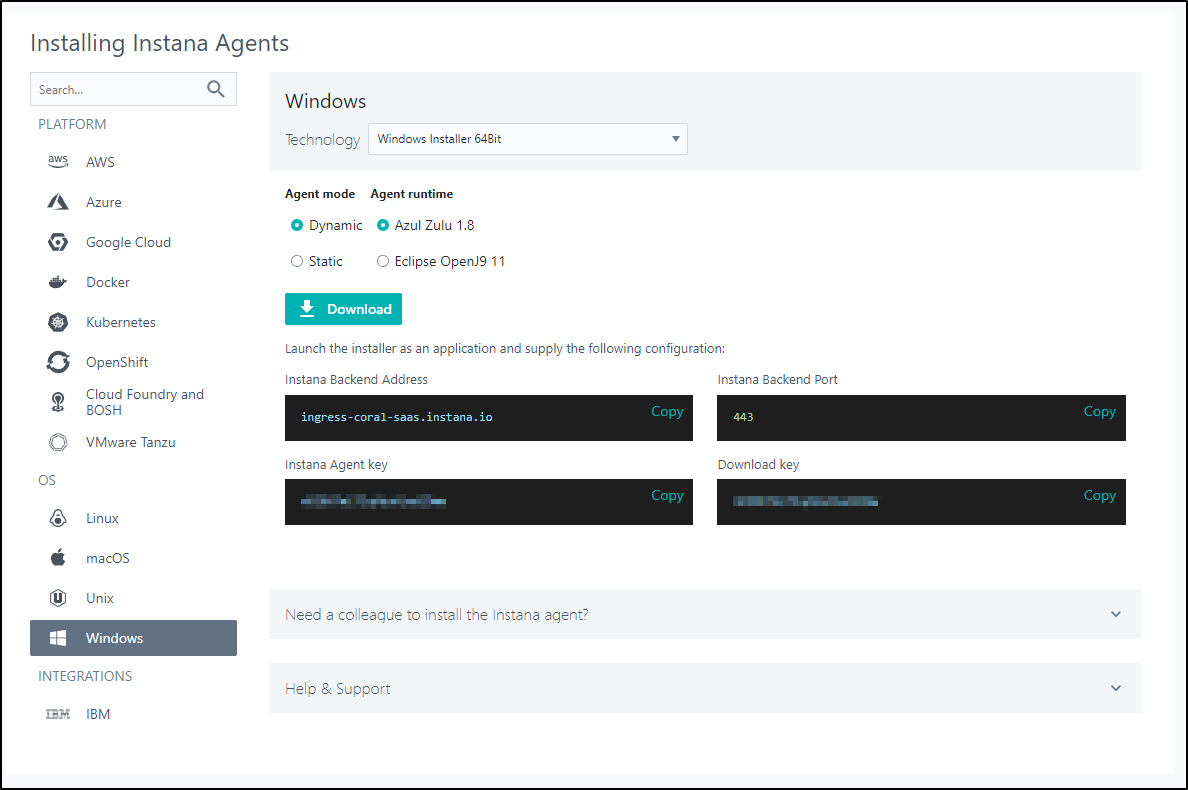
I’ll supply the values from the form. It defaulted to APM. I’ll set it as an Infrastructure agent
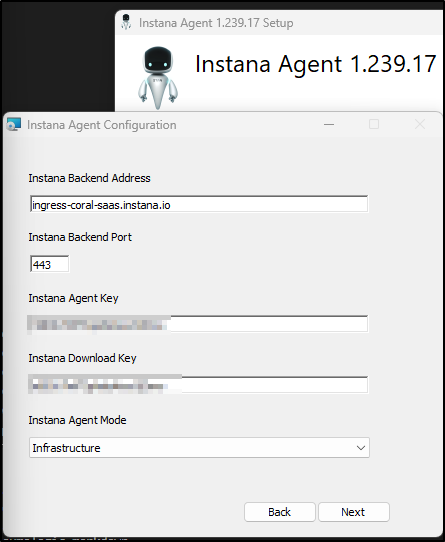
When done, I can see it is running as a service

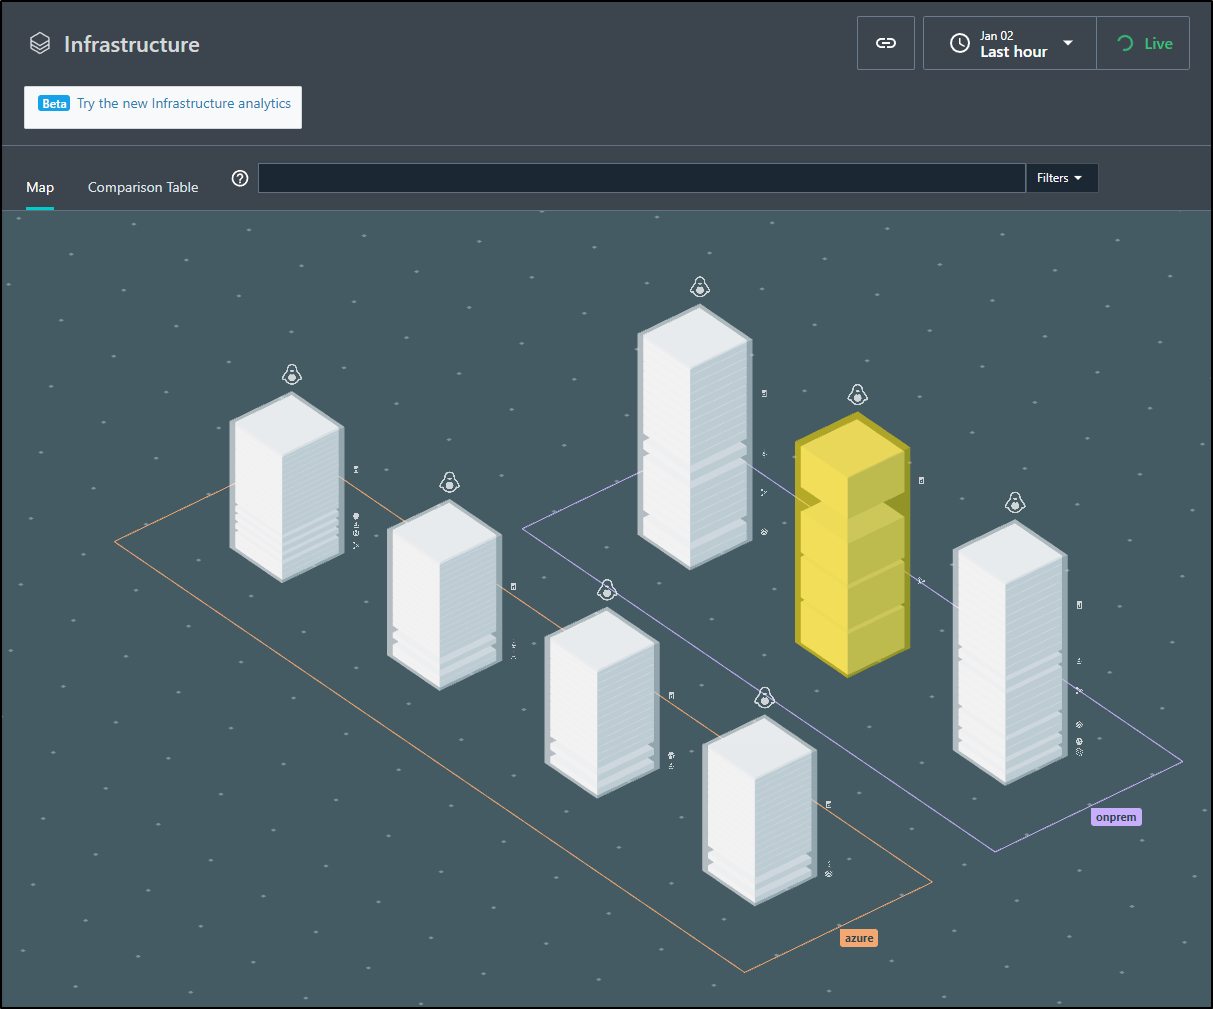
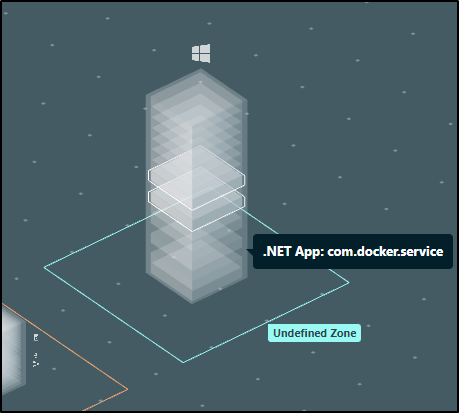
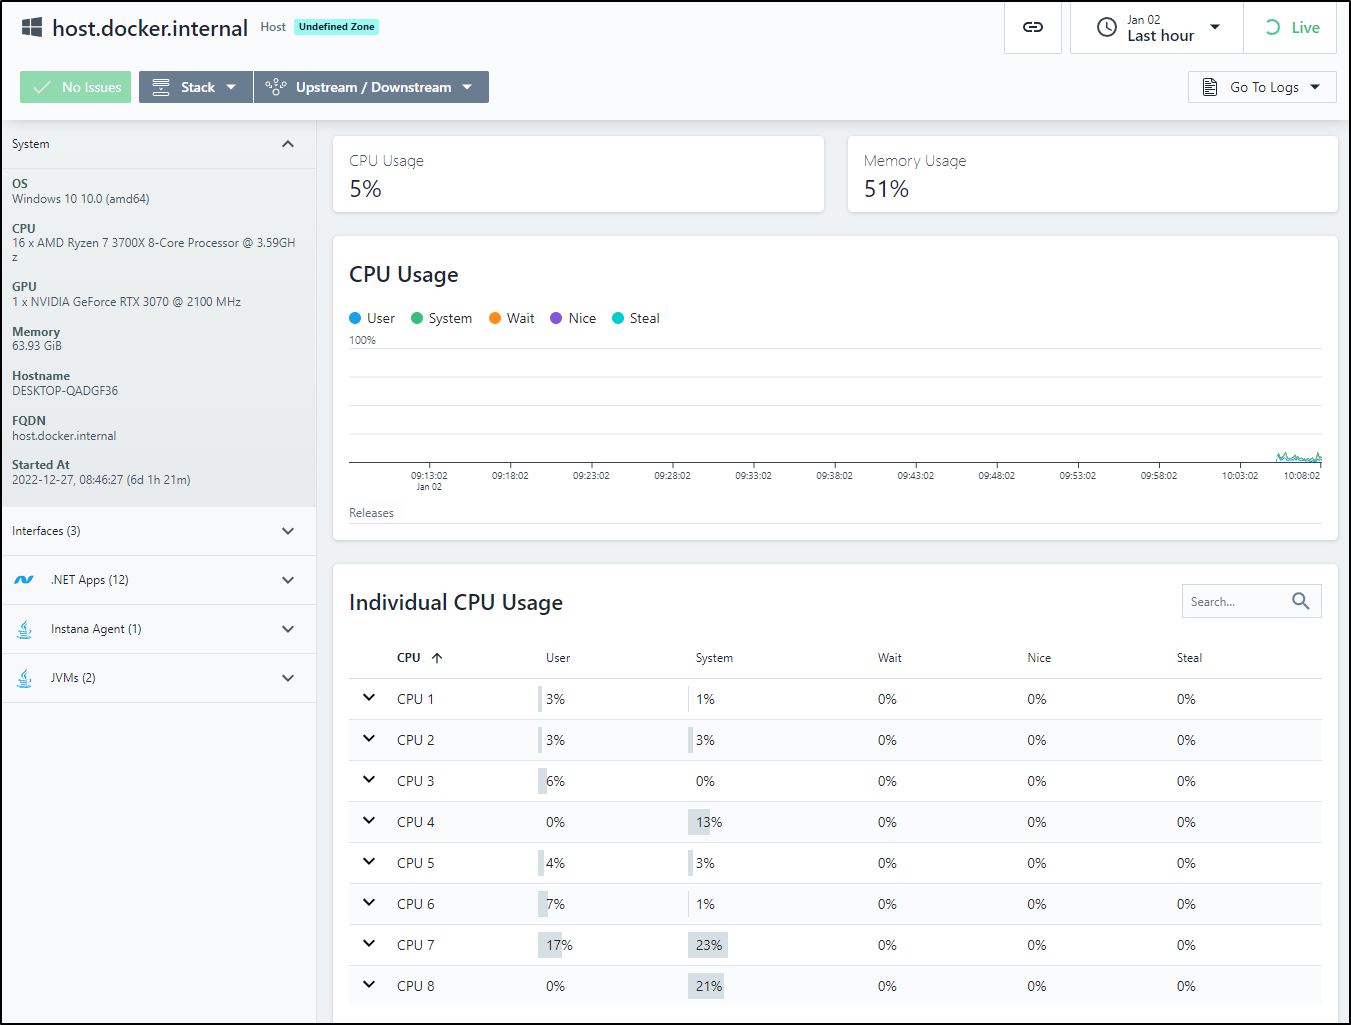
Now in Infrastructure, I can see the new host
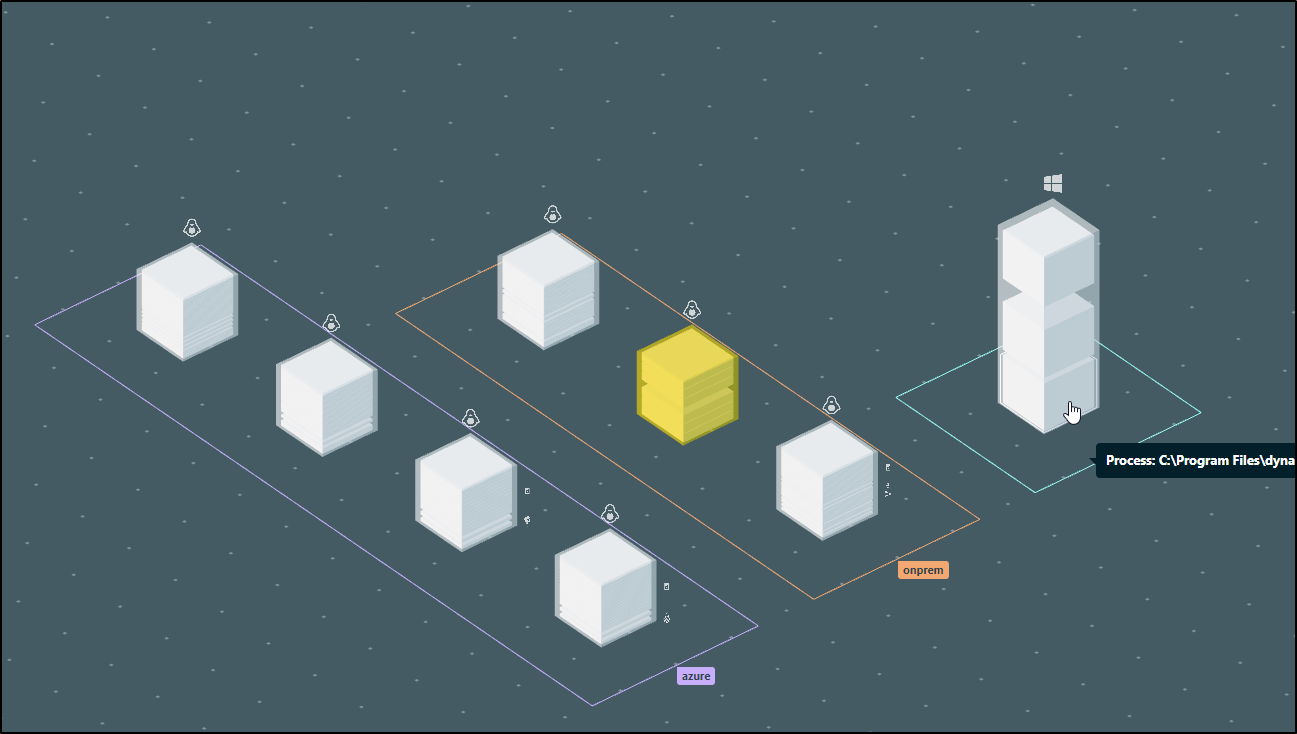
I noticed layers started to propagate as time progressed
I noted that if I went to the Agent process itself, I could download Logs remotely
Choose Instana Agent, then Download Logs
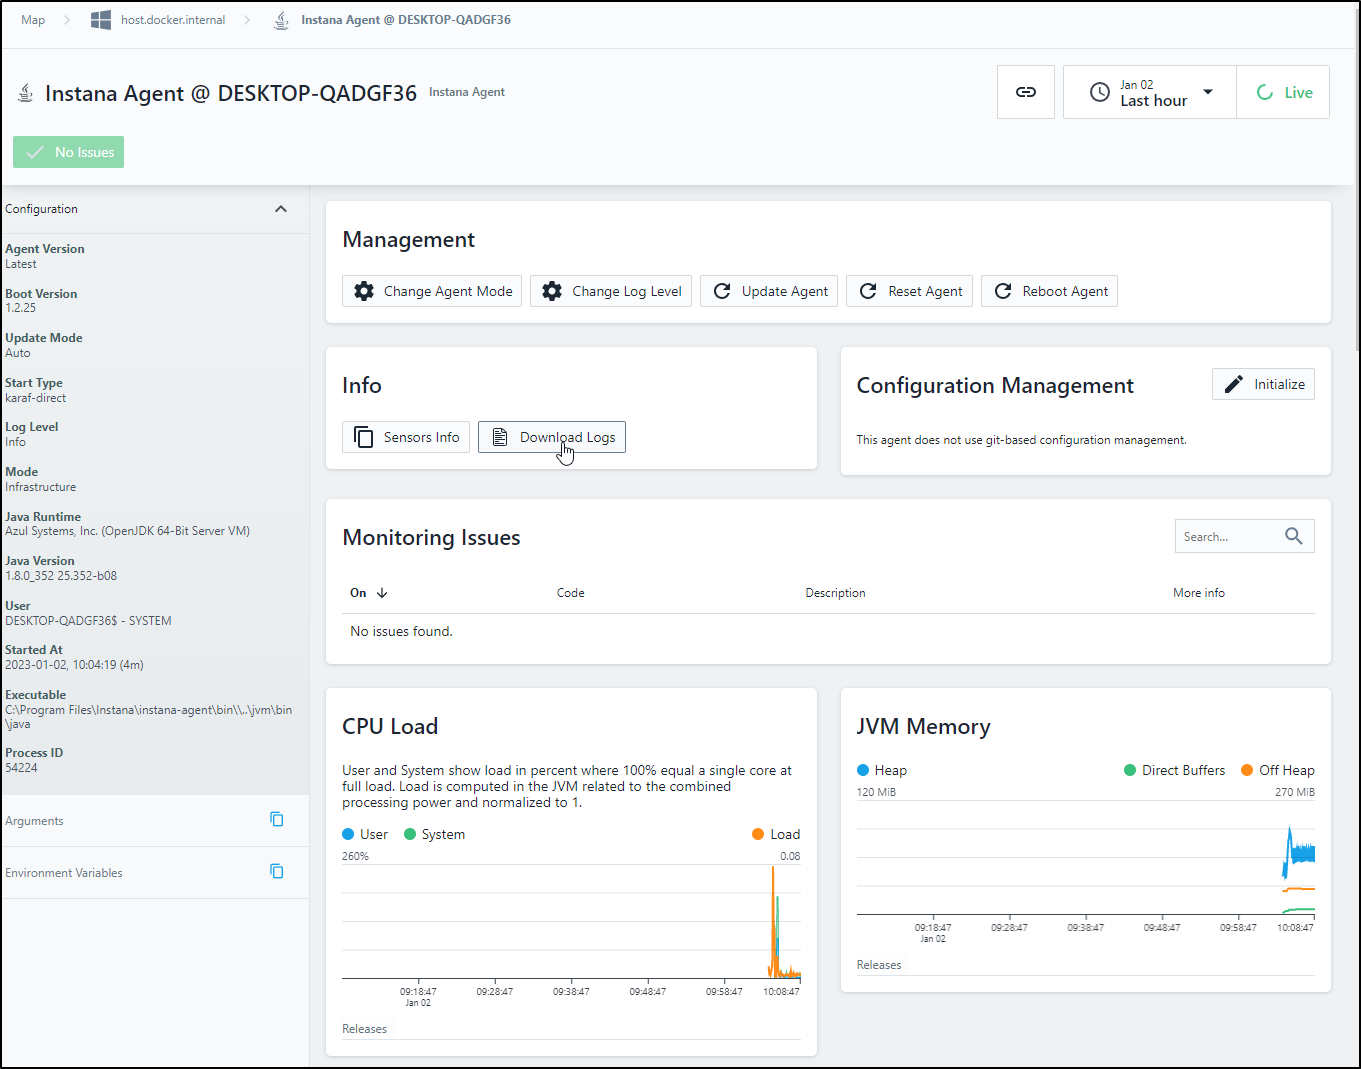
Then a Log you wish to view
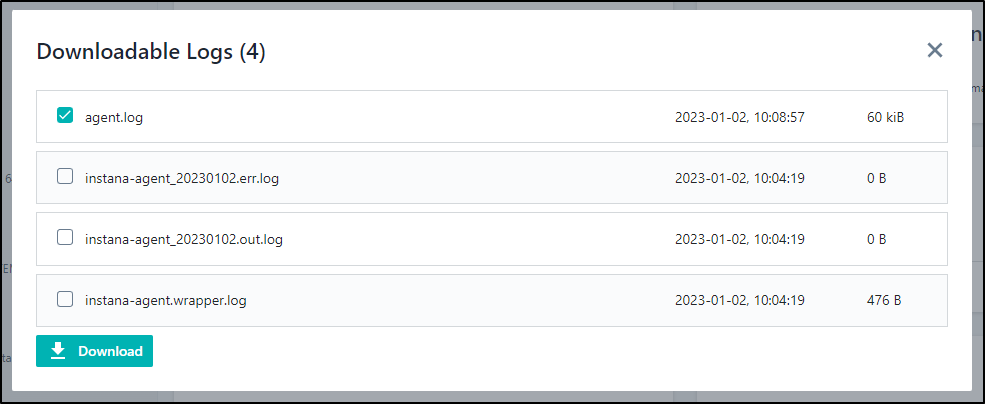
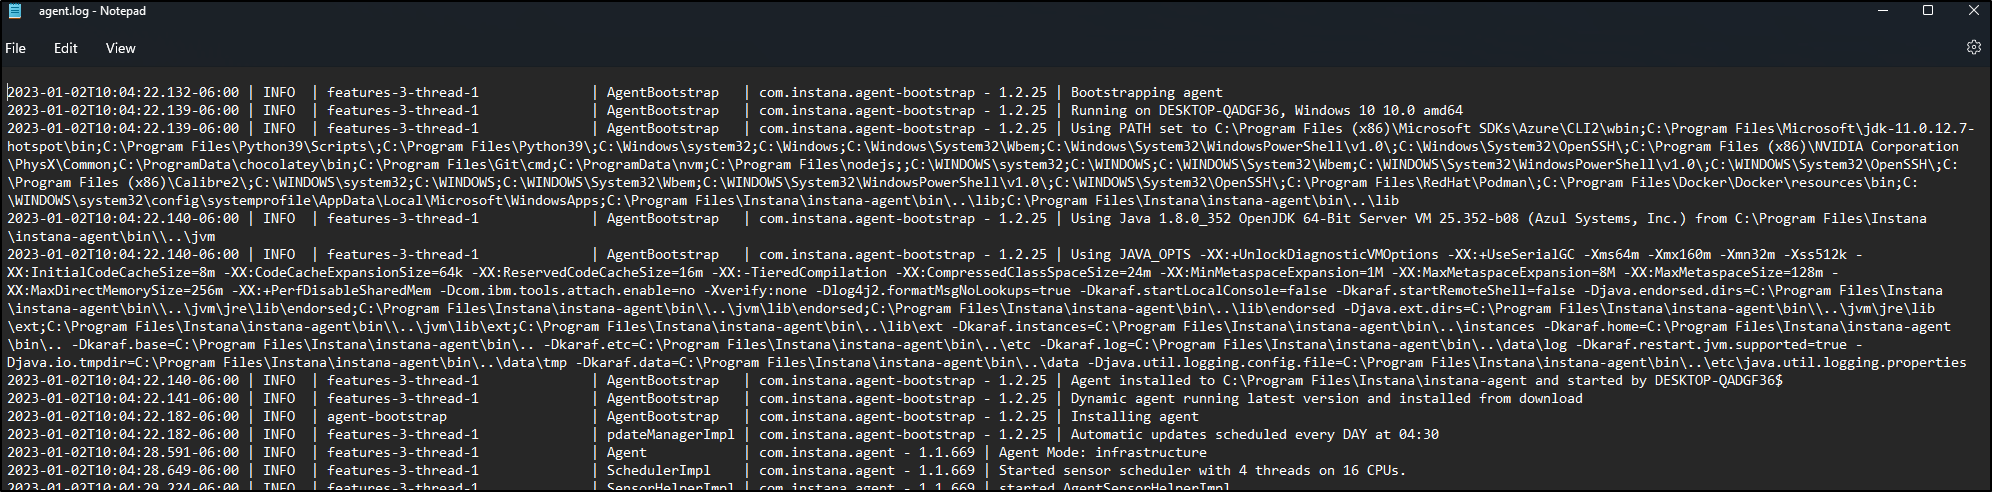
It downloads a zip of the log which you can then view
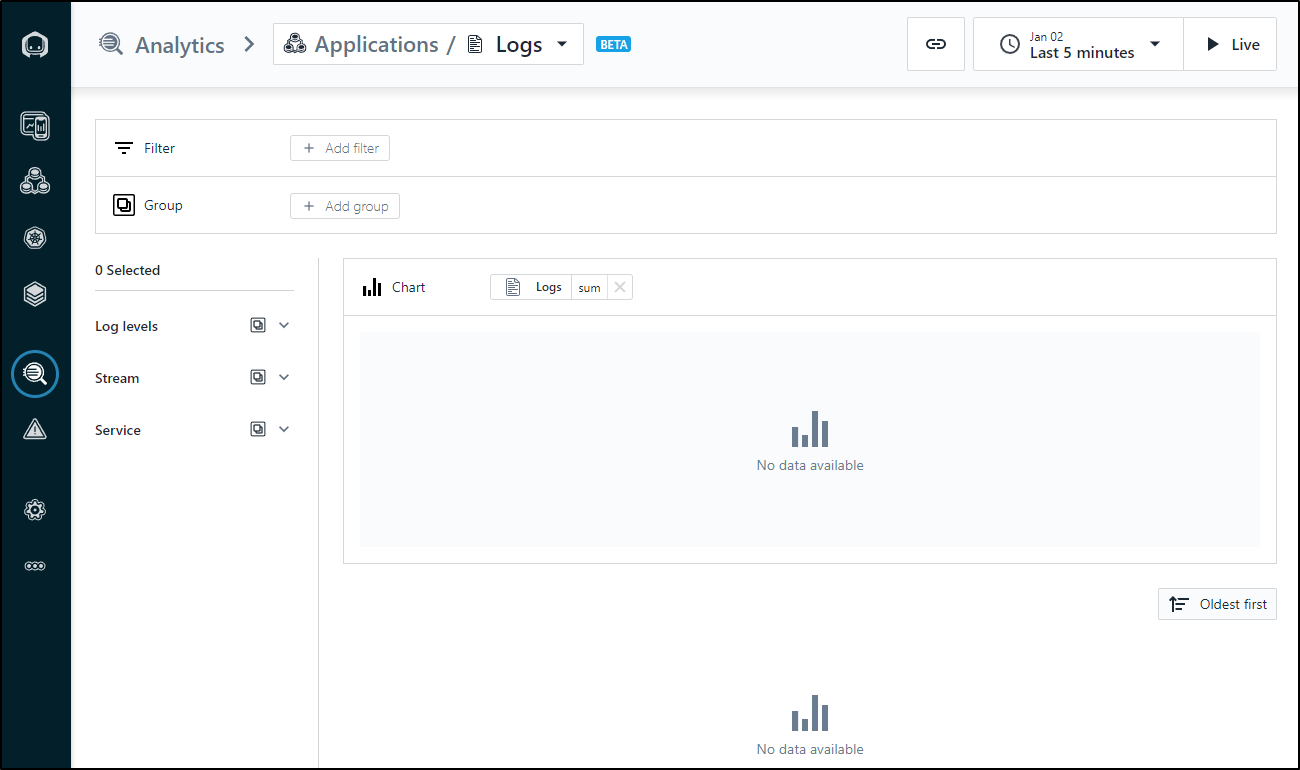
But still… No logs in the Logs area of Instana
Database
Adding to Postgres
I have a Database used for Harbor running on one of the nodes in the cluster directly
I decided to hop on that node and install the Instana Agent. It was my understanding it would automatically pick up any databases running on the host
$ curl -o setup_agent.sh https://setup.instana.io/agent && chmod 700 ./setup_agent.sh && sudo ./setup_agent.sh -a n8I0U7mlTIqAdoAiwd1Dmw -d n8I0U7mlTIqAdoAiwd1Dmw -t dynamic -e ingress-coral-saas.instana.io:443
  % Total    % Received % Xferd  Average Speed   Time    Time     Time  Current
                                 Dload  Upload   Total   Spent    Left  Speed
100 22267  100 22267    0     0  34956      0 --:--:-- --:--:-- --:--:-- 34901
Setting up the dynamic Instana agent for Linux
Are you sure? [y/N] y
Setting up Instana APT repository
Authentication for the packages.instana.io repository has been added to apt via the /etc/apt/auth.conf.d/instana-packages.conf file
Importing Instana GPG key
Warning: apt-key output should not be parsed (stdout is not a terminal)
Updating apt metadata
Installing Instana agent
isaac@isaac-MacBookAir:~$

isaac@isaac-MacBookAir:~$ sudo service instana-agent status
● instana-agent.service - "Instana(tm) agent."
     Loaded: loaded (/lib/systemd/system/instana-agent.service; disabled; vendor preset: enabled)
    Drop-In: /etc/systemd/system/instana-agent.service.d
             └─agent-custom-start.conf, custom-environment.conf
     Active: inactive (dead)
isaac@isaac-MacBookAir:~$ sudo service instana-agent start
isaac@isaac-MacBookAir:~$ sudo service instana-agent status
● instana-agent.service - "Instana(tm) agent."
     Loaded: loaded (/lib/systemd/system/instana-agent.service; disabled; vendor preset: enabled)
    Drop-In: /etc/systemd/system/instana-agent.service.d
             └─agent-custom-start.conf, custom-environment.conf
     Active: active (running) since Wed 2023-01-04 18:38:13 CST; 4s ago
   Main PID: 3686937 (java)
      Tasks: 18 (limit: 9337)
     Memory: 145.7M
     CGroup: /system.slice/instana-agent.service
             └─3686937 /opt/instana/agent/jvm/bin/java -XX:+UnlockDiagnosticVMOptions -Xmx186071K -XX:MaxDirectMemorySize=20674K -XX:+UseSerialGC -Xmn32m -Xss640>

Jan 04 18:38:13 isaac-MacBookAir systemd[1]: Started "Instana(tm) agent.".
Jan 04 18:38:13 isaac-MacBookAir karaf[3686937]: Agent running under SystemD v232+ ('INVOCATION_ID' environment variable found).
Jan 04 18:38:13 isaac-MacBookAir karaf[3686937]: The amount of memory available to the agent is 9223372036854771712 bytes (from: /sys/fs/cgroup/memory/system.sli>
Jan 04 18:38:13 isaac-MacBookAir karaf[3686937]: The amount of memory to be used by the agent seems too large (9007199254740989 KB, which is bigger or equal to t>
Jan 04 18:38:13 isaac-MacBookAir karaf[3686937]: If you want to make available more or less memory to the agent, set the 'MemoryMax' property accordingly in the >
Jan 04 18:38:13 isaac-MacBookAir karaf[3686937]: Checking Host machine for TLS 1.3 support
The first error I saw was that it couldnt connect to Postgres (it detected Postgres, but wasnt able to connect)
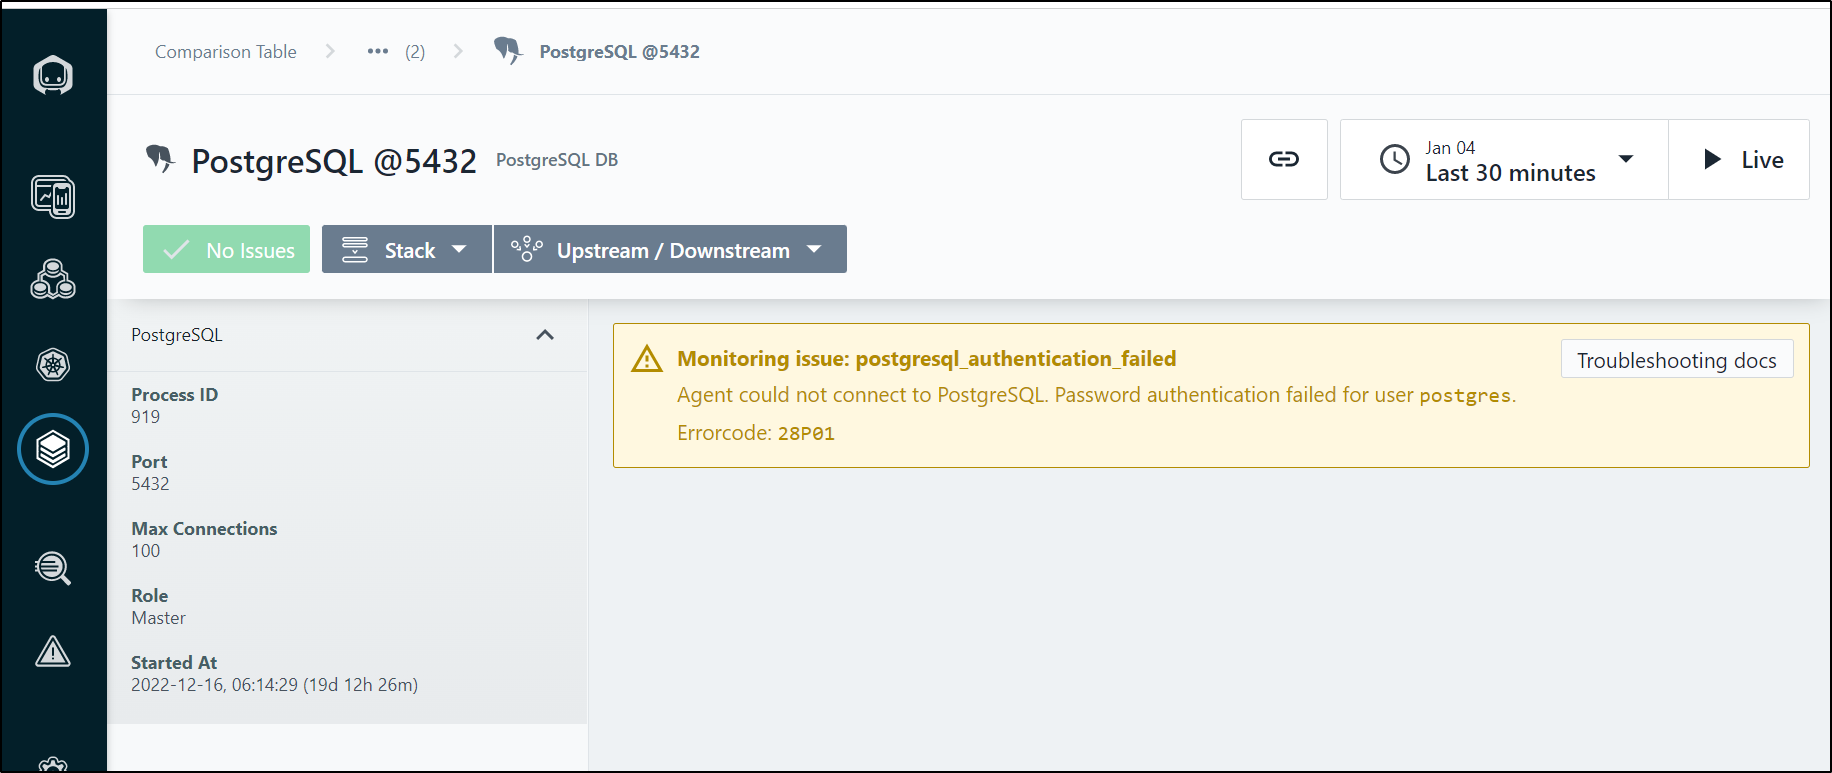
I looked at the docs and saw that I need to set a postgres user;
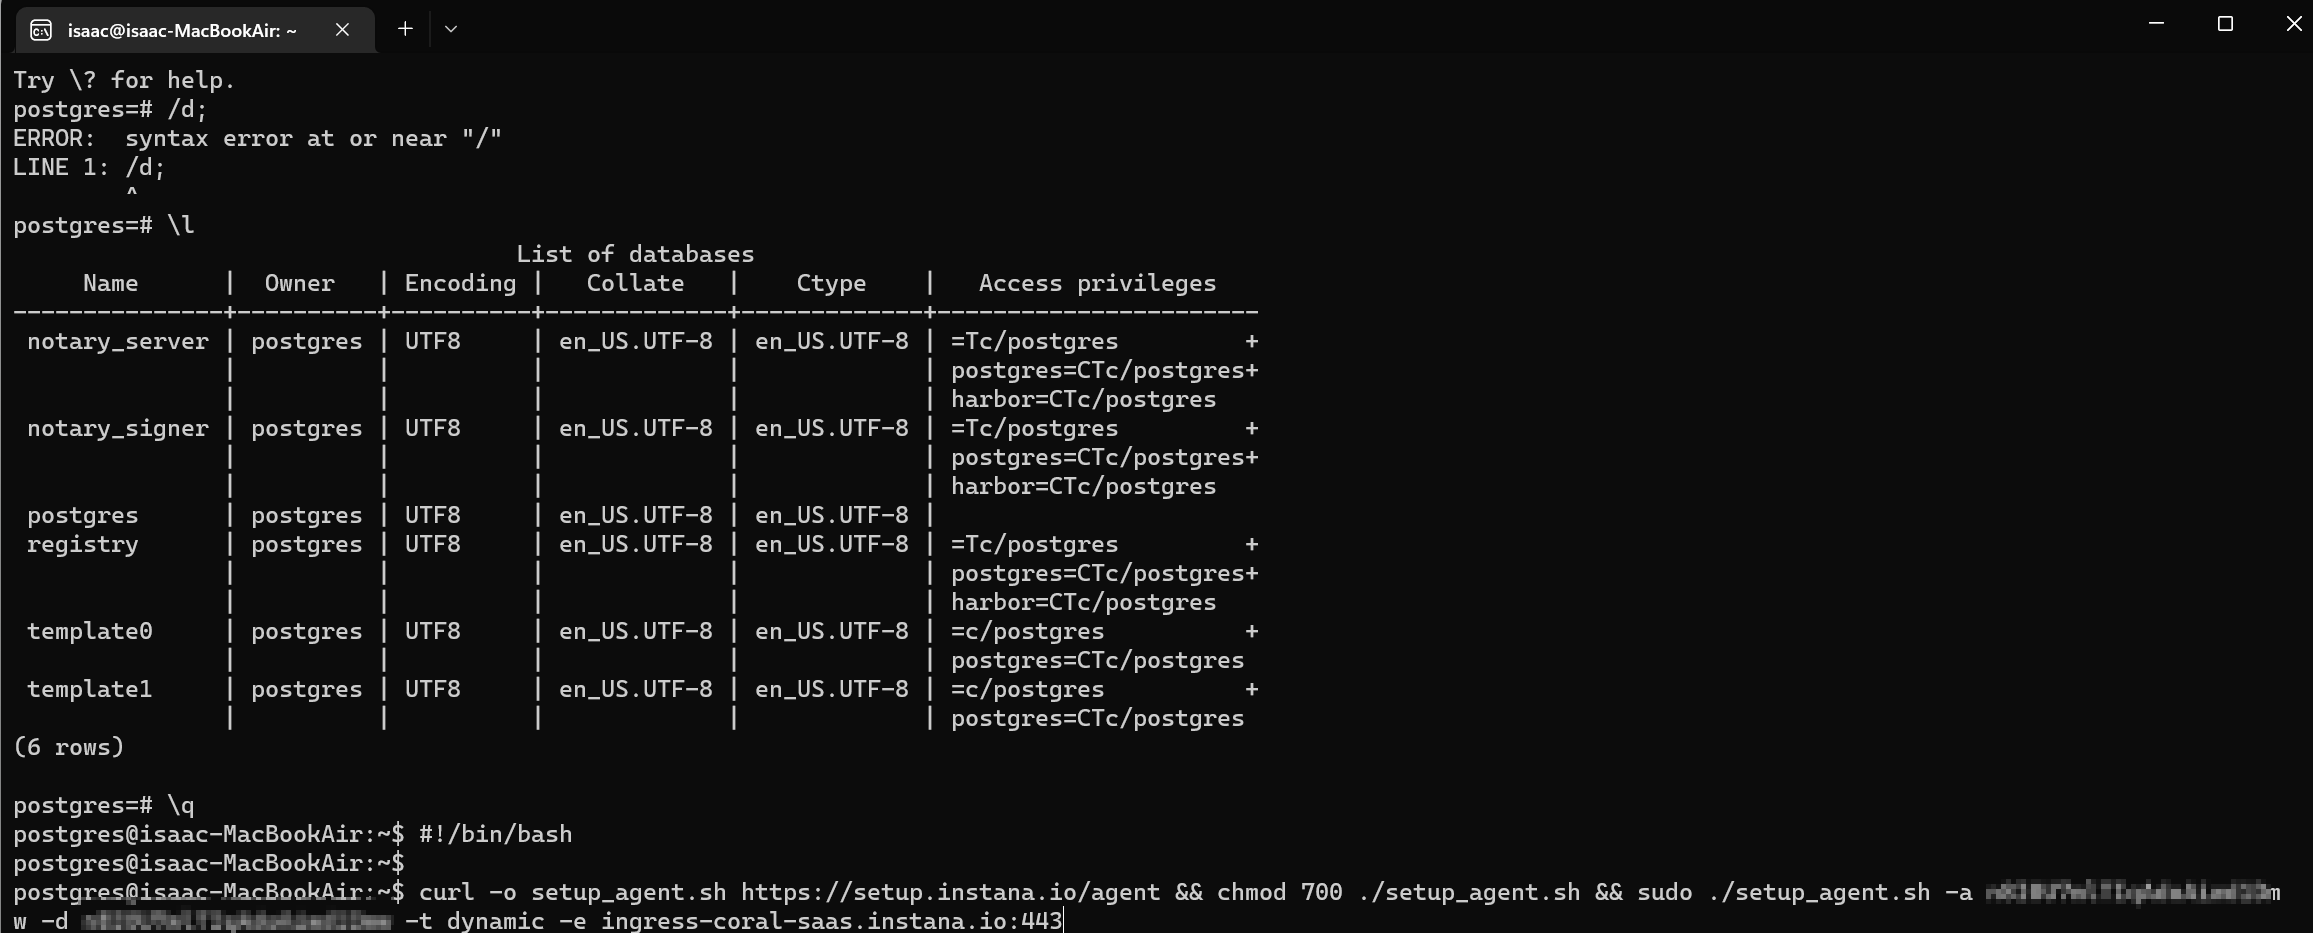
Here we can see the database used by Harbor to which the postgres user can connect
isaac@isaac-MacBookAir:/opt/instana/agent/etc/instana$ sudo su - postgres
postgres@isaac-MacBookAir:~$ psql
psql (12.12 (Ubuntu 12.12-0ubuntu0.20.04.1))
Type "help" for help.

postgres=# \l
                                    List of databases
     Name      |  Owner   | Encoding |   Collate   |    Ctype    |   Access privileges
---------------+----------+----------+-------------+-------------+-----------------------
 notary_server | postgres | UTF8     | en_US.UTF-8 | en_US.UTF-8 | =Tc/postgres         +
               |          |          |             |             | postgres=CTc/postgres+
               |          |          |             |             | harbor=CTc/postgres
 notary_signer | postgres | UTF8     | en_US.UTF-8 | en_US.UTF-8 | =Tc/postgres         +
               |          |          |             |             | postgres=CTc/postgres+
               |          |          |             |             | harbor=CTc/postgres
 postgres      | postgres | UTF8     | en_US.UTF-8 | en_US.UTF-8 |
 registry      | postgres | UTF8     | en_US.UTF-8 | en_US.UTF-8 | =Tc/postgres         +
               |          |          |             |             | postgres=CTc/postgres+
               |          |          |             |             | harbor=CTc/postgres
 template0     | postgres | UTF8     | en_US.UTF-8 | en_US.UTF-8 | =c/postgres          +
               |          |          |             |             | postgres=CTc/postgres
 template1     | postgres | UTF8     | en_US.UTF-8 | en_US.UTF-8 | =c/postgres          +
               |          |          |             |             | postgres=CTc/postgres
(6 rows)
I’ll create a new user and grant that user access to the database
postgres=# create user instana WITH PASSWORD 'instanapw';
CREATE ROLE
postgres=# grant select on pg_stat_database to instana;
GRANT
postgres=# grant all privileges on database postgres to instana;
GRANT
postgres=# \q
postgres@isaac-MacBookAir:~$ exit
logout
I then added the user I just created the Instana Agent configuration
isaac@isaac-MacBookAir:/opt/instana/agent/etc/instana$ cat configuration.yaml | head -n 820 | tail -n 10
#    NAME: # example 'DC_EAST'
#      type: '' # supported types : 'icmp', 'http'
#      target: '' # host address

# PostgreSQL
com.instana.plugin.postgresql:
  user: 'instana'
  password: 'instanapw'
  database: 'postgres' # by default PostgreSQL will use 'user' as database to connect to.
I then made sure to restart the Instana Agent
isaac@isaac-MacBookAir:/opt/instana/agent/etc/instana$ sudo service instana-agent restart
isaac@isaac-MacBookAir:/opt/instana/agent/etc/instana$ sudo service instana-agent status
● instana-agent.service - "Instana(tm) agent."
     Loaded: loaded (/lib/systemd/system/instana-agent.service; disabled; vendor preset: enabled)
    Drop-In: /etc/systemd/system/instana-agent.service.d
             └─agent-custom-start.conf, custom-environment.conf
     Active: active (running) since Thu 2023-01-05 19:05:14 CST; 7s ago
   Main PID: 4029612 (java)
      Tasks: 23 (limit: 9337)
     Memory: 153.3M
     CGroup: /system.slice/instana-agent.service
             └─4029612 /opt/instana/agent/jvm/bin/java -XX:+UnlockDiagnosticVMOptions -Xmx186071K -XX:MaxDirectMemorySize=20674K -XX:+UseSerialGC -Xmn32m -Xss640>

Jan 05 19:05:14 isaac-MacBookAir systemd[1]: Started "Instana(tm) agent.".
Jan 05 19:05:14 isaac-MacBookAir karaf[4029612]: Agent running under SystemD v232+ ('INVOCATION_ID' environment variable found).
Jan 05 19:05:14 isaac-MacBookAir karaf[4029612]: The amount of memory available to the agent is 9223372036854771712 bytes (from: /sys/fs/cgroup/memory/system.sli>
Jan 05 19:05:14 isaac-MacBookAir karaf[4029612]: The amount of memory to be used by the agent seems too large (9007199254740989 KB, which is bigger or equal to t>
Jan 05 19:05:14 isaac-MacBookAir karaf[4029612]: If you want to make available more or less memory to the agent, set the 'MemoryMax' property accordingly in the >
Jan 05 19:05:14 isaac-MacBookAir karaf[4029612]: Checking Host machine for TLS 1.3 support
The first error was solved by setting shared_preload_libraries and restarting postgresql
isaac@isaac-MacBookAir:/etc/postgresql/12/main$ sudo vi postgresql.conf
[sudo] password for isaac:
isaac@isaac-MacBookAir:/etc/postgresql/12/main$ cat postgresql.conf | grep pg_stat_statements
shared_preload_libraries = 'pg_stat_statements' # (change requires restart)
isaac@isaac-MacBookAir:/etc/postgresql/12/main$ sudo service postgresql restart
I ensured my config was set right (/etc/postgresql/12/main/postgresql.conf)
#------------------------------------------------------------------------------
# STATISTICS
#------------------------------------------------------------------------------

# - Query and Index Statistics Collector -

track_activities = on
track_counts = on
track_io_timing = off
#track_functions = none                 # none, pl, all
#track_activity_query_size = 1024       # (change requires restart)
stats_temp_directory = '/var/run/postgresql/12-main.pg_stat_tmp'
And restarted both the DB and the One Agent multiple times.
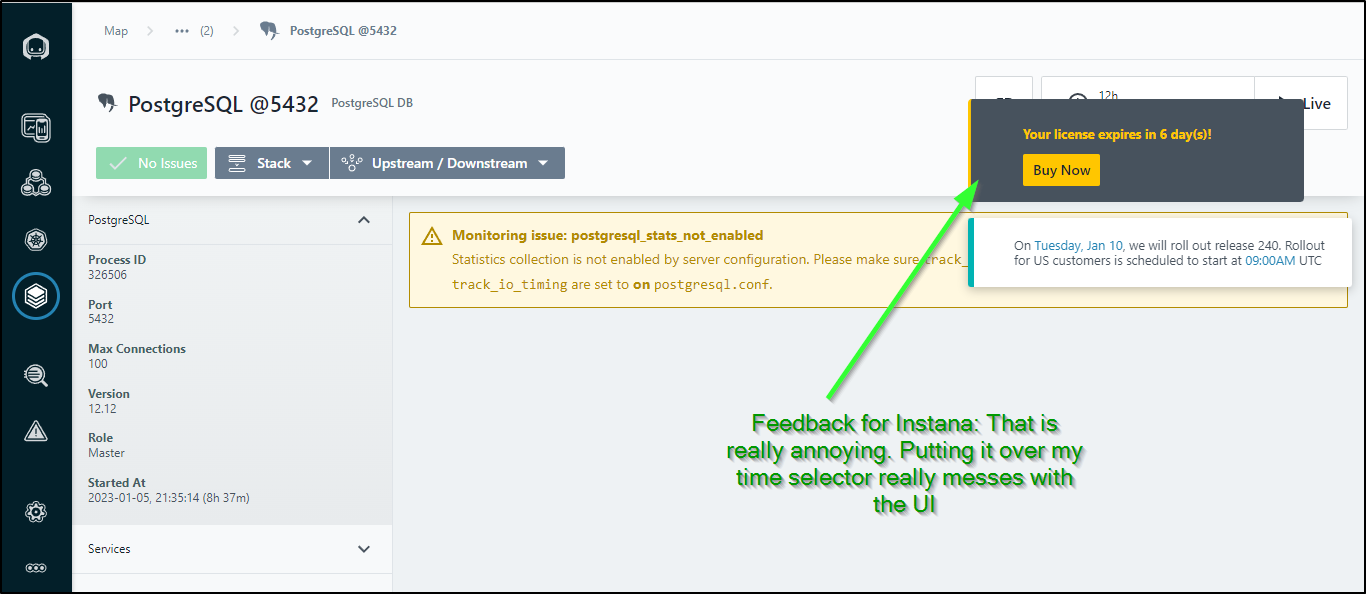
But I still get the error
I had one more idea. Perhaps I need to add Instana on each DB. That was listed in the docs. I also, for good measure, told Postgres to reload the conf.
isaac@isaac-MacBookAir:~$ sudo su - postgres
postgres@isaac-MacBookAir:~$ psql
psql (12.12 (Ubuntu 12.12-0ubuntu0.20.04.1))
Type "help" for help.

postgres=# \l
                                    List of databases
     Name      |  Owner   | Encoding |   Collate   |    Ctype    |   Access privileges
---------------+----------+----------+-------------+-------------+-----------------------
 notary_server | postgres | UTF8     | en_US.UTF-8 | en_US.UTF-8 | =Tc/postgres         +
               |          |          |             |             | postgres=CTc/postgres+
               |          |          |             |             | harbor=CTc/postgres
 notary_signer | postgres | UTF8     | en_US.UTF-8 | en_US.UTF-8 | =Tc/postgres         +
               |          |          |             |             | postgres=CTc/postgres+
               |          |          |             |             | harbor=CTc/postgres
 postgres      | postgres | UTF8     | en_US.UTF-8 | en_US.UTF-8 | =Tc/postgres         +
               |          |          |             |             | postgres=CTc/postgres+
               |          |          |             |             | instana=CTc/postgres
 registry      | postgres | UTF8     | en_US.UTF-8 | en_US.UTF-8 | =Tc/postgres         +
               |          |          |             |             | postgres=CTc/postgres+
               |          |          |             |             | harbor=CTc/postgres
 template0     | postgres | UTF8     | en_US.UTF-8 | en_US.UTF-8 | =c/postgres          +
               |          |          |             |             | postgres=CTc/postgres
 template1     | postgres | UTF8     | en_US.UTF-8 | en_US.UTF-8 | =c/postgres          +
               |          |          |             |             | postgres=CTc/postgres
(6 rows)

postgres=# GRANT CONNECT ON DATABASE template0 TO instana;
GRANT                                  ^
postgres=# GRANT CONNECT ON DATABASE template1 TO instana;
GRANT
postgres=# GRANT CONNECT ON DATABASE registry TO instana;
GRANT
postgres=# GRANT CONNECT ON DATABASE postgres TO instana;
GRANT
postgres=# GRANT CONNECT ON DATABASE notary_signer TO instana;
GRANT
postgres=# GRANT CONNECT ON DATABASE notary_server TO instana;
GRANT
postgres=# SELECT pg_reload_conf();
 pg_reload_conf
----------------
 t
(1 row)

postgres=# \q
postgres@isaac-MacBookAir:~$
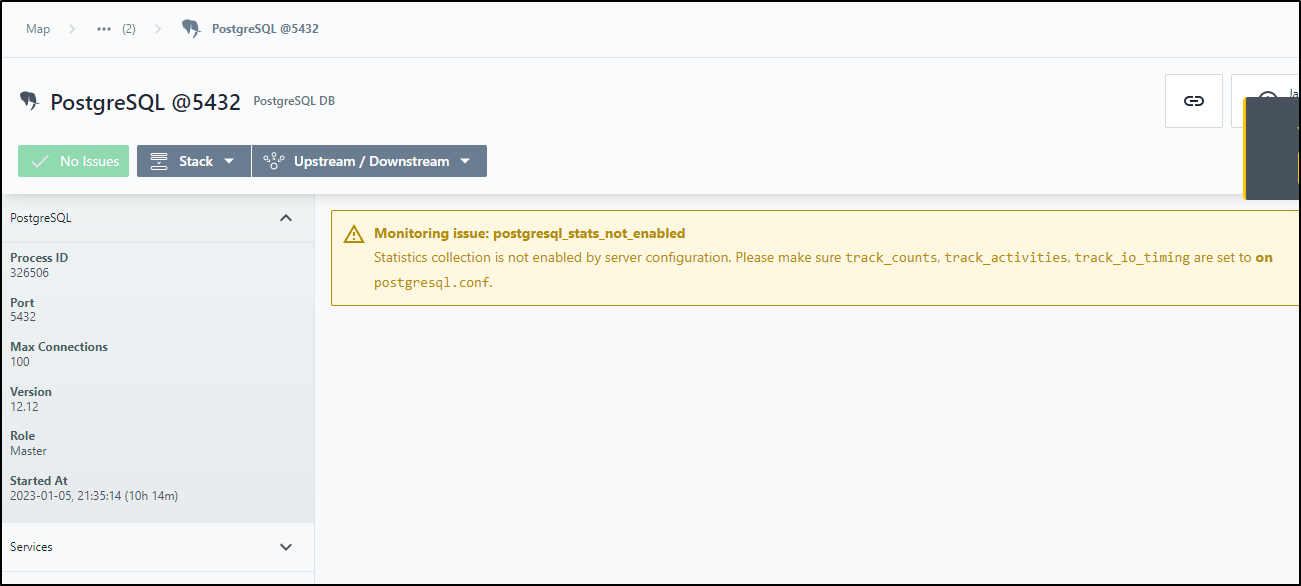
In the next section, I’ll speak to the new “Analyze Infrastructure” area, but in there I found the new Postgres Instances
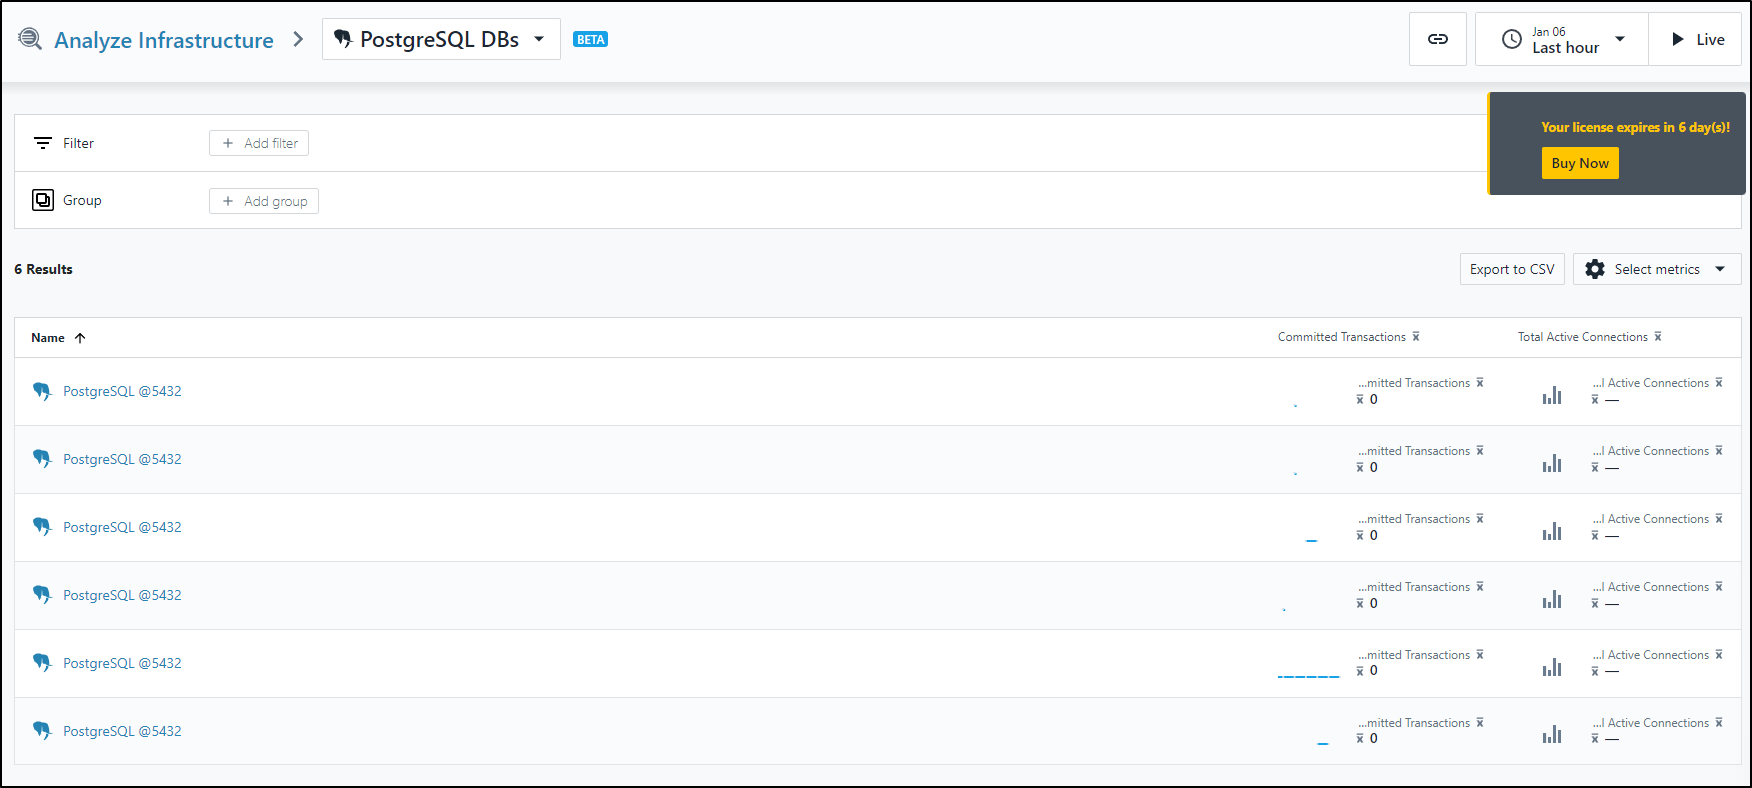
However, each was a unique ‘process’ matched to the same DB, thus checking each one, i found the latest process which showed the same Postgres error
GCP Cloud SQL
Let’ try another path. I’ll create a quick Cloud SQL instance.
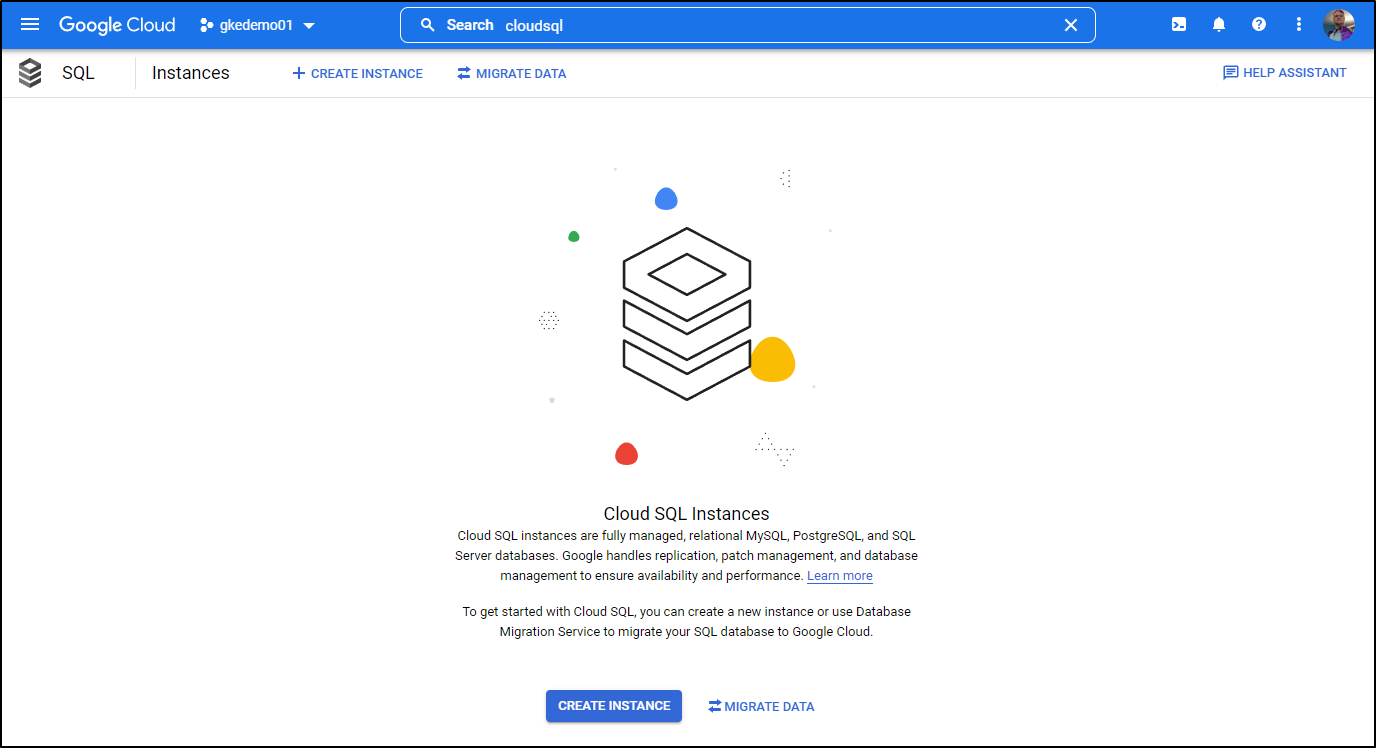
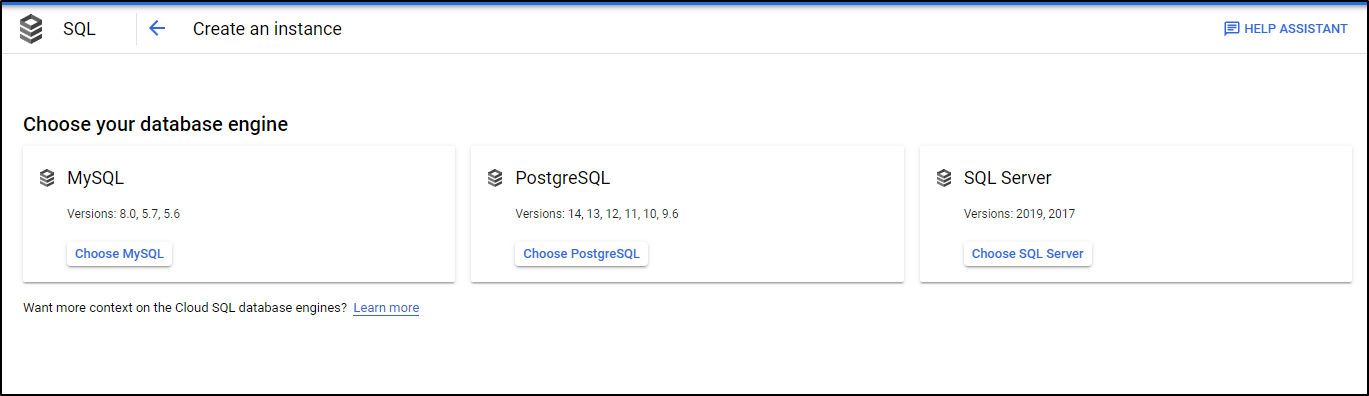
In GCP Cloud Console, create a new Instance and choose PostgreSQL
For this demo, I’ll use a simple password
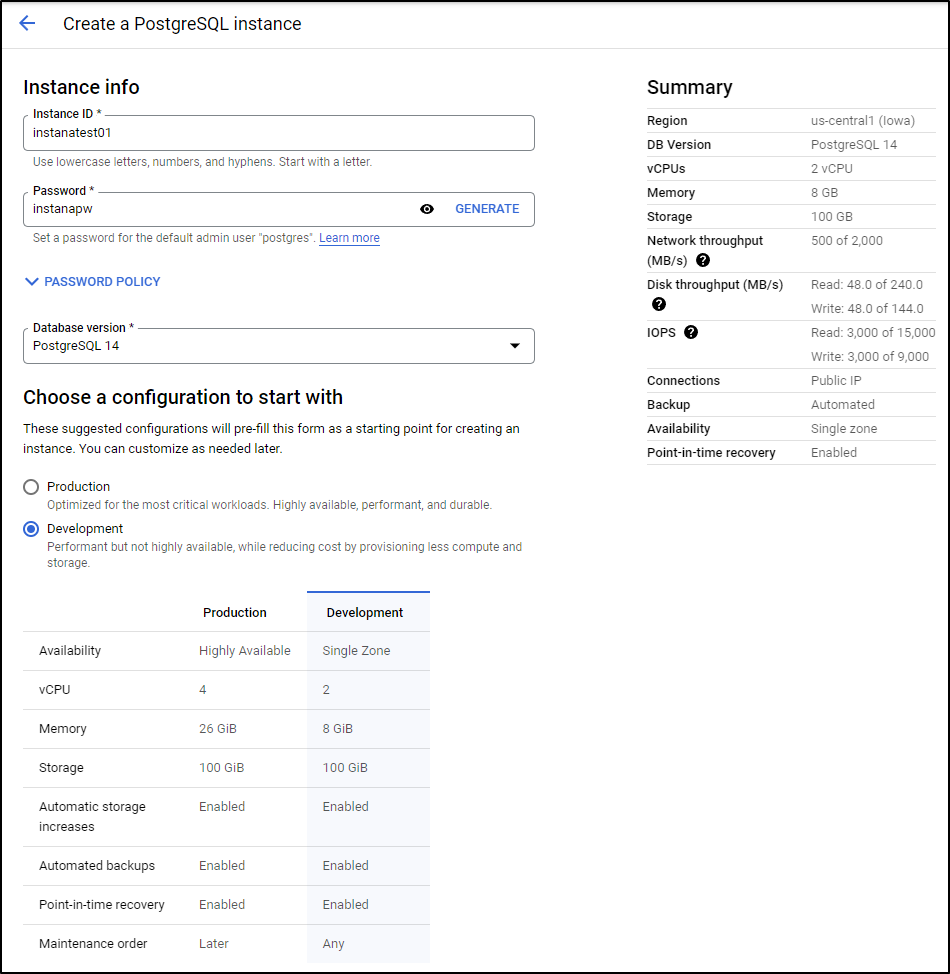
Before we create, there are some flags that are by default set to on, but at least one we need to change
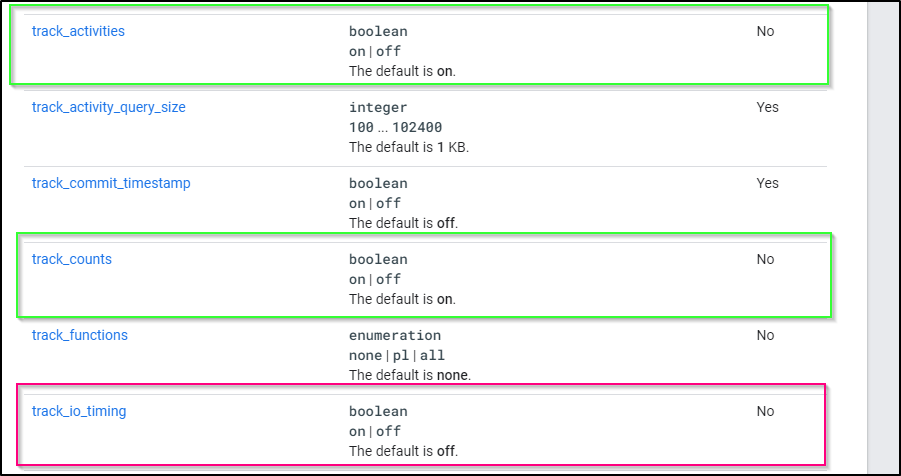
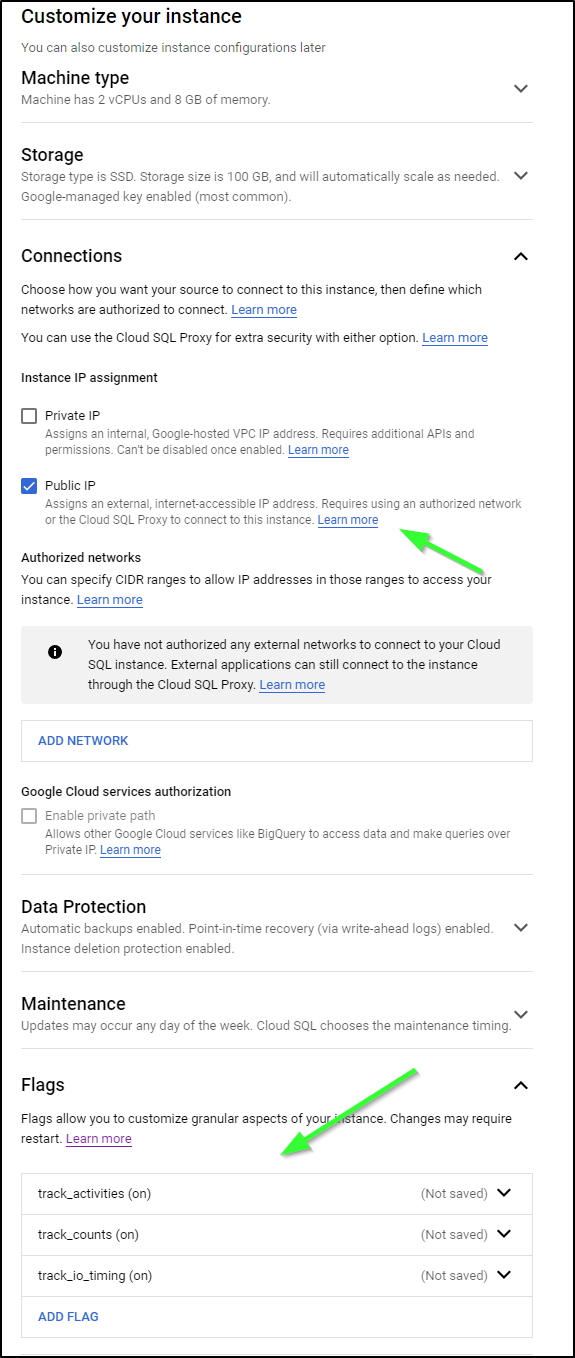
I’ll set a Public IP and those flags in the “Customize your instance” section:
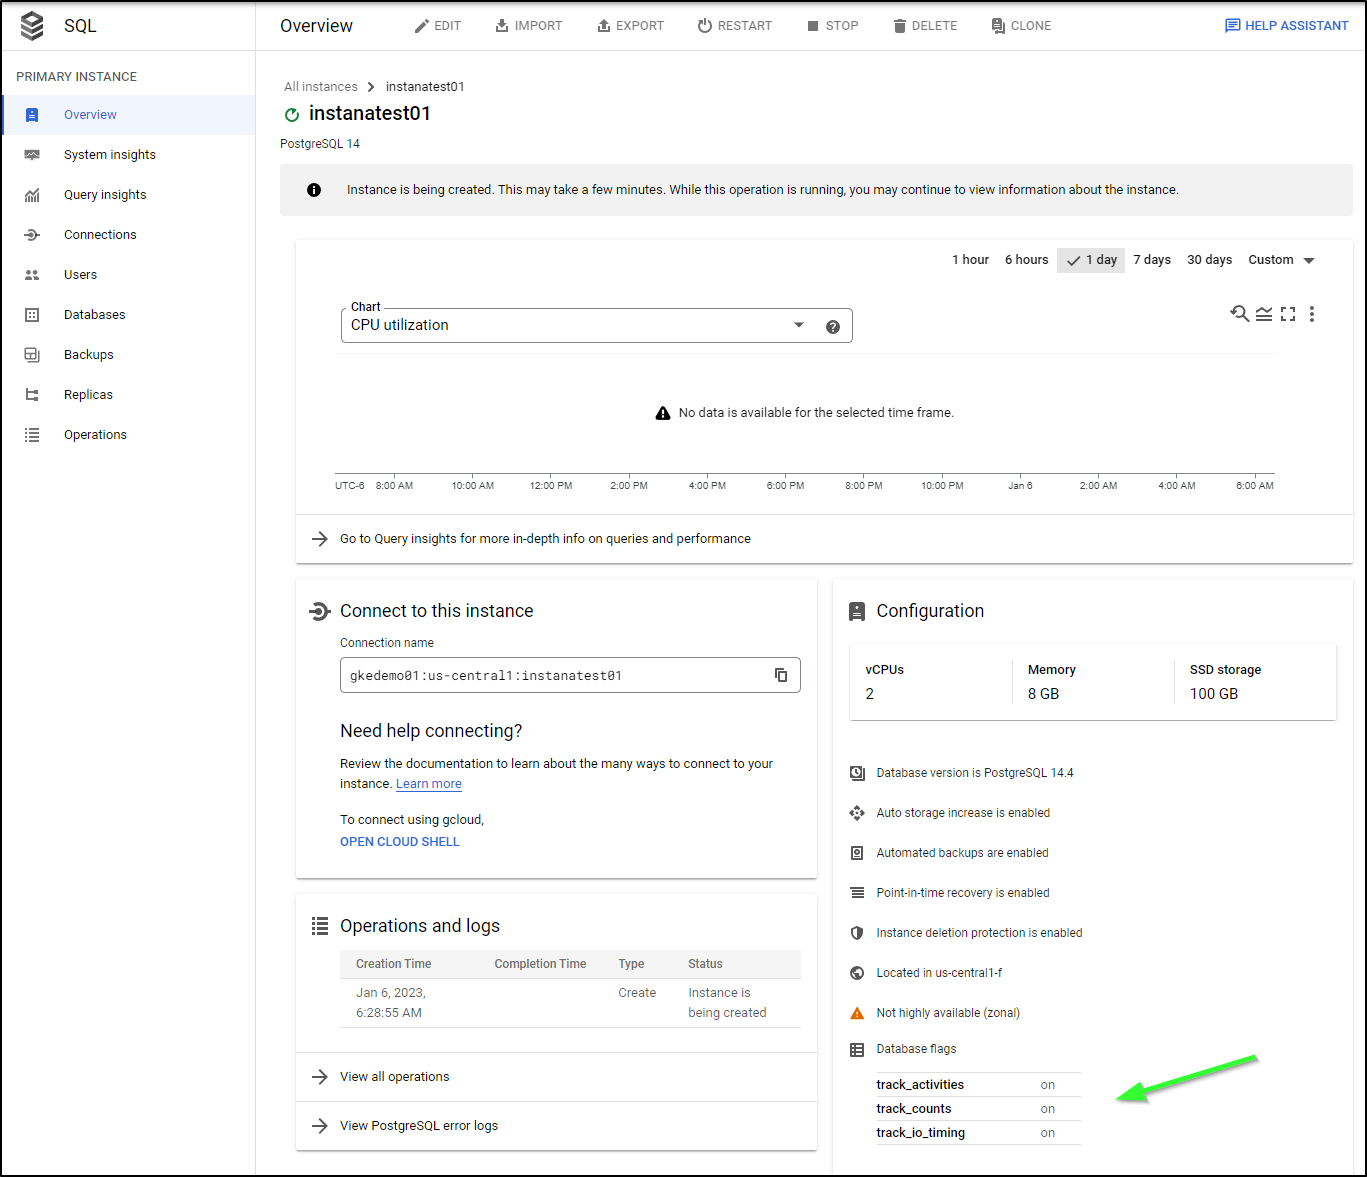
I’ll then create the instance. We can see the flags are showing on the Overview page
I cannot specify a host to use in the Instana PostgreSQL configuration. If I could, then we’d be set
# PostgreSQL
com.instana.plugin.postgresql:
  user: 'instana'
  password: 'instanapw'
  database: 'postgres' # by default PostgreSQL will use 'user' as database to connect to.
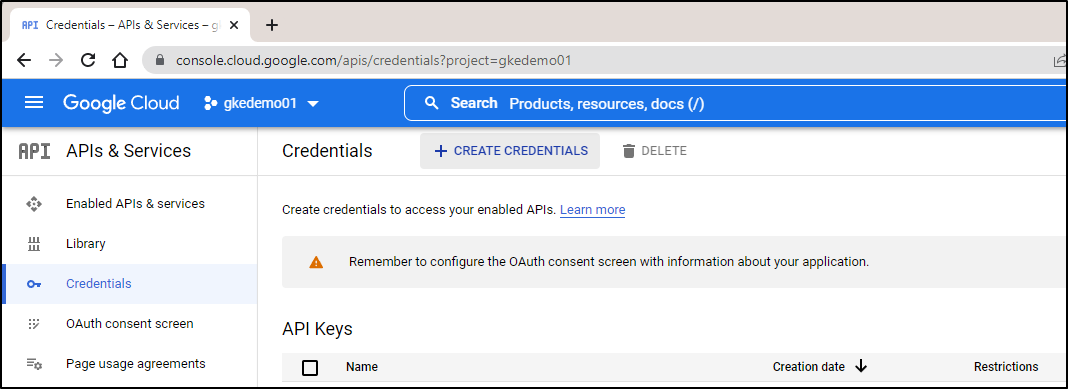
However, we can handle this with the native GCP monitoring. Following this guide, I’ll create a service user
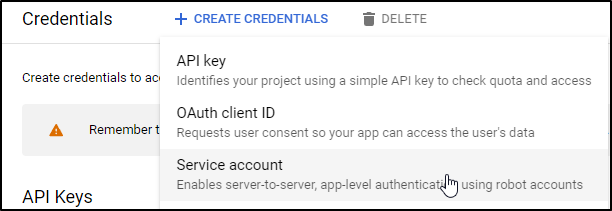
I’ll go to APIs and Services to “+ Create Credentials”
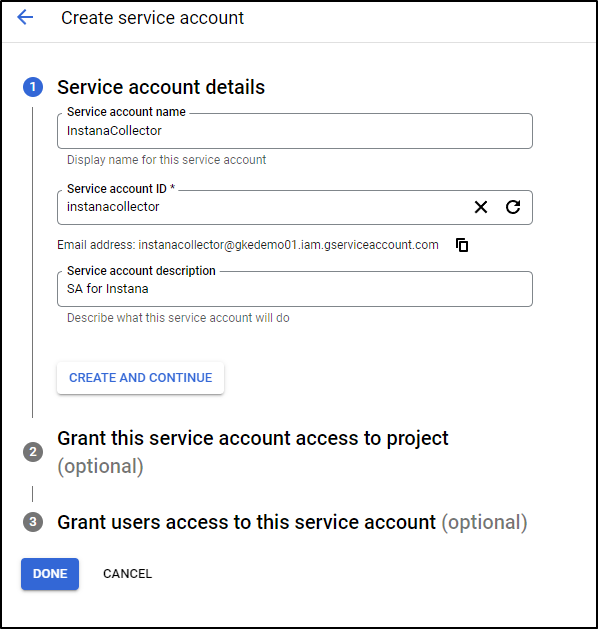
Choose Service Account
I’ll give it a name
Most of the roles are easy, but there is no “Storage Viewer” so I had to use “Storage Admin” to satisfy storage.buckets.list (see IAM Roles for Storage)
Our goal is to satisfy:
- monitoring.timeSeries.list
- pubsub.subscriptions.list
- pubsub.topics.list
- resourcemanager.projects.get
- cloudsql.instances.list
- storage.buckets.list
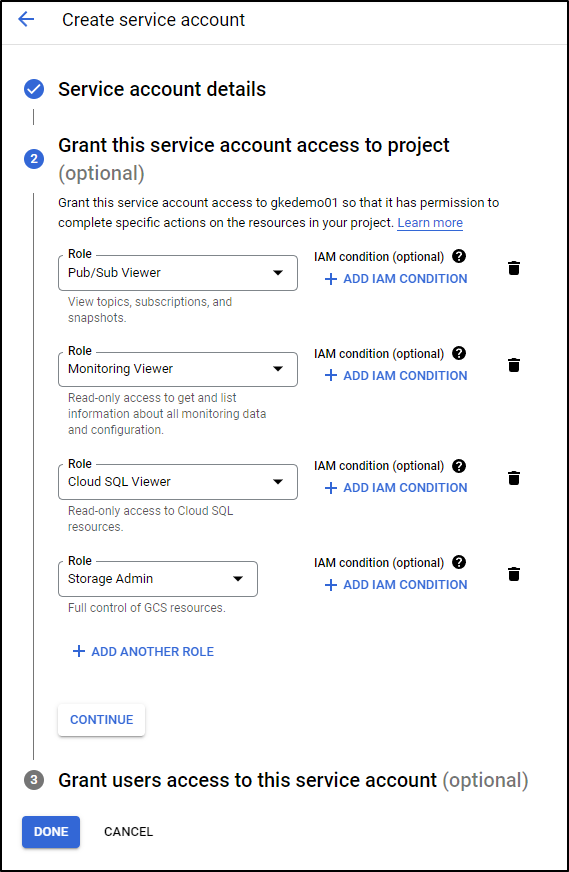
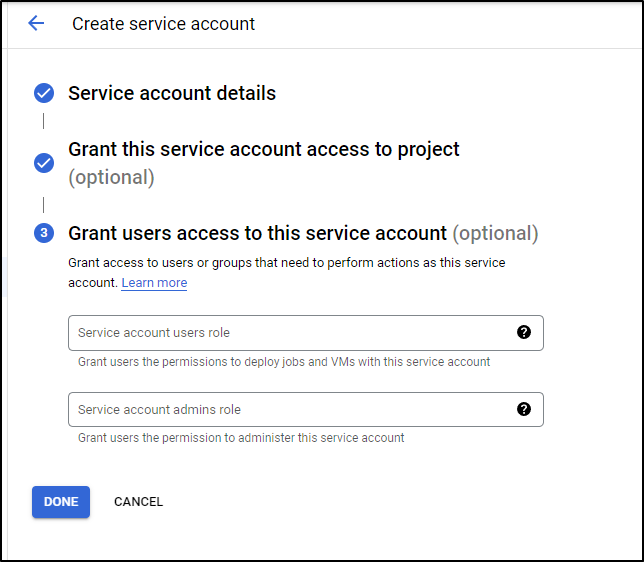
I’ll then create it by clicking “Done”
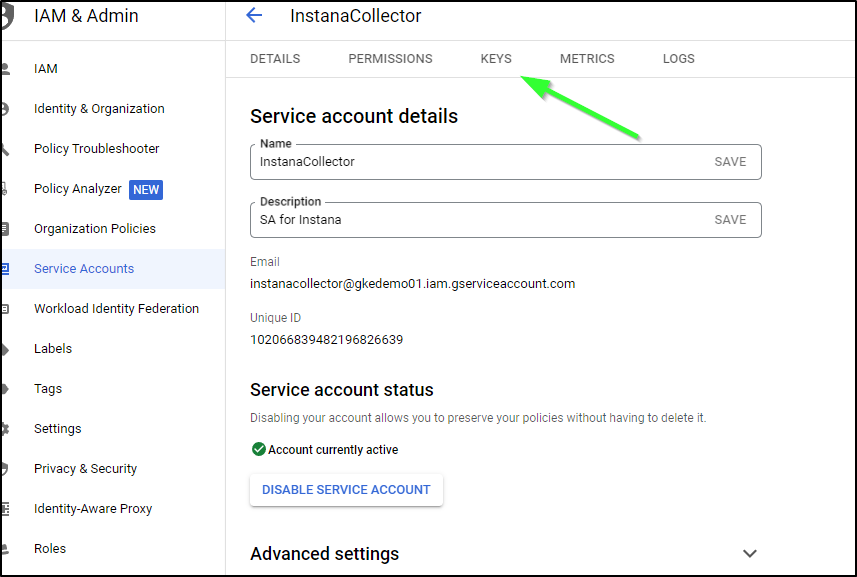
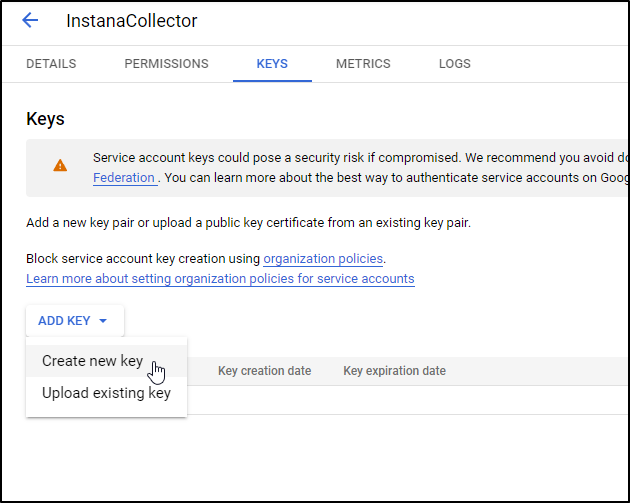
We can now go to the SA and click on Keys
and Create a New Key
of type JSON
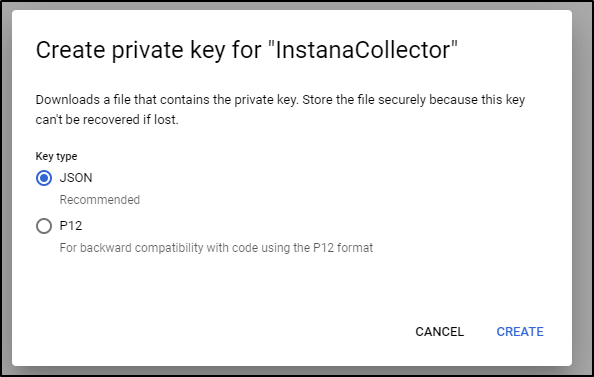
That will download locally. I’ll copy the JSON to my clipboard and add it to a file on the Linux agent box
isaac@isaac-MacBookAir:~$ sudo mkdir -p /opt/instana/credentials/
isaac@isaac-MacBookAir:~$ sudo vi /opt/instana/credentials/cred-gcp.json

isaac@isaac-MacBookAir:~$ sudo cat /opt/instana/credentials/cred-gcp.json | grep iam
  "client_email": "instanacollector@gkedemo01.iam.gserviceaccount.com",
  "client_x509_cert_url": "https://www.googleapis.com/robot/v1/metadata/x509/instanacollector%40gkedemo01.iam.gserviceaccount.com"
I’m not just going to handle CloudSQL. I’ll enable all the GCP monitors in the configuration
$ sudo vi /opt/instana/agent/etc/instana/configuration.yaml
The section:
# Elasticsearch
#com.instana.plugin.elasticsearch:
#  enabled: true
#  indicesRegex: '.*'

# Google Cloud Platform - GCP
com.instana.plugin.gcp:
  poll_rate: 60 # How often Google's monitoring API will be polled in seconds
  credentials_path: '/opt/instana/credentials/cred-gcp.json' # Path to Service Account credentials
  exclude_tags: ''
  include_tags: ''

# Google Cloud Datastore
com.instana.plugin.gcp.datastore:
  enabled: true
  poll_rate: 60 # How often Google's monitoring API will be polled in seconds
  credentials_path: '/opt/instana/credentials/cred-gcp.json' # Path to Service Account credentials

# Google Cloud Pub/Sub
# Values for include_tags/exclude_tags are comma separated list of tags in key:value format (example: env:dev,env:test)
com.instana.plugin.gcp.pubsub:
  enabled: true
  poll_rate: 60 # How often Google's monitoring API will be polled in seconds
  credentials_path: '/opt/instana/credentials/cred-gcp.json' # Path to Service Account credentials
  include_tags:
    topic: ''
    subscription: ''
  exclude_tags:
    topic: ''
    subscription: ''

# Google Cloud Run
# Values for include_tags/exclude_tags are comma separated list of tags in key:value format (example: env:dev,env:test)
com.instana.plugin.gcp.run:
  enabled: true
  poll_rate: 60 # How often Google's monitoring API will be polled in seconds
  credentials_path: '/opt/instana/credentials/cred-gcp.json' # Path to Service Account credentials
  include_tags: ''
  exclude_tags: ''

# Google Cloud SQL
com.instana.plugin.gcp.sql:
  enabled: true
  poll_rate: 60 # How often Google's monitoring API will be polled in seconds
  credentials_path: '/opt/instana/credentials/cred-gcp.json' # Path to Service Account credentials

# Google Cloud Storage
# Values for include_tags/exclude_tags are comma separated list of tags in key:value format (example: env:dev,env:test)
com.instana.plugin.gcp.storage:
  enabled: true
  poll_rate: 60 # How often Google's monitoring API will be polled in seconds
  credentials_path: '/opt/instana/credentials/cred-gcp.json' # Path to Service Account credentials
  include_tags: ''
  exclude_tags: ''

# Apache Httpd
#com.instana.plugin.httpd:
#  user: ''
Then restart the Instana agent to take effect
isaac@isaac-MacBookAir:~$ sudo service instana-agent restart
isaac@isaac-MacBookAir:~$ sudo service instana-agent status
● instana-agent.service - "Instana(tm) agent."
     Loaded: loaded (/lib/systemd/system/instana-agent.service; disabled; vendor preset: enabled)
    Drop-In: /etc/systemd/system/instana-agent.service.d
             └─agent-custom-start.conf, custom-environment.conf
     Active: active (running) since Fri 2023-01-06 06:51:11 CST; 14s ago
   Main PID: 2139553 (java)
      Tasks: 27 (limit: 9337)
     Memory: 210.5M
     CGroup: /system.slice/instana-agent.service
             └─2139553 /opt/instana/agent/jvm/bin/java -XX:+UnlockDiagnosticVMOptions -Xmx186071K -XX:MaxDirectMemorySize=20674K -XX:+UseSerialGC -Xmn32m -Xss640k -XX:InitialCodeCache>

Jan 06 06:51:11 isaac-MacBookAir systemd[1]: Started "Instana(tm) agent.".
Jan 06 06:51:11 isaac-MacBookAir karaf[2139553]: Agent running under SystemD v232+ ('INVOCATION_ID' environment variable found).
Jan 06 06:51:11 isaac-MacBookAir karaf[2139553]: The amount of memory available to the agent is 9223372036854771712 bytes (from: /sys/fs/cgroup/memory/system.slice/instana-agent.servi>
Jan 06 06:51:11 isaac-MacBookAir karaf[2139553]: The amount of memory to be used by the agent seems too large (9007199254740989 KB, which is bigger or equal to the 8044776 KB total sy>
Jan 06 06:51:11 isaac-MacBookAir karaf[2139553]: If you want to make available more or less memory to the agent, set the 'MemoryMax' property accordingly in the 'instana-agent.service>
Jan 06 06:51:11 isaac-MacBookAir karaf[2139553]: Checking Host machine for TLS 1.3 support
We set it to be 60s (default) on poll_rate. So I would expect it might take a couple minutes for data to show up.
I then saw much more show up in Infrastructure

While I saw pub/sub and storage, I did not see “SQL” called out. I did however see “Cloud Datastore” and since I know I’m not using Firestore, I believe this is the Cloud SQL (just misnamed).
It’s hard to know since it does not list Database names or Cluster names
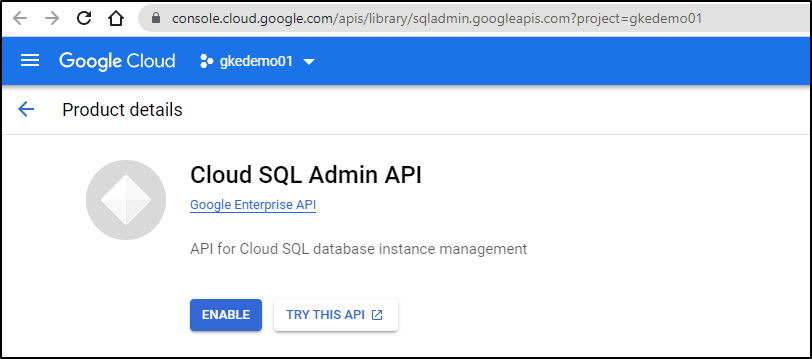
I want to test, so I enable the Cloud SQL Admin API
I can then open in Cloud Shell
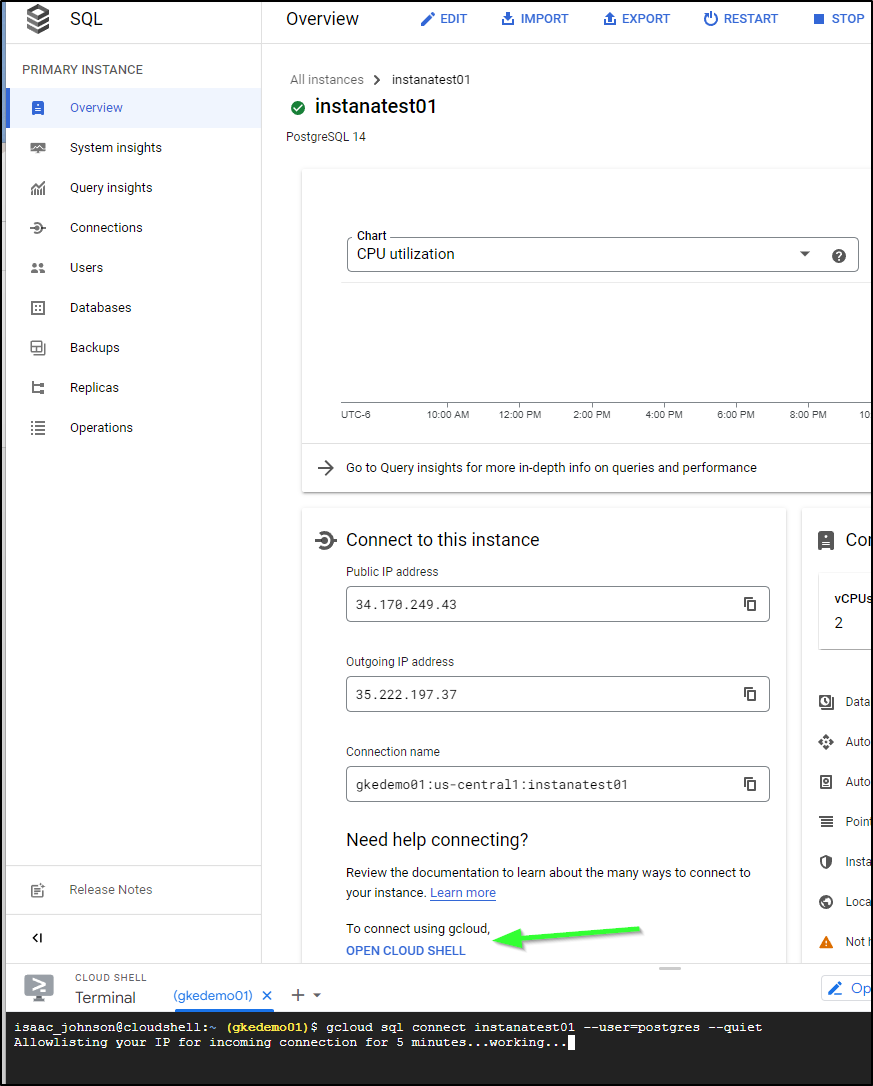
We can see the databases created
isaac_johnson@cloudshell:~ (gkedemo01)$ gcloud sql connect instanatest01 --user=postgres --quiet
Allowlisting your IP for incoming connection for 5 minutes...done.
Connecting to database with SQL user [postgres].Password:
psql (15.1 (Debian 15.1-1.pgdg110+1), server 14.4)
SSL connection (protocol: TLSv1.3, cipher: TLS_AES_256_GCM_SHA384, compression: off)
Type "help" for help.

postgres=> \l
                                                                List of databases
     Name      |       Owner       | Encoding |  Collate   |   Ctype    | ICU Locale | Locale Provider |            Access privileges
---------------+-------------------+----------+------------+------------+------------+-----------------+-----------------------------------------
 cloudsqladmin | cloudsqladmin     | UTF8     | en_US.UTF8 | en_US.UTF8 |            | libc            |
 postgres      | cloudsqlsuperuser | UTF8     | en_US.UTF8 | en_US.UTF8 |            | libc            |
 template0     | cloudsqladmin     | UTF8     | en_US.UTF8 | en_US.UTF8 |            | libc            | =c/cloudsqladmin                       +
               |                   |          |            |            |            |                 | cloudsqladmin=CTc/cloudsqladmin
 template1     | cloudsqlsuperuser | UTF8     | en_US.UTF8 | en_US.UTF8 |            | libc            | =c/cloudsqlsuperuser                   +
               |                   |          |            |            |            |                 | cloudsqlsuperuser=CTc/cloudsqlsuperuser
(4 rows)

postgres=>
Let’s create a DB and then some tables.. just a bit of Postgres foo
isaac_johnson@cloudshell:~ (gkedemo01)$ gcloud sql connect instanatest01 --user=postgres --quiet
Allowlisting your IP for incoming connection for 5 minutes...done.
Connecting to database with SQL user [postgres].Password:
psql (15.1 (Debian 15.1-1.pgdg110+1), server 14.4)
SSL connection (protocol: TLSv1.3, cipher: TLS_AES_256_GCM_SHA384, compression: off)
Type "help" for help.

postgres=> create database instanademodb;
CREATE DATABASE
postgres=> grant all privileges on database 'instanademodb' to postgres;
ERROR:  syntax error at or near "'instanademodb'"
LINE 1: grant all privileges on database 'instanademodb' to postgres...
                                         ^
postgres=> grant all privileges on database instanademodb to postgres;
GRANT

gres=> \c instanademodb;
Password:
psql (15.1 (Debian 15.1-1.pgdg110+1), server 14.4)
SSL connection (protocol: TLSv1.3, cipher: TLS_AES_256_GCM_SHA384, compression: off)
You are now connected to database "instanademodb" as user "postgres".

instanademodb=>
instanademodb=> create table testing(
instanademodb(> ID INT PRIMARY KEY NOT NULL,
instanademodb(> NAME           TEXT NOT NULL,
instanademodb(> AGE            INT NOT NULL,
instanademodb(> ADDRESS        CHAR(100)
instanademodb(> );
CREATE TABLE

instanademodb=> insert into testing values(1, 'Jimmy', 44, '1234 Main St');
INSERT 0 1
instanademodb=> insert into testing(name, age, address) values('Susan', 34, '4321 Second St');
ERROR:  null value in column "id" of relation "testing" violates not-null constraint
DETAIL:  Failing row contains (null, Susan, 34, 4321 Second St                                                  ...).
instanademodb=> insert into testing(id, name, age, address) values(2, 'Susan', 34, '4321 Second St');
INSERT 0 1
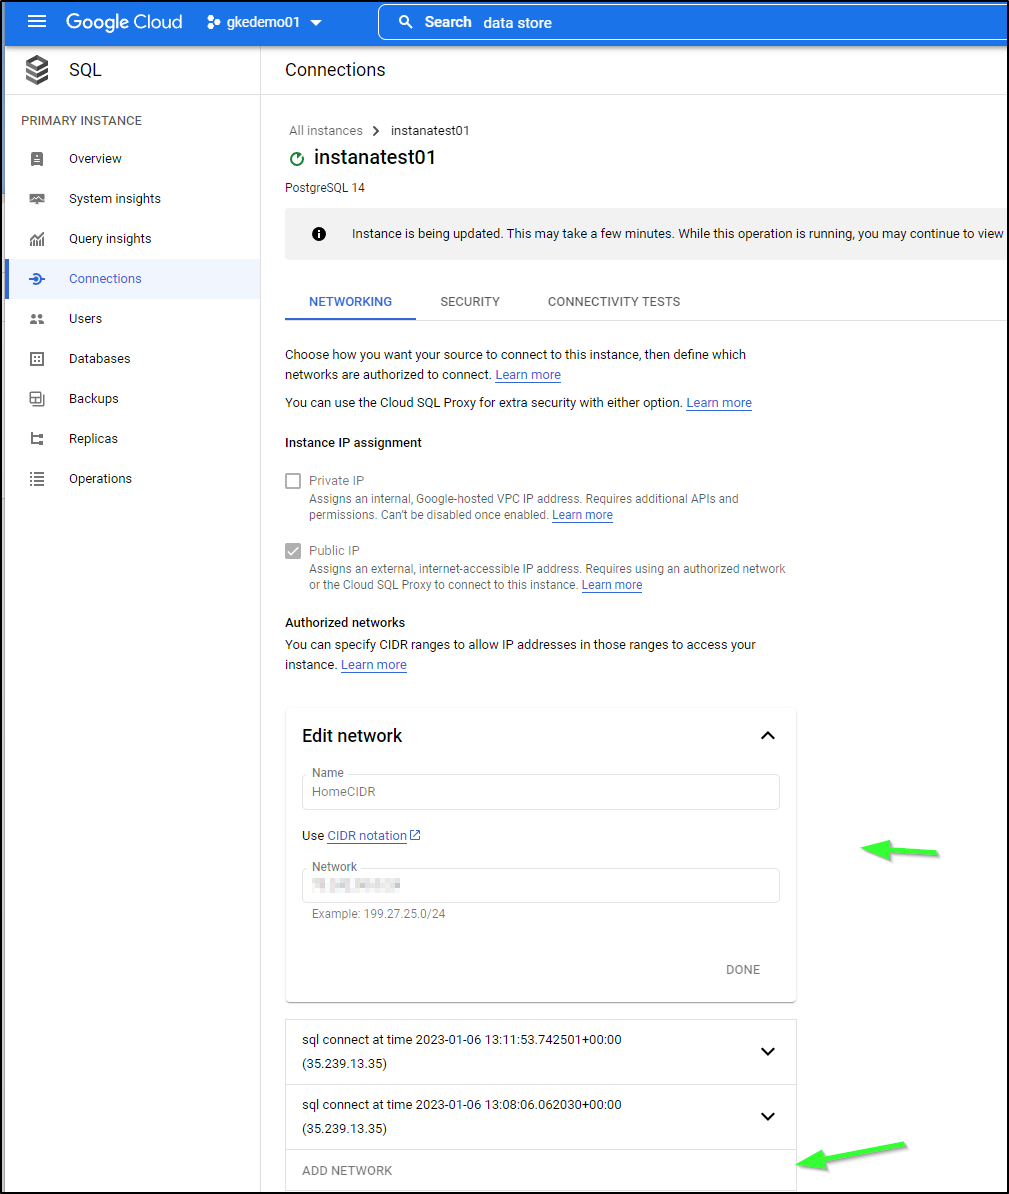
If you want to connect from your laptop, just ensure you whitelist your IP or network CIDR (you can use something like whatismyip.com to see your outgoing IP):
isaac@isaac-MacBookAir:~$ psql -h 34.170.249.43 -p 5432 -U postgres instanademodb
Password for user postgres:
psql (12.12 (Ubuntu 12.12-0ubuntu0.20.04.1), server 14.4)
WARNING: psql major version 12, server major version 14.
         Some psql features might not work.
SSL connection (protocol: TLSv1.3, cipher: TLS_AES_256_GCM_SHA384, bits: 256, compression: off)
Type "help" for help.
        ^
instanademodb=> \l
                                                List of databases
     Name      |       Owner       | Encoding |  Collate   |   Ctype    |            Access privileges
---------------+-------------------+----------+------------+------------+-----------------------------------------
 cloudsqladmin | cloudsqladmin     | UTF8     | en_US.UTF8 | en_US.UTF8 |
 instanademodb | postgres          | UTF8     | en_US.UTF8 | en_US.UTF8 | =Tc/postgres                           +
               |                   |          |            |            | postgres=CTc/postgres
 postgres      | cloudsqlsuperuser | UTF8     | en_US.UTF8 | en_US.UTF8 |
 template0     | cloudsqladmin     | UTF8     | en_US.UTF8 | en_US.UTF8 | =c/cloudsqladmin                       +
               |                   |          |            |            | cloudsqladmin=CTc/cloudsqladmin
 template1     | cloudsqlsuperuser | UTF8     | en_US.UTF8 | en_US.UTF8 | =c/cloudsqlsuperuser                   +
               |                   |          |            |            | cloudsqlsuperuser=CTc/cloudsqlsuperuser
(5 rows)

instanademodb=>
instanademodb=> \c instanademodb;
psql (12.12 (Ubuntu 12.12-0ubuntu0.20.04.1), server 14.4)
WARNING: psql major version 12, server major version 14.
         Some psql features might not work.
SSL connection (protocol: TLSv1.3, cipher: TLS_AES_256_GCM_SHA384, bits: 256, compression: off)
You are now connected to database "instanademodb" as user "postgres".
instanademodb=> insert into testing values (3, 'George', 22, '444 third ave.');
INSERT 0 1
instanademodb=>
Here is where I discovered that the “Infrastructure” Isometric view, as fun as it is, is NOT showing everything.
I tried the new “Infrastructure analytics”
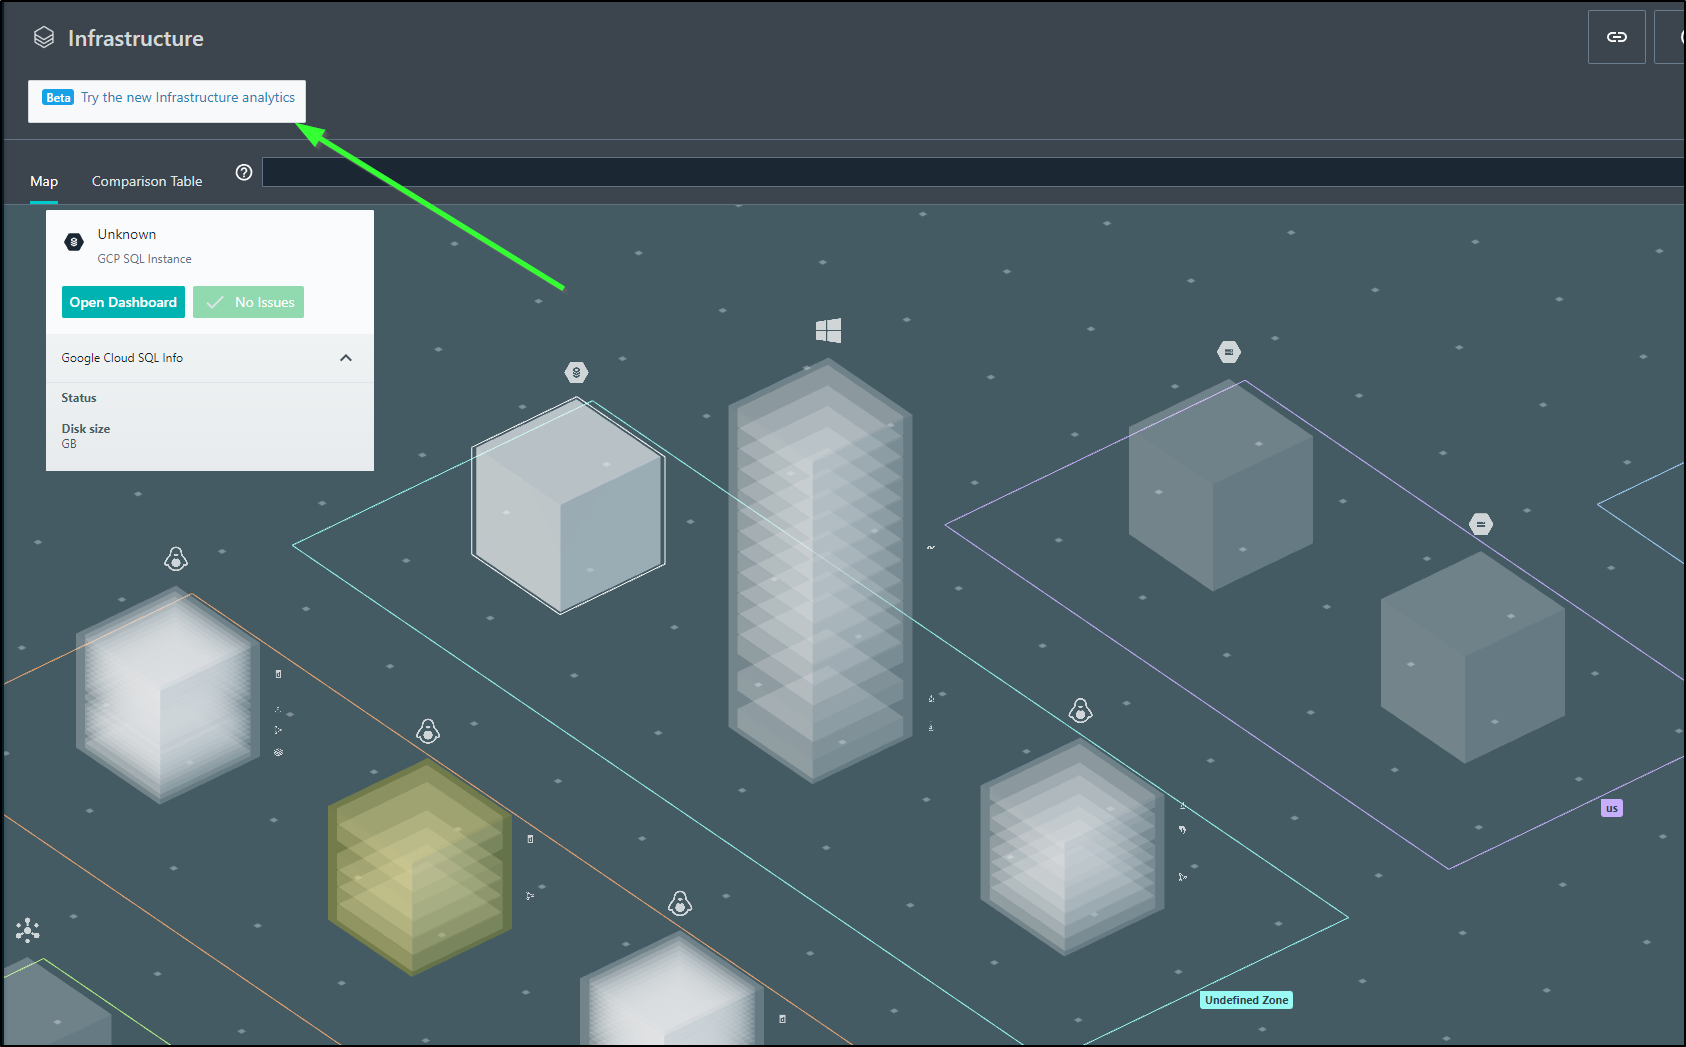
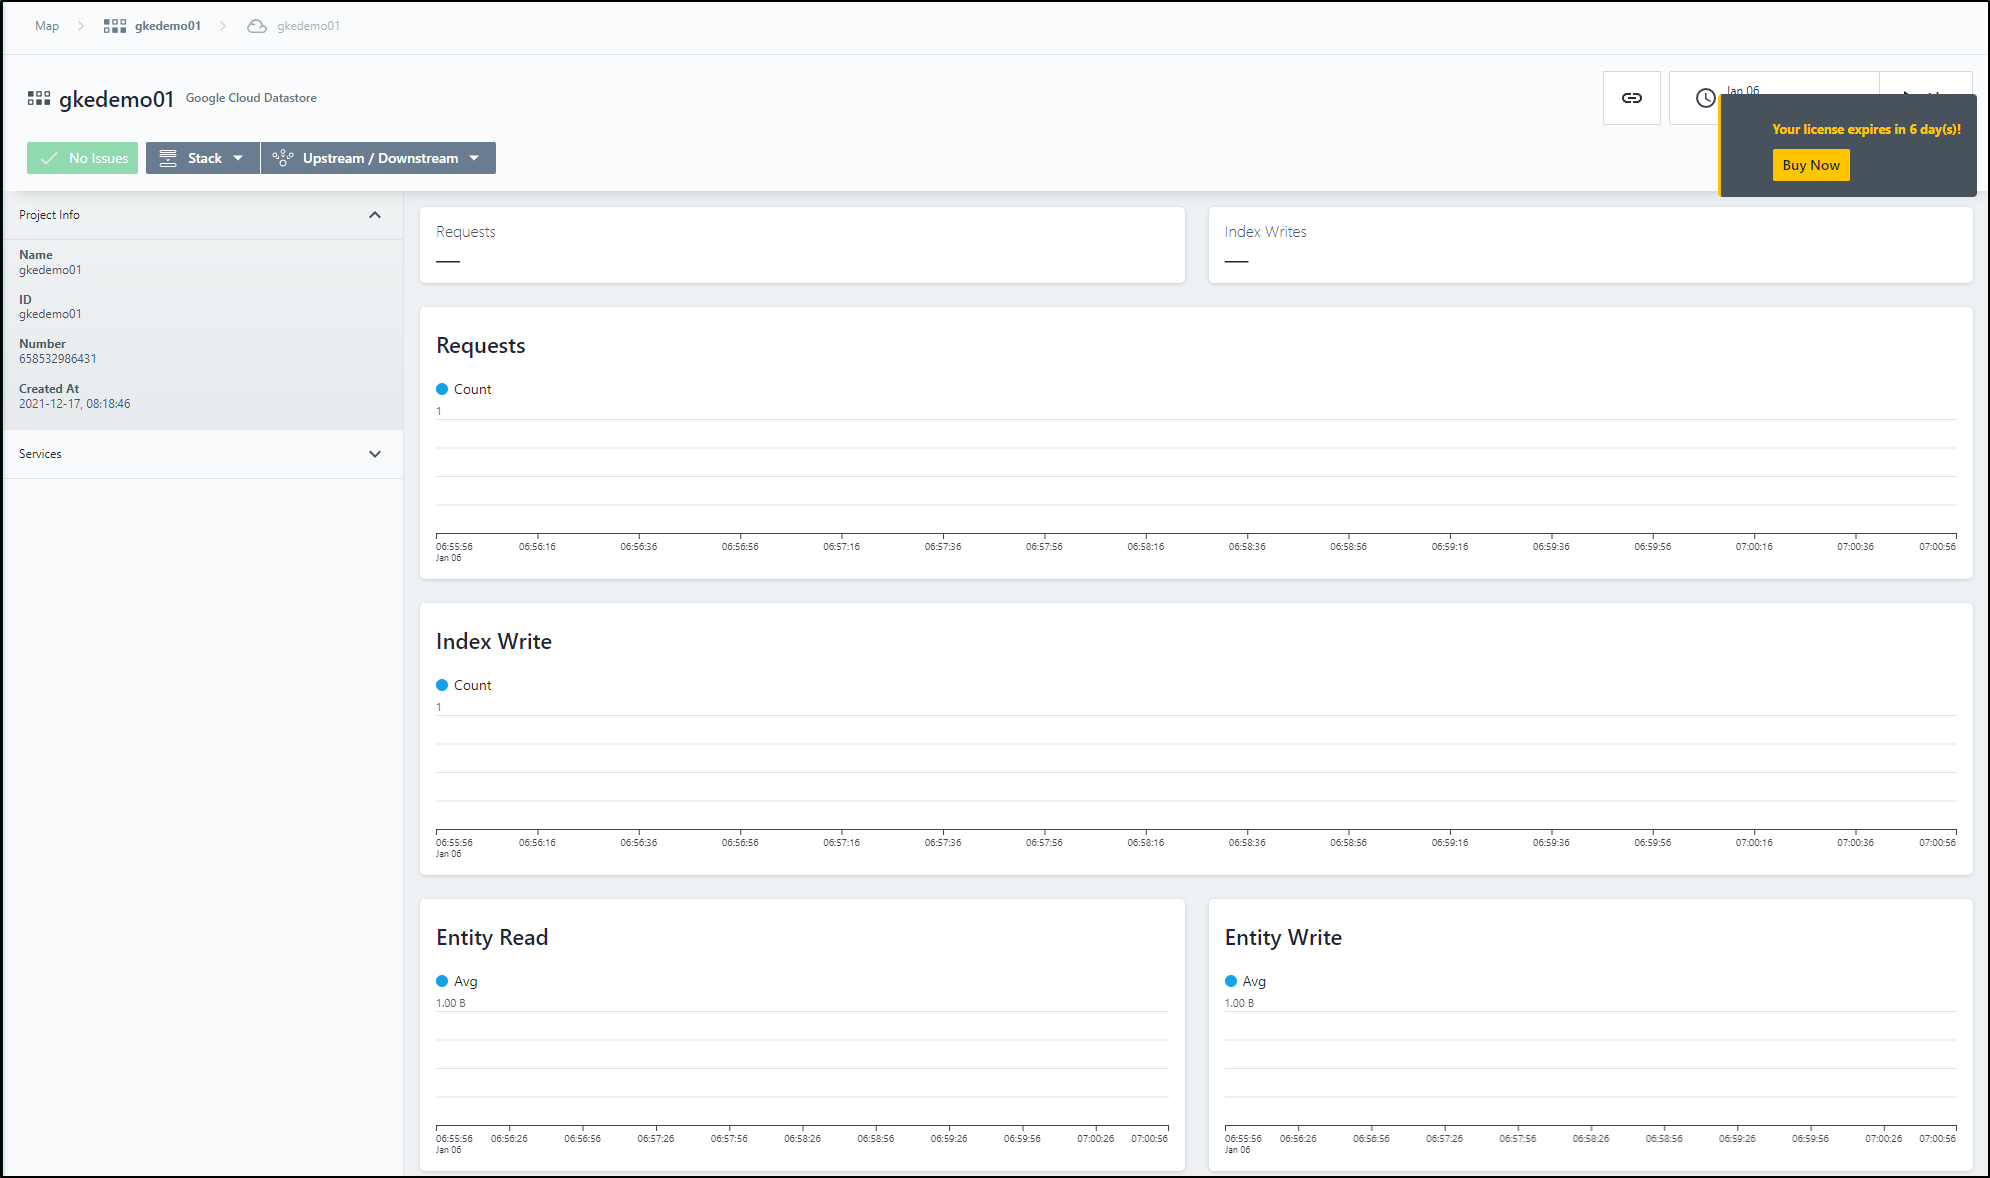
And from there, I could get to Cloud SQL
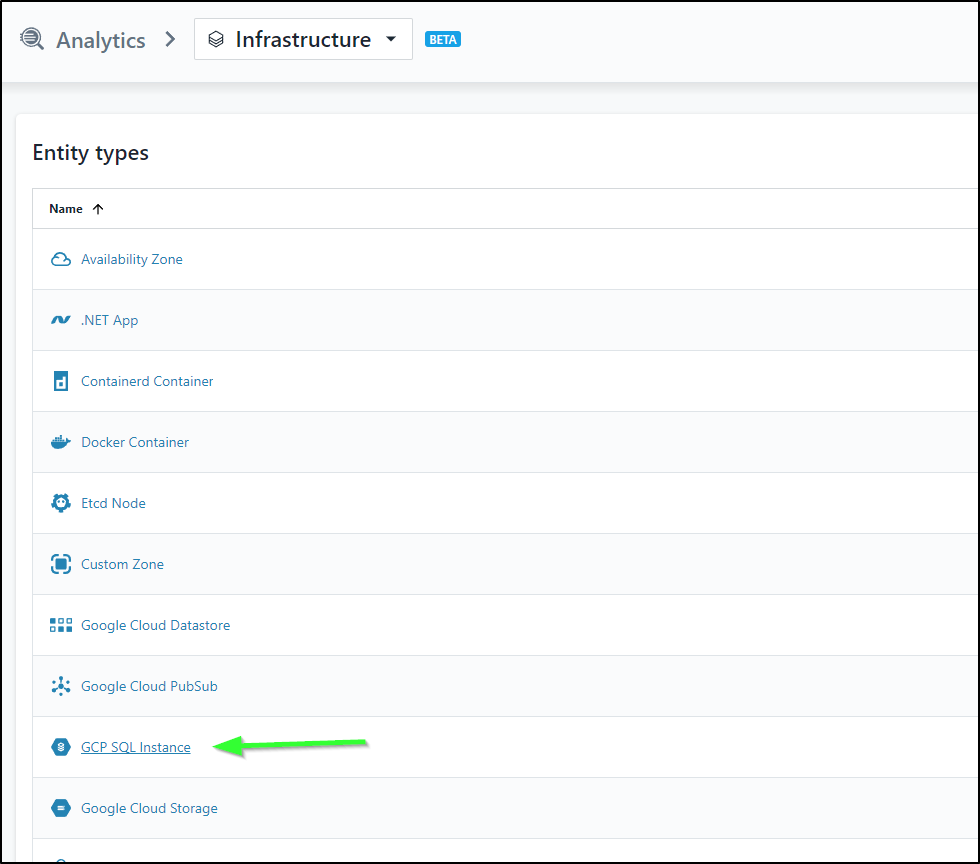
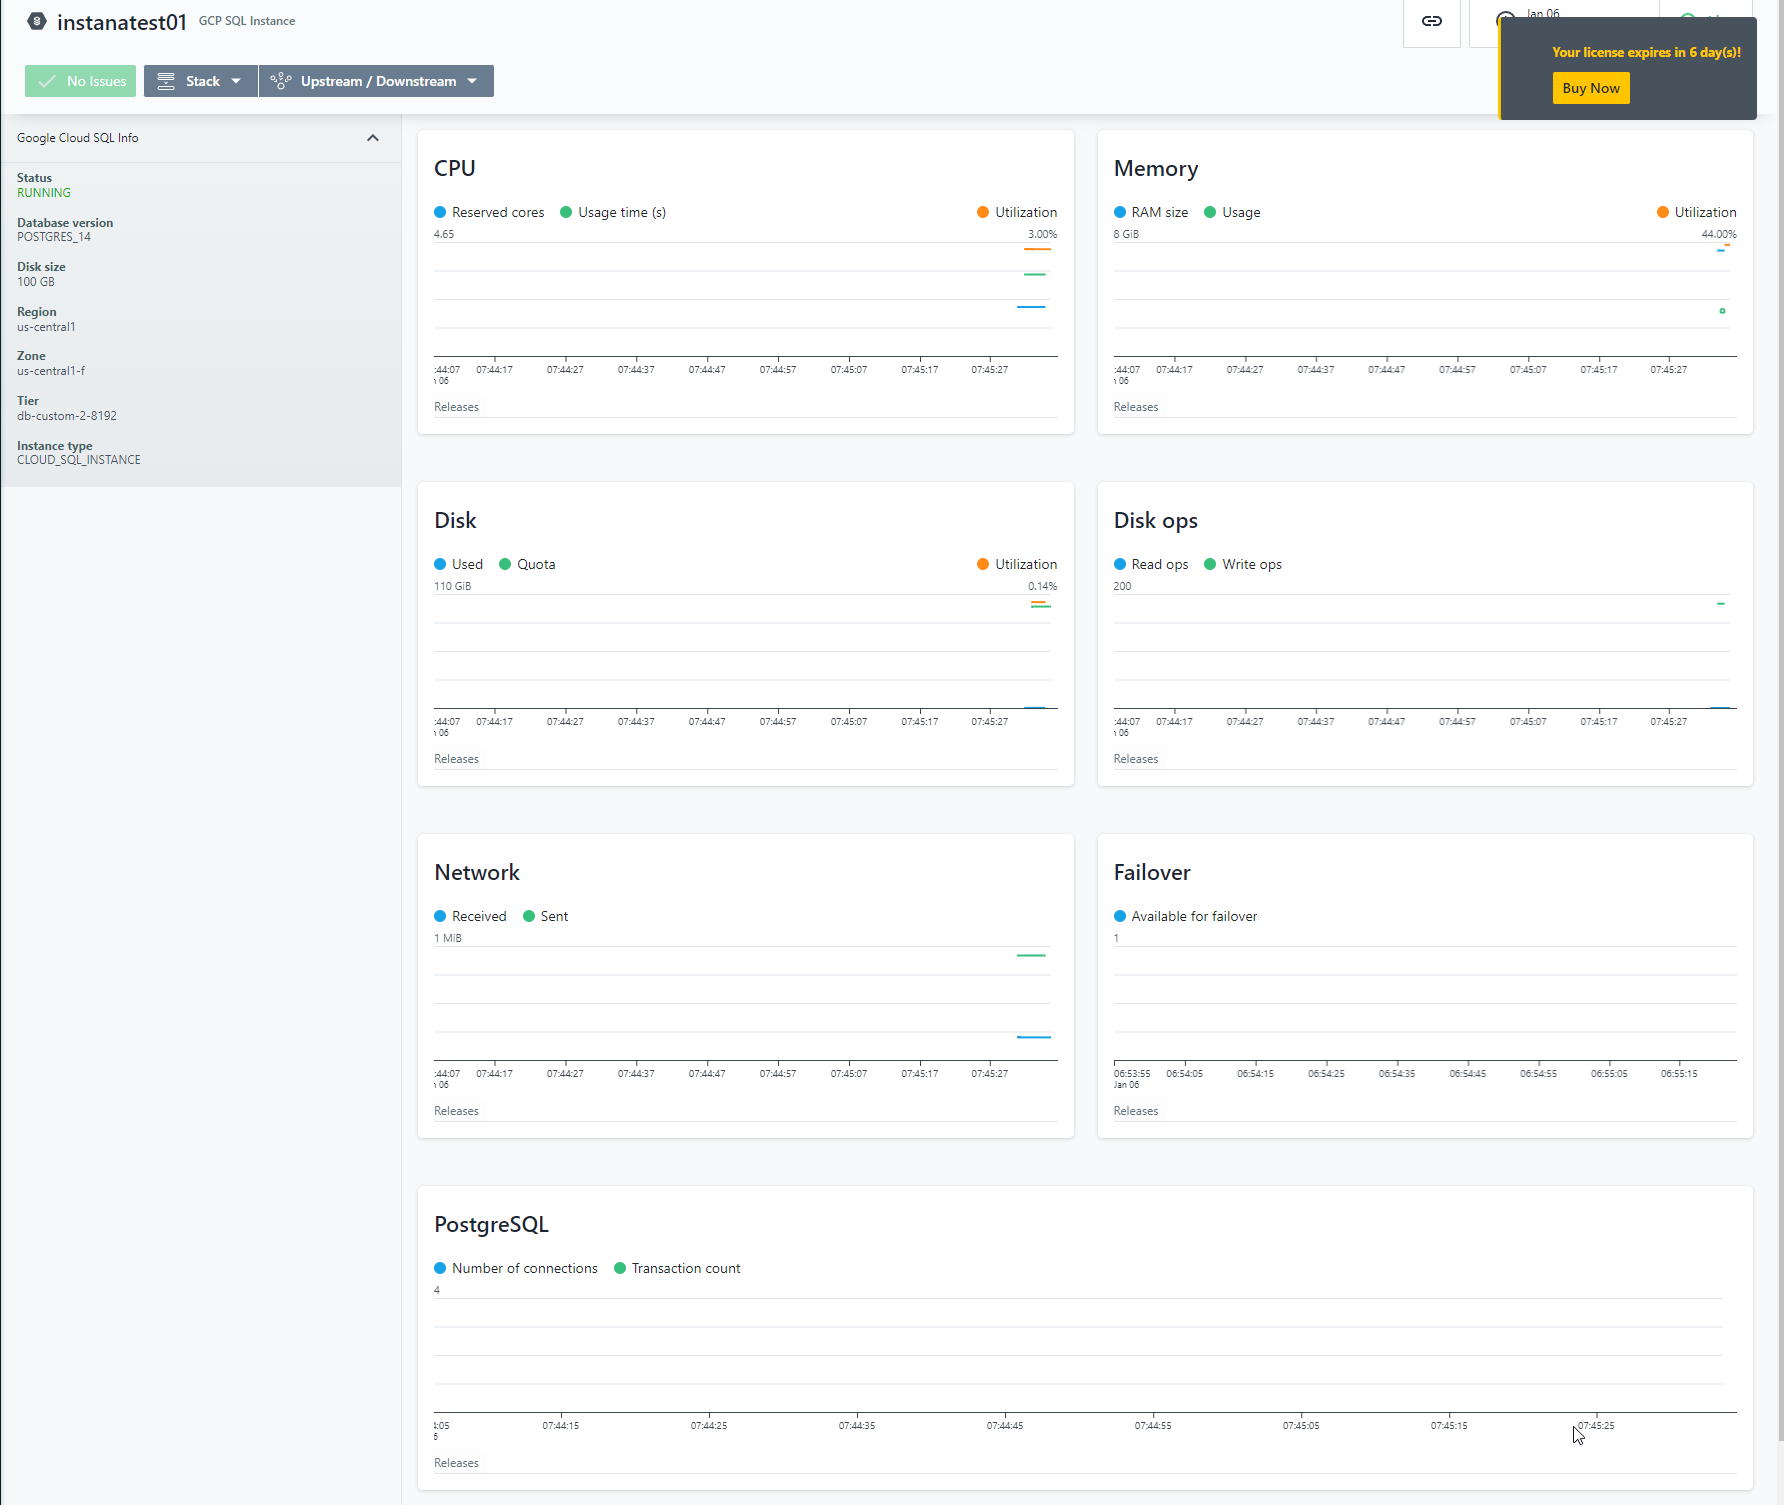
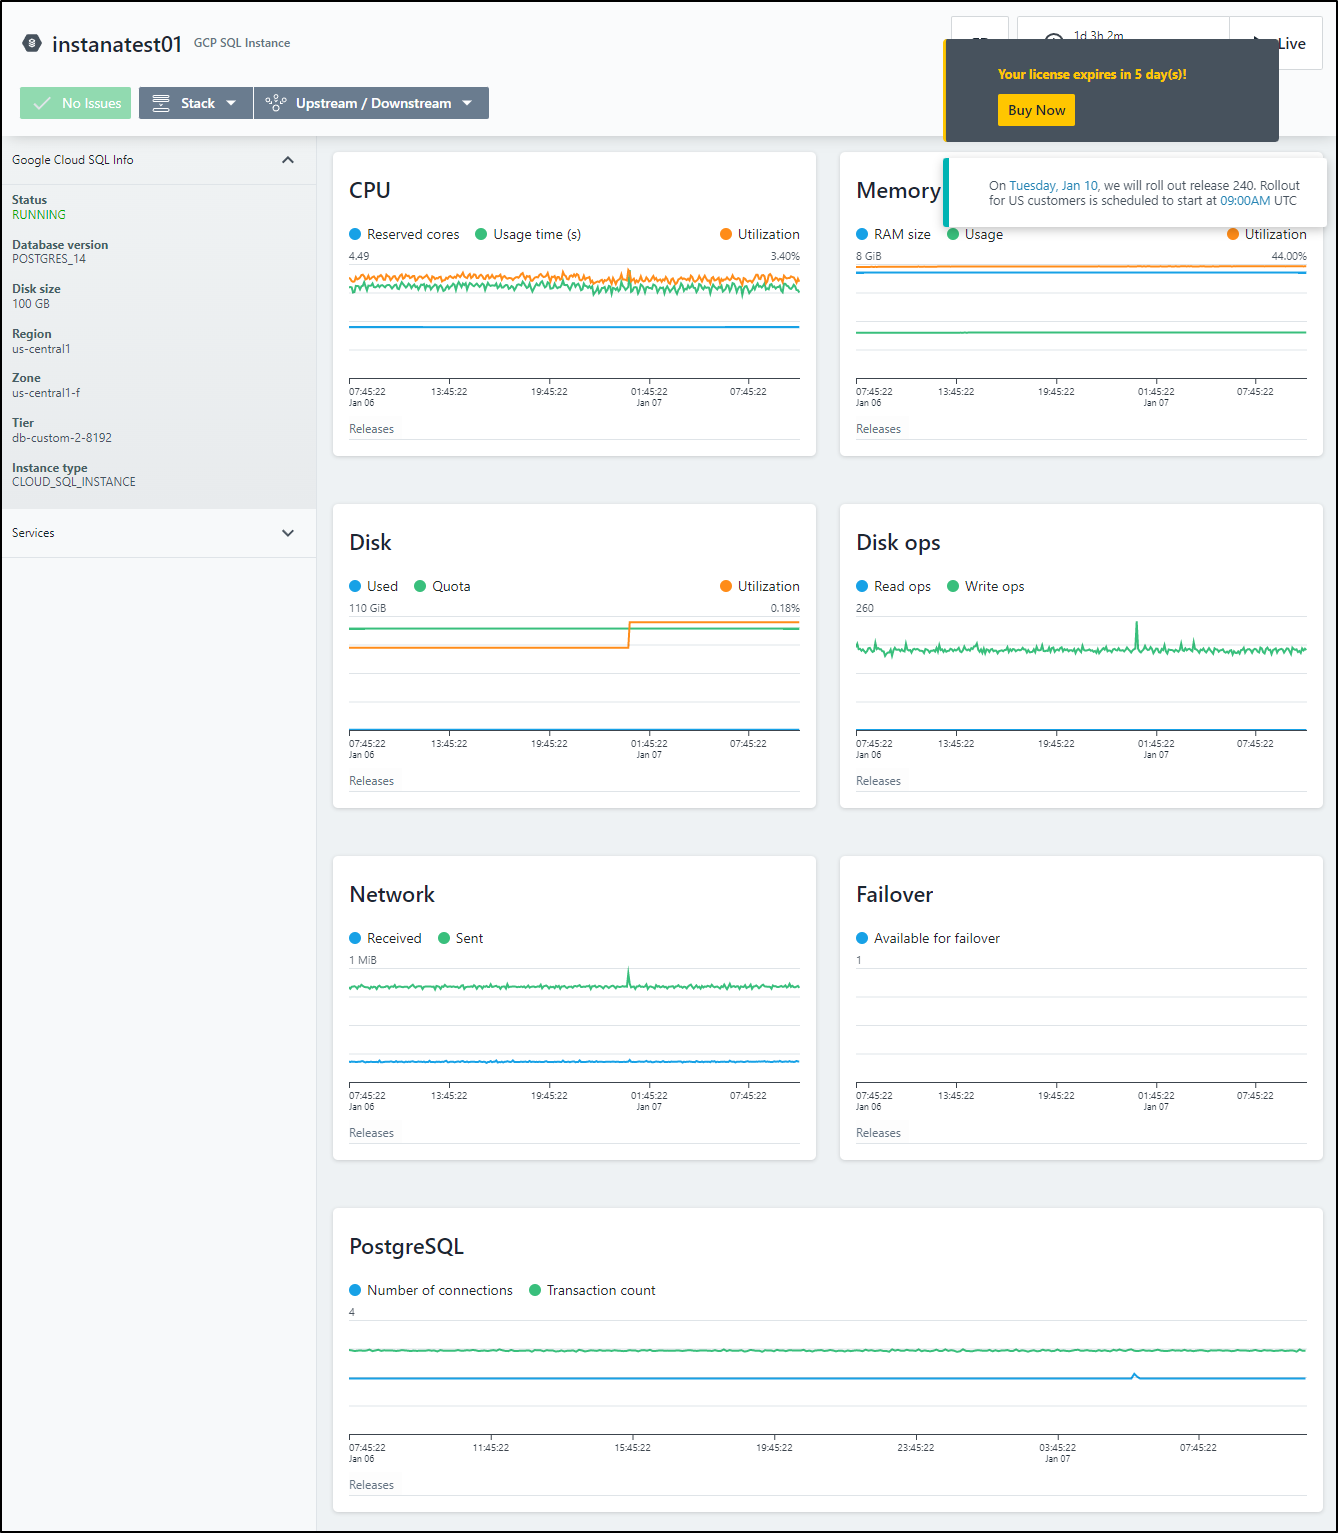
I’ll click on the one entry
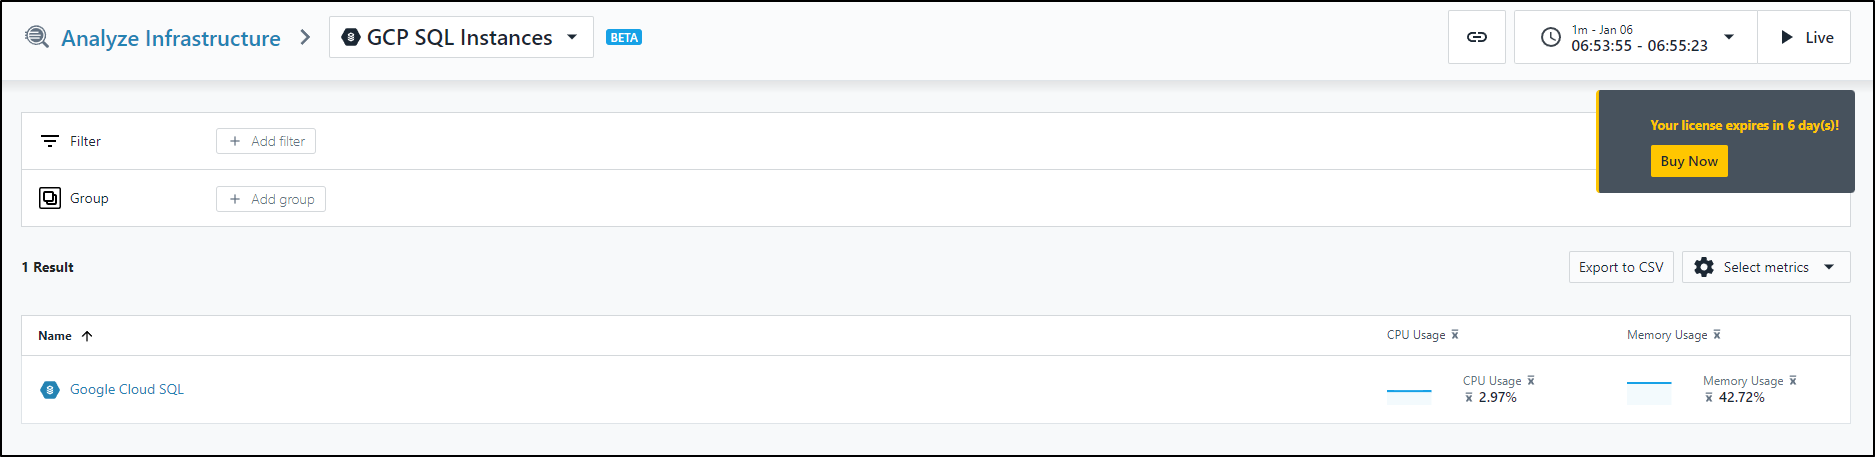
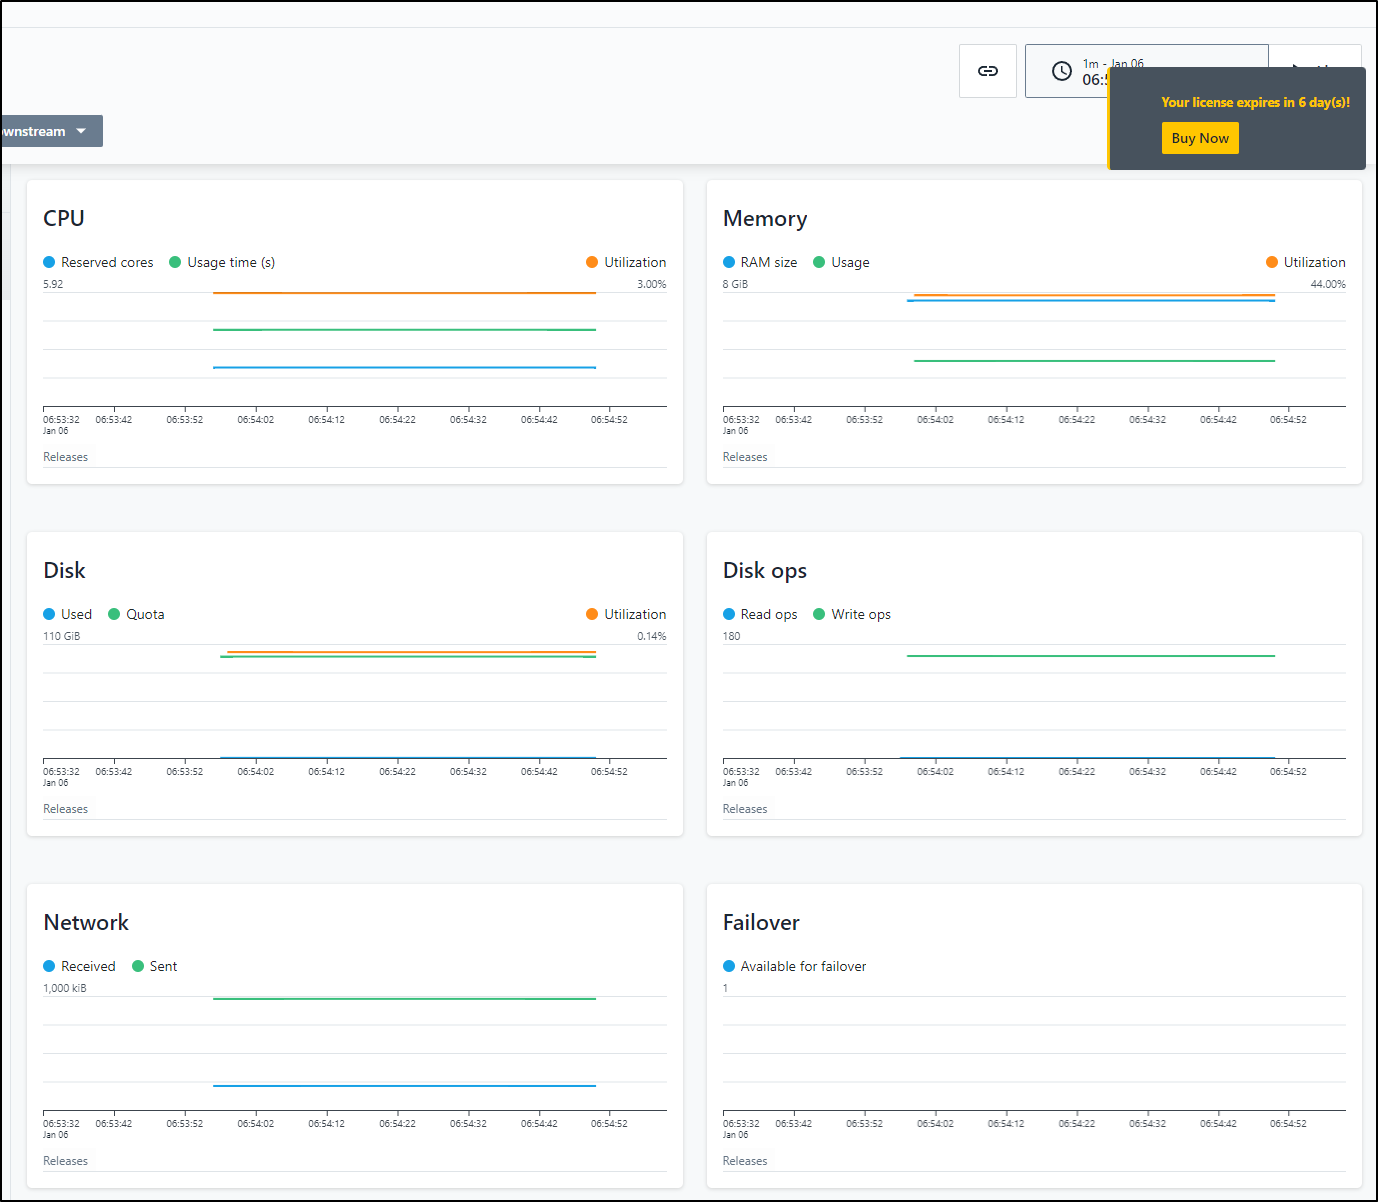
I can see various collected metrics
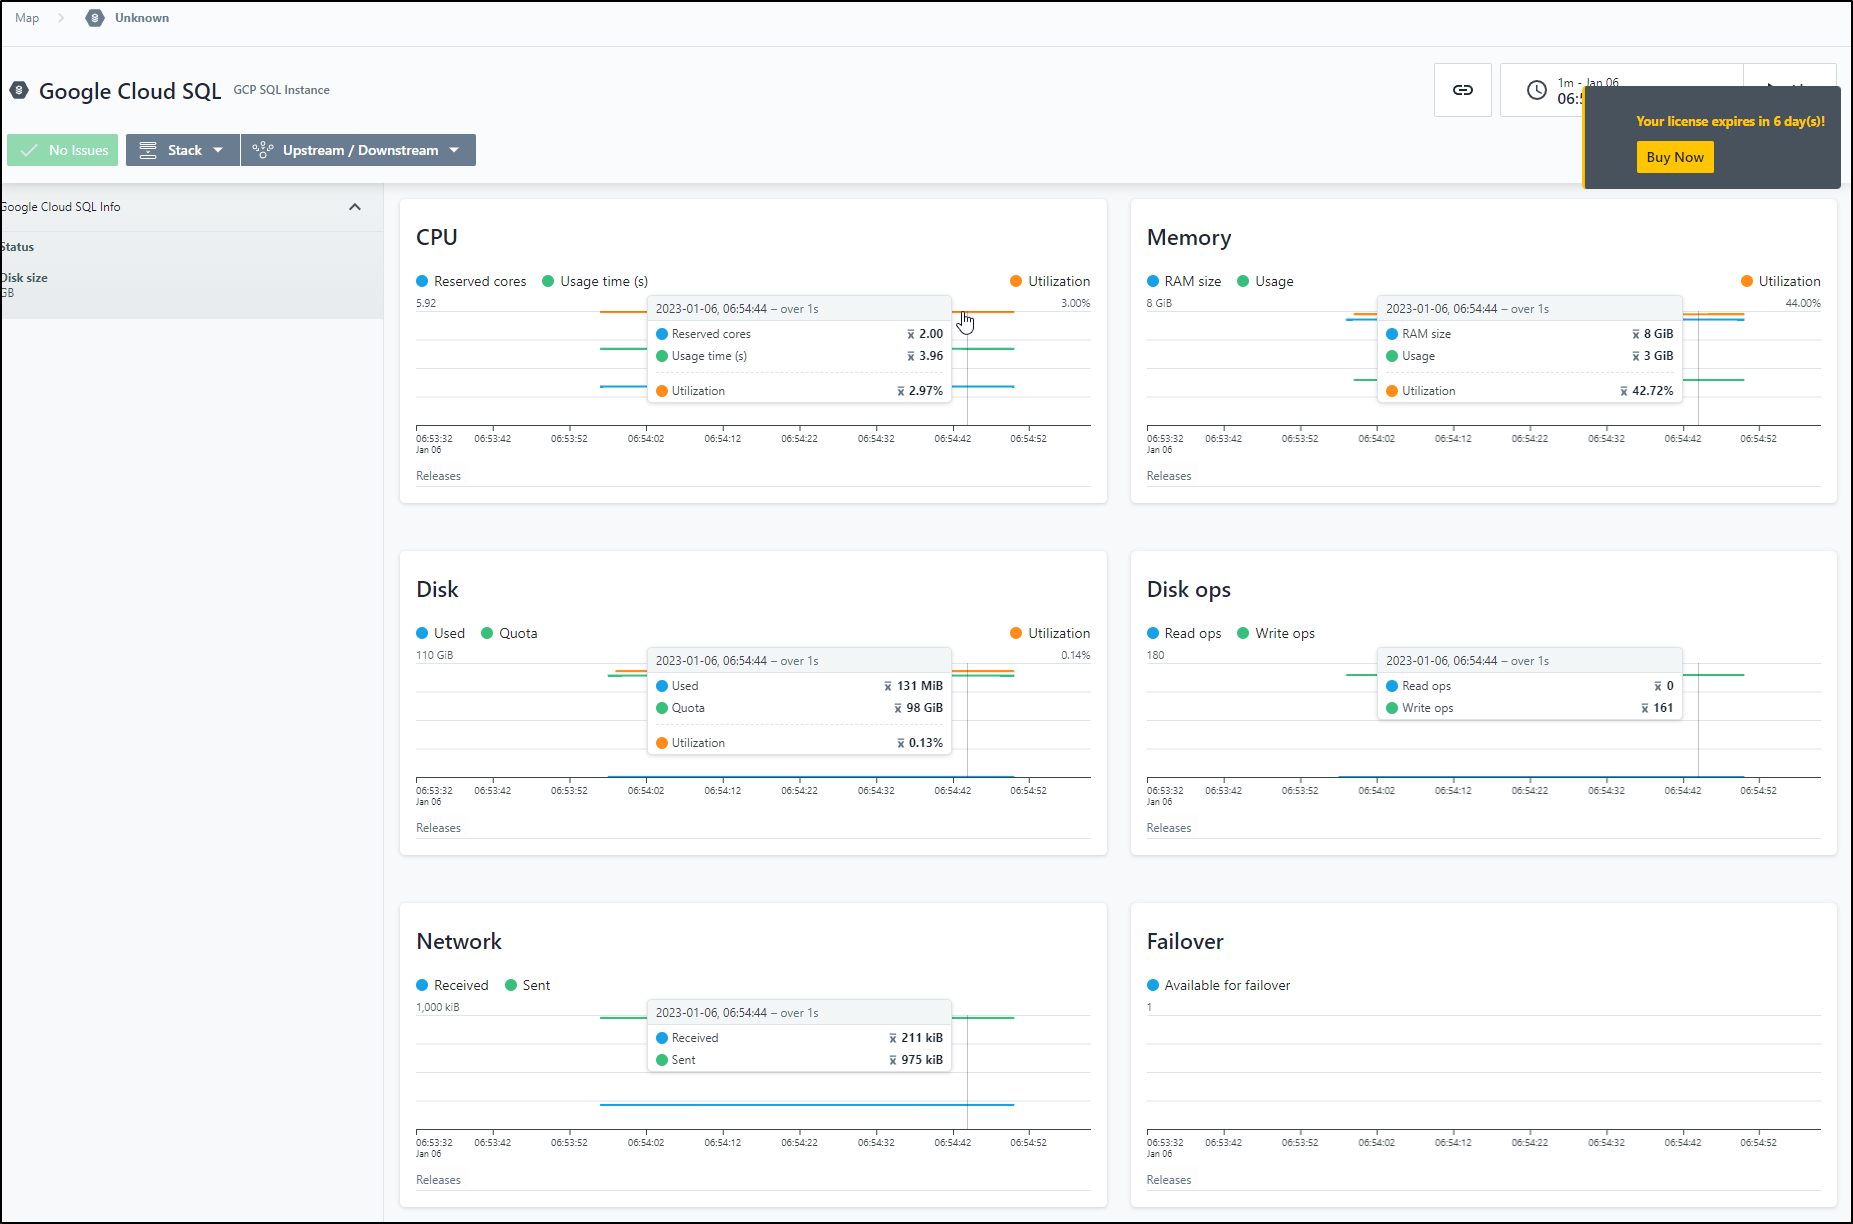
There is something strange with times tho. For instance, as I write, this is 7:30a, but the data is rather fixed to a 1 minute period from when I setup the linux agent, which you would be able to see if that damn buy now overlay wasn’t blocking important UI navigation.
(I’m an idiot.. i was getting frustrated and just clicked in the middle of the “Buy Now” box and it disappeared. DOH!)
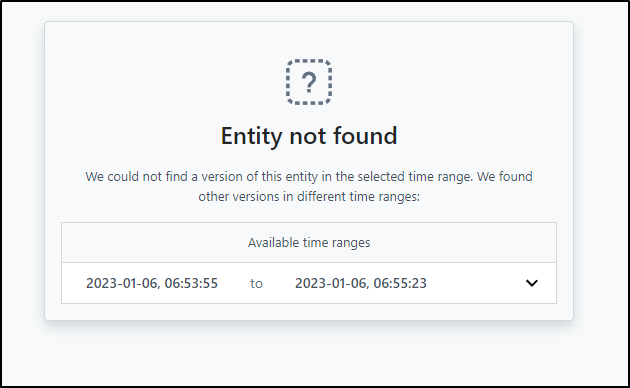
If I click “Live”, i get an error showing the only time range available
I did a quick check and see the Instana agent is running presently (did not appear to crash)
isaac@isaac-MacBookAir:~$ sudo service instana-agent status
[sudo] password for isaac:
● instana-agent.service - "Instana(tm) agent."
     Loaded: loaded (/lib/systemd/system/instana-agent.service; disabled; vendor preset: enabled)
    Drop-In: /etc/systemd/system/instana-agent.service.d
             └─agent-custom-start.conf, custom-environment.conf
     Active: active (running) since Fri 2023-01-06 06:51:11 CST; 41min ago
   Main PID: 2139553 (java)
      Tasks: 106 (limit: 9337)
     Memory: 456.1M
     CGroup: /system.slice/instana-agent.service
             ├─2139553 /opt/instana/agent/jvm/bin/java -XX:+UnlockDiagnosticVMOptions -Xmx186071K -XX:MaxDirectMemorySize=20674K -XX:+UseSerialGC -Xmn32m -Xss640k -XX:InitialCodeCache>
             └─2141218 /opt/instana/agent/data/repo/com/instana/ebpf-sensor/0.1.7/ebpf-sensor-0.1.7.bin

Jan 06 06:51:11 isaac-MacBookAir systemd[1]: Started "Instana(tm) agent.".
Jan 06 06:51:11 isaac-MacBookAir karaf[2139553]: Agent running under SystemD v232+ ('INVOCATION_ID' environment variable found).
Jan 06 06:51:11 isaac-MacBookAir karaf[2139553]: The amount of memory available to the agent is 9223372036854771712 bytes (from: /sys/fs/cgroup/memory/system.slice/instana-agent.servi>
Jan 06 06:51:11 isaac-MacBookAir karaf[2139553]: The amount of memory to be used by the agent seems too large (9007199254740989 KB, which is bigger or equal to the 8044776 KB total sy>
Jan 06 06:51:11 isaac-MacBookAir karaf[2139553]: If you want to make available more or less memory to the agent, set the 'MemoryMax' property accordingly in the 'instana-agent.service>
Jan 06 06:51:11 isaac-MacBookAir karaf[2139553]: Checking Host machine for TLS 1.3 support
I checked the Instana Log and found the GCP agent crapped out checking for Cloud Run
root@isaac-MacBookAir:/opt/instana/agent# cat ./data/log/agent.log

2023-01-06T06:54:47.728-06:00 | INFO  | tana-sensor-scheduler-thread-2-4 | RunSensor        | com.instana.sensor-gcp-run - 1.2.5 | Deactivating Sensor for gkedemo01
2023-01-06T06:54:47.738-06:00 | ERROR | tana-sensor-scheduler-thread-2-2 | orizationContext | com.instana.gcp-sdk - 1.2.5 | Could not execute GET for URL: https://asia-east1-run.googleapis.com/apis/serving.knative.dev/v1/namespaces/gkedemo01/revisions. interrupted
2023-01-06T06:54:47.742-06:00 | ERROR | tana-sensor-scheduler-thread-2-2 | orizationContext | com.instana.gcp-sdk - 1.2.5 | Could not execute GET for URL: https://asia-east2-run.googleapis.com/apis/serving.knative.dev/v1/namespaces/gkedemo01/revisions. null
2023-01-06T06:54:48.979-06:00 | ERROR | tana-sensor-scheduler-thread-2-2 | oogleCloudClient | com.instana.gcp-sdk - 1.2.5 | Response from url https://asia-northeast1-run.googleapis.com/apis/serving.knative.dev/v1/namespaces/gkedemo01/revisions contained an error: {"code":403,"message":"Permission 'run.revisions.list' denied on resource 'namespaces/gkedemo01/revisions' (or resource may not exist).","status":"PERMISSION_DENIED"}; full response: {"error":{"code":403,"message":"Permission 'run.revisions.list' denied on resource 'namespaces/gkedemo01/revisions' (or resource may not exist).","status":"PERMISSION_DENIED"}}
2023-01-06T06:54:48.980-06:00 | ERROR | tana-sensor-scheduler-thread-2-2 | ionsDataProvider | com.instana.sensor-gcp-run - 1.2.5 | The Instana agent was not able to obtain Google Cloud Run data. Please assign the role "Cloud Run Viewer" to the configured service account. Alternatively you can also assign a custom role with the following minimal set of permissions: "resourcemanager.projects.get", "run.revisions.list", "run.services.list" and "monitoring.timeSeries.list".
com.instana.agent.gc.sdk.exception.MissingGoogleCloudPermissionsException:
        at com.instana.agent.gc.sdk.GoogleCloudClient.requestAllPages(GoogleCloudClient.java:174) ~[?:?]
        at com.instana.agent.run.sensor.utils.ServiceRevisionUtils.fetchServiceRevisionList(ServiceRevisionUtils.java:73) ~[?:?]
        at com.instana.agent.run.sensor.providers.ServiceRevisionsDataProvider.fetchServiceRevisionDataFromApi(ServiceRevisionsDataProvider.java:82) ~[?:?]
        at com.instana.agent.run.sensor.providers.ServiceRevisionsDataProvider.updateSnapshot(ServiceRevisionsDataProvider.java:75) ~[?:?]
        at com.instana.agent.run.sensor.providers.ServiceRevisionsDataProvider.update(ServiceRevisionsDataProvider.java:70) ~[?:?]
        at com.instana.agent.run.sensor.RunSensor.lambda$actOnConfigurationChanged$1(RunSensor.java:120) ~[?:?]
        at com.instana.agent.api.ObservableRunnable.run(ObservableRunnable.java:65) [!/:?]
        at java.util.concurrent.Executors$RunnableAdapter.call(Executors.java:511) [?:1.8.0_352]
        at java.util.concurrent.FutureTask.runAndReset(FutureTask.java:308) [?:1.8.0_352]
        at java.util.concurrent.ScheduledThreadPoolExecutor$ScheduledFutureTask.access$301(ScheduledThreadPoolExecutor.java:180) [?:1.8.0_352]
        at java.util.concurrent.ScheduledThreadPoolExecutor$ScheduledFutureTask.run(ScheduledThreadPoolExecutor.java:294) [?:1.8.0_352]
        at com.instana.agent.main.impl.scheduler.MonitoredScheduledTreadPoolExecutor$NamedRunnableScheduledFuture.run(MonitoredScheduledTreadPoolExecutor.java:130) [!/:1.1.670]
        at java.util.concurrent.ThreadPoolExecutor.runWorker(ThreadPoolExecutor.java:1149) [?:1.8.0_352]
        at java.util.concurrent.ThreadPoolExecutor$Worker.run(ThreadPoolExecutor.java:624) [?:1.8.0_352]
        at io.netty.util.concurrent.FastThreadLocalRunnable.run(FastThreadLocalRunnable.java:30) [!/:4.1.85.Final]
        at java.lang.Thread.run(Thread.java:750) [?:1.8.0_352]
2023-01-06T06:54:52.917-06:00 | INFO  | tana-sensor-scheduler-thread-2-2 | SqlSensor        | com.instana.sensor-gcp-sql - 1.2.5 | Deactivate of Google Cloud SQL Sensor
2023-01-06T06:54:53.257-06:00 | INFO  | tana-sensor-scheduler-thread-2-3 | SqlSensor        | com.instana.sensor-gcp-sql - 1.2.5 | Deactivate of Google Cloud SQL Sensor
2023-01-06T06:55:44.271-06:00 | INFO  | 37d-3962-43eb-8494-4d185d04f73b) | Process          | com.instana.sensor-process - 1.1.46 | Deactivated Sensor for PID 2150668
2023-01-06T06:55:44.275-06:00 | INFO  | cf4-9091-4098-8d38-674ad5c732c3) | PostgresqlDb     | com.instana.sensor-postgresql - 1.0.44 | Deactivated Sensor for PID 2150668
Seems the IBM Docs missed a role.
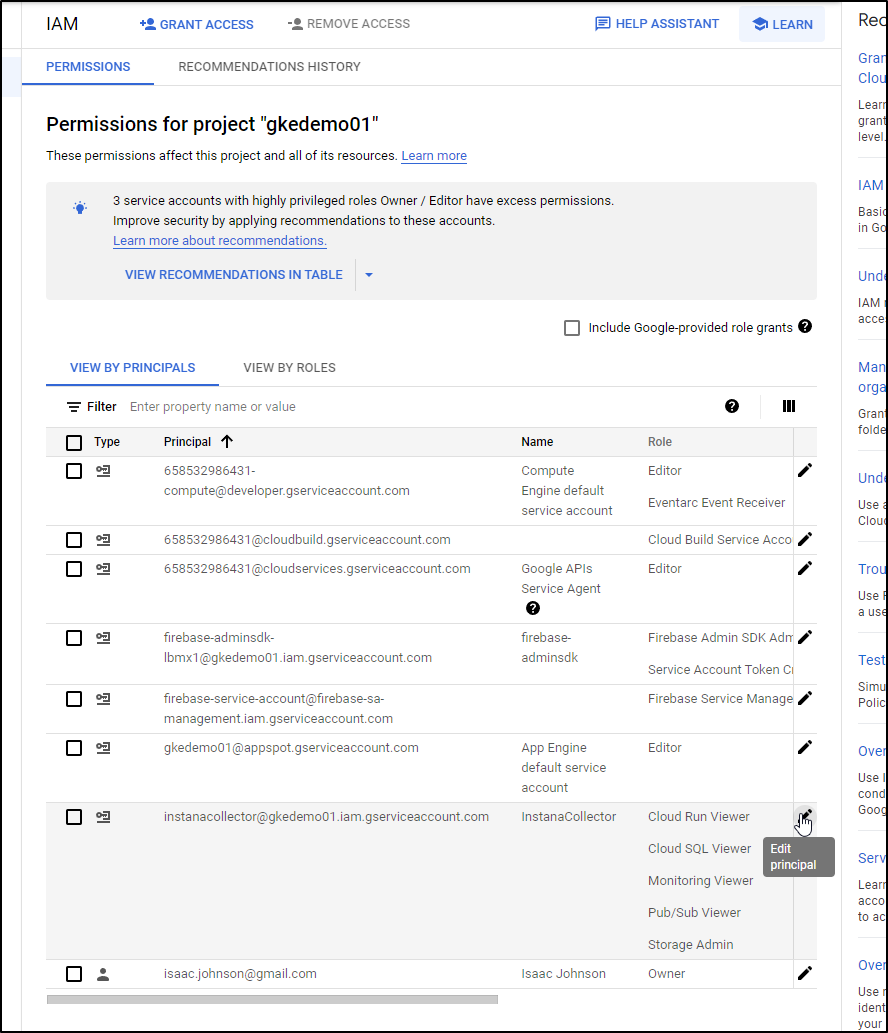
I can either disable Cloud Run, or just fix the SA role. Let’s do the latter. I’ll click the edit Icon on the Service Principal.
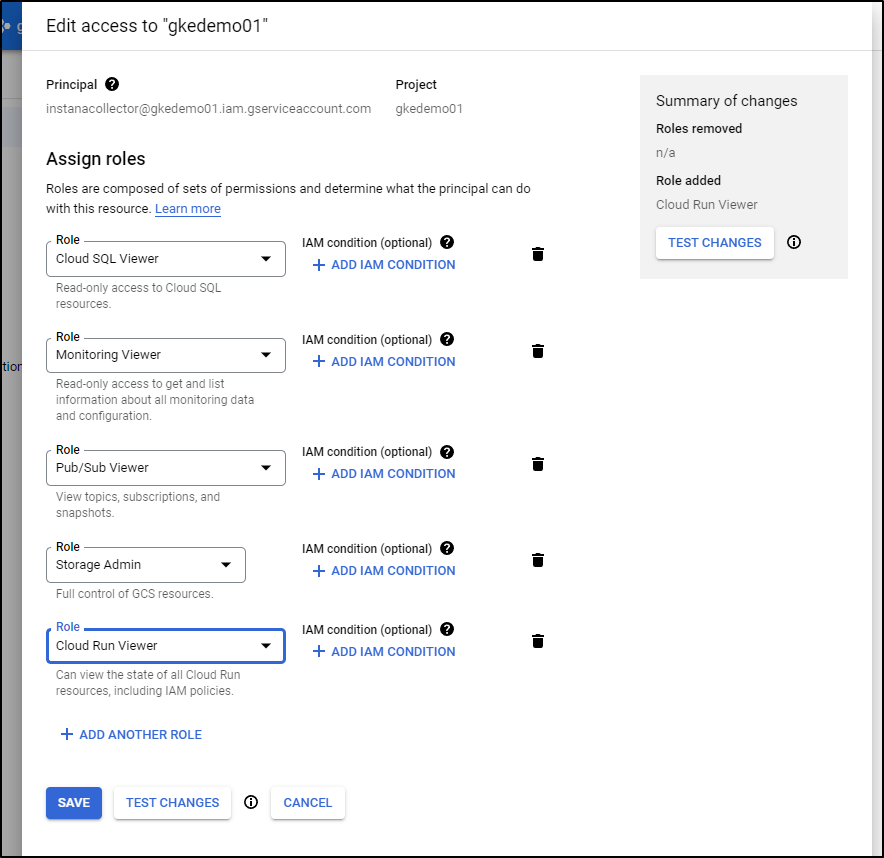
I’ll then add “Cloud Run Viewer” and save
I’ll then restart the Instana agent
isaac@isaac-MacBookAir:/opt/instana/agent$ sudo service instana-agent restart
The log was getting a bit messy, so i actually stopped the agent and removed the old log, then started again
isaac@isaac-MacBookAir:/opt/instana/agent$ sudo service instana-agent stop
isaac@isaac-MacBookAir:/opt/instana/agent$ sudo rm -f /opt/instana/agent/
agent.pid             data/                 jvm/                  licenses/             README                THIRD_PARTY.csv       VERSION
bin/                  etc/                  lib/                  lock                  system/               THIRD_PARTY_LICENSES
isaac@isaac-MacBookAir:/opt/instana/agent$ sudo rm -f /opt/instana/agent/data/log/agent.log
isaac@isaac-MacBookAir:/opt/instana/agent$ sudo service instana-agent start
isaac@isaac-MacBookAir:/opt/instana/agent$ tail -f /opt/instana/agent/data/log/agent.log
2023-01-06T07:43:26.151-06:00 | INFO  | features-3-thread-1              | AgentBootstrap   | com.instana.agent-bootstrap - 1.2.25 | Bootstrapping agent
2023-01-06T07:43:26.170-06:00 | INFO  | features-3-thread-1              | AgentBootstrap   | com.instana.agent-bootstrap - 1.2.25 | Running on isaac-MacBookAir, Linux 5.15.0-56-generic amd64
2023-01-06T07:43:26.172-06:00 | INFO  | features-3-thread-1              | AgentBootstrap   | com.instana.agent-bootstrap - 1.2.25 | Using PATH set to /usr/
...
Now it is working
GCP Monitoring
I’ll cover briefly what is collected - namely metrics of any of the listed services from the point the agent was set.
That is, there is a CloudRun that has been in that project for some time, but i can only see metrics since I added the Instana agent
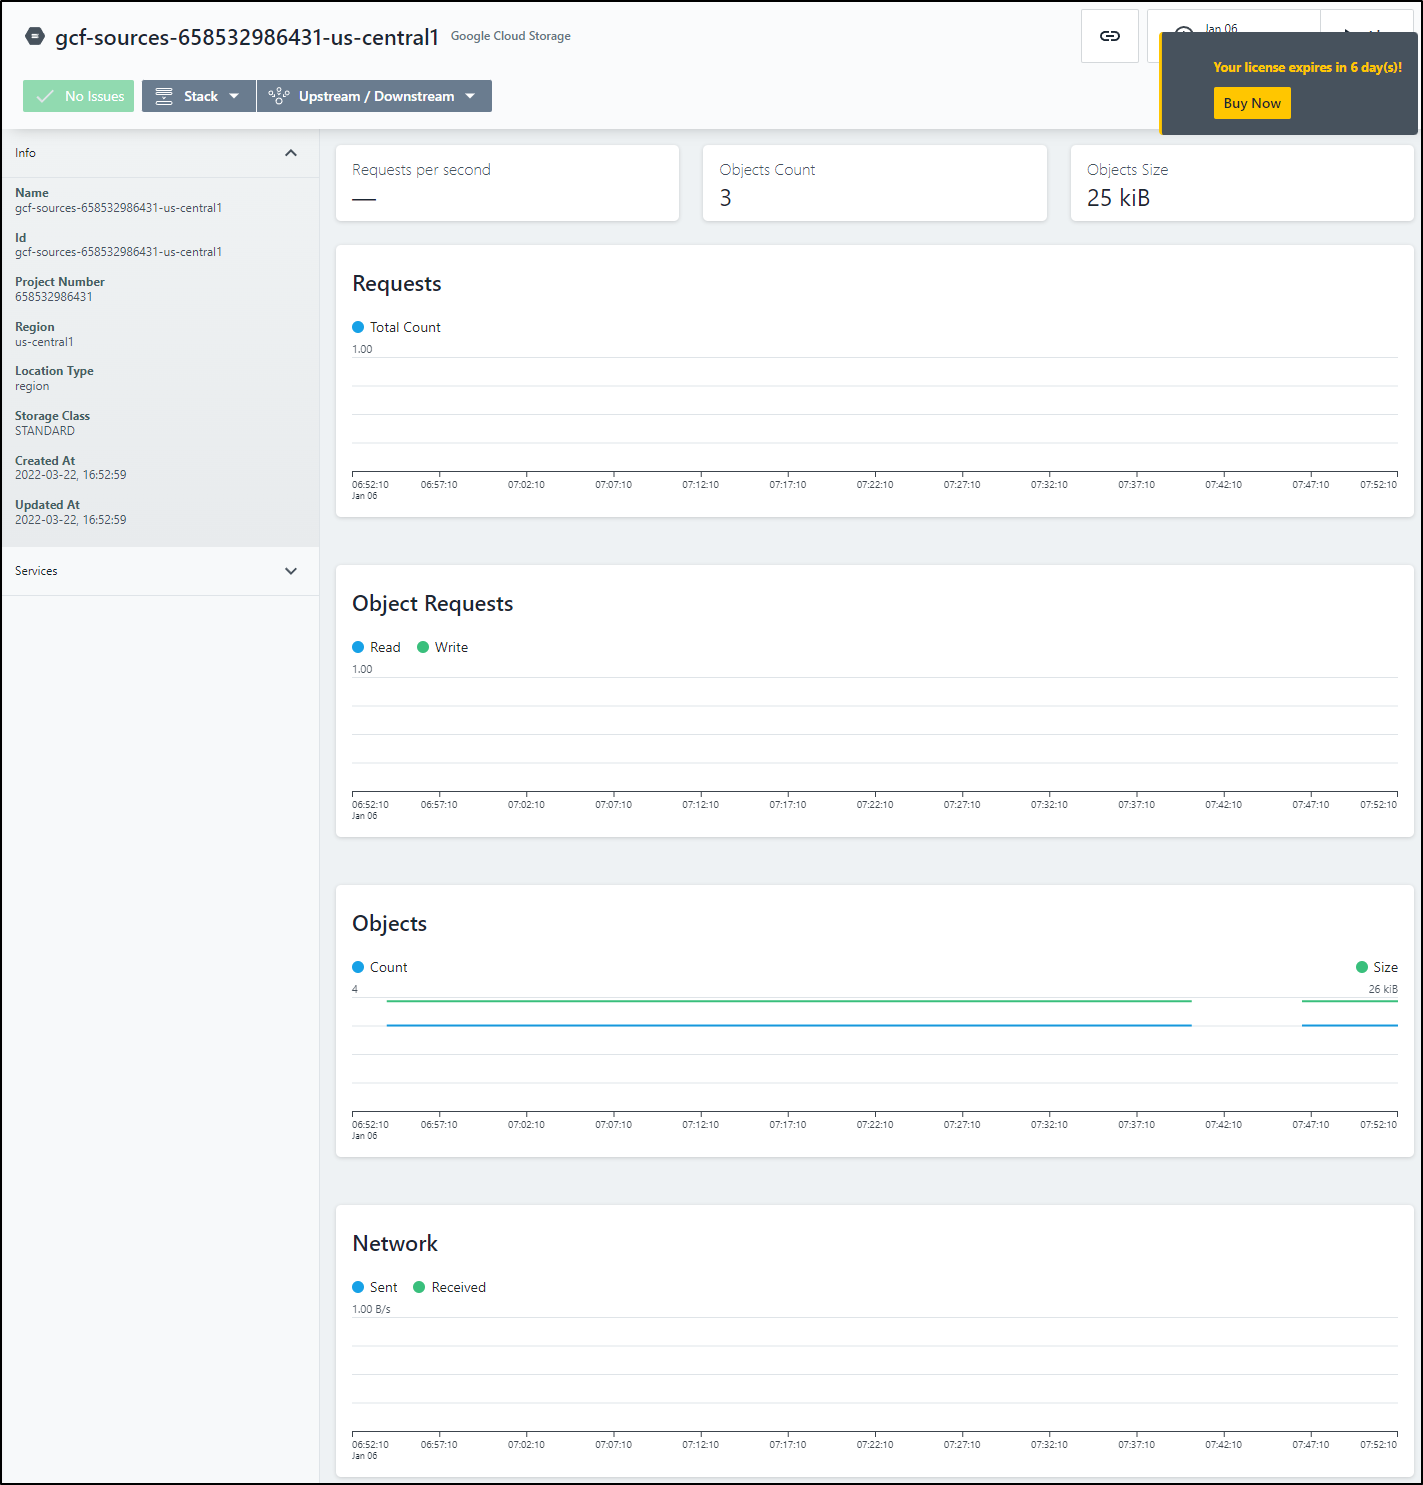
Storage
We can see requests, objects and network
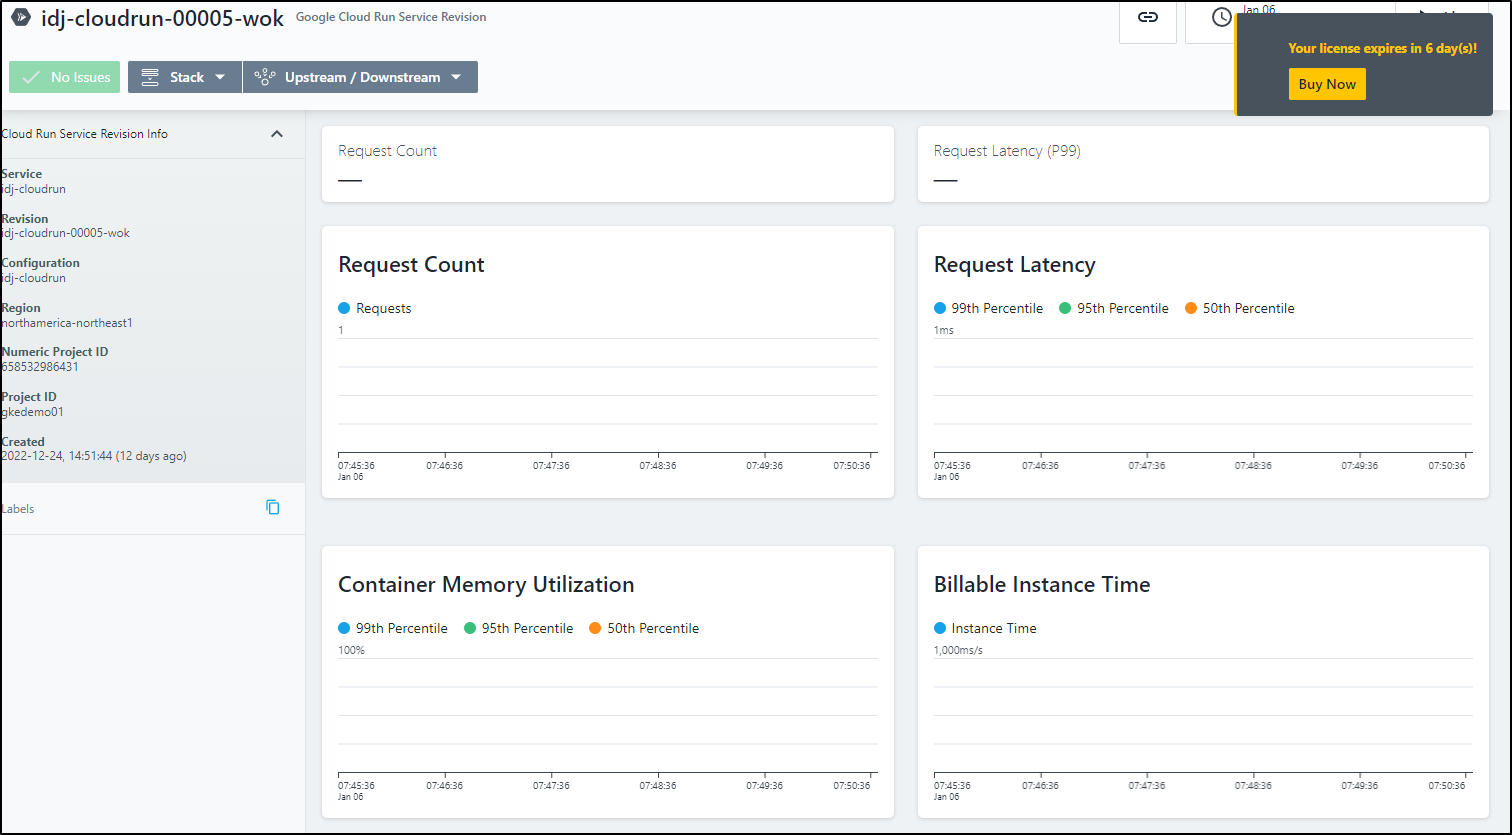
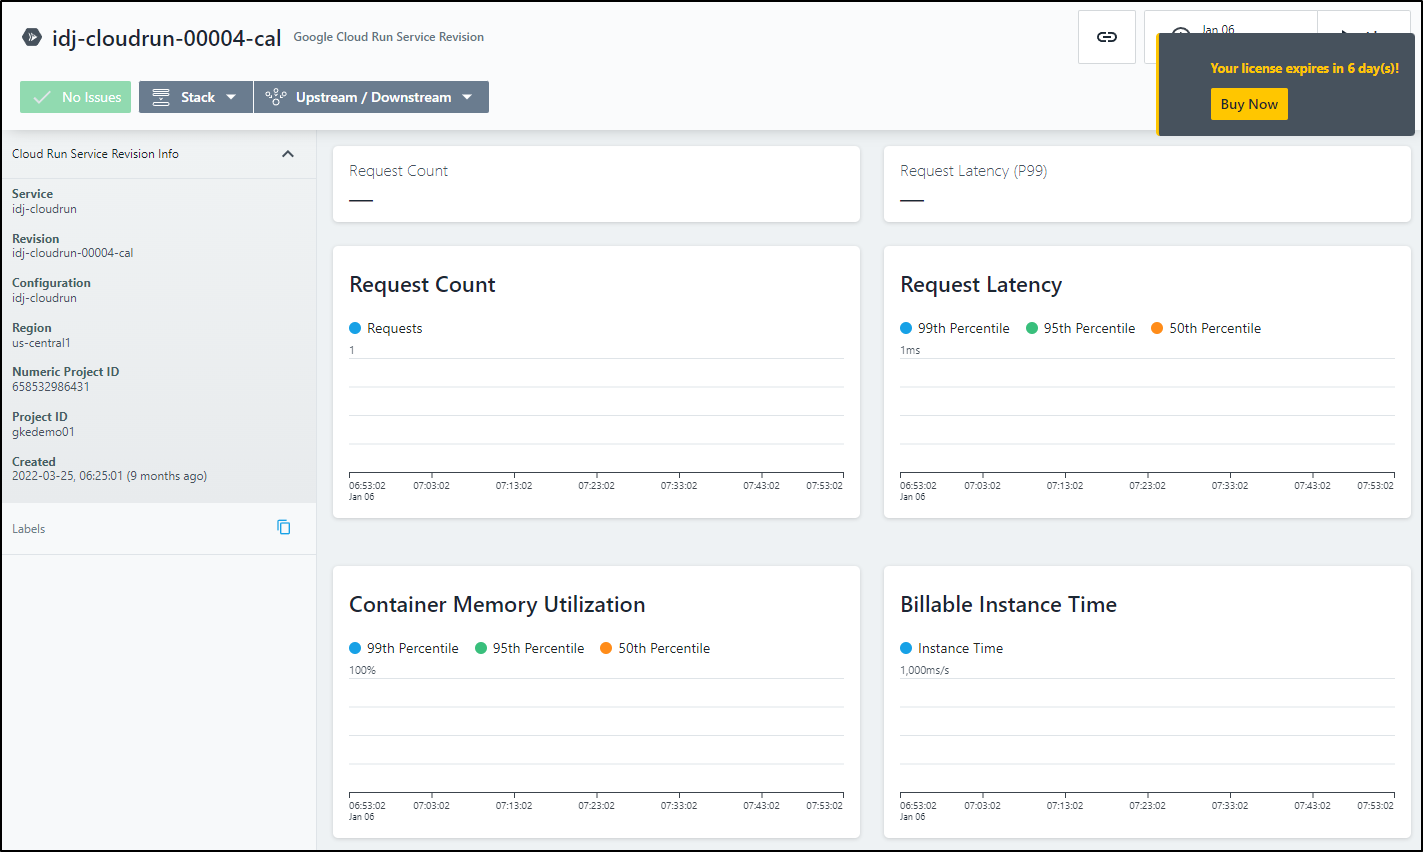
Cloud Run
I really only use Cloud Run when I deploy
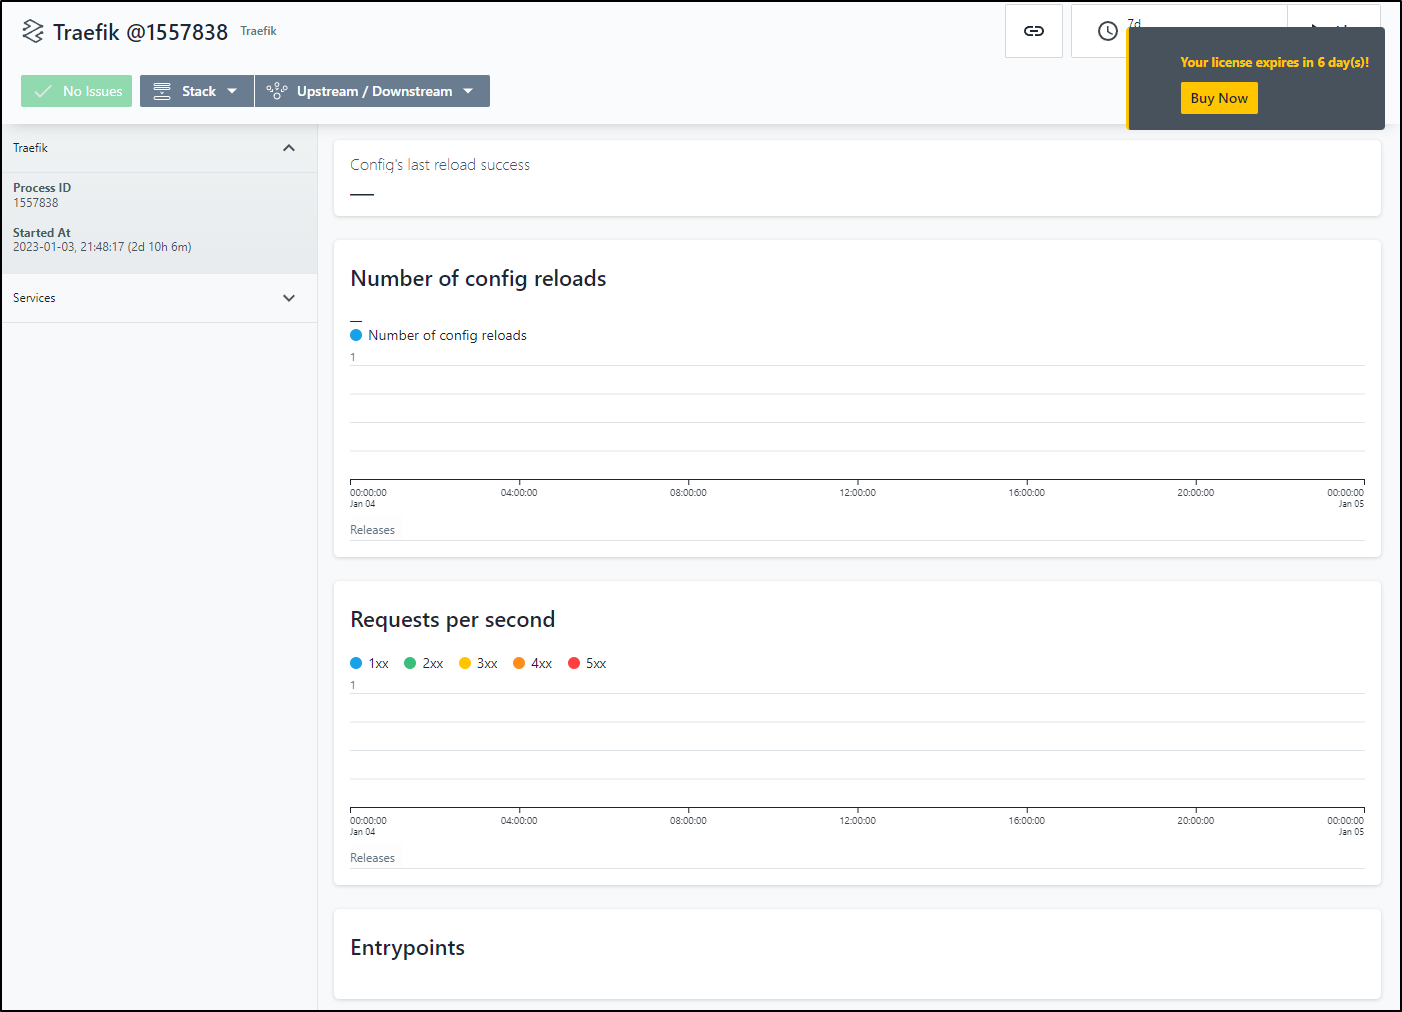
On Prem
Traefik
Monitoring Cloud SQL
Let’s say we have an active database in Cloud SQL
First, we need to create an Event tailored to that service. We could, of course, say “All” entities
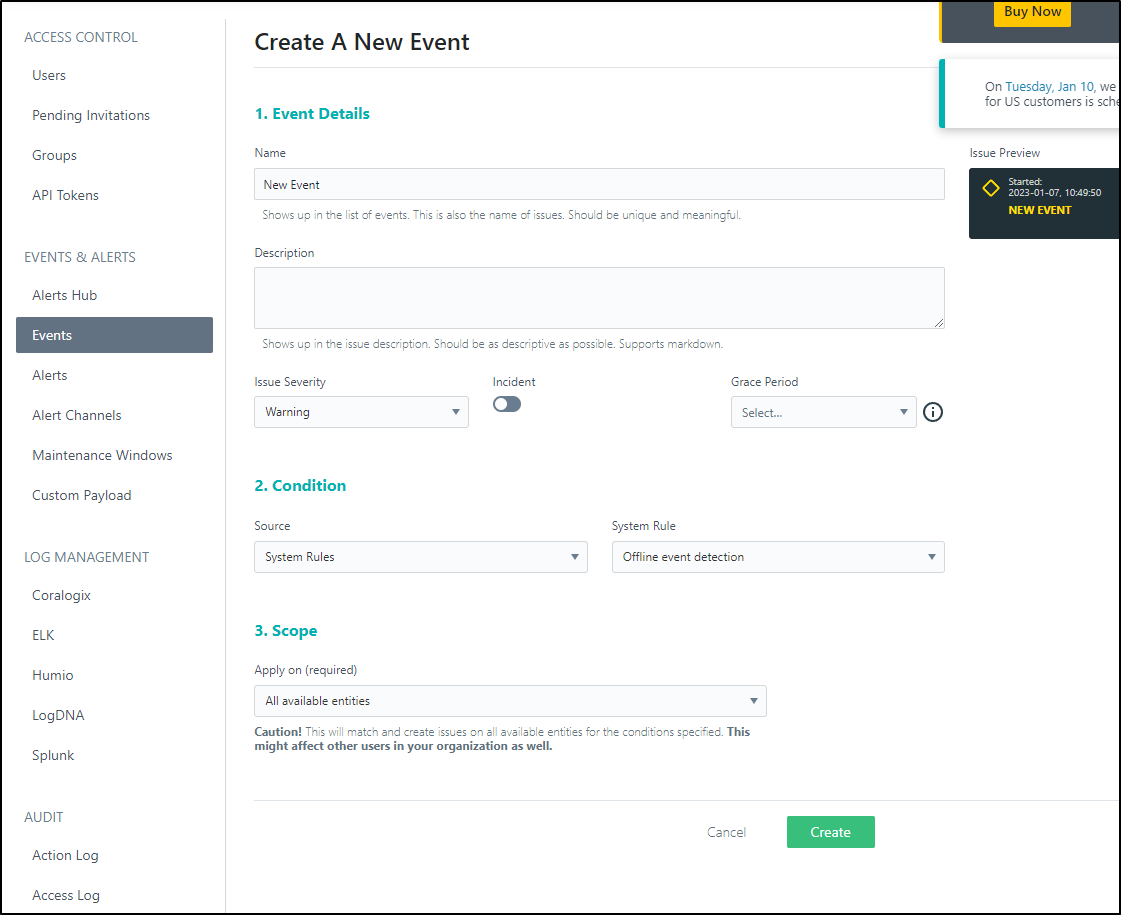
But I want to only alert on one particular Cloud SQL database
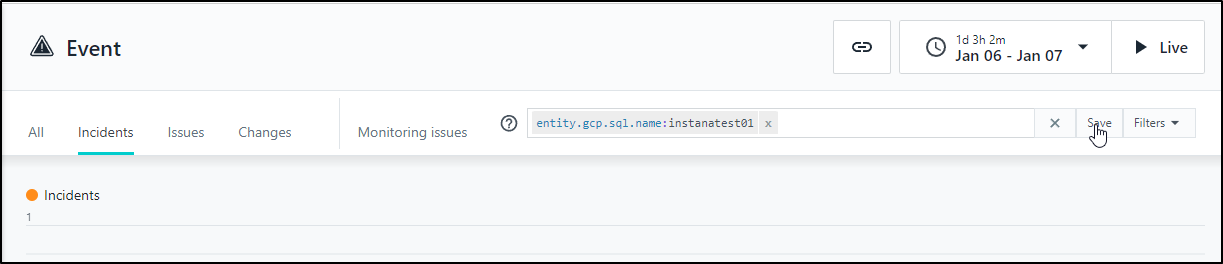
We’ll do Dynamic Focus and enter a query
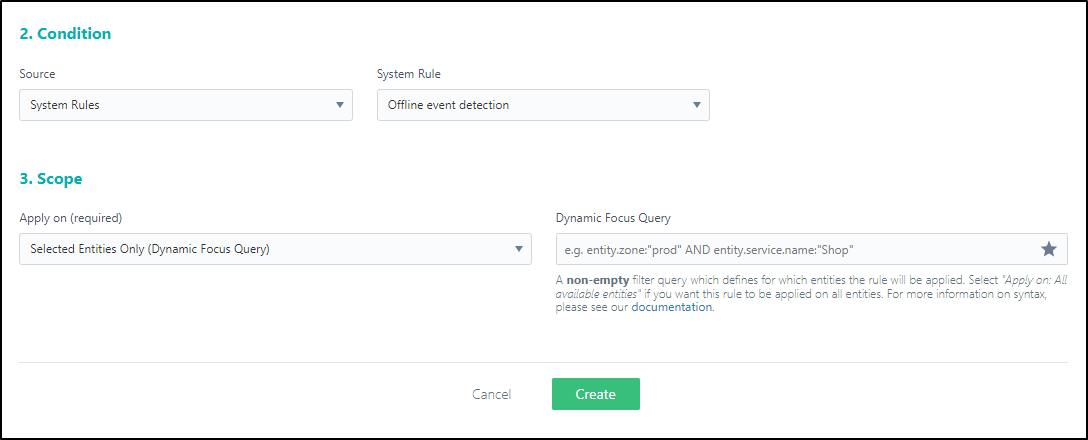
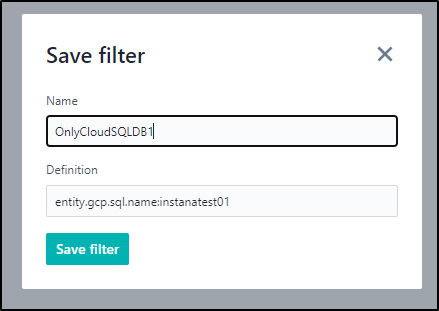
Sadly, this doesn’t have good context drop downs one might expect. I figured out my query in the Events section first
And then chose “save” and gave it a name
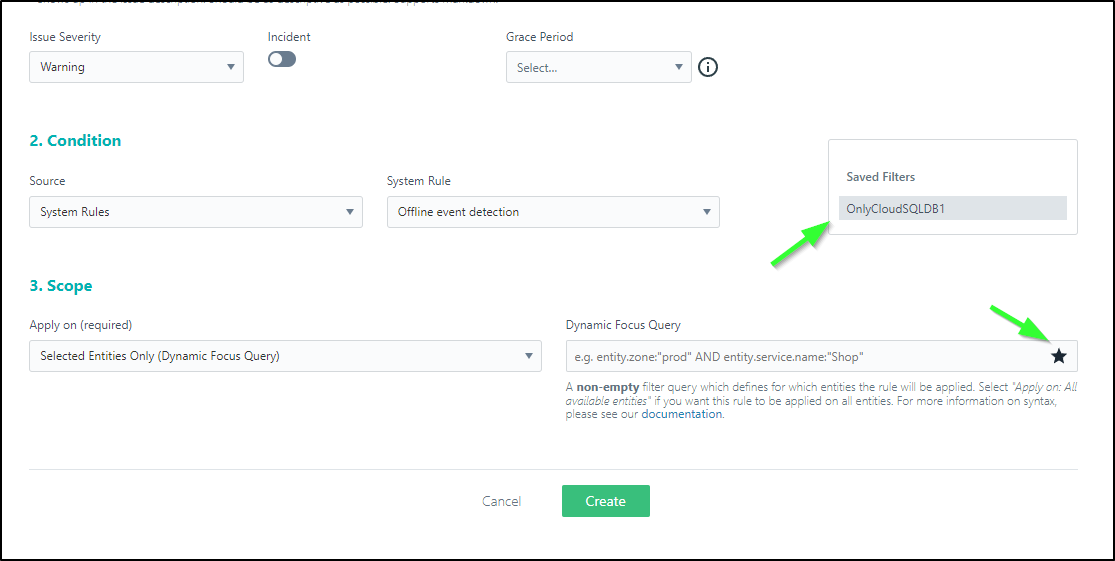
Back in the Query selection page
I could then pick my saved filter from the list
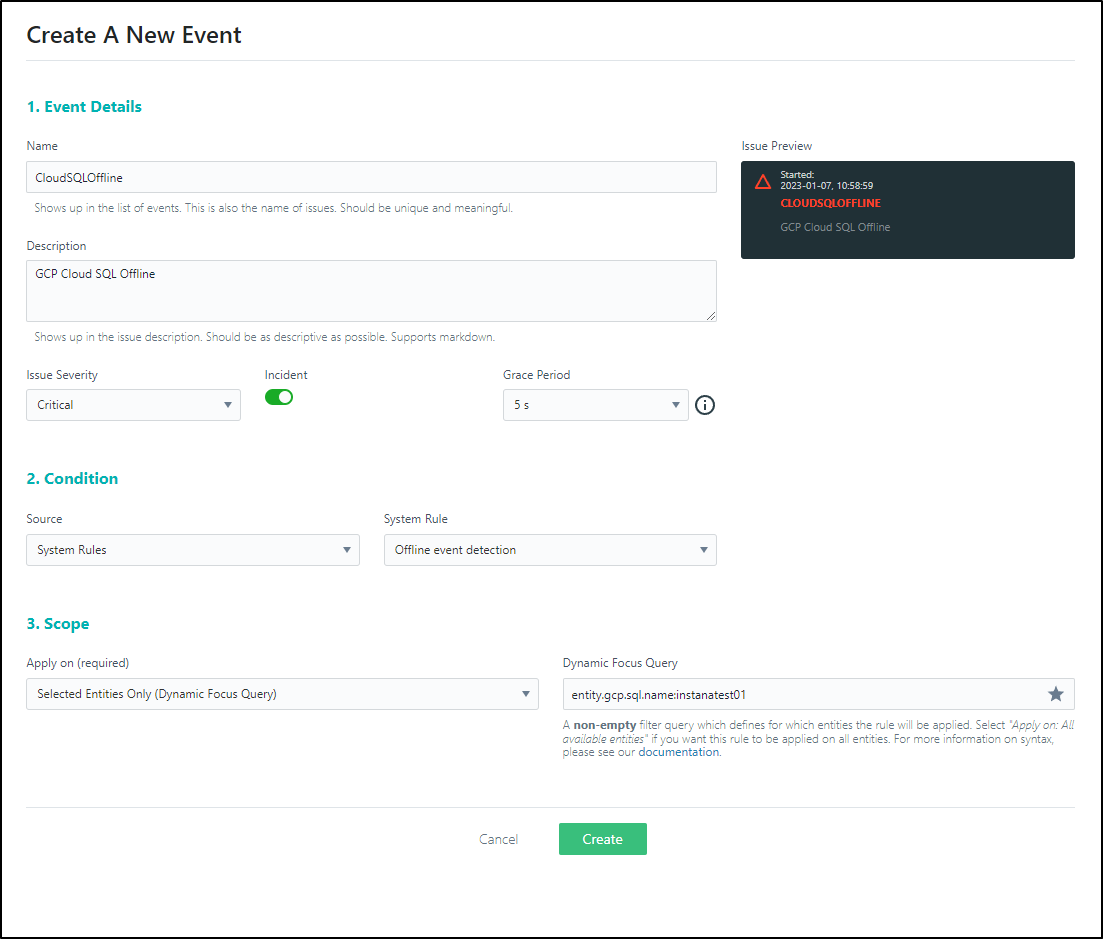
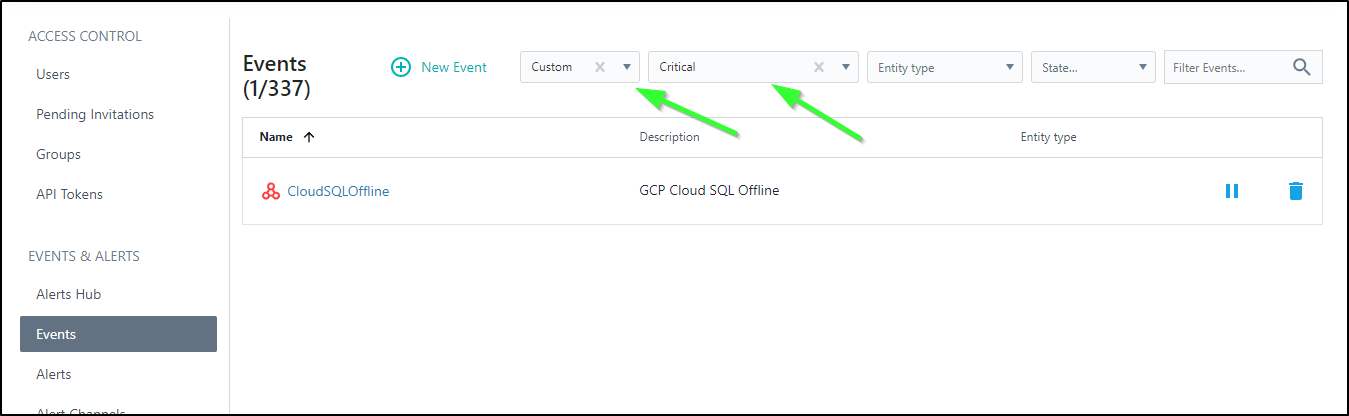
Then used it back on the “Create A New Event” page. I set the severity to Critical and indicated we want to make an incident out of it. Then saved the event by clicking “Create”
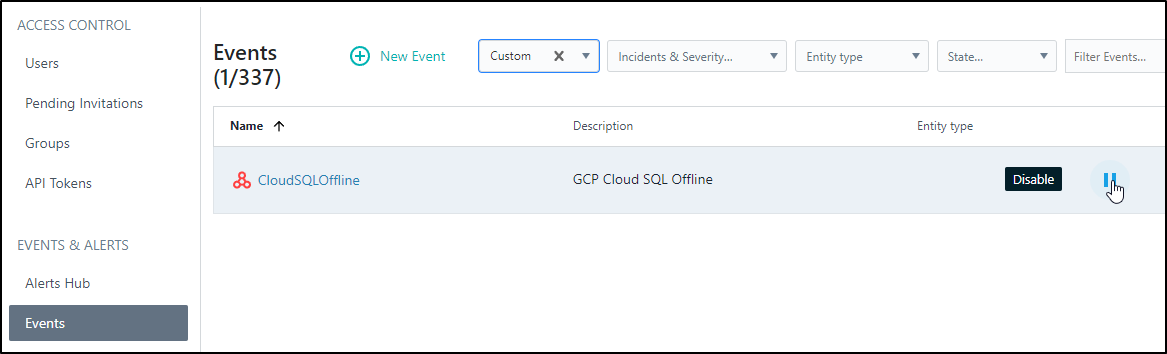
Now looking back at the Events area in “Events and Alerts”, we can use the “Custom” filter to find our newly created Event. This is also where we would delete or pause it.
Maintenance Windows
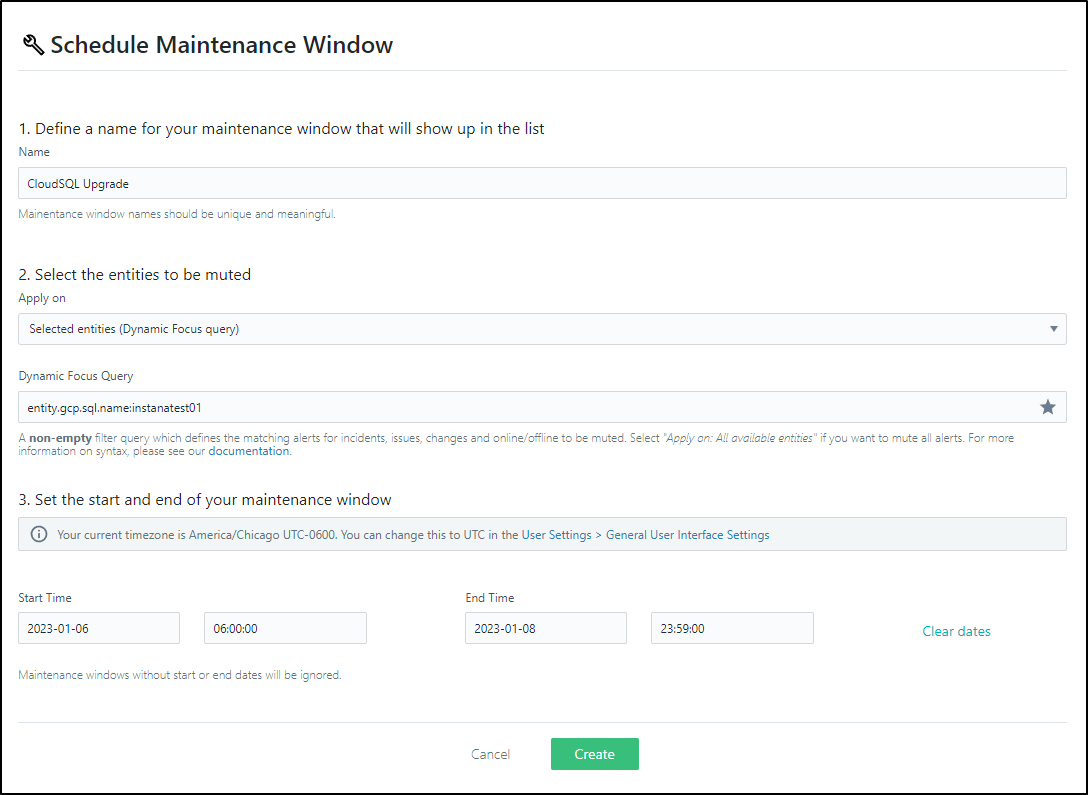
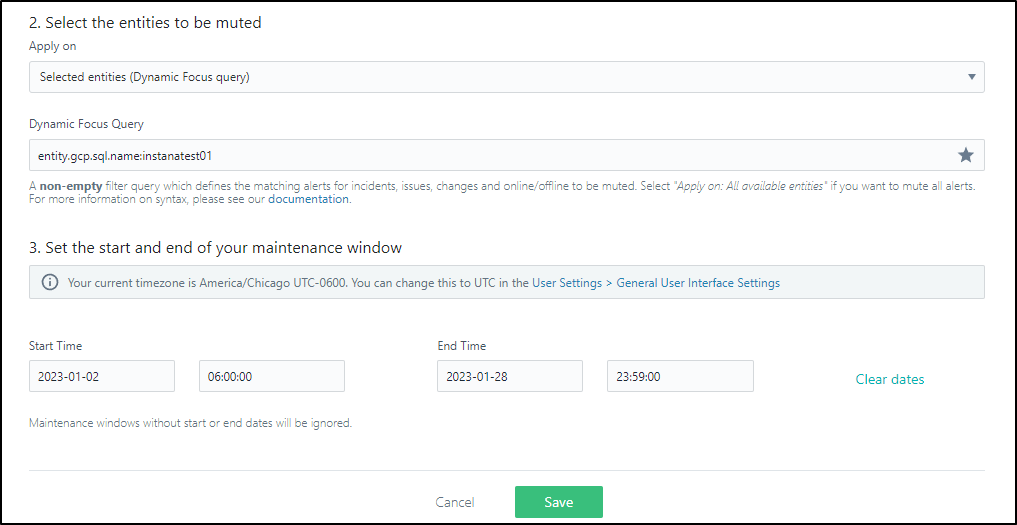
Say I was planning to intentionally take it offline - perhaps a major upgrade, scaling event, or DR exercise. We can use the “Maintenance Windows” area to mute alerts on an entity.
Just as before, I could mute on a predefined saved filter
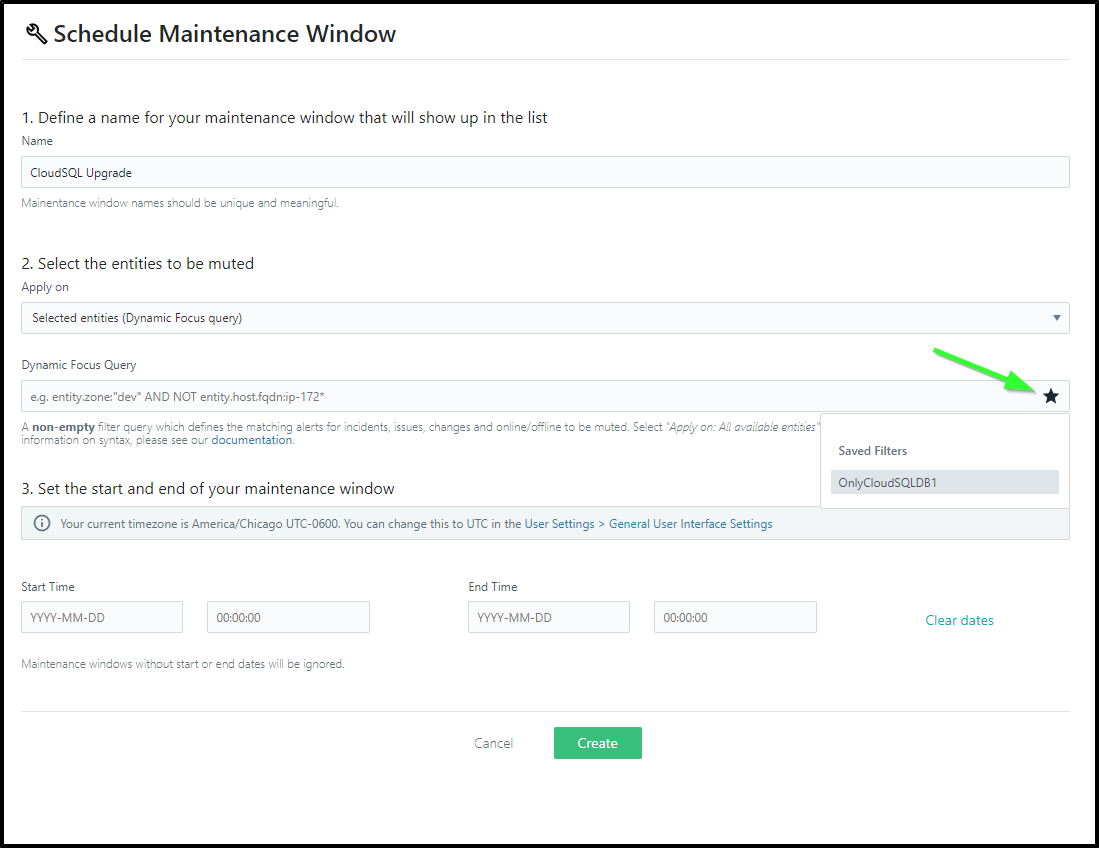
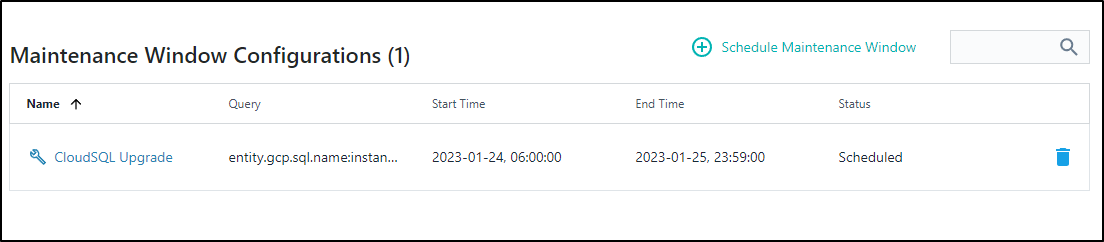
For instance, I may wish to mute over a whole weekend
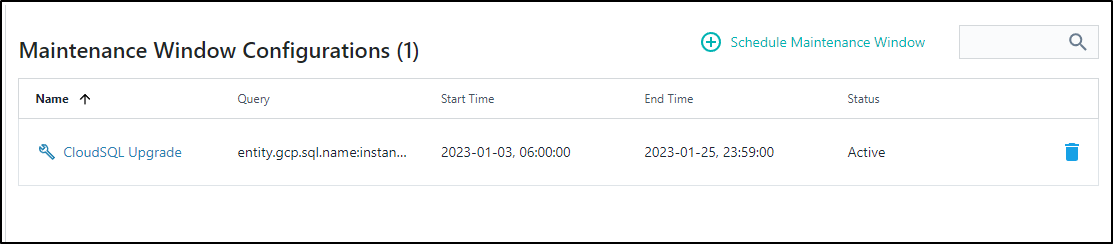
We can then view active Windows
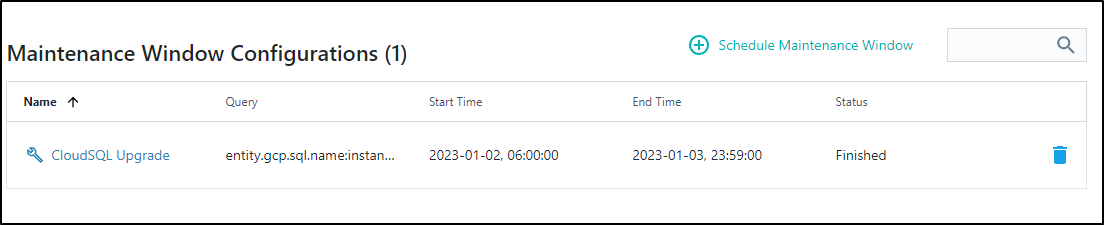
Future
And, of course, finished
PagerDuty
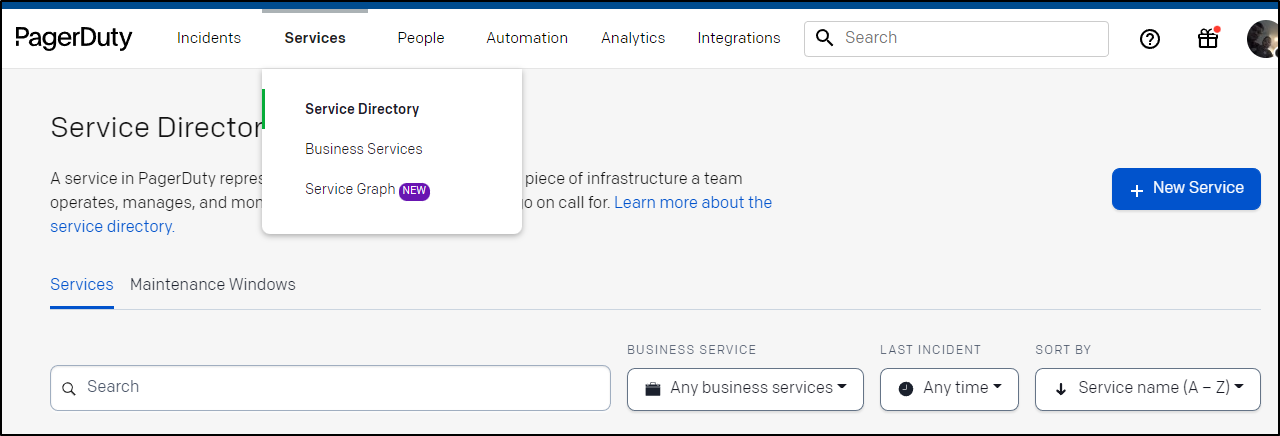
Since we plan to add a Critical alert, let’s add an Alert Channel for Pagerduty.
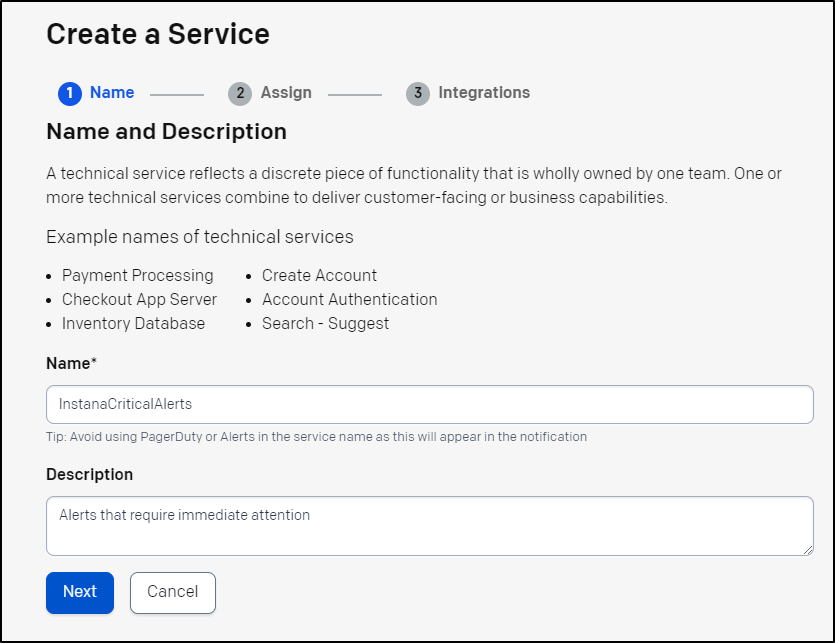
In Pagerduty, I’ll go to services and click “+ New Service”
I’ll give it a name
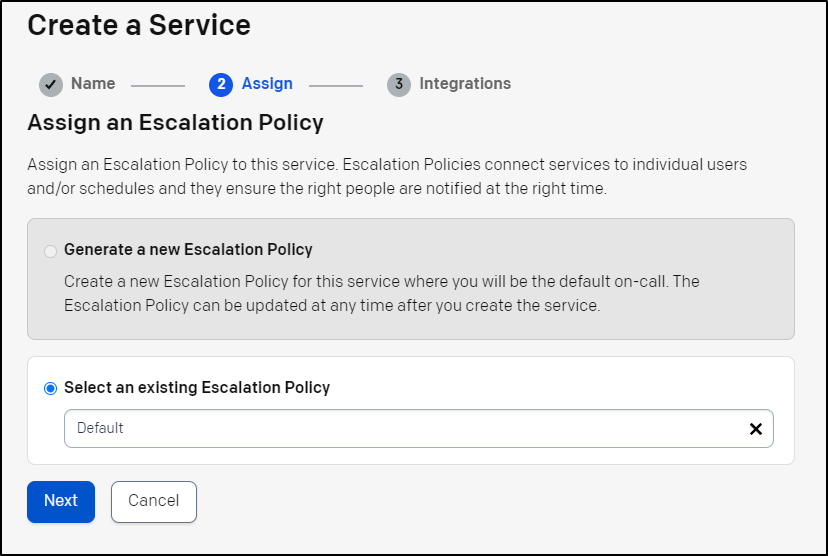
We’ll create a new or pick an existing Escalation Policy
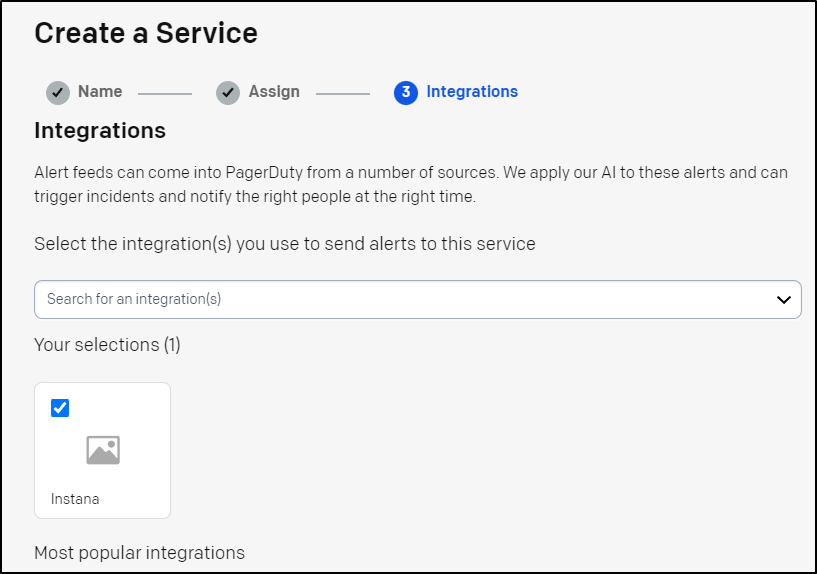
We can then search for and select the Instana Integration
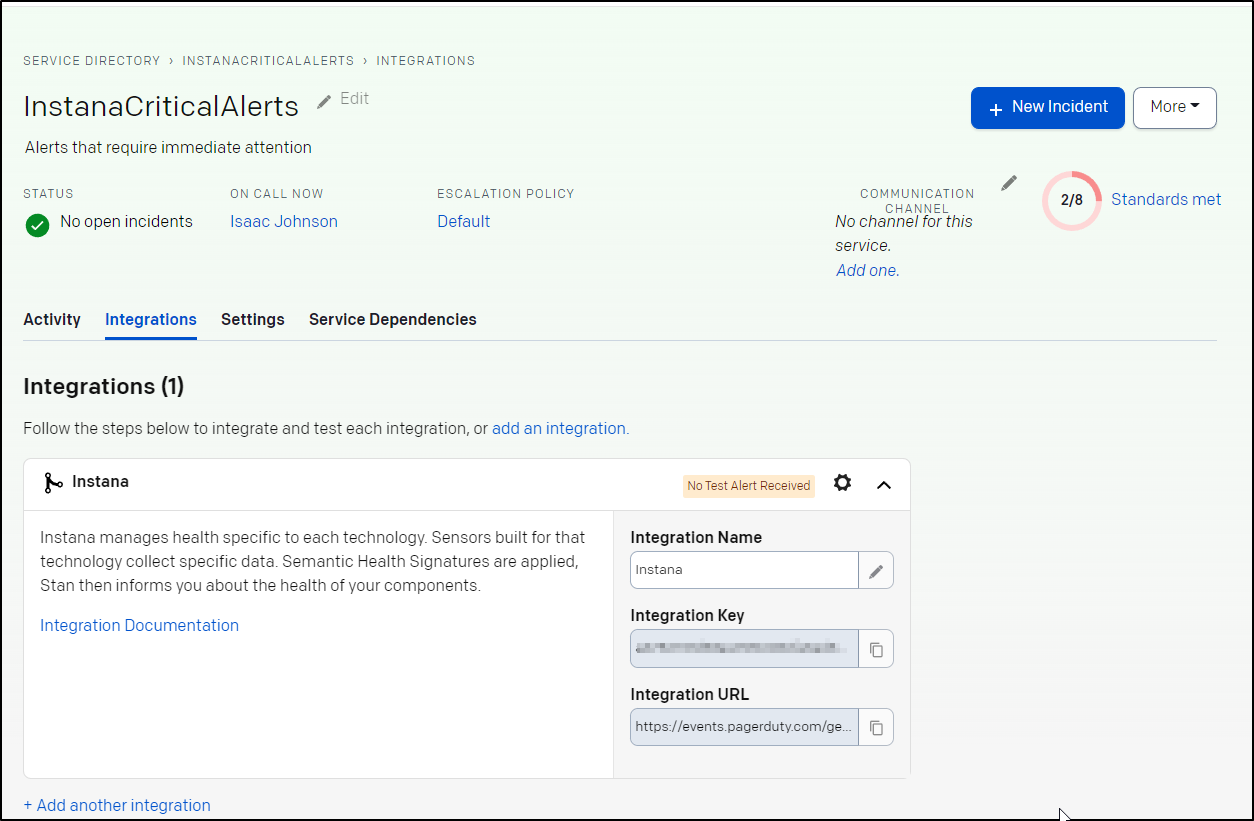
We now have a Key and URL to use for Instana
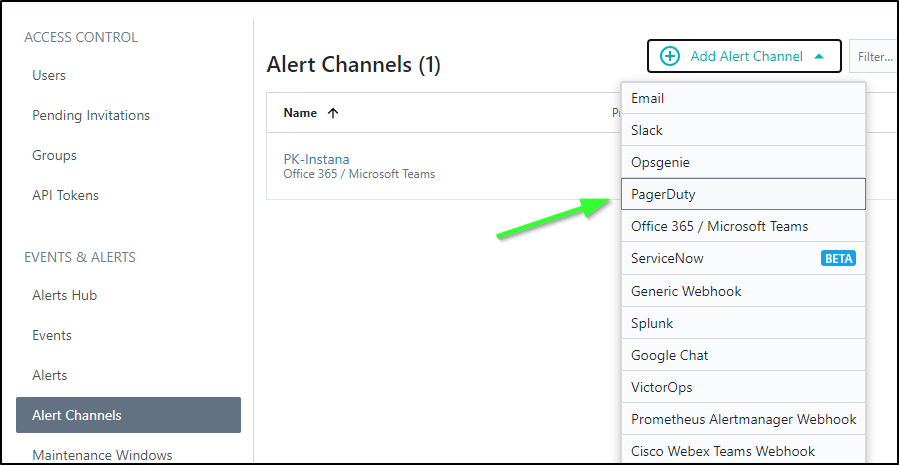
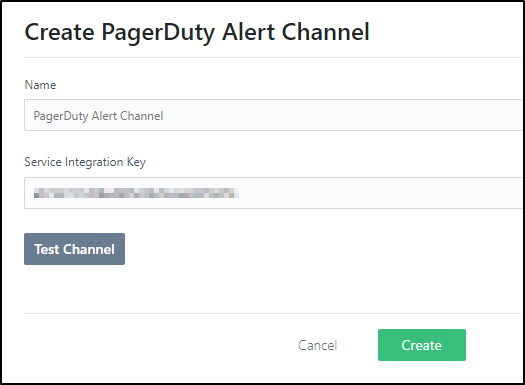
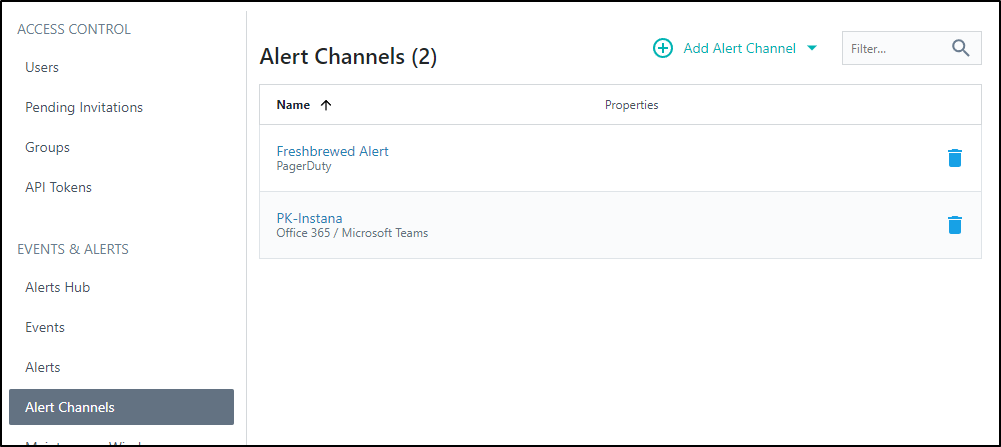
Back in Instana, we’ll add a new alert channel and choose PagerDuty
I’ll paste in the key and “Test Channel”
Clicking Test
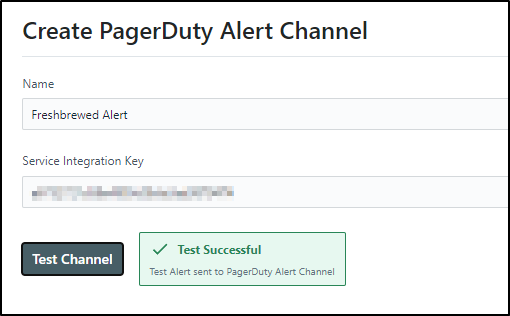
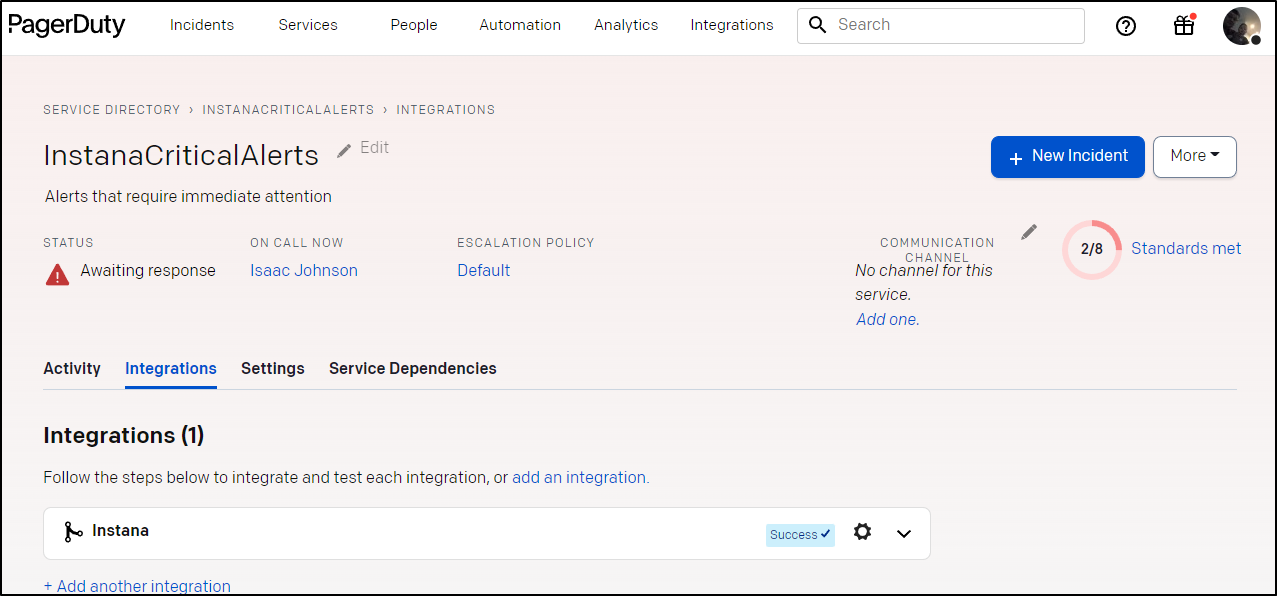
I clicked it twice as I didnt see any indication an alert was received on Pagerduty - I think this was a browser issue on my part. Refreshing the PagerDuty service page showed it to be successful (and now in Alert)
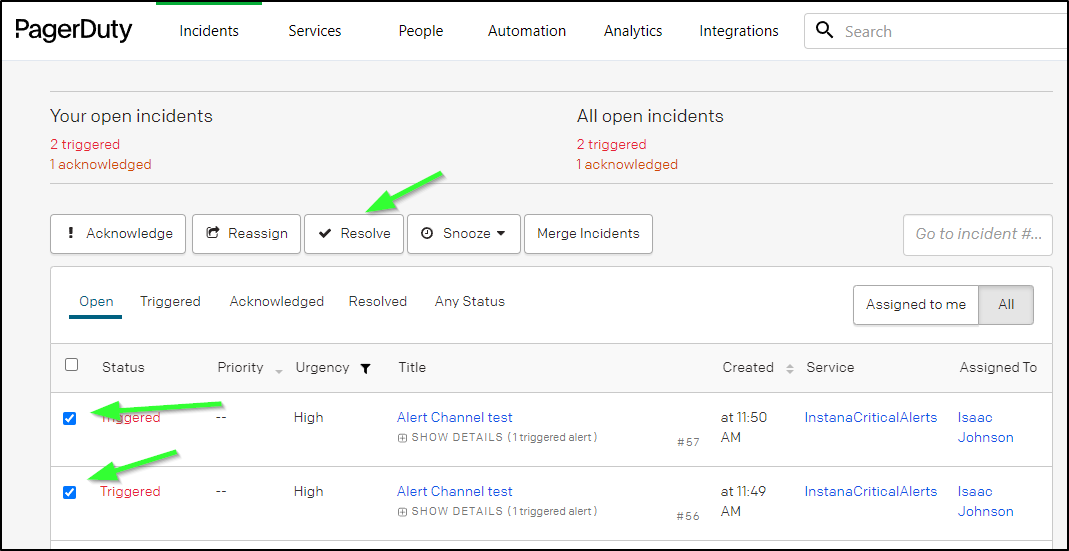
I went into PD and cleared (Resolved) the Incidents
Lastly, I saved the Alert Channel in Instana
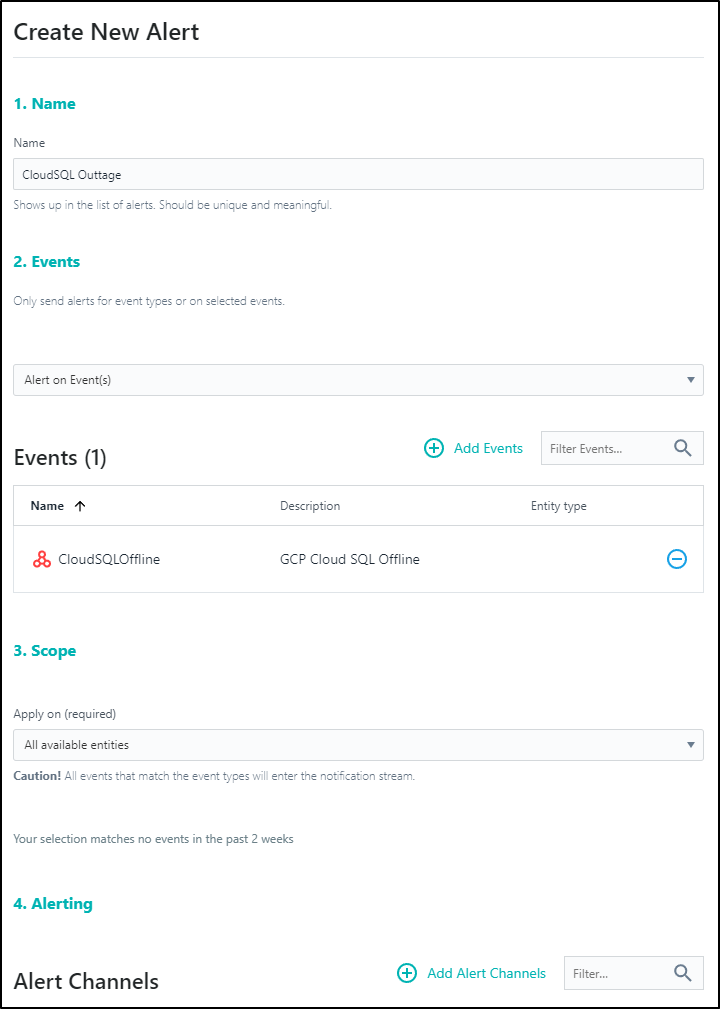
Tying it together. Let’s now create the Alert in Instana
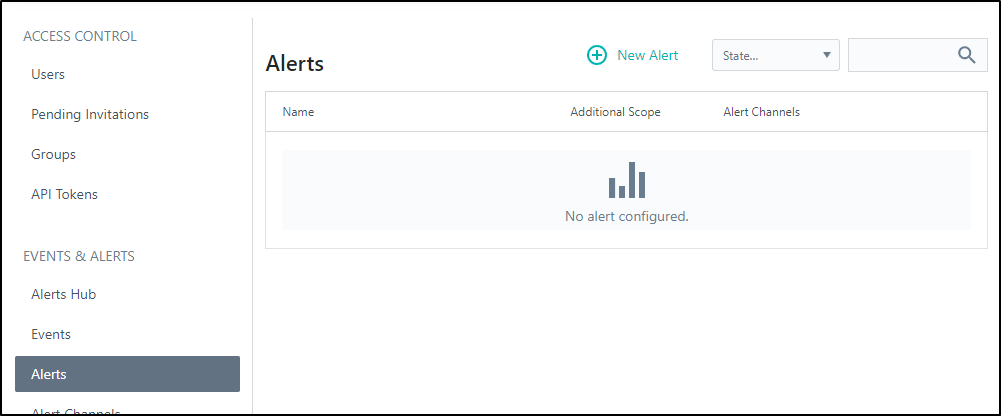
We’ll create a new Alert from the Alerts section
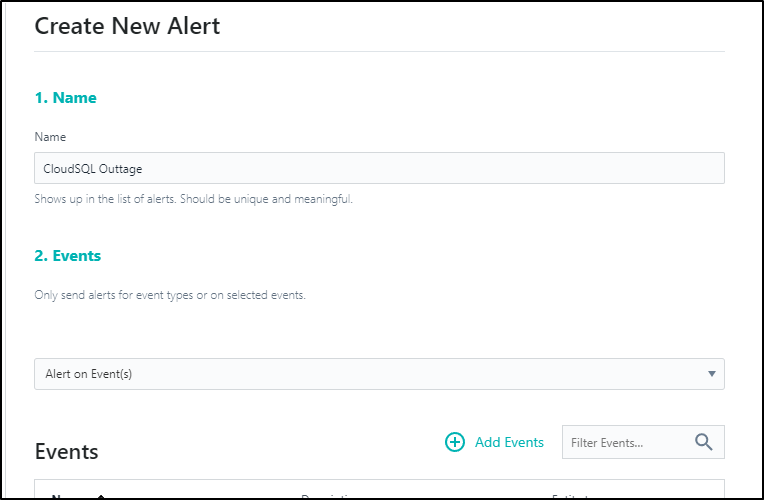
We’ll give it a name and choose “+ Add Events”
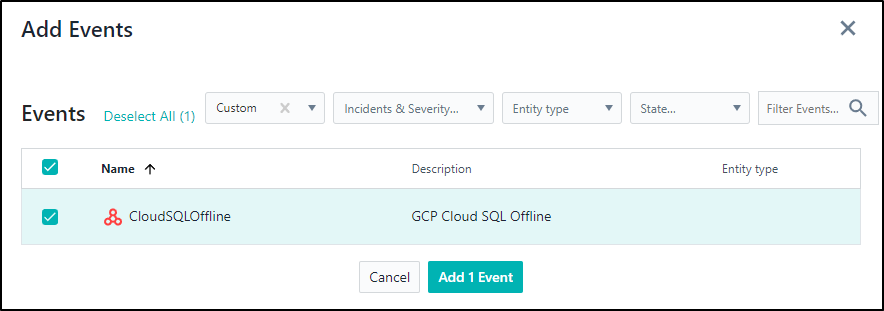
Here we can choose Custom and pick the “CloudSQLOffline” event we defined earlier
Because my Event is already scoped to just CloudSQL, I do not need to add yet-another scope to the alert. The use of that Scope would be if we had Events for Any GCP SQL outage, but then I wanted to, perhaps, only trigger PDs on those with a “Production” tag.
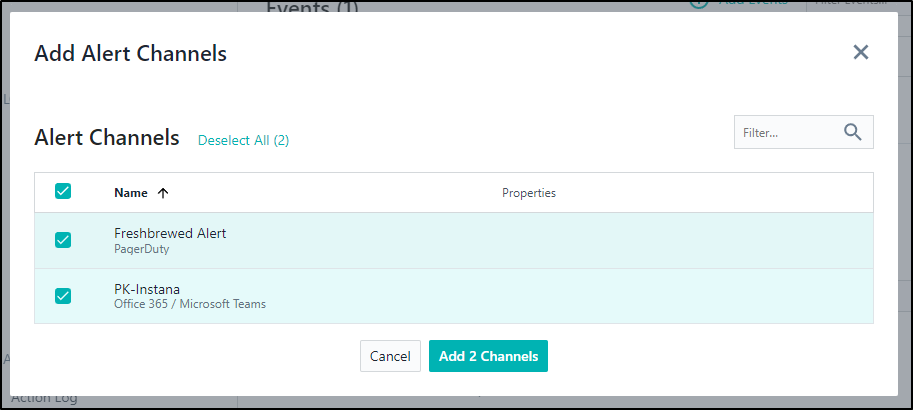
We’ll choose “All available entities” on scope, then click “+ Add Alert Channels”
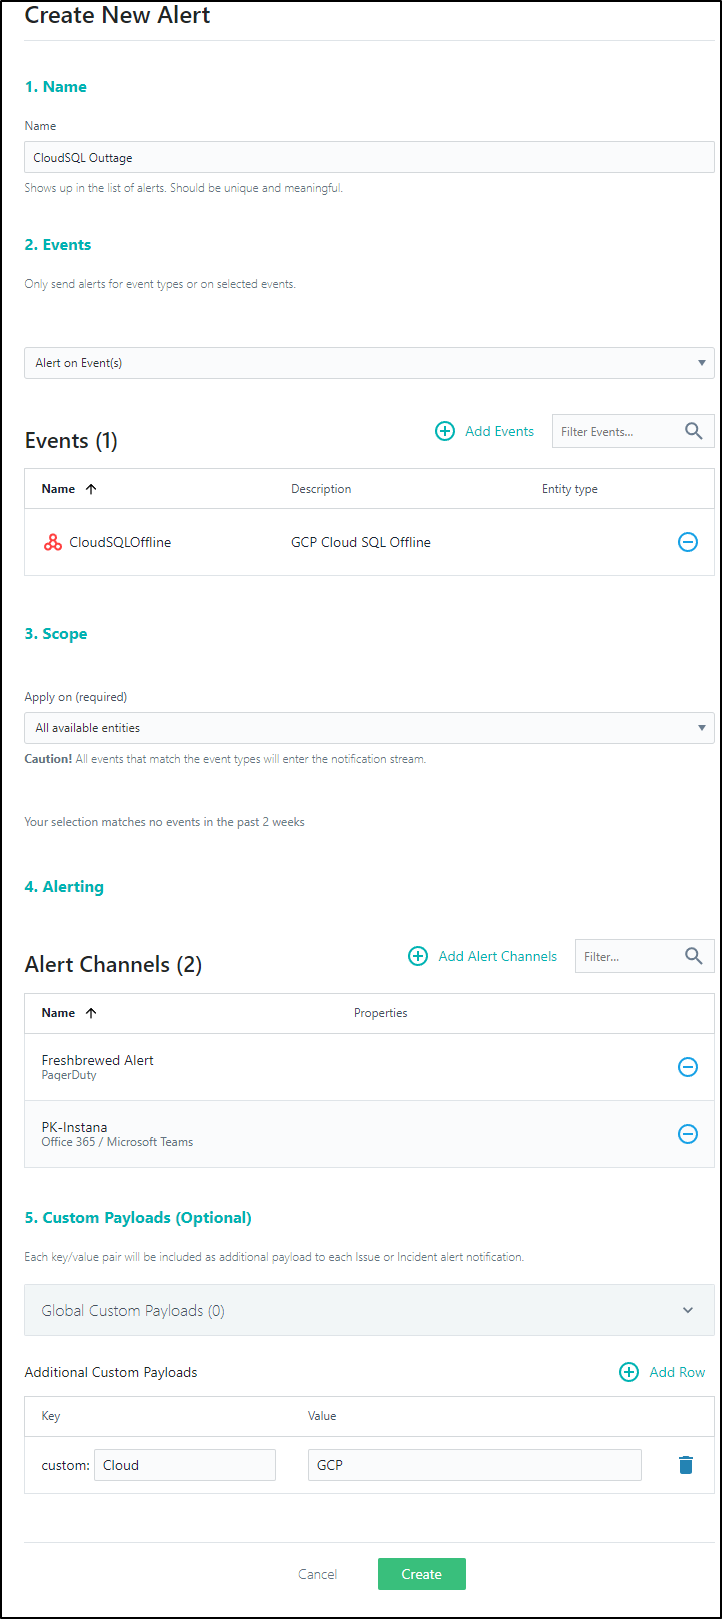
In this case, I want to alert both my Teams channel and PD
Lastly, I’ll add a custom tag for Cloud and create
Testing
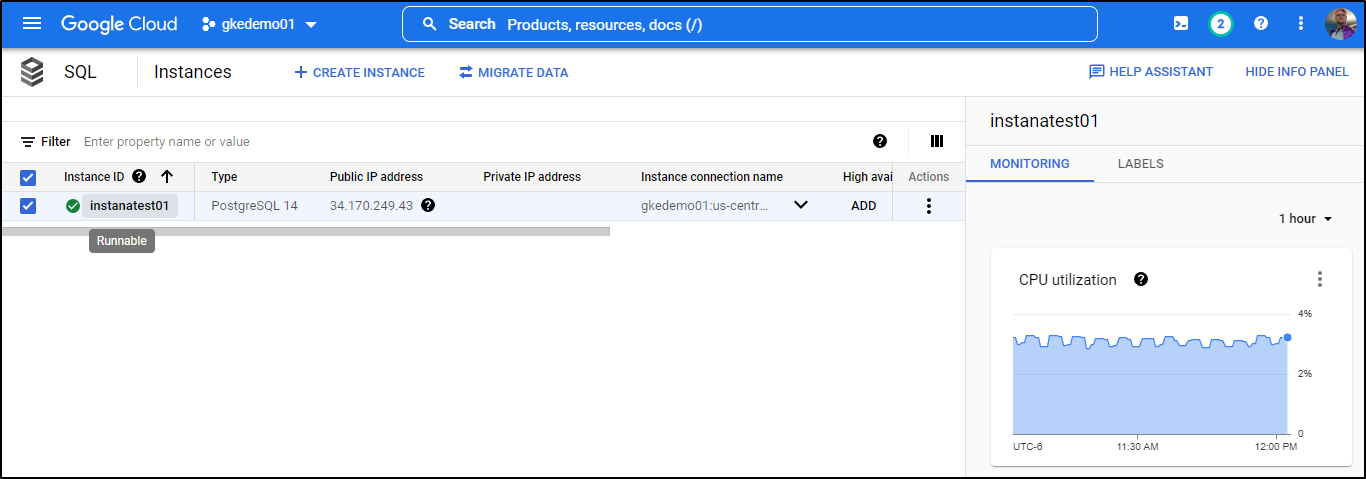
Let’s go delete our CloudSQL, both to save money and to see the Alerts kick in.
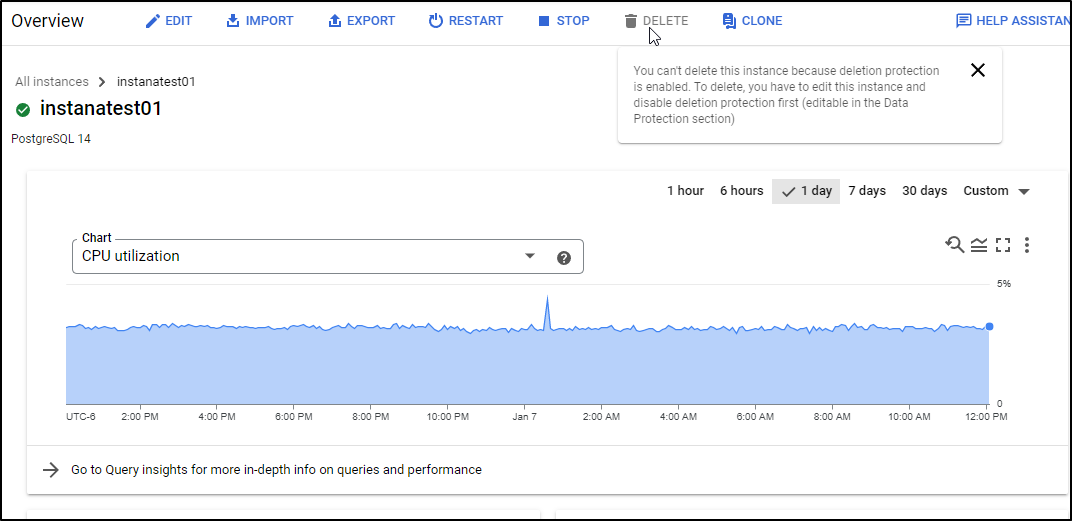
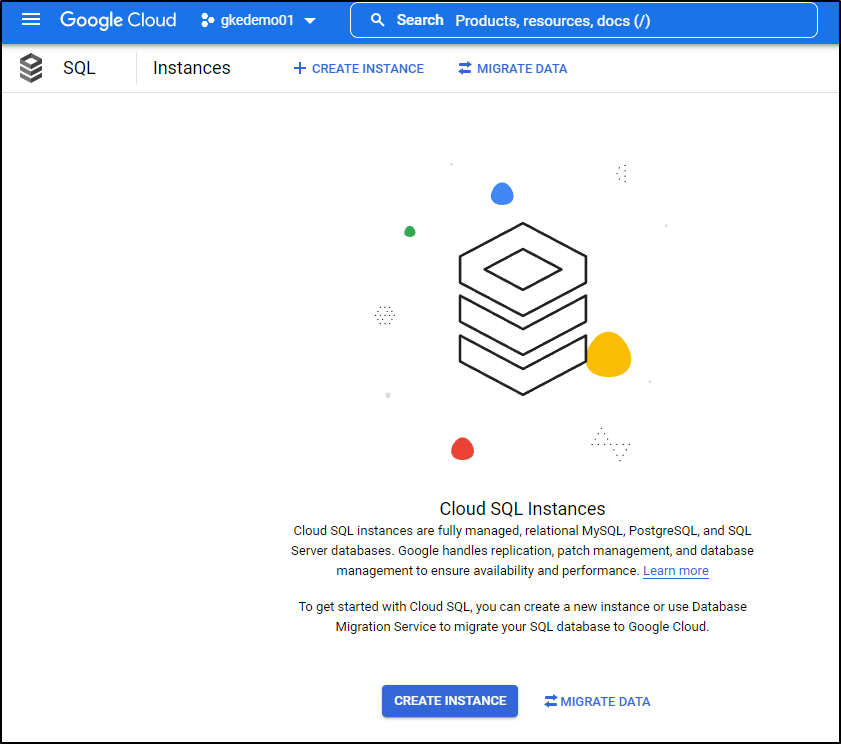
We’ll go to the GCP Cloud Console and find our instance
We cannot delete because of a Data Protection flag we left in at create
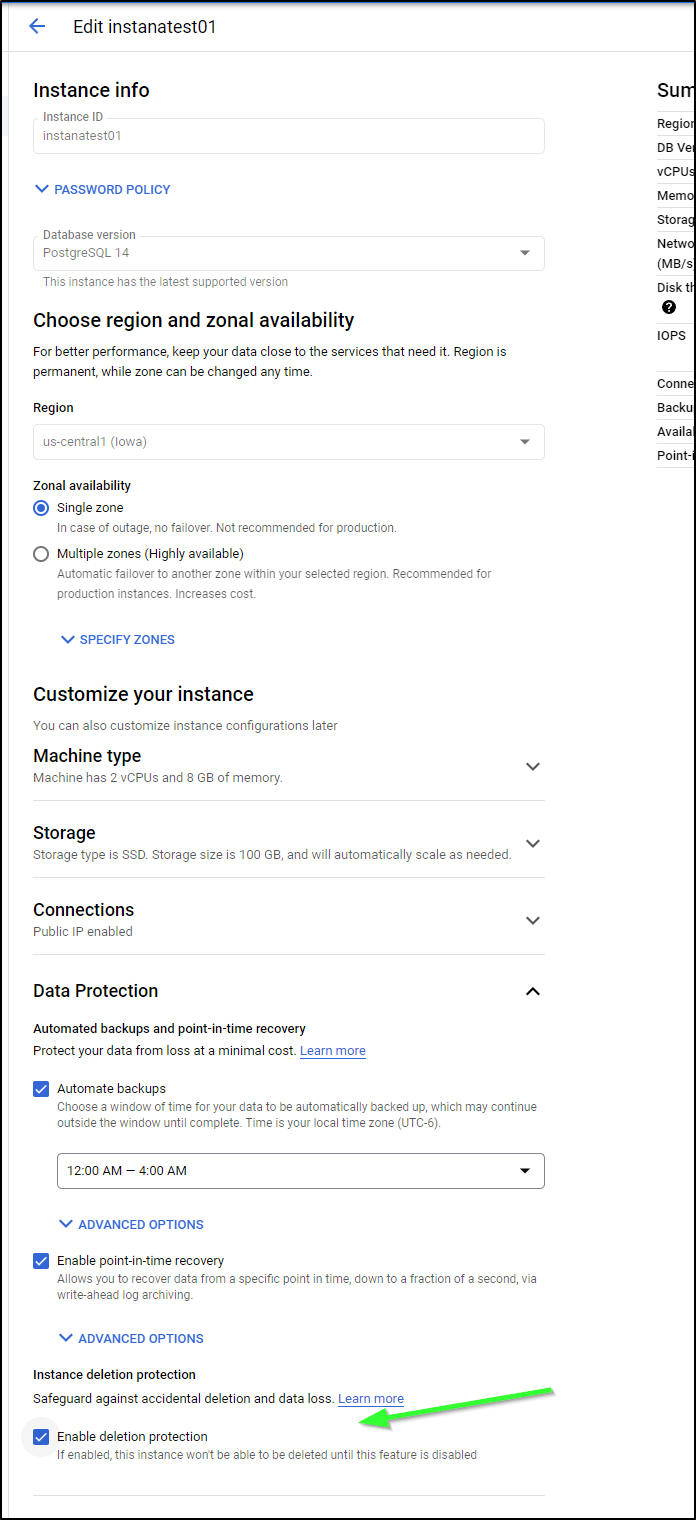
To clear that, choose Edit. Then uncheck the Delete protection checkbox and save
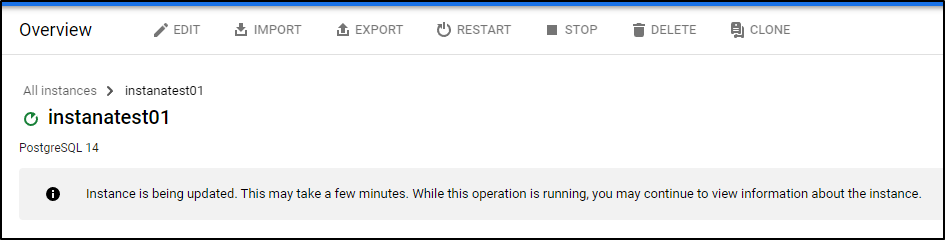
This takes just a moment to update
And now we can delete
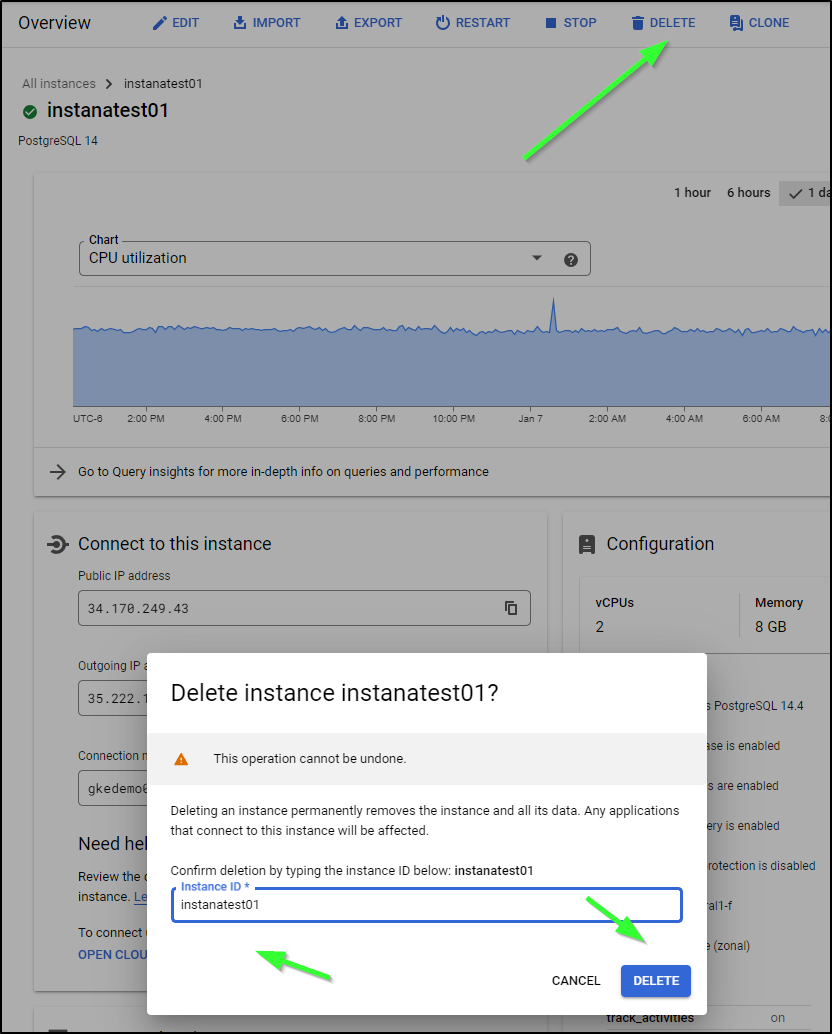
Deletion is practically instant
Within 7 minutes, I saw PagerDuty go off
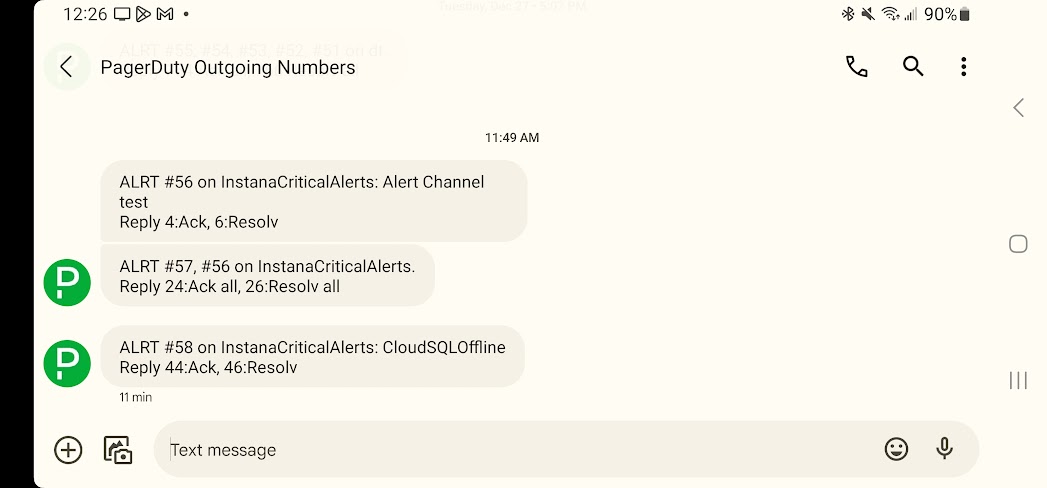
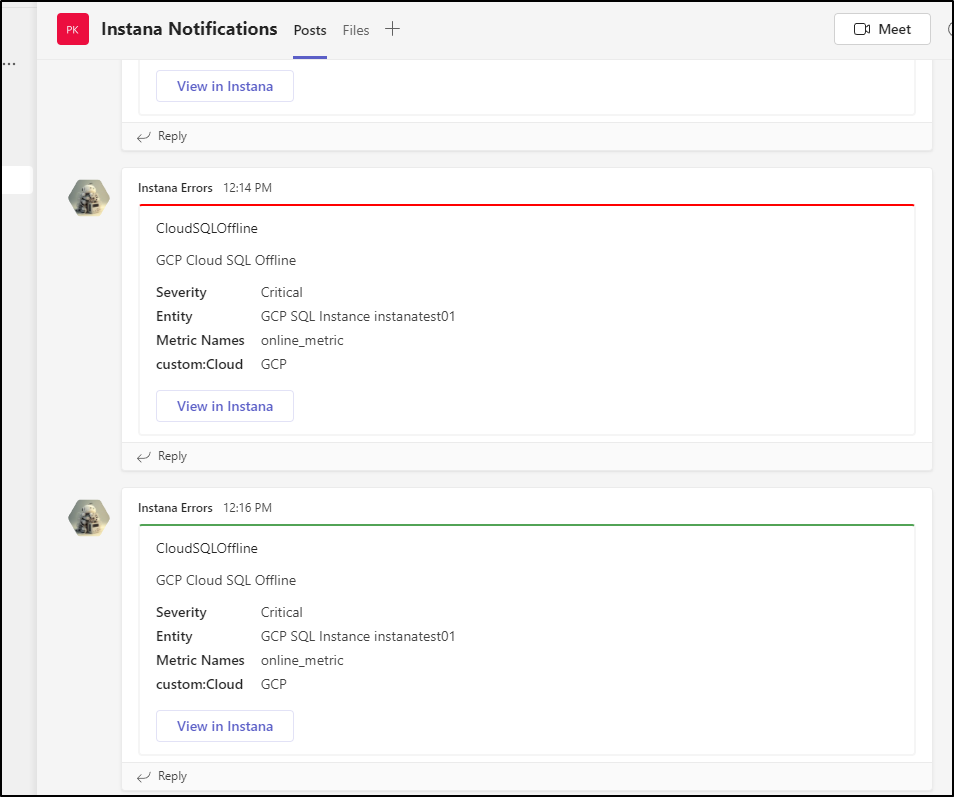
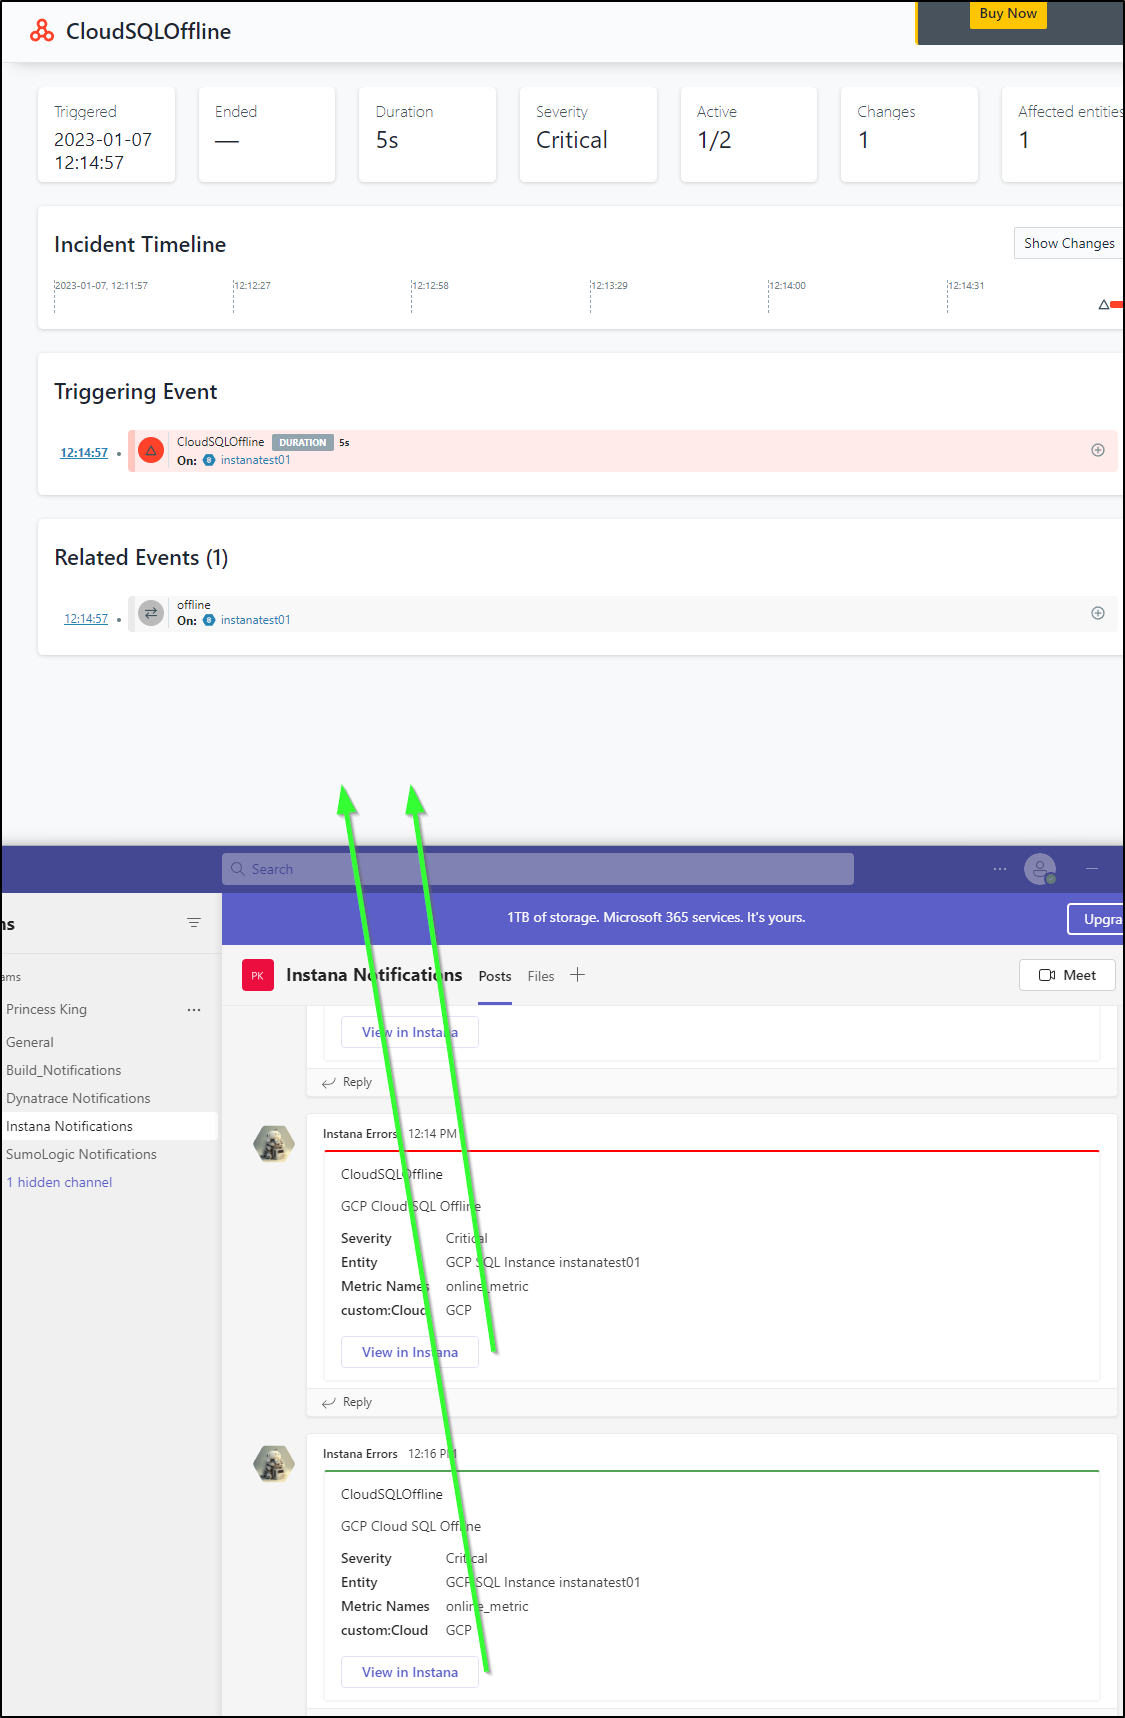
As well as alerts in Teams
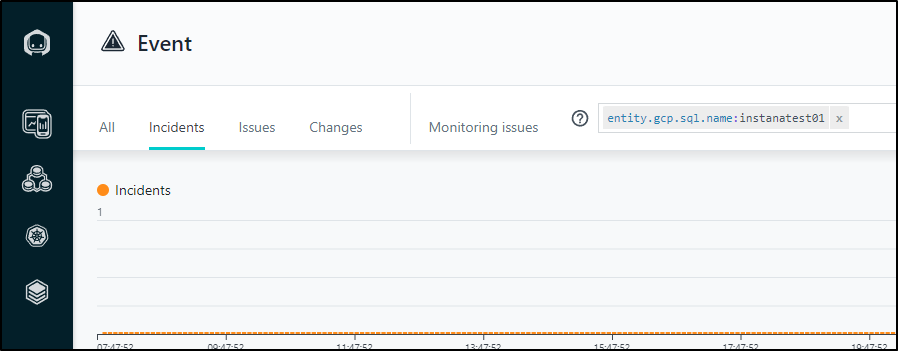
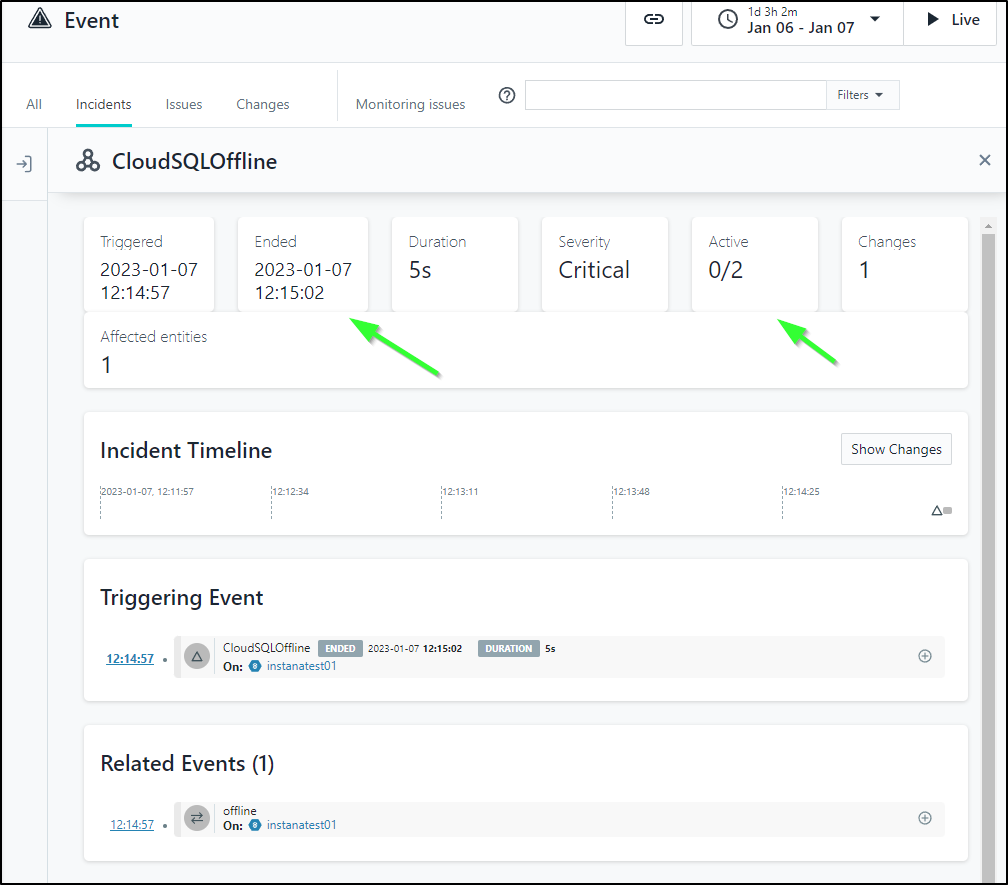
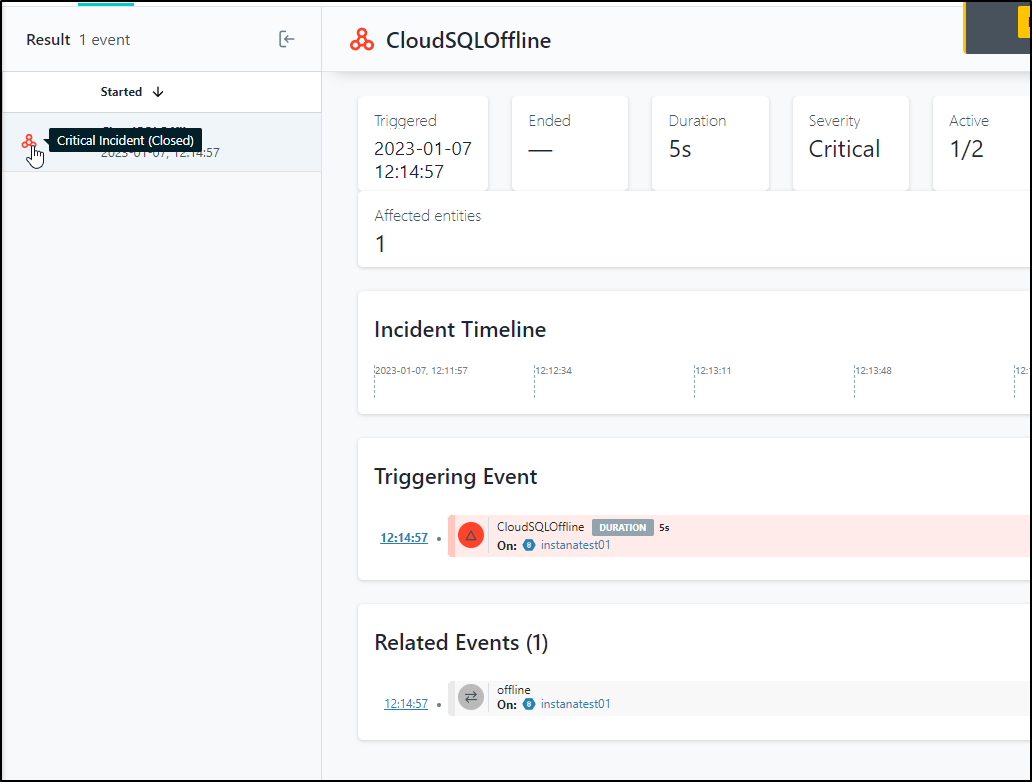
We can see the triggering event in Instana in the “Event” section
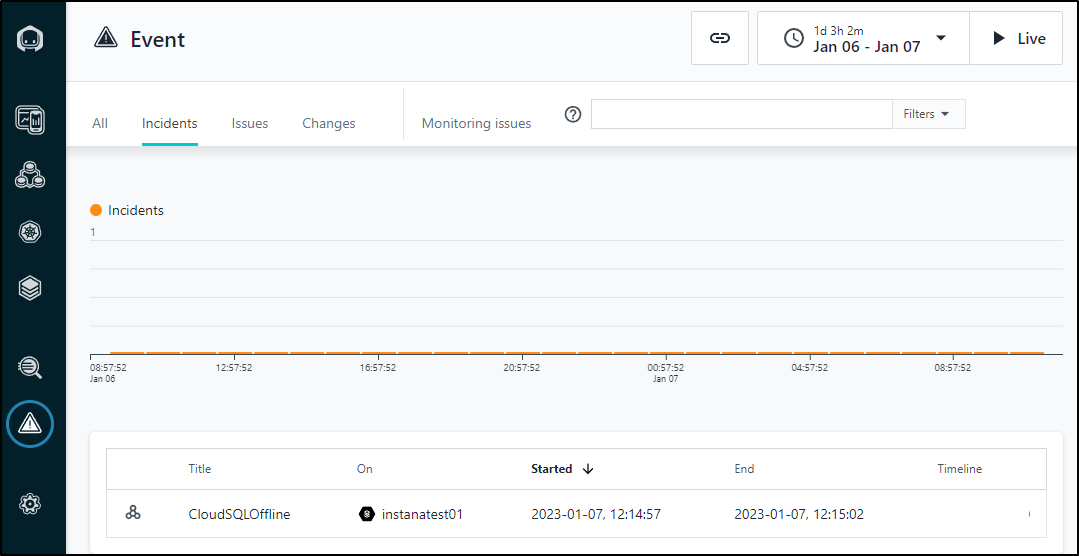
The details show it was triggered, but also that it ended within 3 seconds, which seems a bit odd. Perhaps it’s just how it indicates an event
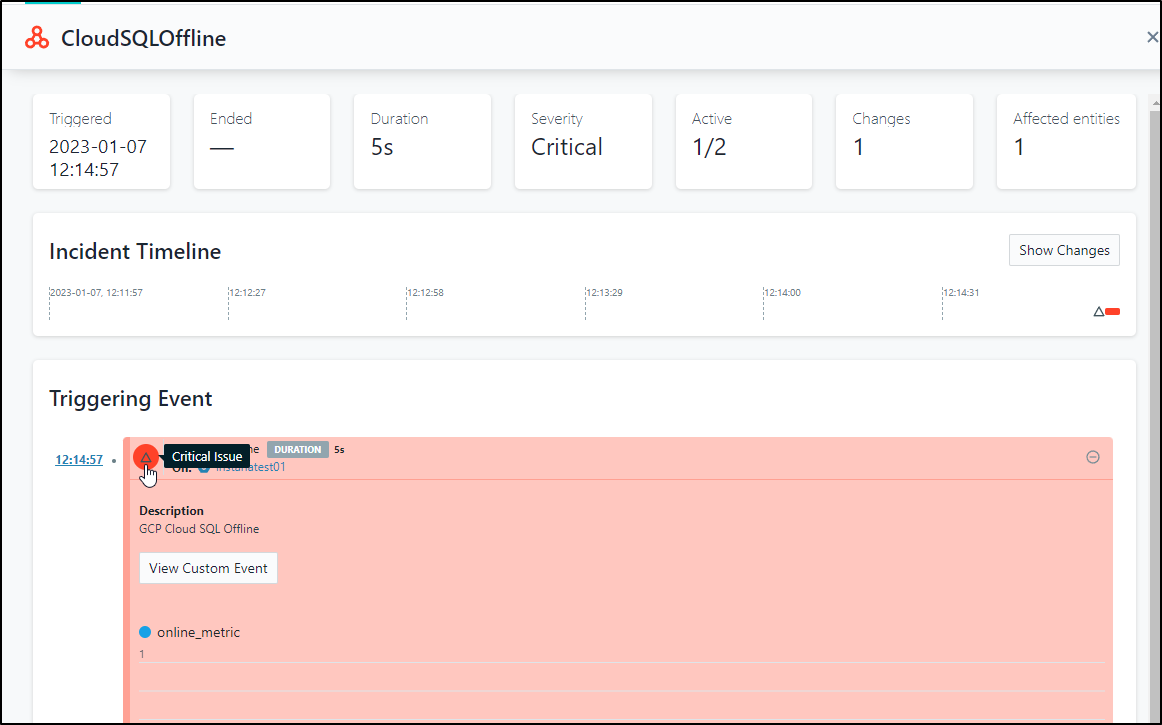
However, when I clicked the icon, it changed it to an active critical issue
I was then curious if adding a maintenance window (retroactively) would have any effect
It did not. Also, I found the link (green) from Teams takes me to the event (I marked it critical)
Since I now no longer want to be alerted, I’ll double check the Event is indeed closed
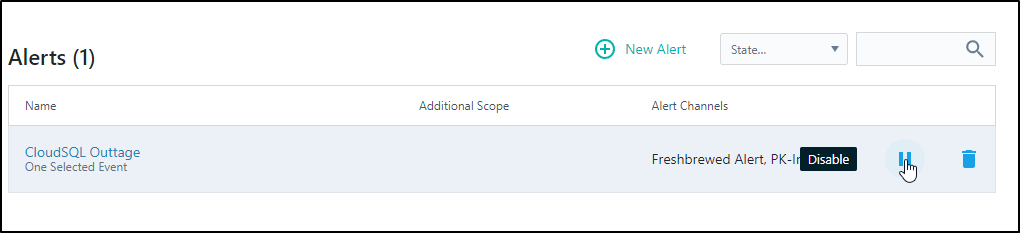
Then in the Alerts, I’ll mute this one
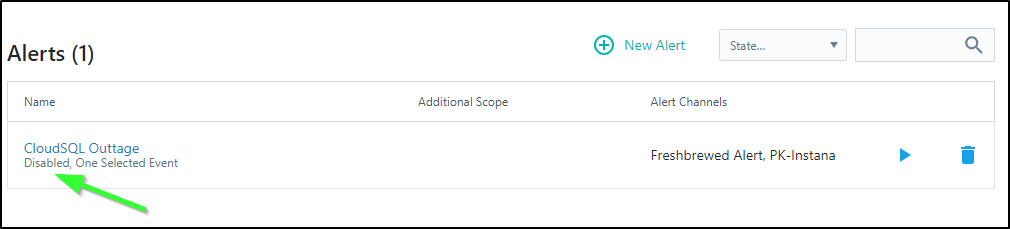
Which I can now see is disabled
I could disable the Event, but I want to continue to collect metrics, so I’ll leave it active
The other options would be to delete the alert channel to PagerDuty
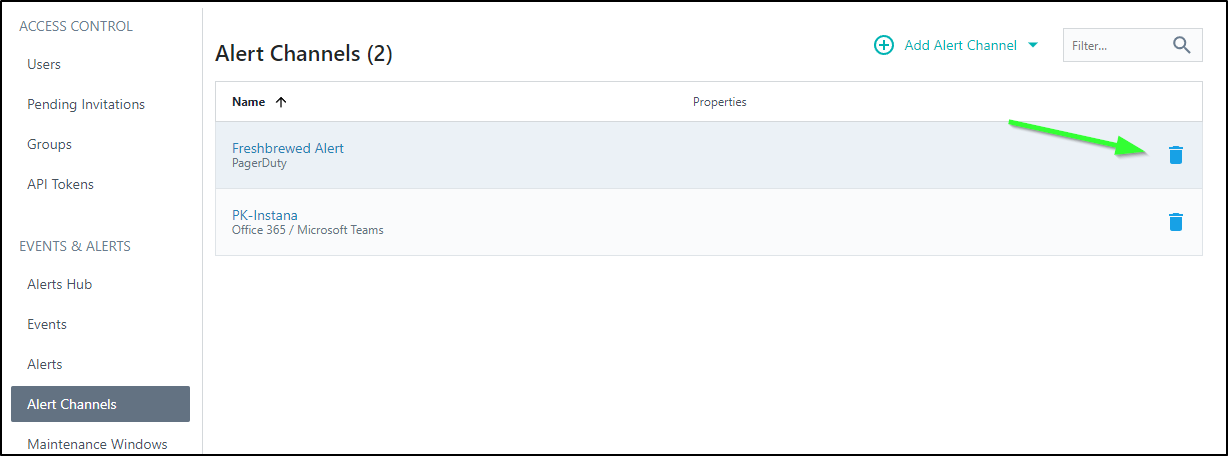
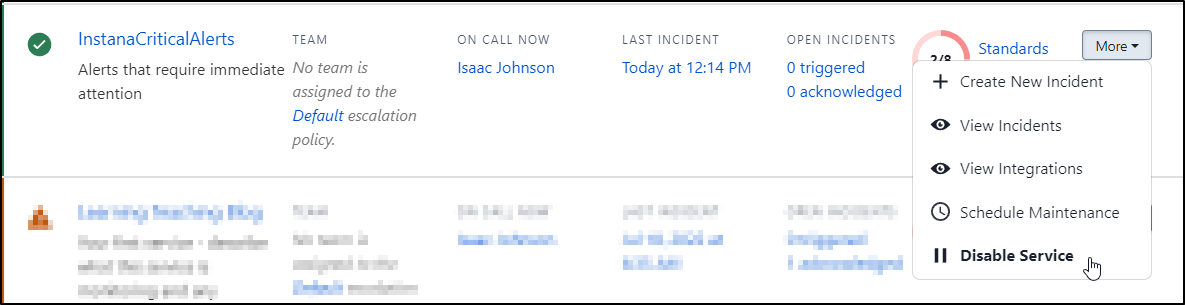
Or disable the service in Pagerduty itself
Buy Now
I should say that I did see the Buy Now take me to the Amazon Marketplace.
That said, when I went to check at the conclusion of my trial, the login page shows an error
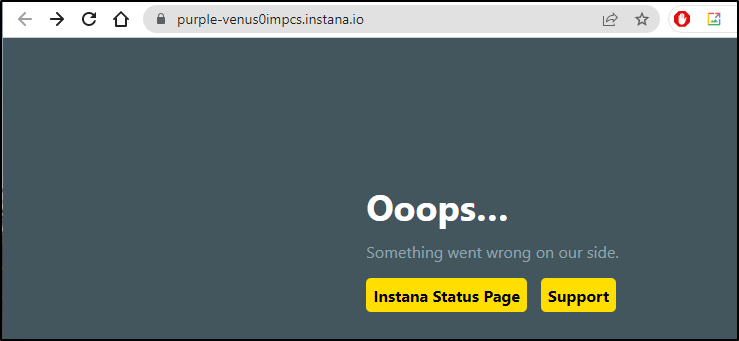
There is an Instana Status Page which shows there were some errors this morning.
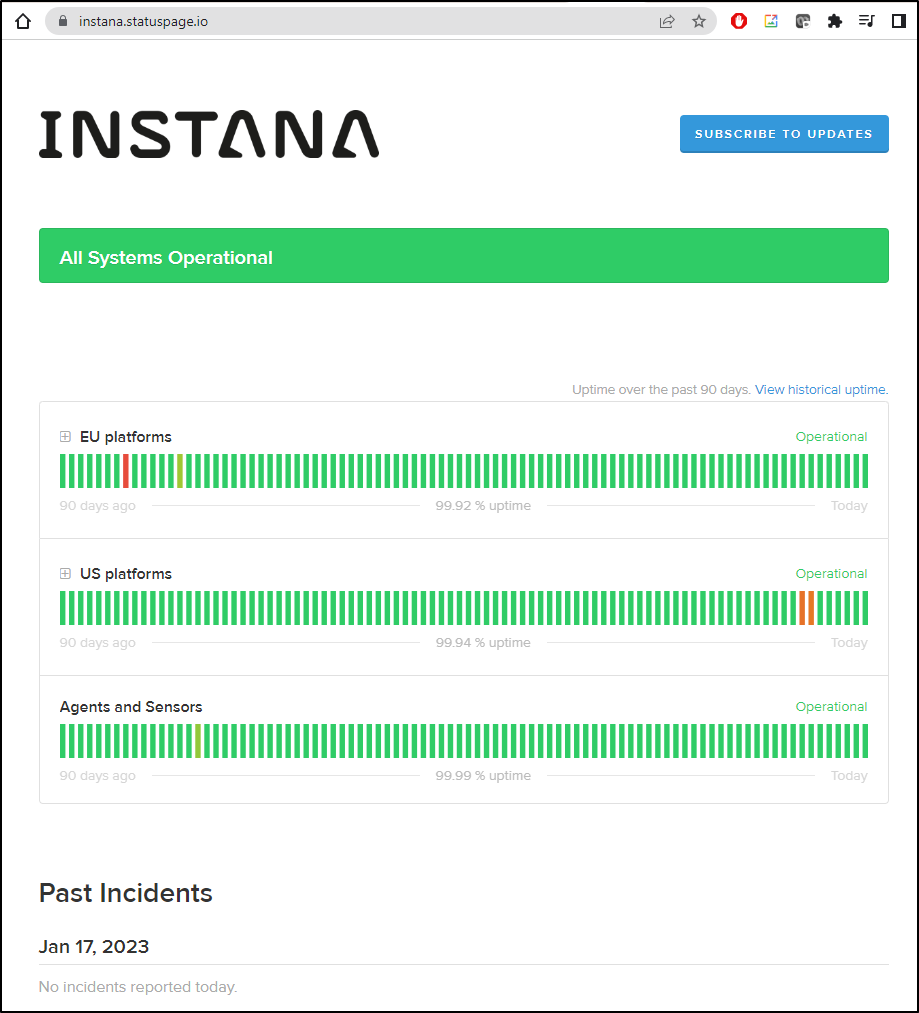
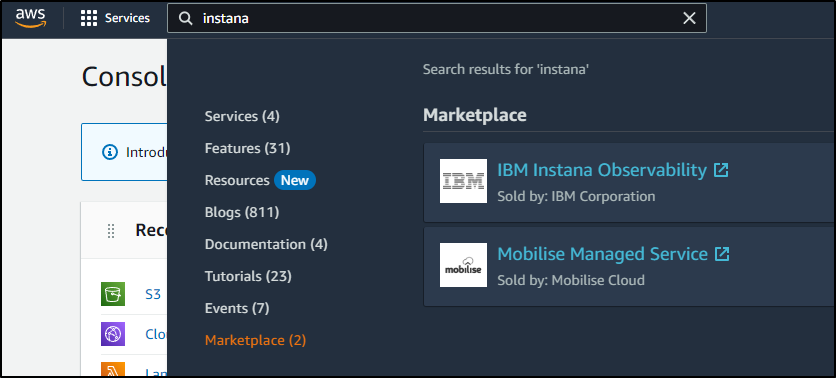
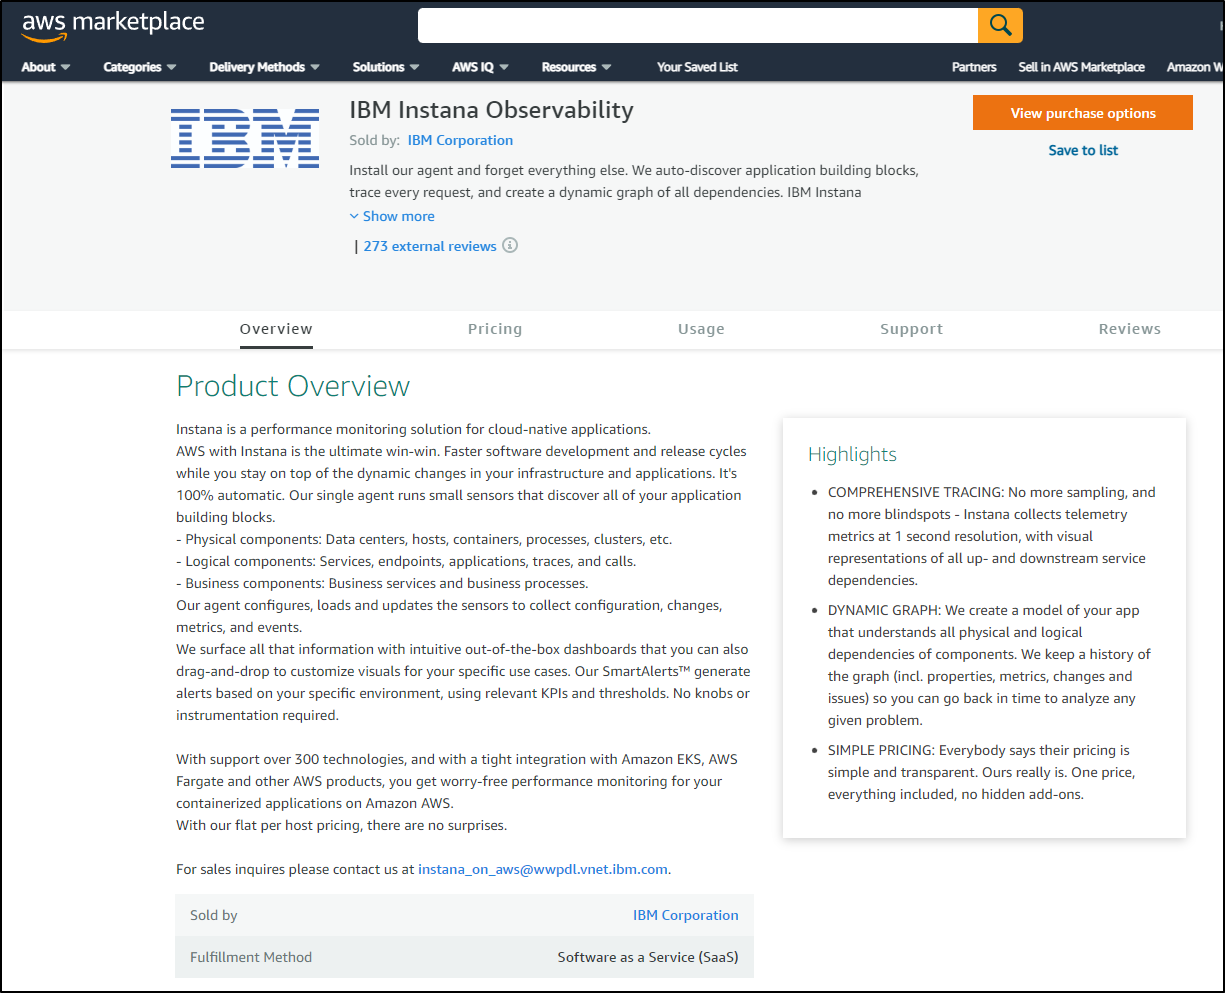
I will assume this error is temporary and there is a path to get back to the marketplace. That said, we can go to the AWS Marketplace and select “IBM Instana Observability”
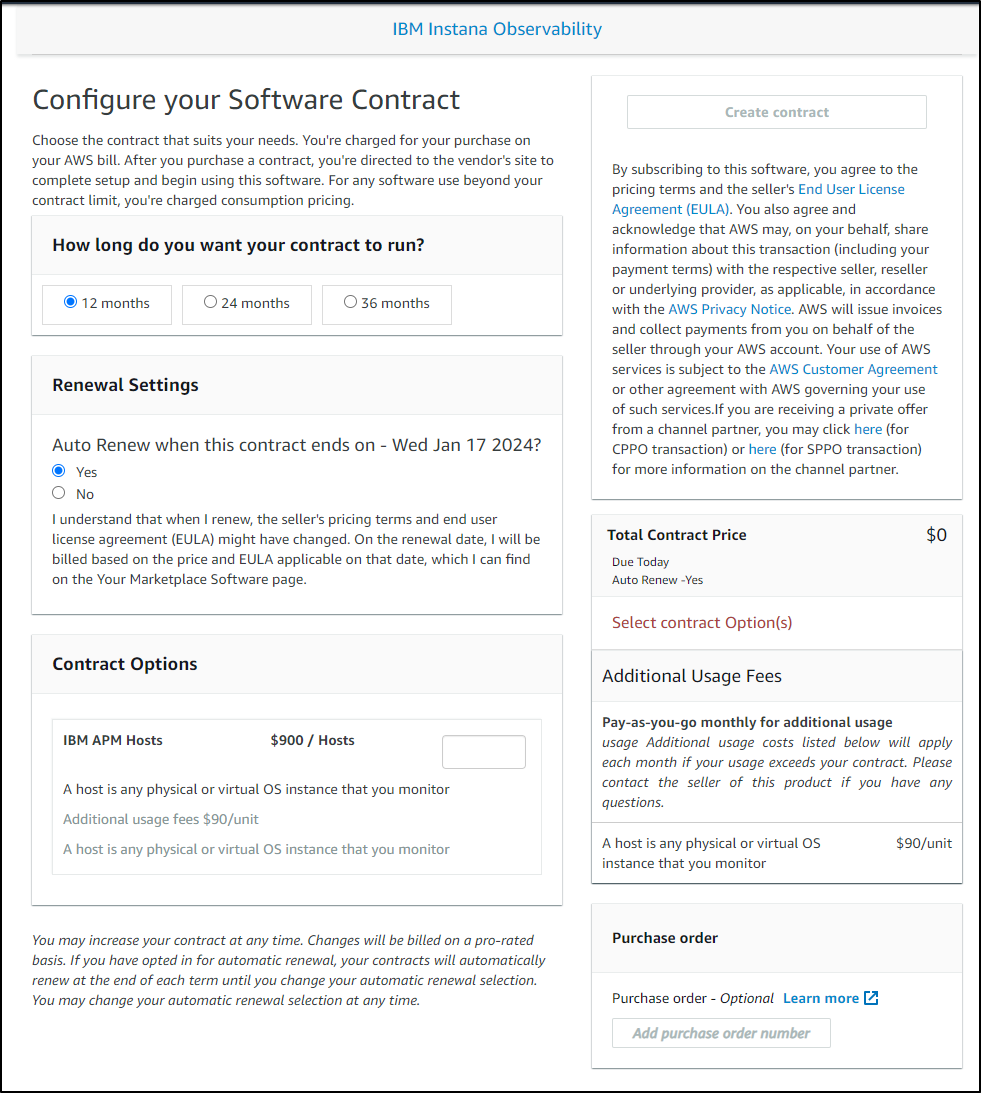
From there, we can view purchase options
From there you can purchase by the year (no discount for longer durations) where it is $900/year per host (and $90/unit of additional usage fees for just Host Monitoring).
Summary

Today we covered alerting with Teams and PagerDuty. We dug into Infrastructure monitoring and Cloud (via GCP) and spoke to Log integration touching on Mezmo (LogDNA) and Coralogix. We touched on pricing and covered the positives (Smart Alerts) and drawbacks (missing context menues on metrics, missing roles on GCP Monitors, broken page after trial, lack of logging).
In the end, Instana is an interesting play in that it is relatively low cost - just a fixed price of $75/host/month billed annually. What gets a bit unclear is how does serverless fit in, or containers? Do they charge per container and per lambda? How does monitoring cloud resources go - like GCP Storage buckets?
I can say that I saw some demos of some beta features rolling out including linking to logs from Containers like we saw from Hosts. This solved my need for direct log integration for debugging issues.
While I felt the monitoring and alerting worked quite well, I’m just not sure I’m willing to dive in on a system that lacks a free tier and integrated logging. But on the positive, it seems IBM is investing in improvements so I’m hopeful they don’t kill it like BuildForge and ClearCase.