Published: Nov 25, 2025 by Isaac Johnson
Today we’ll cover setting up the Kubernetes Sumo Logic collector using helm. This will tie to Kubernetes App which we explore the various metrics by namespace, container, pod and more.
I’ll look at monitors by logs, setting up alert and integrating them with Datadog. Lastly, I’ll look at some historical reports like those from AKS and AWS CloudFront.
I wrap by looking at custom dashboards and looking at costs.
Kubernetes
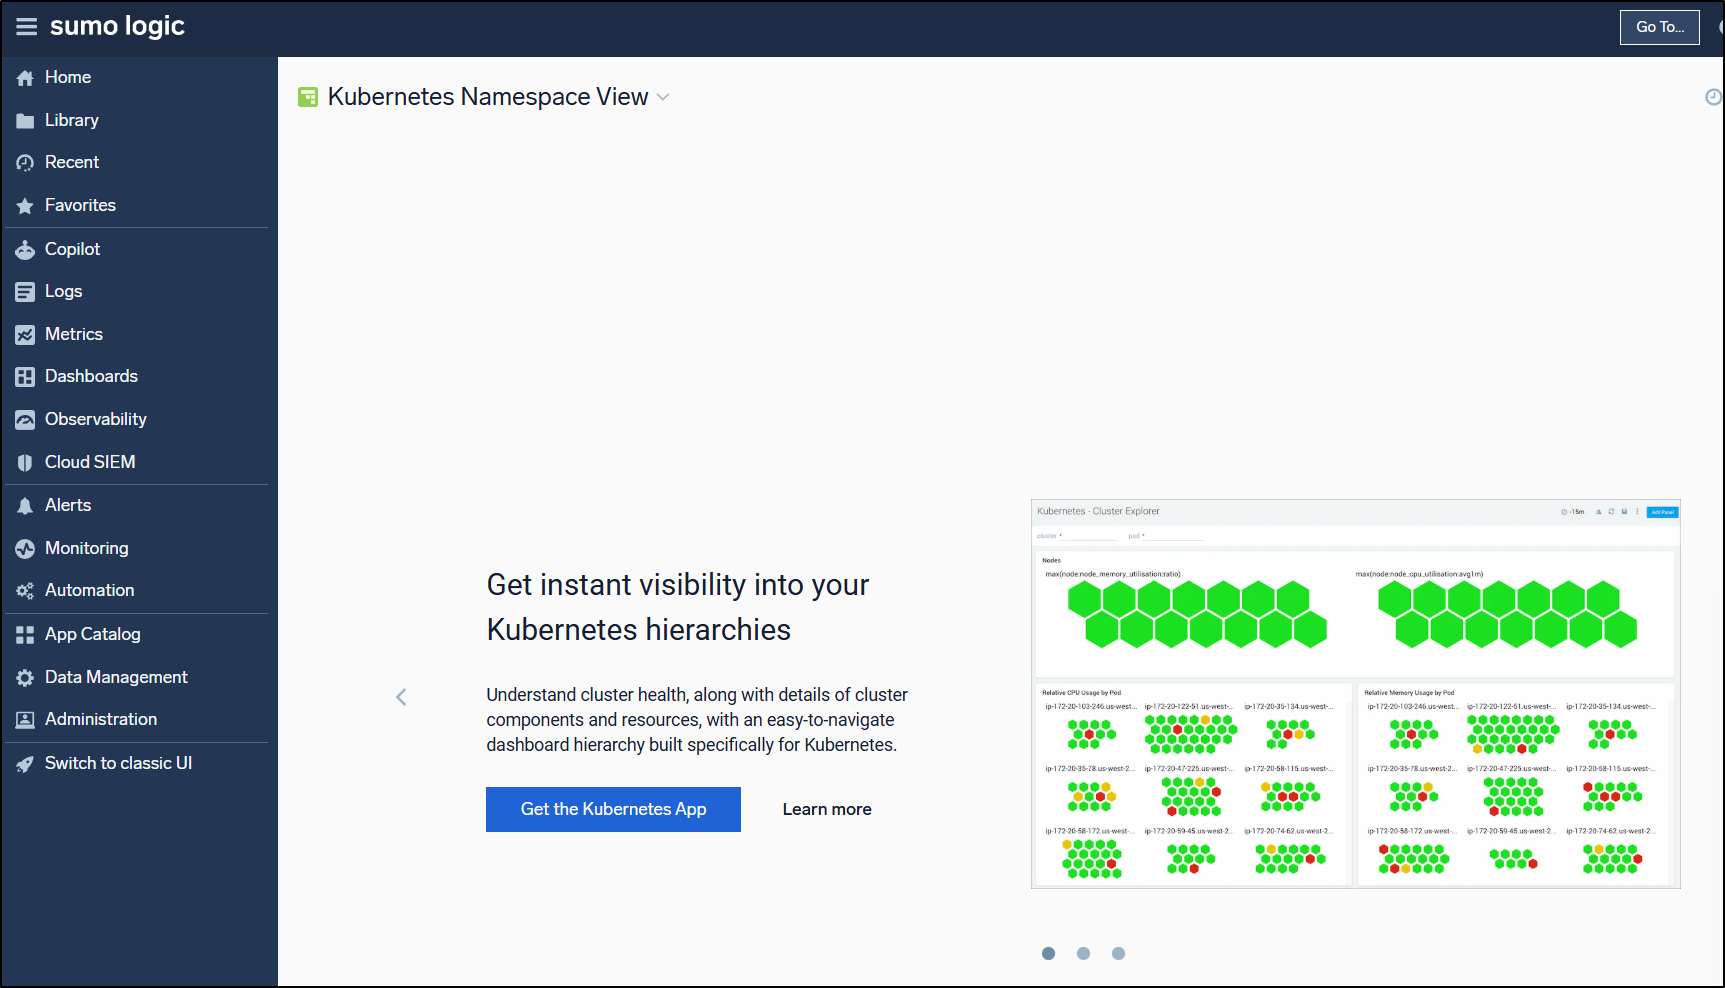
Let’s start by monitoring something. If I go to observability and chose Kubernetes, we are prompted to get the K8s app
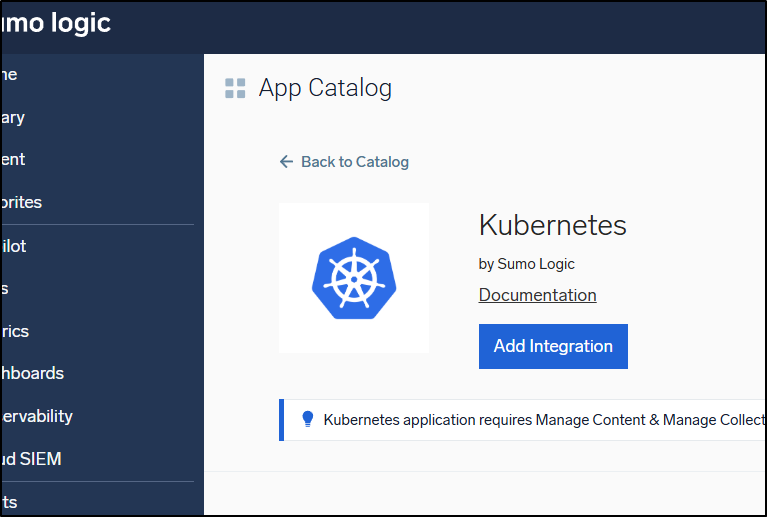
I’ll then add integration
This takes me through the steps
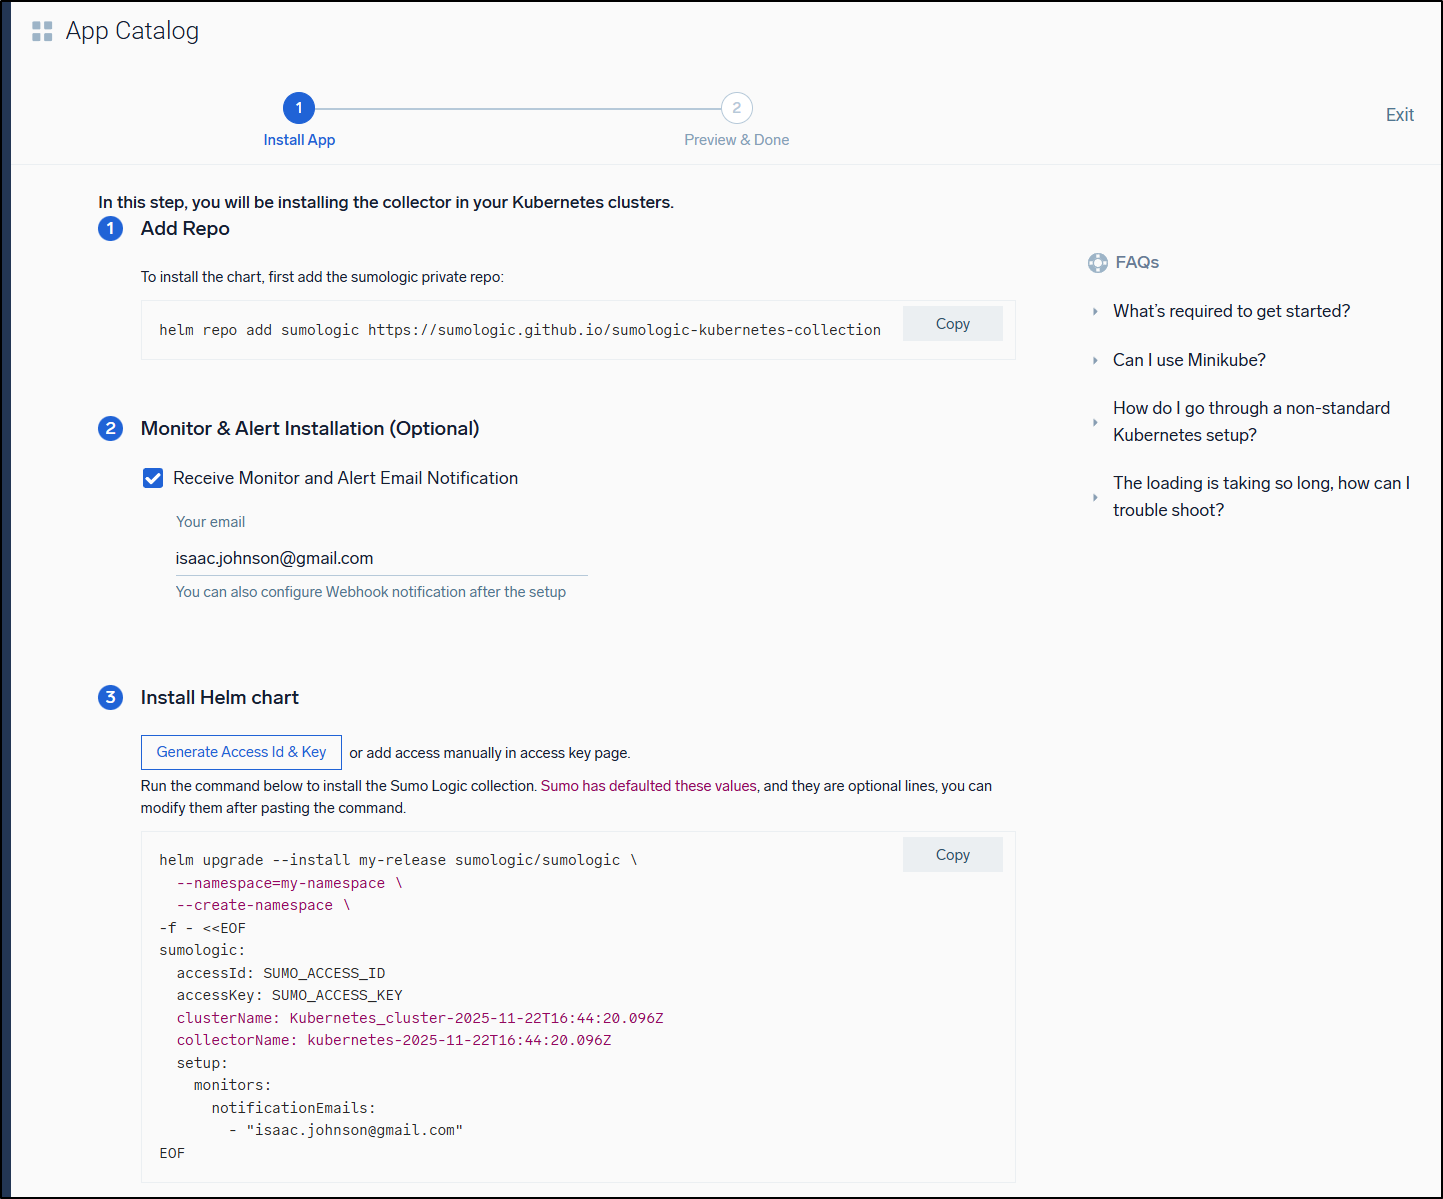
I noticed it does an inline file which I haven’t seen that approach before. Usually we would just use --set key=value to helm.
builder@DESKTOP-QADGF36:~/Workspaces/jekyll-blog$ helm repo add sumologic https://sumologic.github.io/sumologic-kubernetes-collection
"sumologic" already exists with the same configuration, skipping
builder@DESKTOP-QADGF36:~/Workspaces/jekyll-blog$ helm upgrade --install my-release sumologic/sumologic \
  --namespace=my-namespace \
  --create-namespace \
-f - <<EOF
sumologic:
  accessId: sxxxxxxxxxxxxxxxxxx
  accessKey: Sxxxxxxxxxxxxxxxxxxxxxxxxxxxxxxxxxxxxxxxxxx
  clusterName: Kubernetes_cluster-2025-11-22T16:44:20.096Z
  collectorName: kubernetes-2025-11-22T16:44:20.096Z
  setup:
    monitors:
      notificationEmails:
        - "isaac.johnson@gmail.com"
EOF
Release "my-release" does not exist. Installing it now.
I will give a heads up that whatever it does takes a while, but when done
Release "my-release" does not exist. Installing it now.


NAME: my-release
LAST DEPLOYED: Sat Nov 22 10:45:32 2025
NAMESPACE: my-namespace
STATUS: deployed
REVISION: 1
NOTES:
Thank you for installing sumologic.

A Collector with the name "kubernetes-2025-11-22T16:44:20.096Z" has been created in your Sumo Logic account.

Check the release status by running:
  kubectl --namespace my-namespace get pods -l "release=my-release"

Please see https://help.sumologic.com/docs/apm/traces/get-started-transaction-tracing to find out
how to instrument your application and send traces.
The list of endpoints in your Kubernetes cluster to which traces can be sent:
- OTLP/http: http://my-release-sumologic-otelagent.my-namespace:4318
- OTLP/gRPC: http://my-release-sumologic-otelagent.my-namespace:4317
- OTLP/http/deprecated: http://my-release-sumologic-otelagent.my-namespace:55681
- Zipkin: http://my-release-sumologic-otelagent.my-namespace:9411/api/v2/spans
- Jaeger/gRPC: http://my-release-sumologic-otelagent.my-namespace:14250
- Jaeger/Thrift/http: http://my-release-sumologic-otelagent.my-namespace:14268
- Jaeger/Thrift/compact: my-release-sumologic-otelagent.my-namespace:6831
- Jaeger/Thrift/binary: my-release-sumologic-otelagent.my-namespace:6832
- OpenCensus: http://my-release-sumologic-otelagent.my-namespace:55678

We've tried to automatically create fields. In an unlikely scenario that this
fails please refer to the following to create them manually:
https://github.com/SumoLogic/sumologic-kubernetes-collection/blob/2b3ca63/deploy/docs/Installation_with_Helm.md#prerequisite
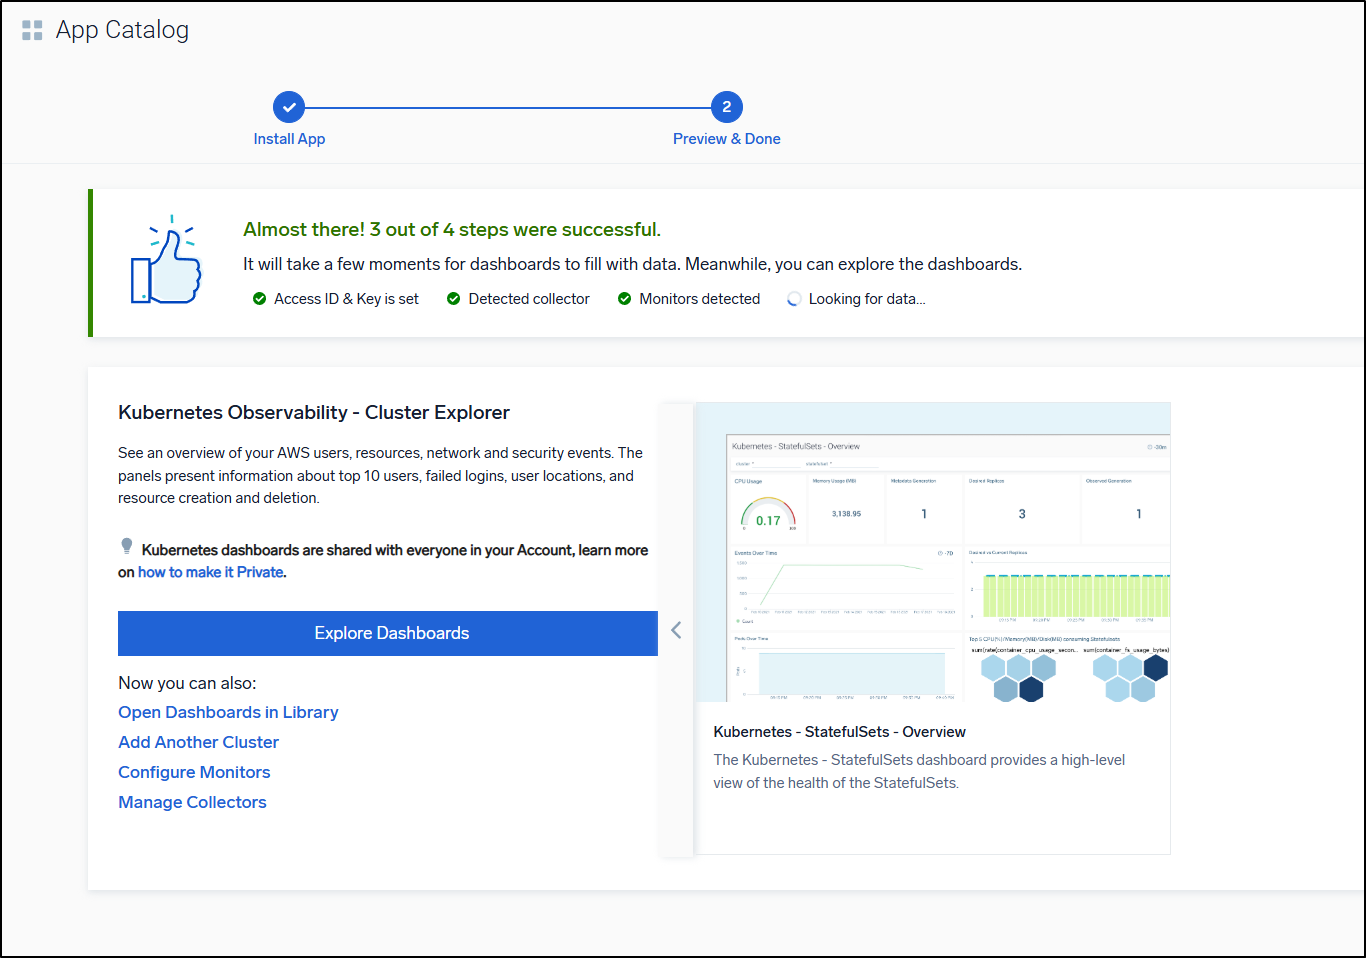
I can now go to the next step in Sumo Logic and see it’s mostly ready
I can see the pods are running
my-namespace     my-release-kube-state-metrics-684469d7d4-jhjdq                  1/1     Running     0               6m27s
my-namespace     my-release-opentelemetry-operator-dc98c5bcc-52xb4               2/2     Running     0               6m27s
my-namespace     my-release-prometheus-node-exporter-msm88                       1/1     Running     0               6m27s
my-namespace     my-release-prometheus-node-exporter-qvkjc                       1/1     Running     0               6m27s
my-namespace     my-release-prometheus-node-exporter-rvvzh                       1/1     Running     0               6m27s
my-namespace     my-release-sumologic-metrics-collector-0                        1/1     Running     0               5m48s
my-namespace     my-release-sumologic-metrics-targetallocator-5c7bd57869-jbcfp   1/1     Running     0               5m47s
my-namespace     my-release-sumologic-otelcol-events-0                           1/1     Running     0               6m27s
my-namespace     my-release-sumologic-otelcol-instrumentation-0                  1/1     Running     0               6m27s
my-namespace     my-release-sumologic-otelcol-instrumentation-1                  1/1     Running     0               6m12s
my-namespace     my-release-sumologic-otelcol-instrumentation-2                  1/1     Running     0               6m12s
my-namespace     my-release-sumologic-otelcol-logs-0                             1/1     Running     0               6m27s
my-namespace     my-release-sumologic-otelcol-logs-1                             1/1     Running     0               6m12s
my-namespace     my-release-sumologic-otelcol-logs-2                             1/1     Running     0               6m12s
my-namespace     my-release-sumologic-otelcol-logs-collector-8bhlg               1/1     Running     0               6m27s
my-namespace     my-release-sumologic-otelcol-logs-collector-wlz2z               1/1     Running     0               6m27s
my-namespace     my-release-sumologic-otelcol-logs-collector-xbzx9               1/1     Running     0               6m27s
my-namespace     my-release-sumologic-otelcol-metrics-0                          1/1     Running     0               6m27s
my-namespace     my-release-sumologic-otelcol-metrics-1                          1/1     Running     0               6m12s
my-namespace     my-release-sumologic-otelcol-metrics-2                          1/1     Running     0               6m12s
my-namespace     my-release-sumologic-traces-gateway-7f8bf84f77-f6wzh            1/1     Running     0               6m27s
my-namespace     my-release-sumologic-traces-sampler-788df65b77-qbsng            1/1     Running     0               6m27s
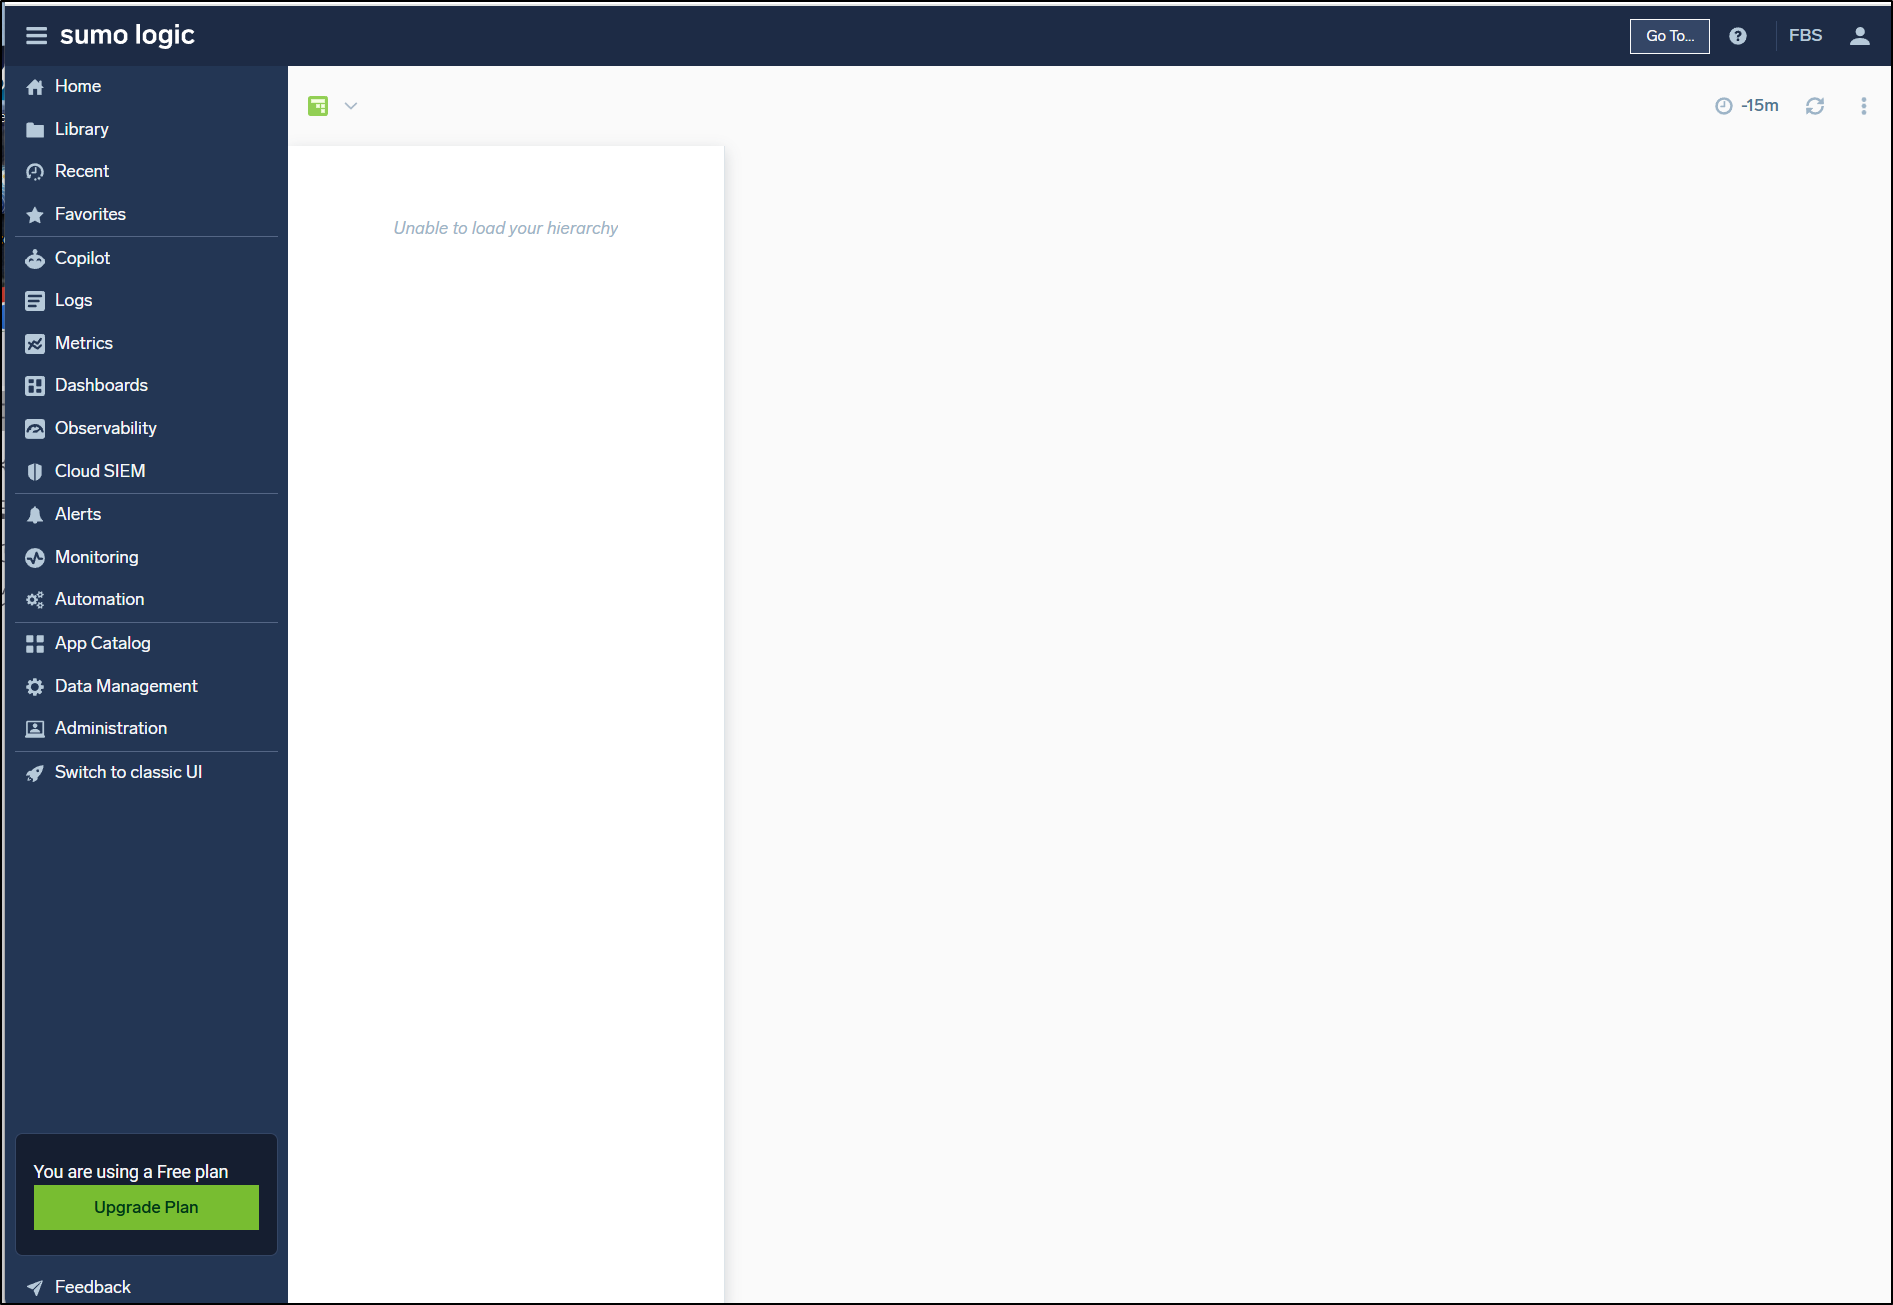
Initially, the dashboards were empty
But soon I could see data populating
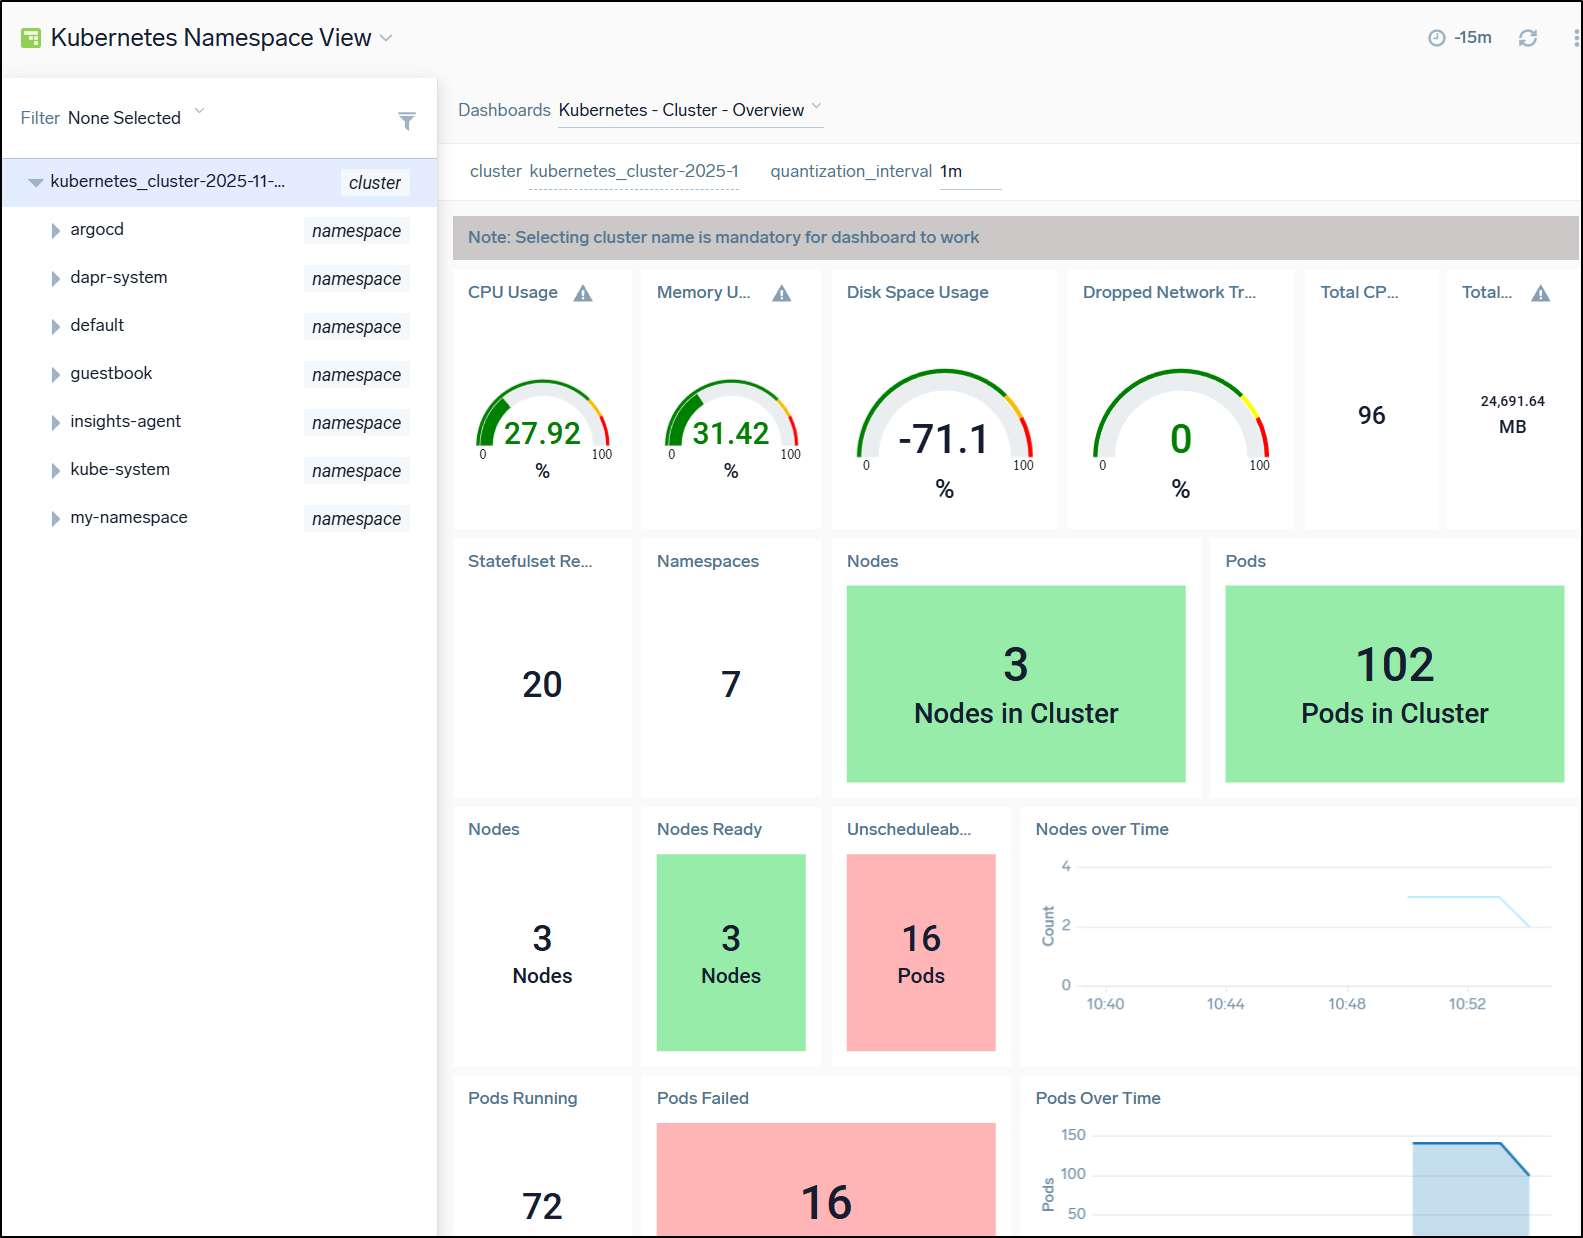
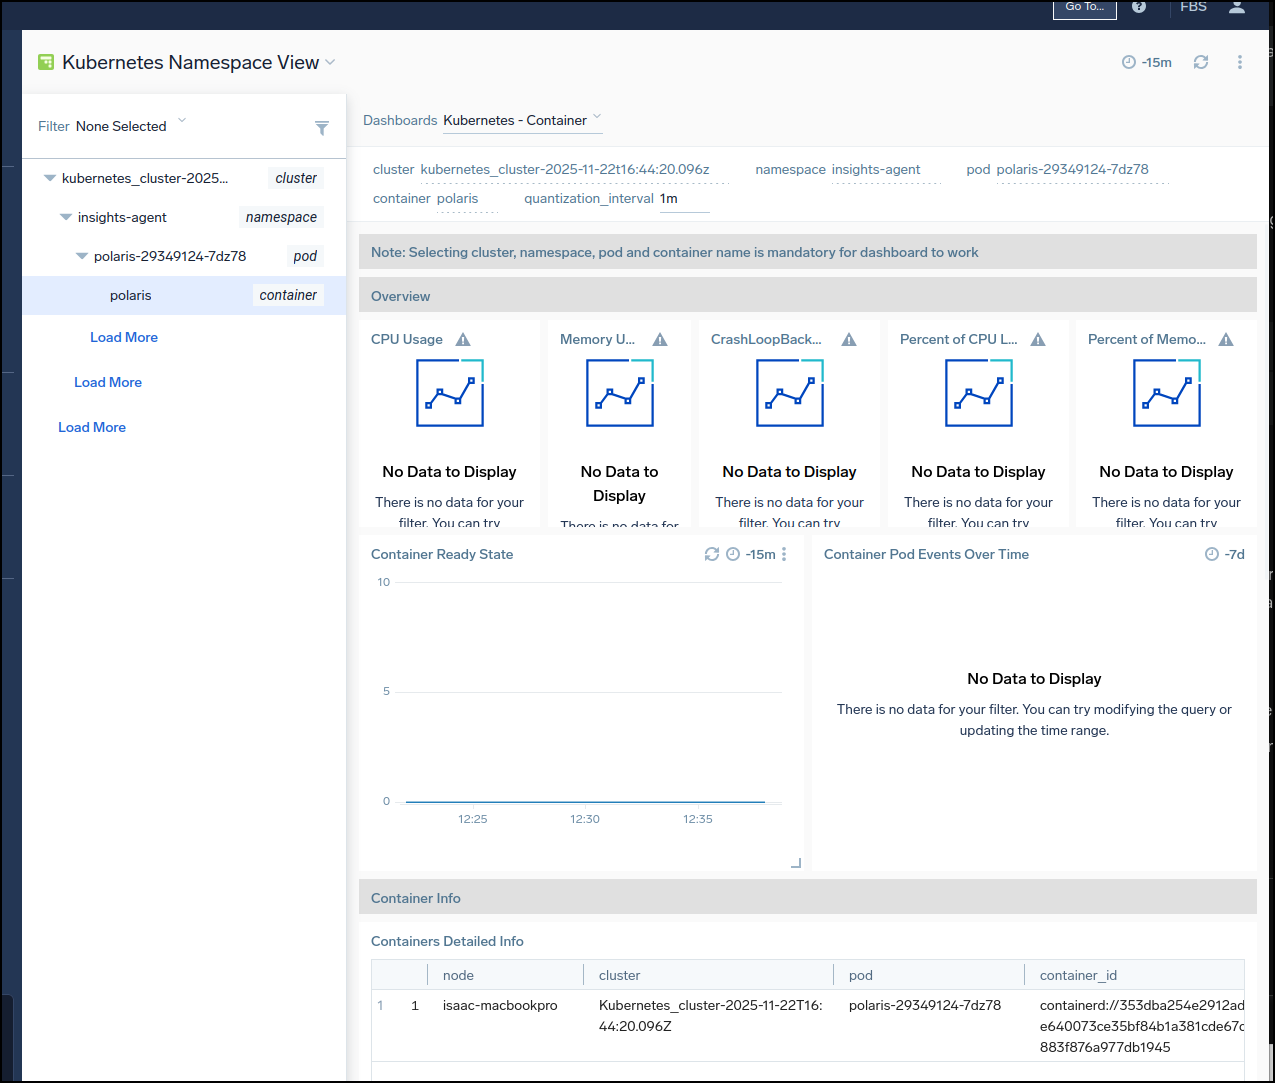
We can easily see metrics by namespace
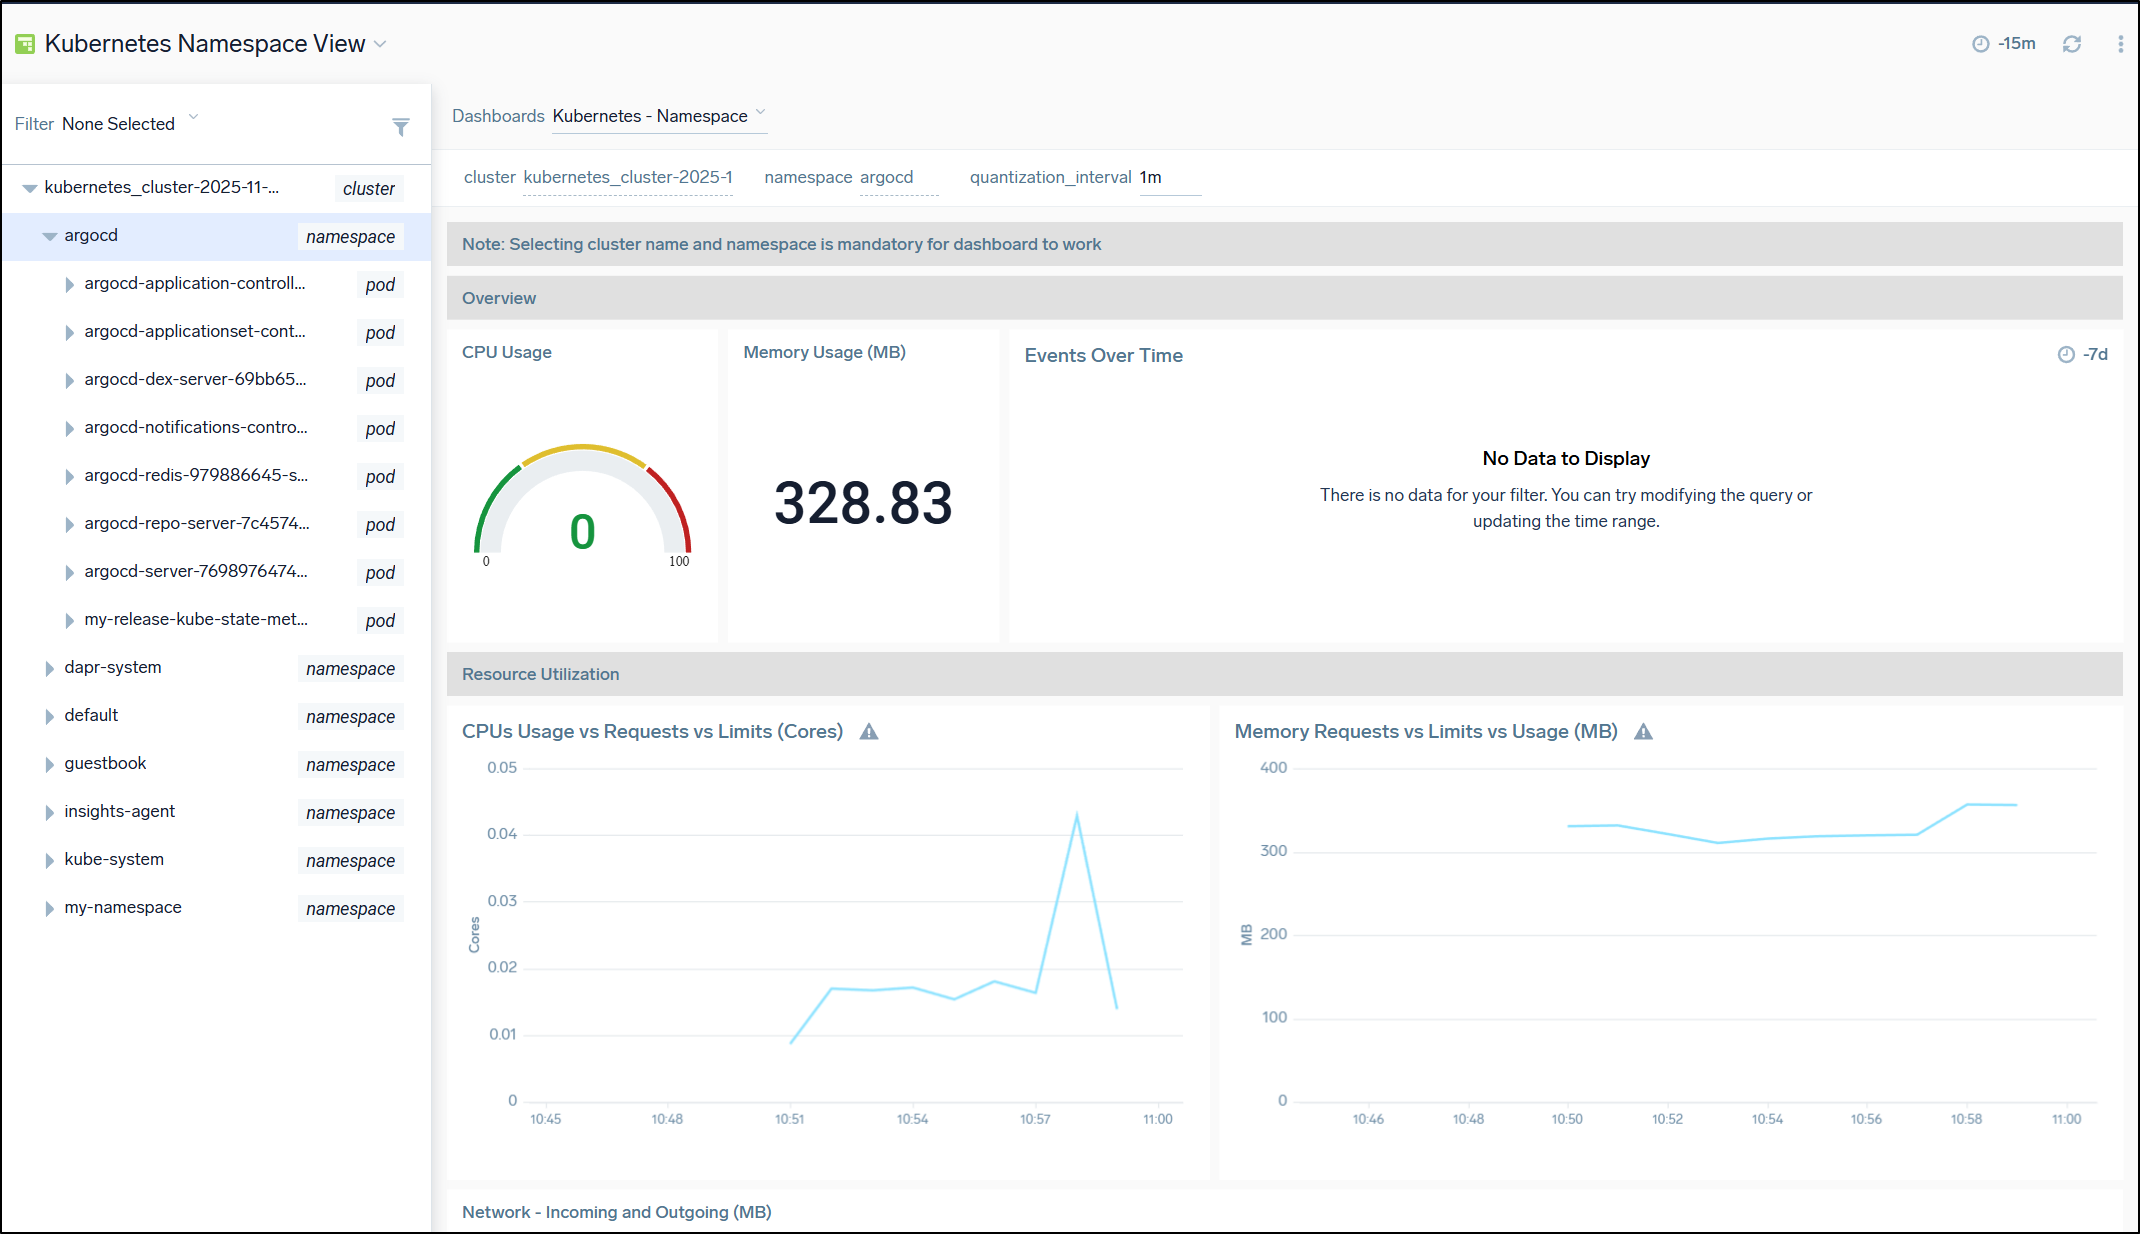
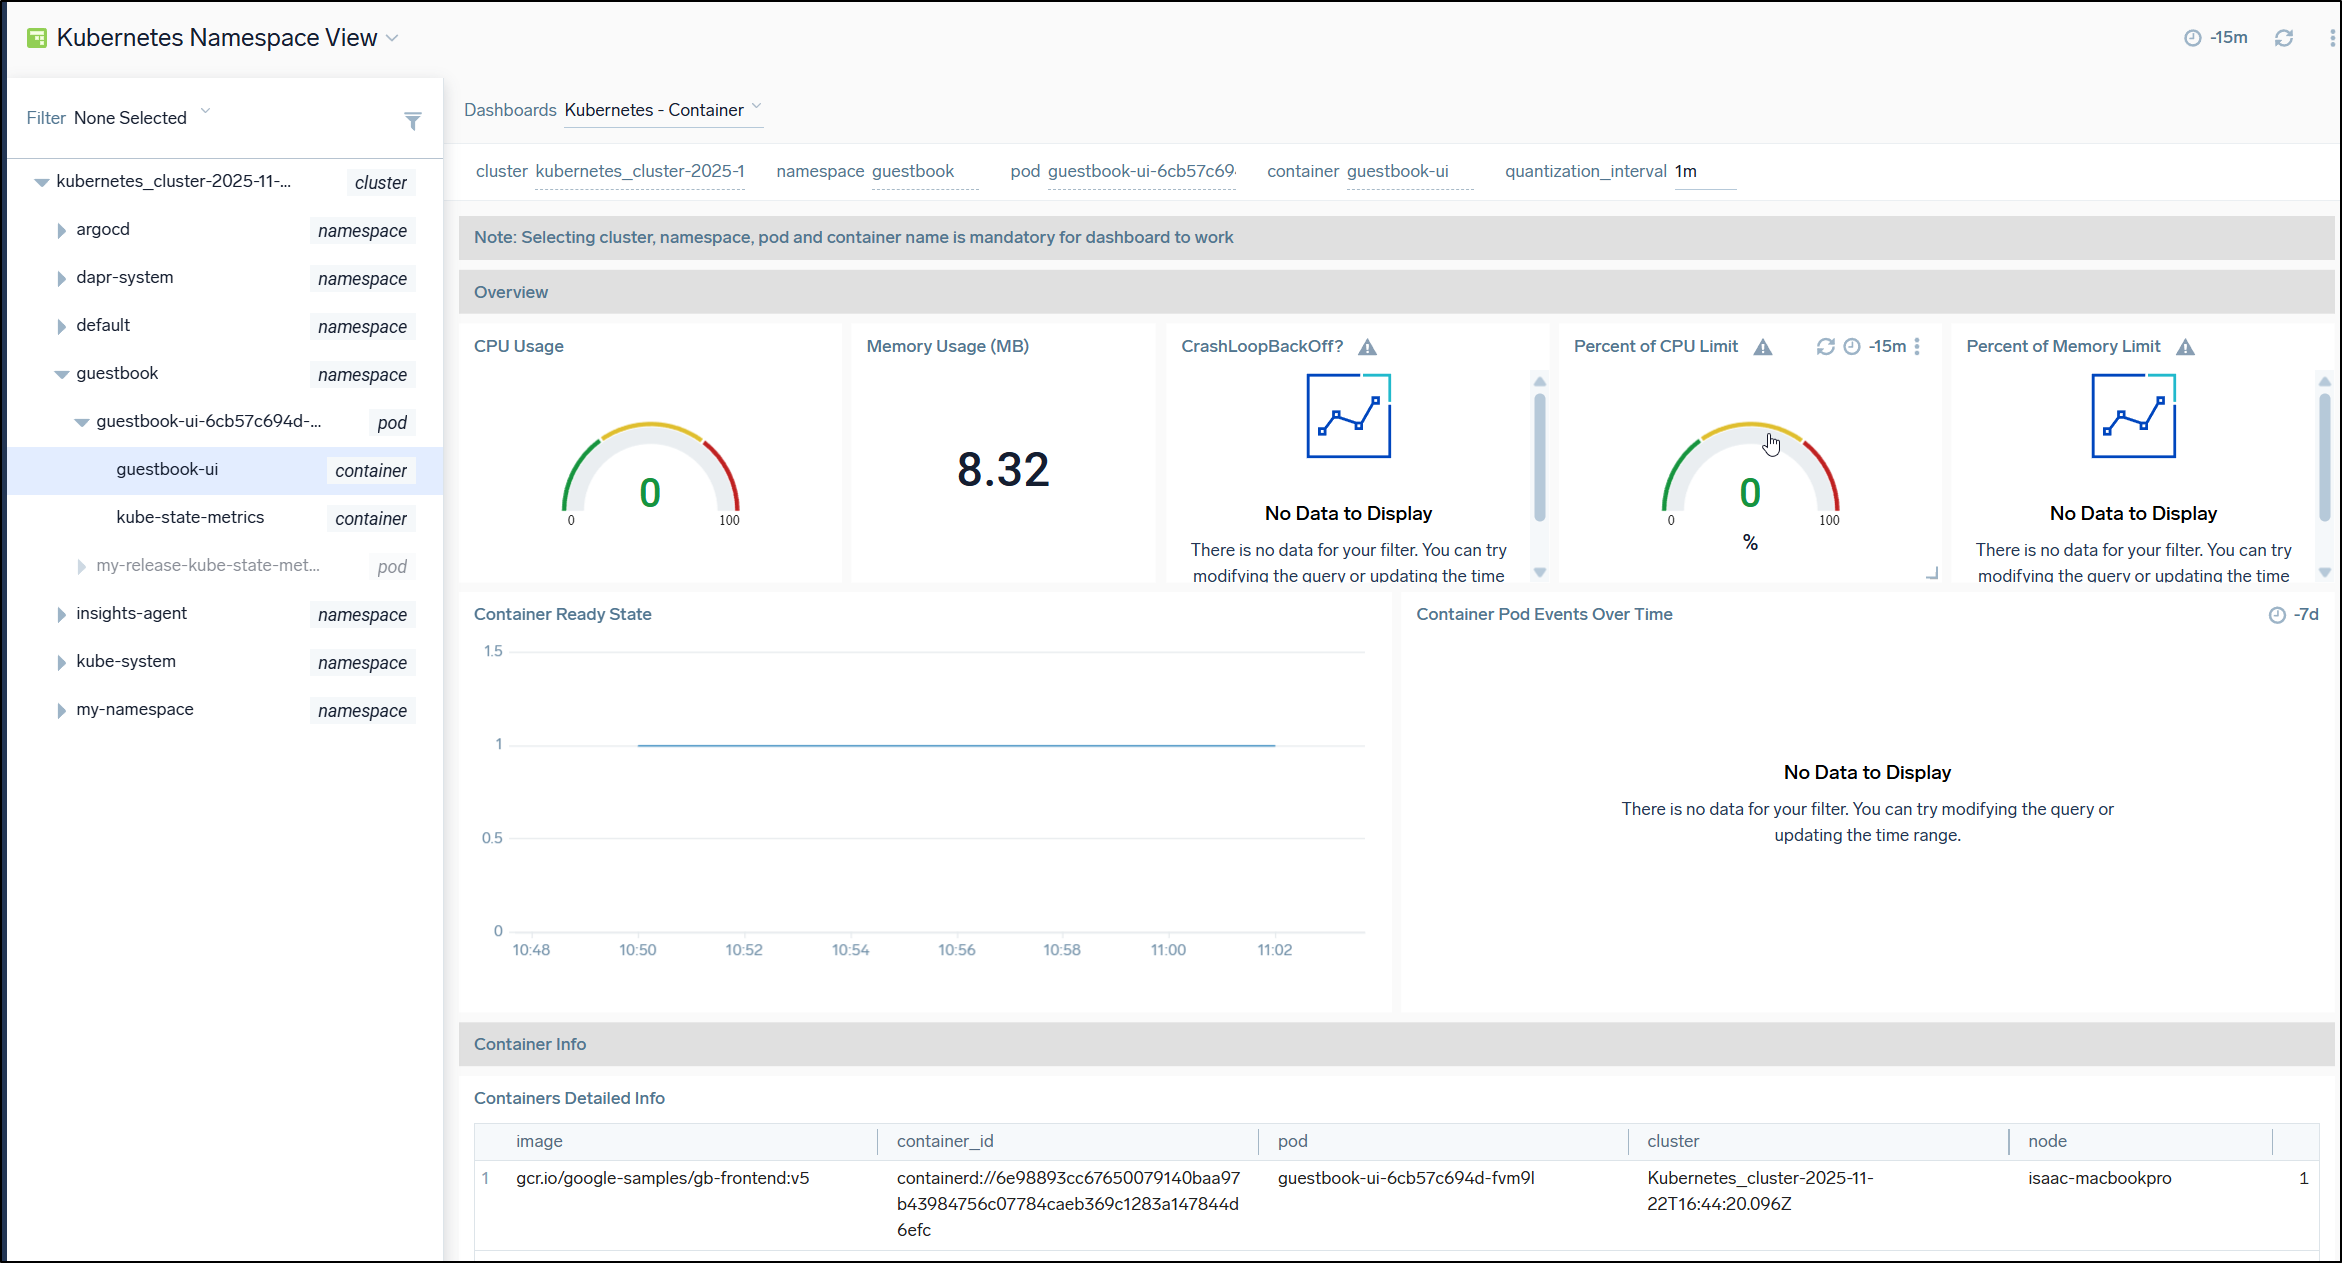
or drill into container or pod
#########come back https://service.sumologic.com/kubernetes?drillDownId=cluster%3Dkubernetes_cluster-2025-11-22t16%3A44%3A20.096z+namespace%3Dinsights-agent+pod%3Dpolaris-29349124-7dz78+container%3Dpolaris&selectedDashboardId=0gMLIJJo4uJyXDnSFoEBLCYcjmdXIRp7z2u8SXdUVFWQycDHJchdW9QtSB55&topologyId=000000000000445A&selectedSavedFilterName=None+Selected
If we have pod that has been failing to start, we wont see metrics
I also noticed that an existing pod that has had crashes over time, but before I added the Sumologic agent didn’t have CrashLoop states.
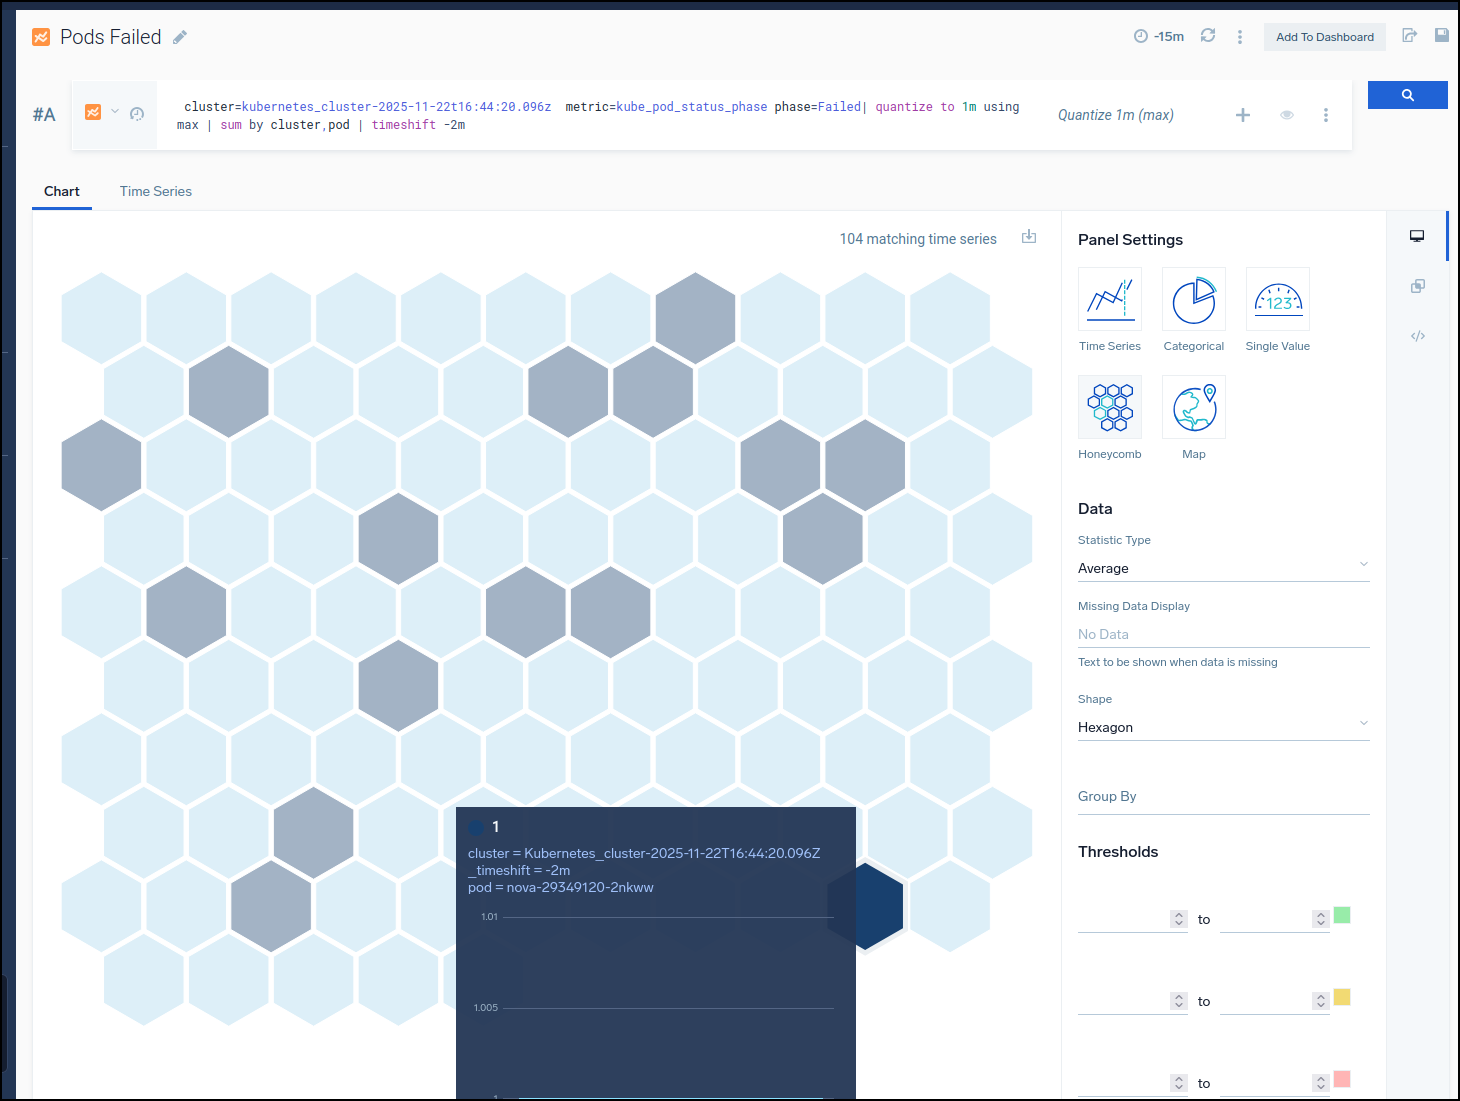
If I want to look up, say how many pods have failed status in the last 15m I would need to kick over to a metrics query
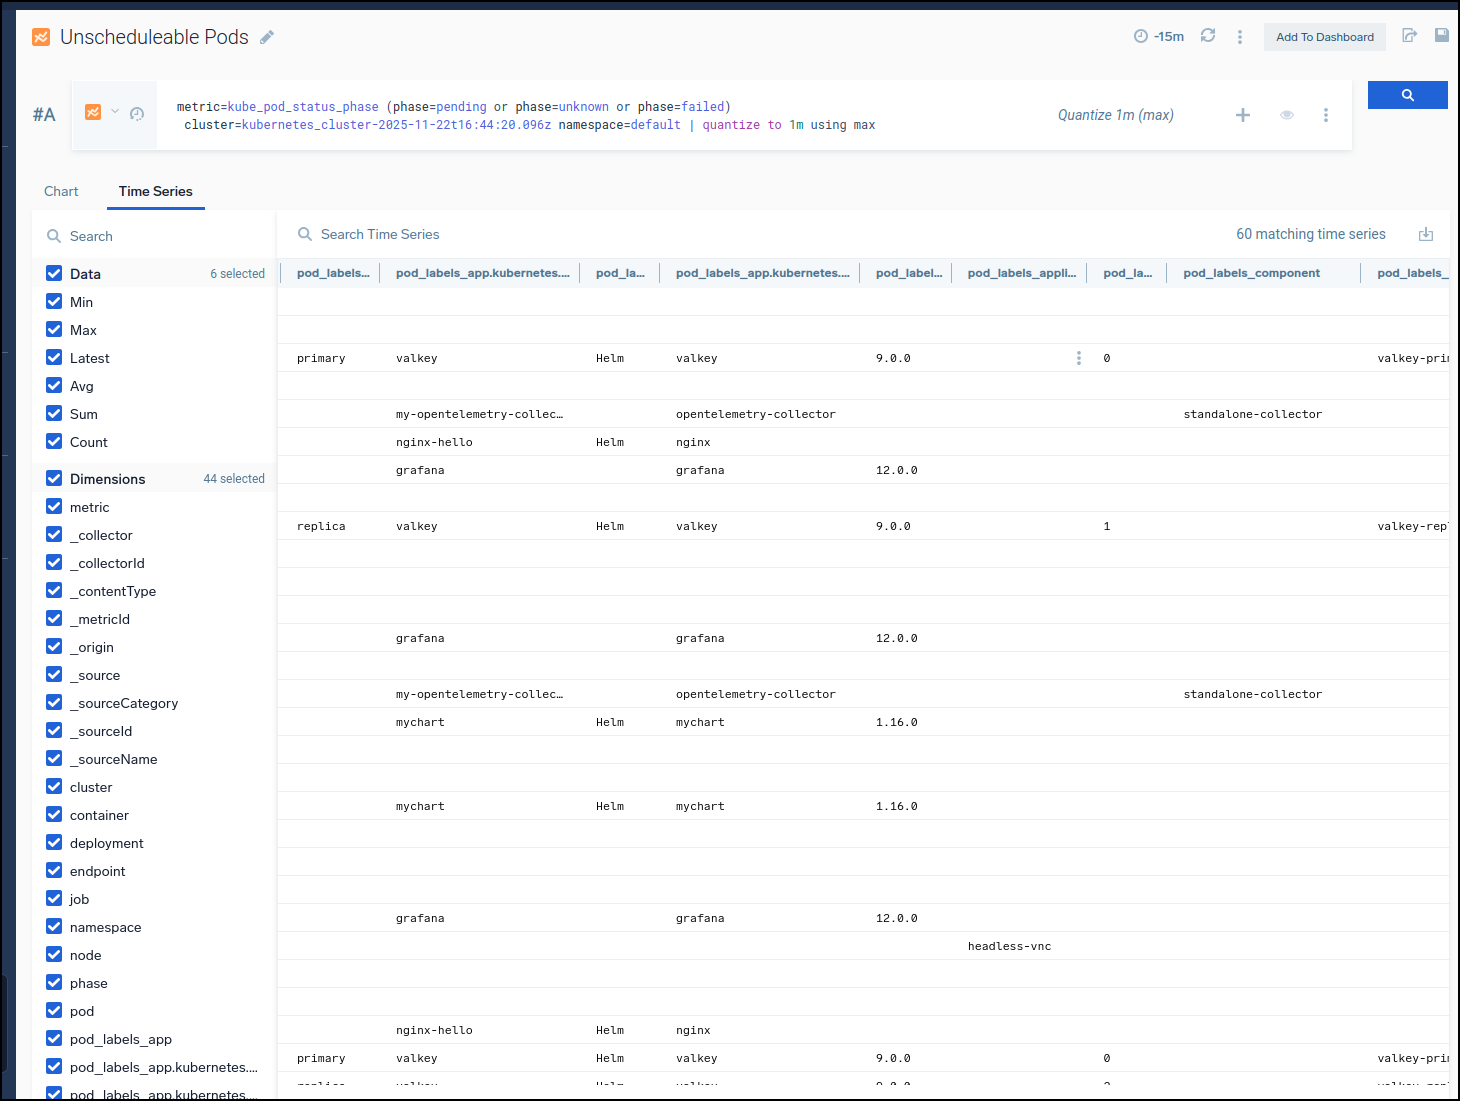
If we change from Graph to Time Series, we can view a list with all the fields
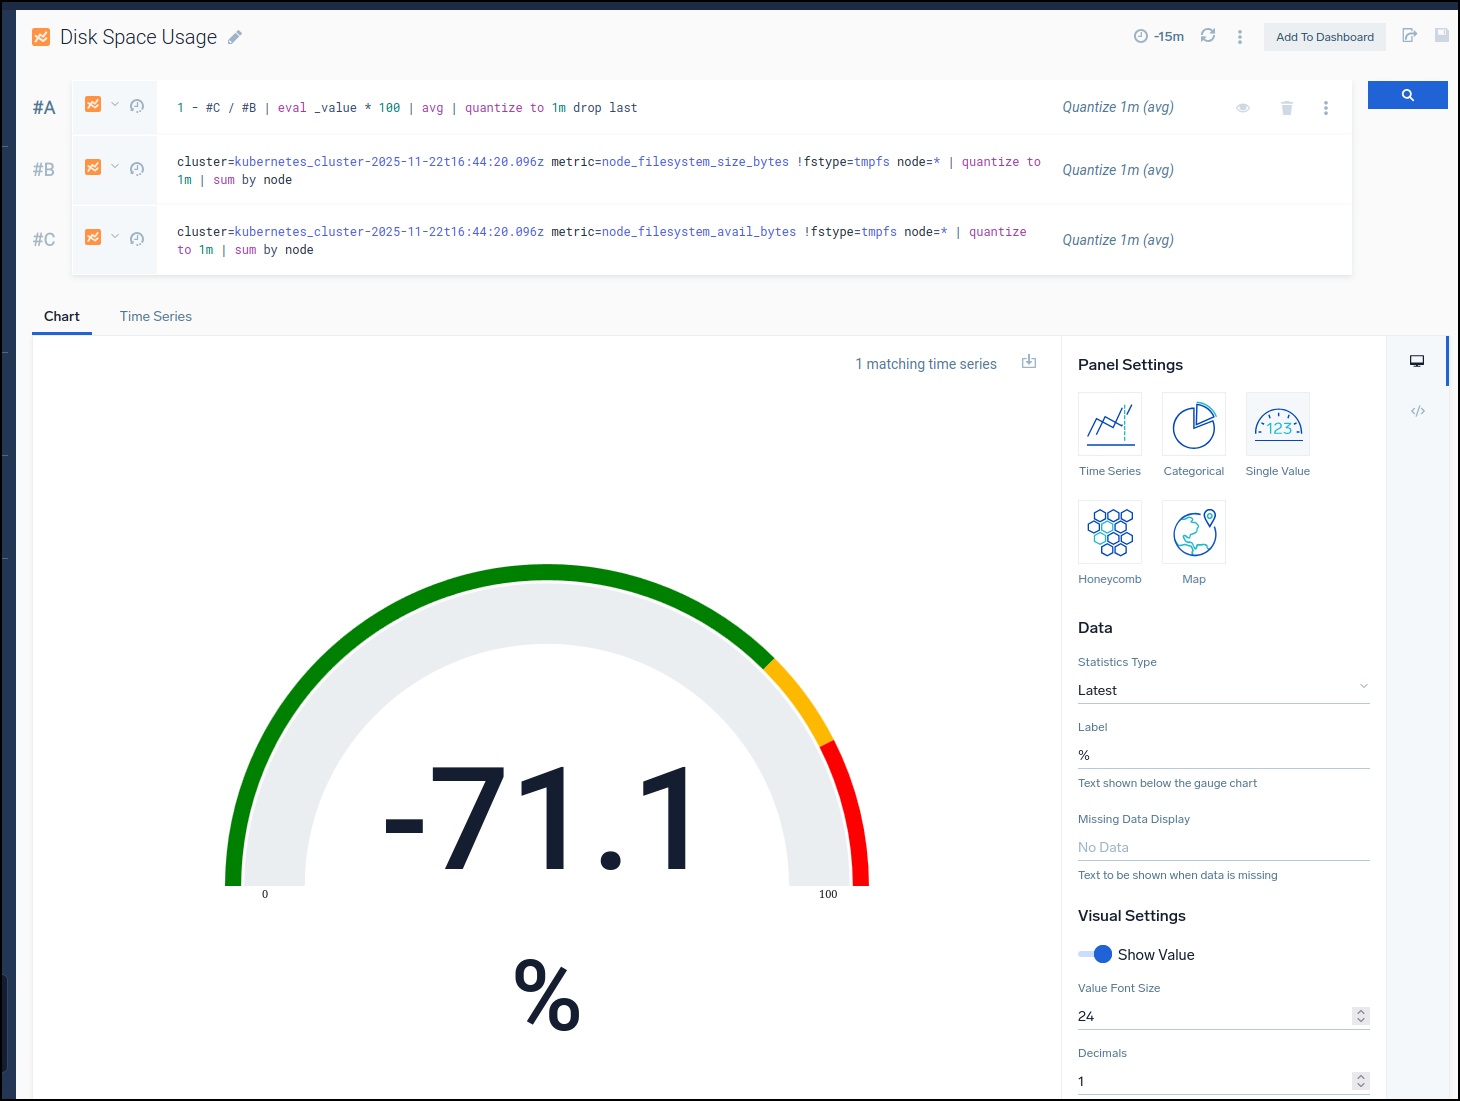
The widget that seems always off is the disk space one which regardless of where I look shows negative
Logs
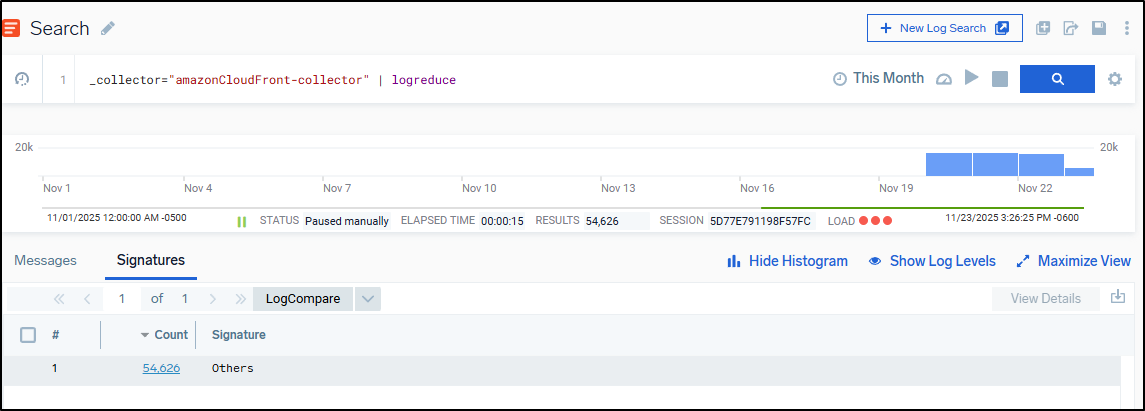
We can look up logs by hostname then use LogReduce to see them grouped logically
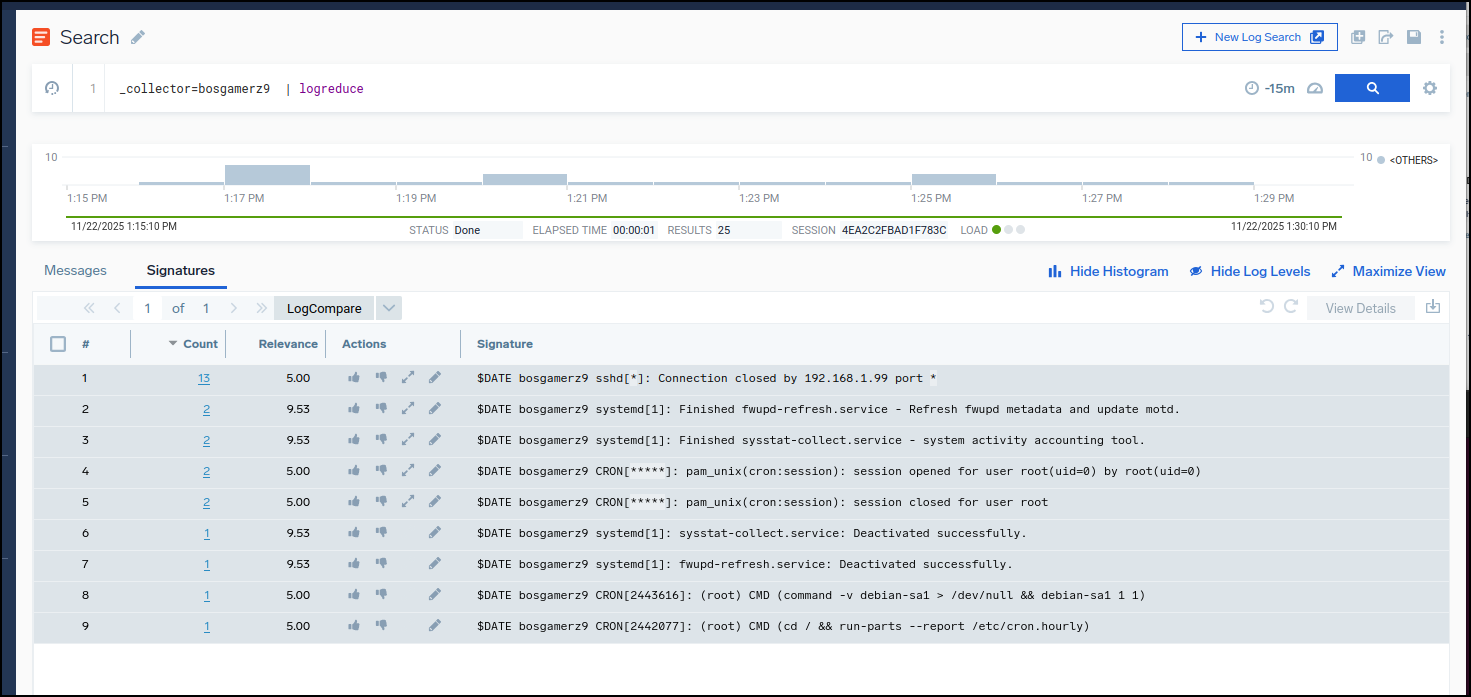
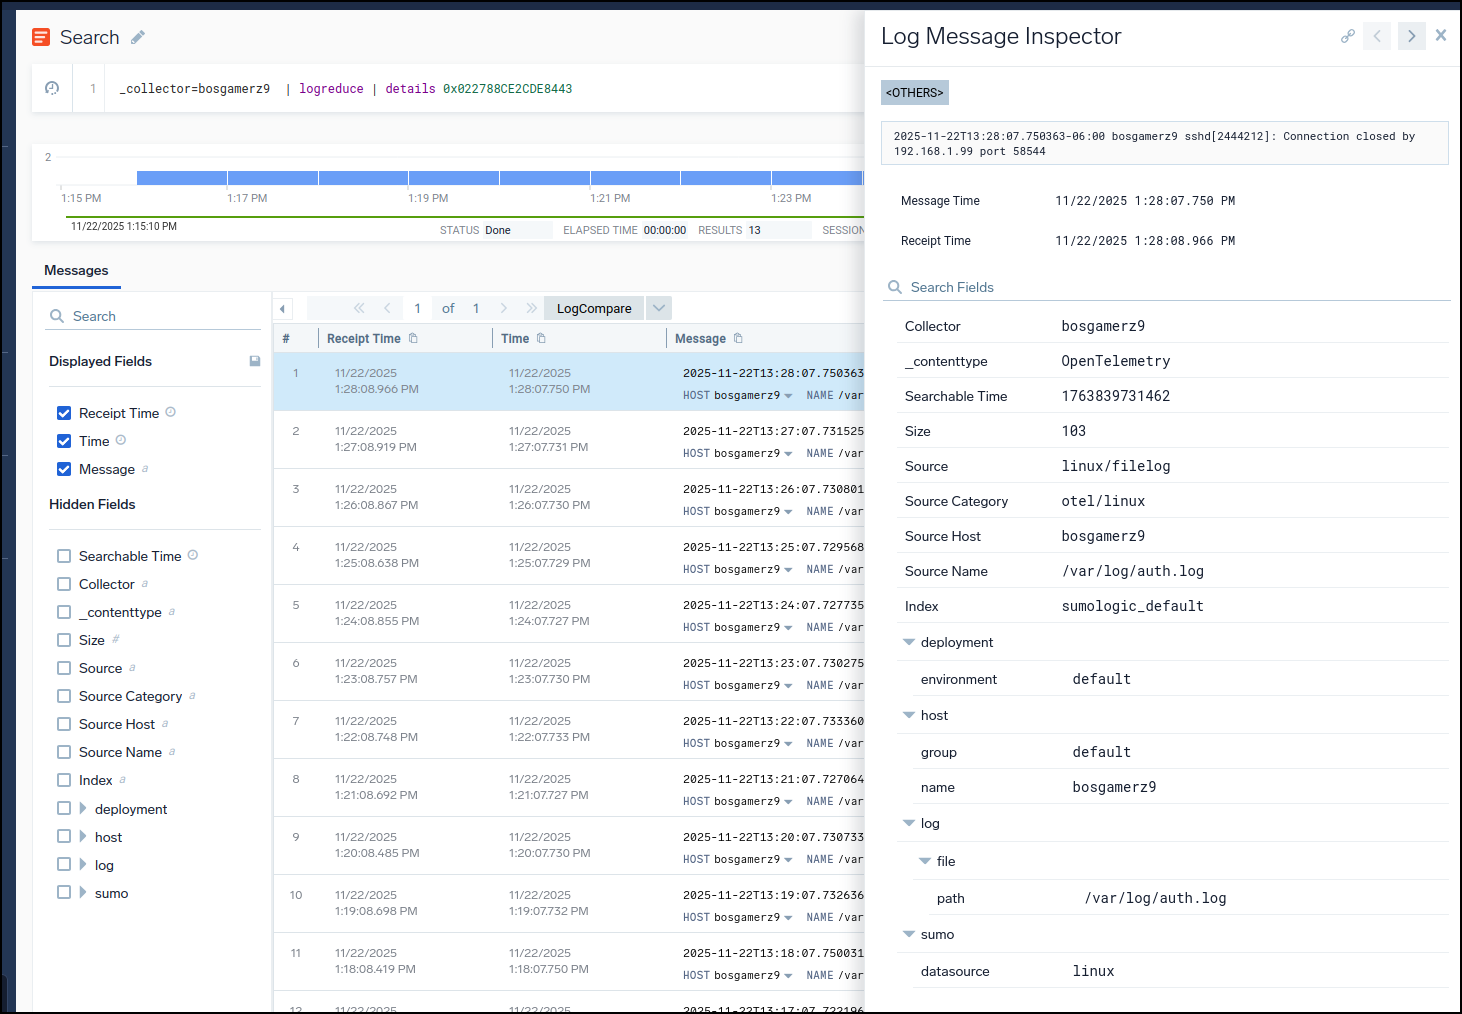
I can then pick one of the categories then drill into log details to find relevant information
Monitors
We can turn this into a monitor based on logs from the “…” menu
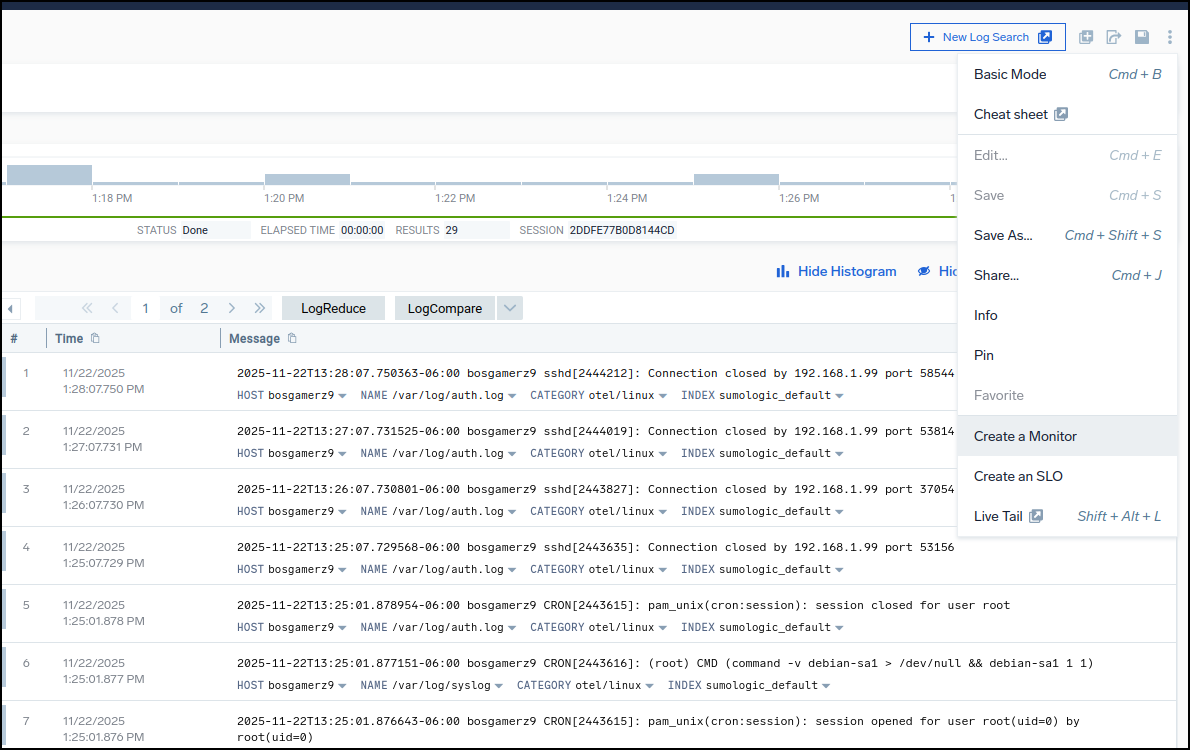
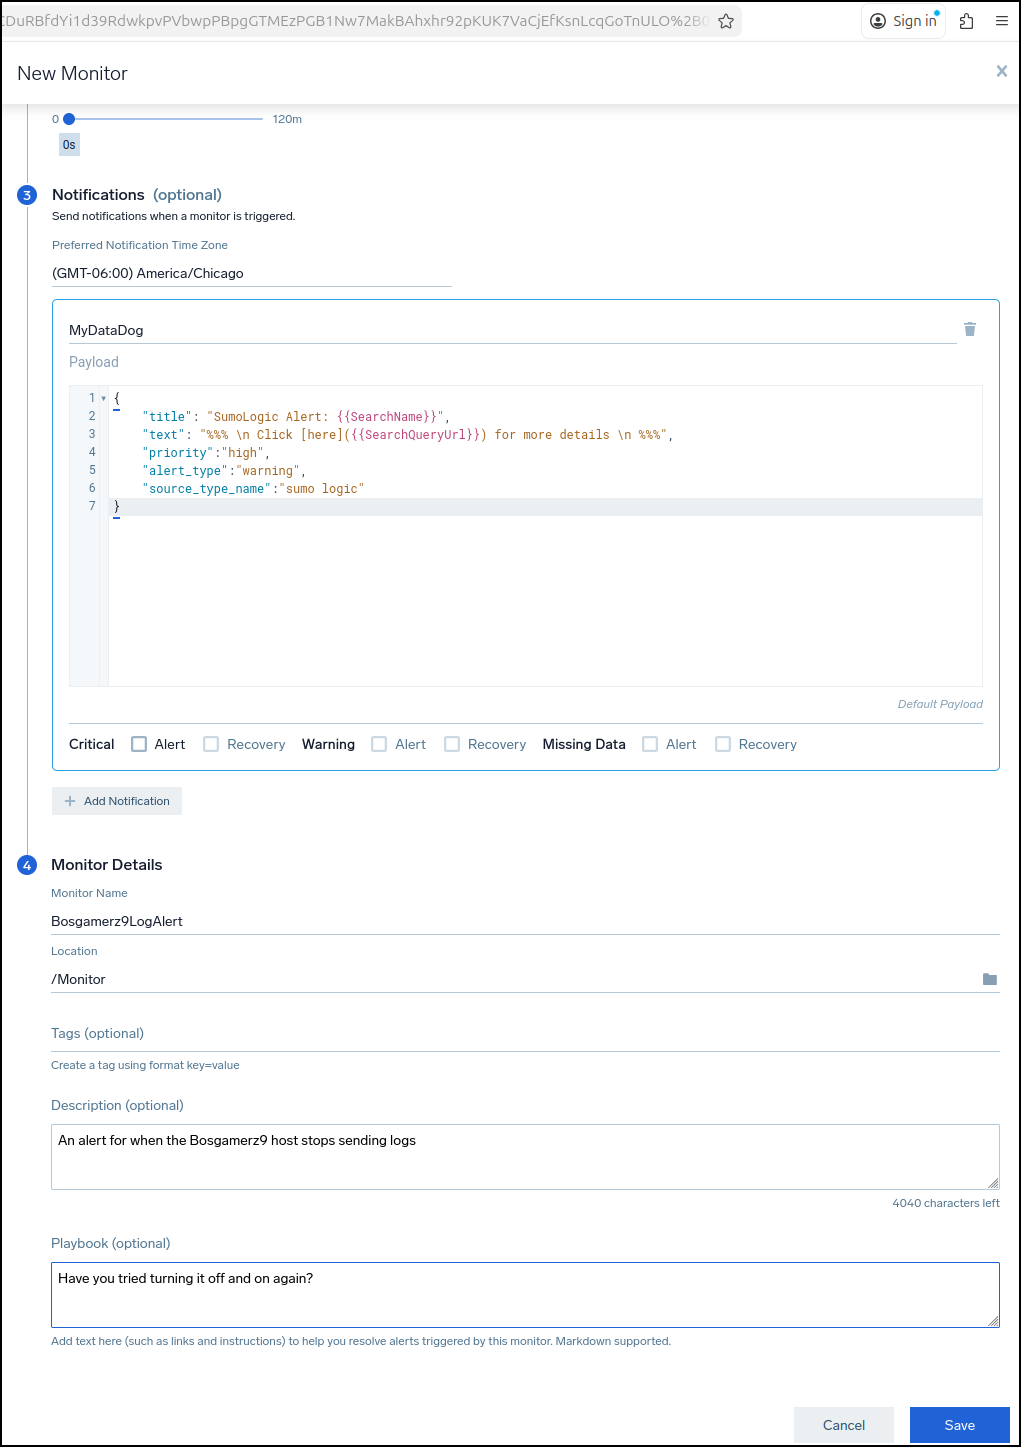
For instance, I can kick out an alert with the logs from bosgamerz9 drop to 0
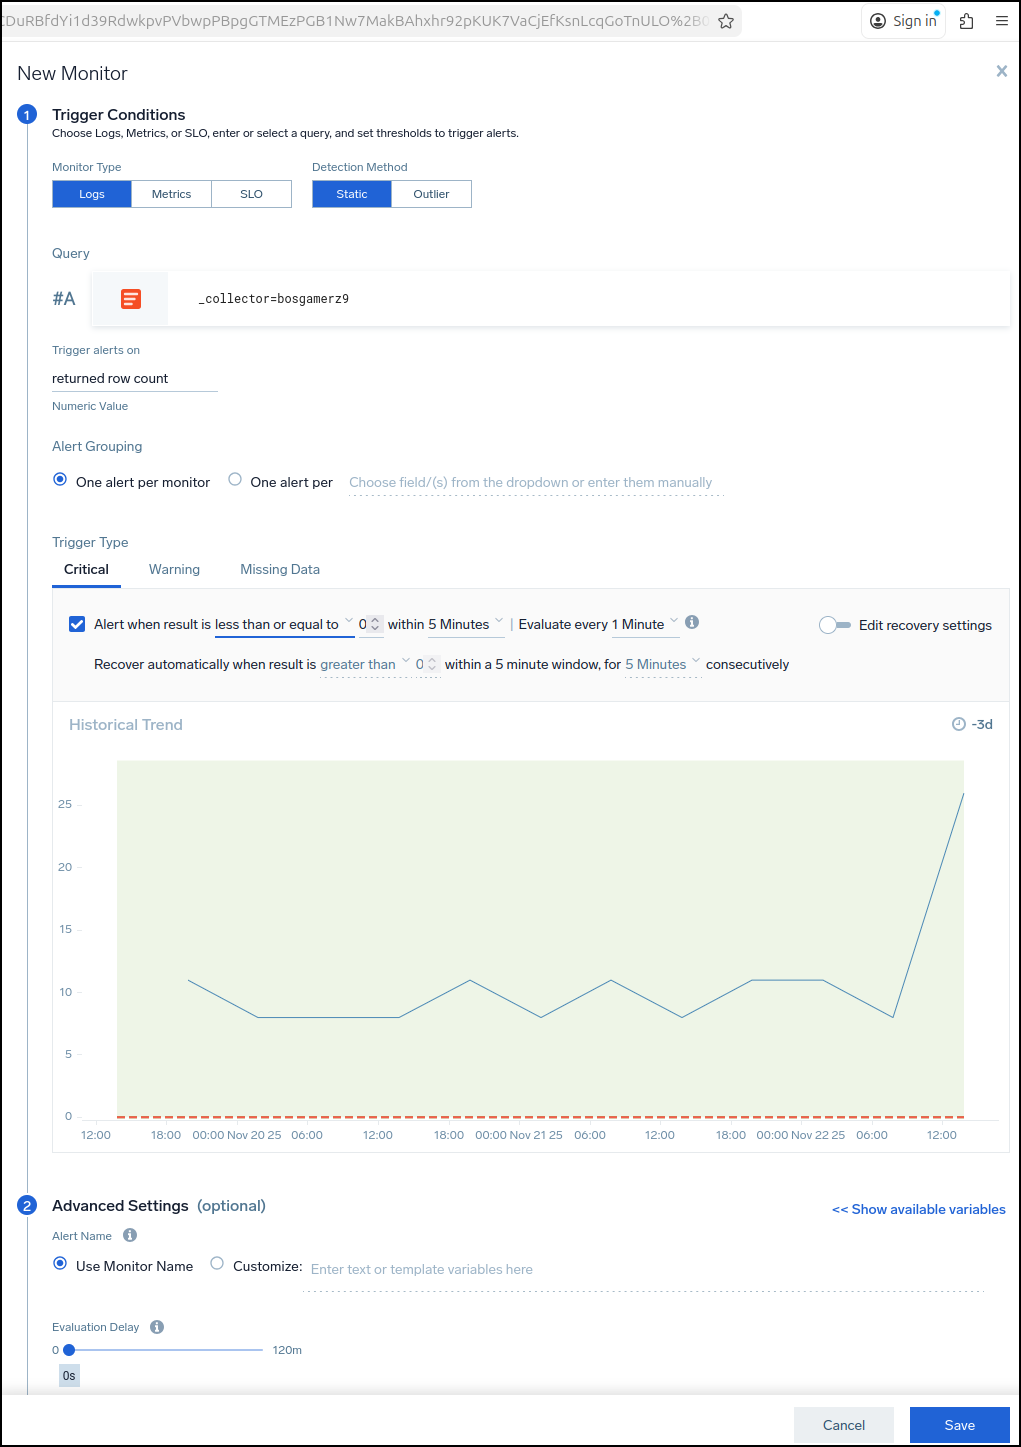
What is kind of wild is I can use Datadog now as my clearinghouse for events and alerts so this Monitor will send the problem off to my Datadog instance
Testing
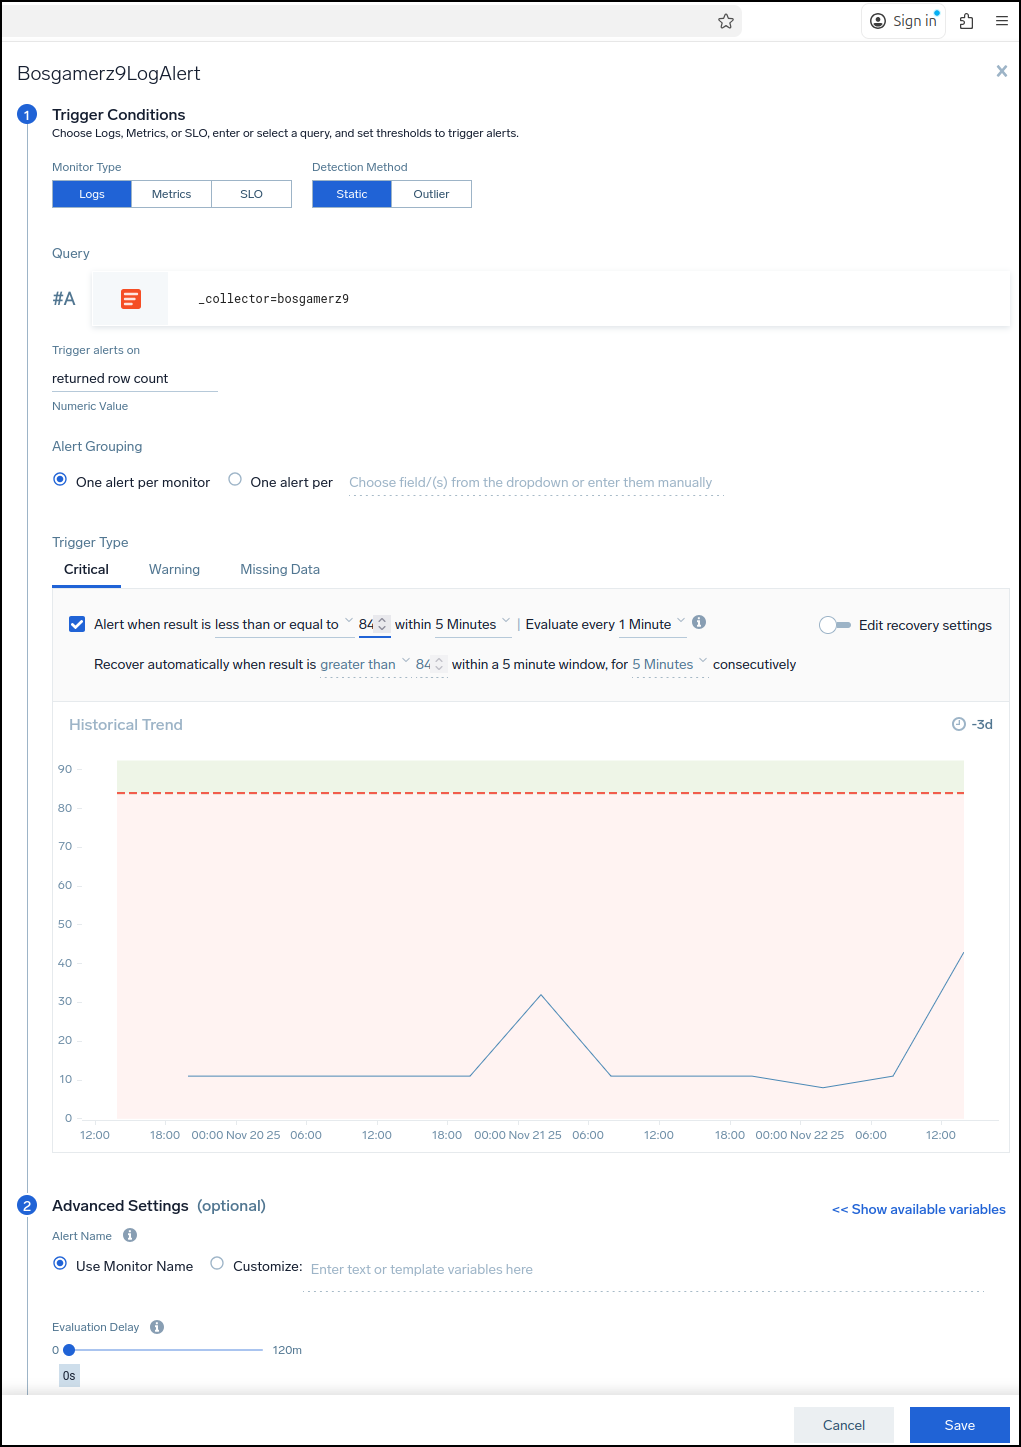
Let’s set it to alert when we have less than 84 log entries a minute just to force a bad condition
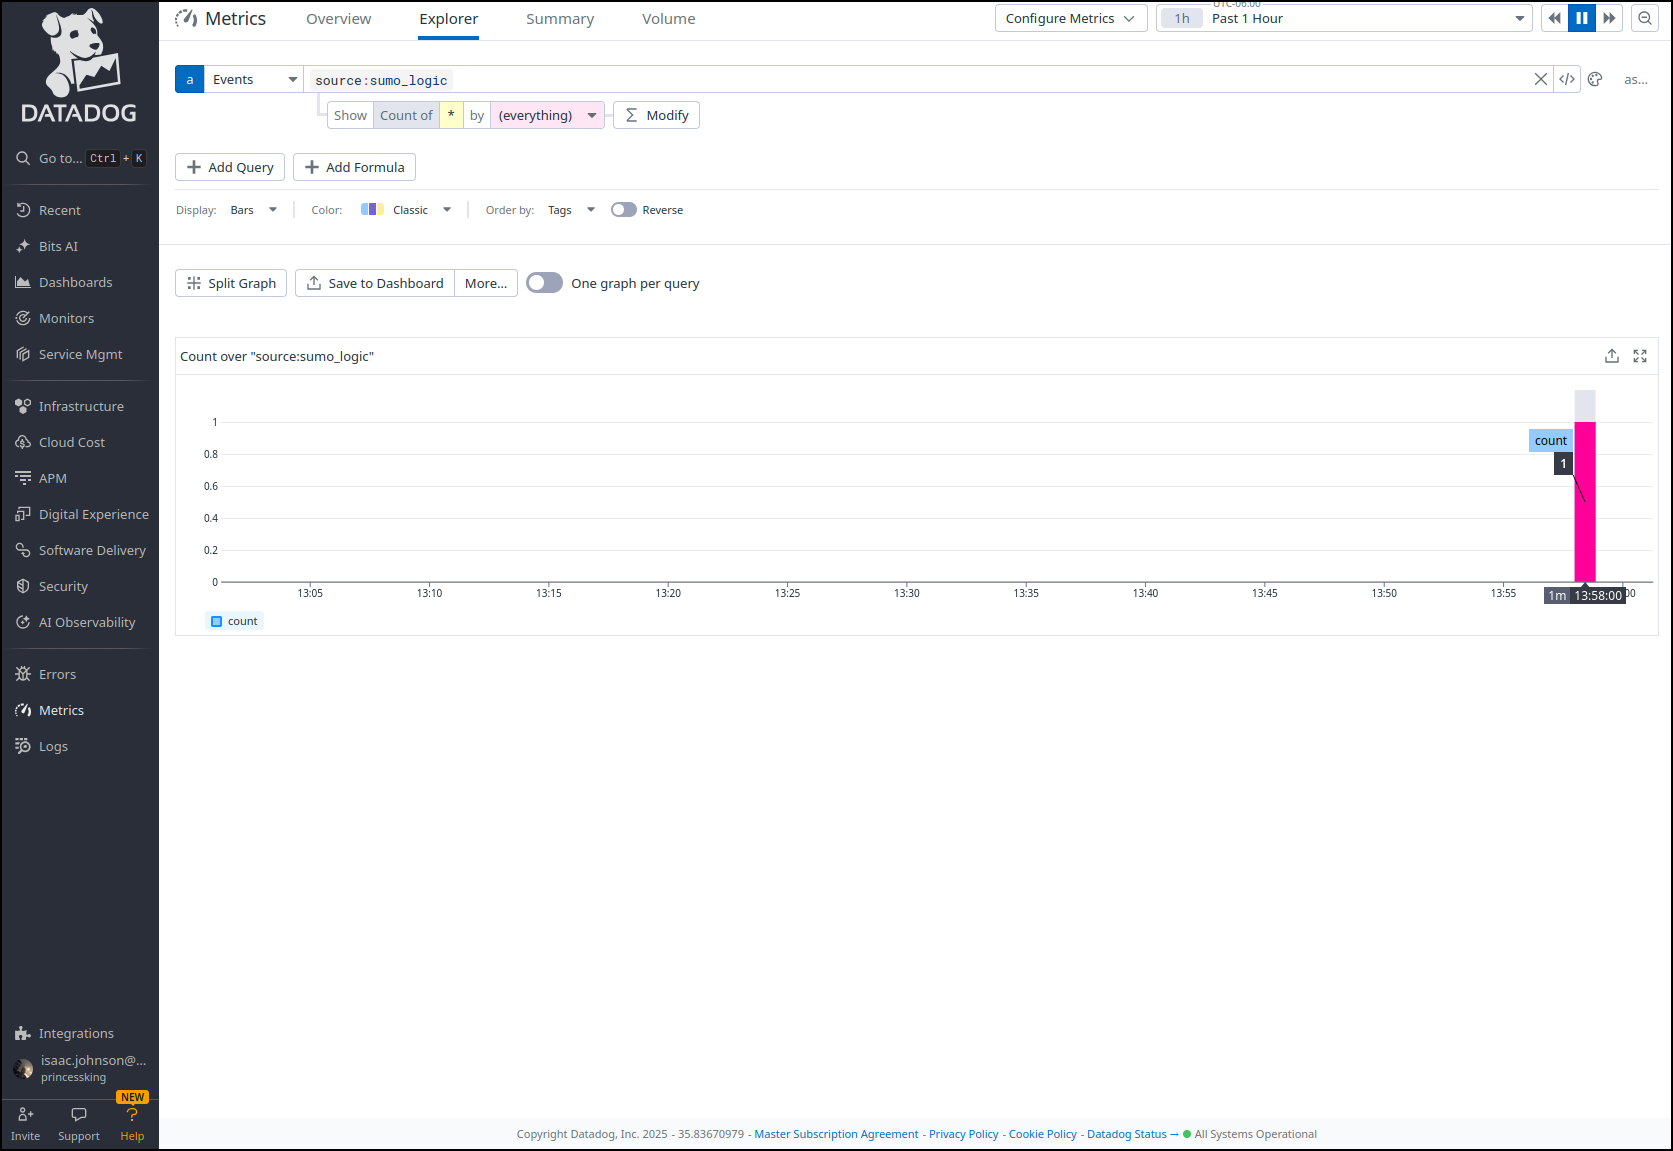
And I can now see an event set in Datadog
As I mentioned in the last post, I had used SumoLogic in the past to monitor my AKS clusters
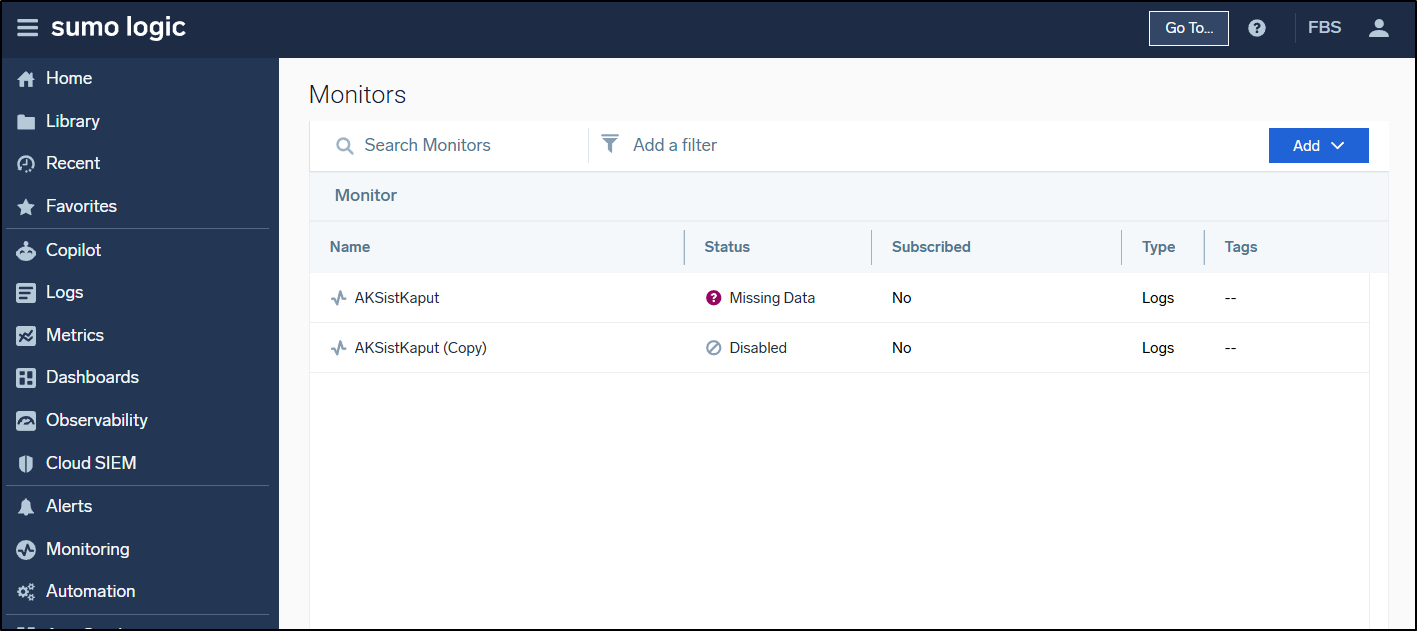
It would work by essentially looking if the Logs stopped flowing and were missing
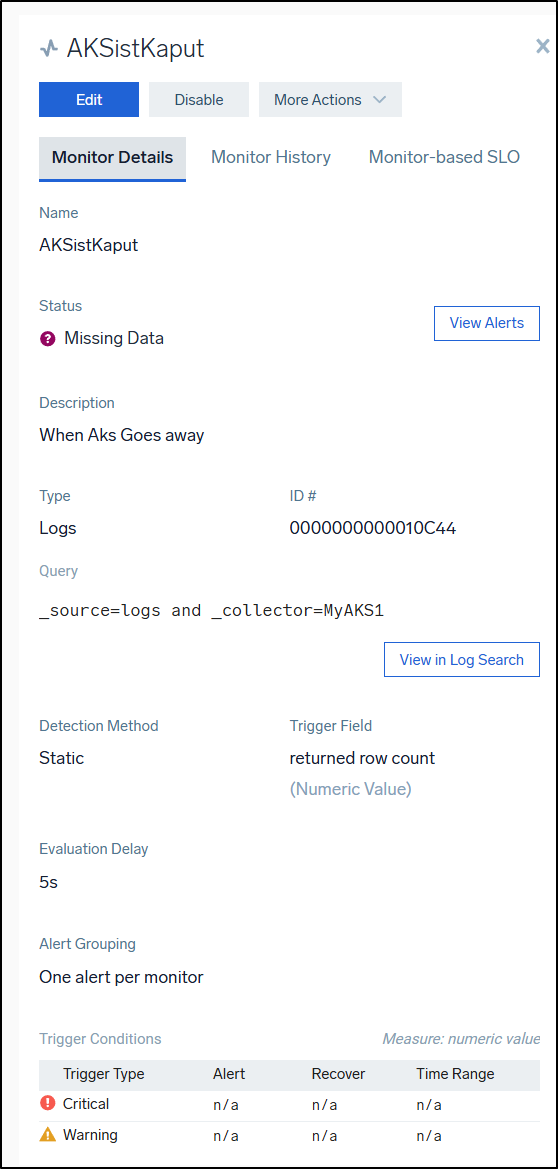
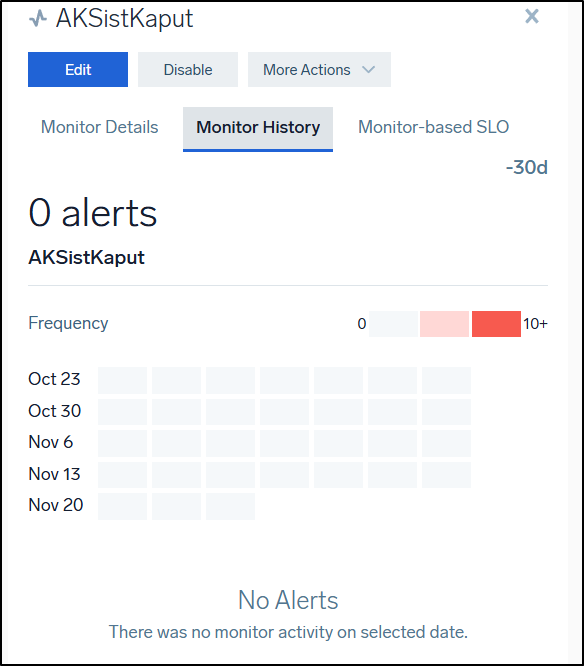
Because I am in the free tier, I can only see so much history and this alert was setup back in 2021.
However, we can see that I chose to fire just one alert per monitor.
As you see above, I also chose to wait 5 minutes in case it was just a simple update or restart.
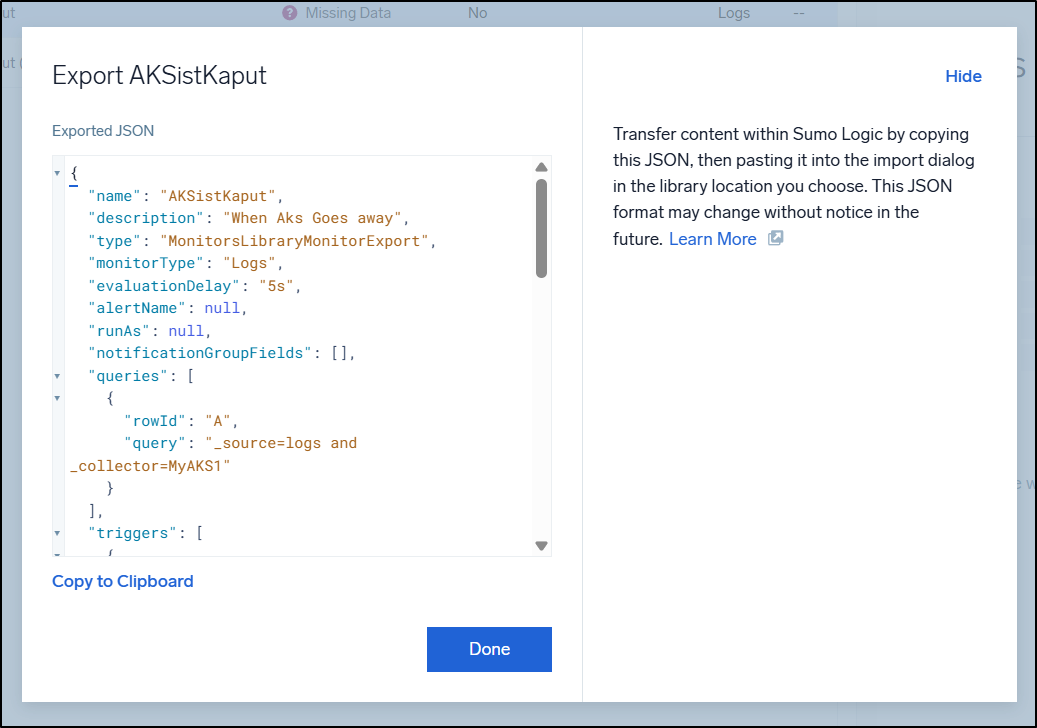
One of the features I like in the “More Actions” is the ability to kick this out as JSON so I can store it for future reference or tweak it for my needs
Alert connections
One noticeably absent option in alert connections is email.
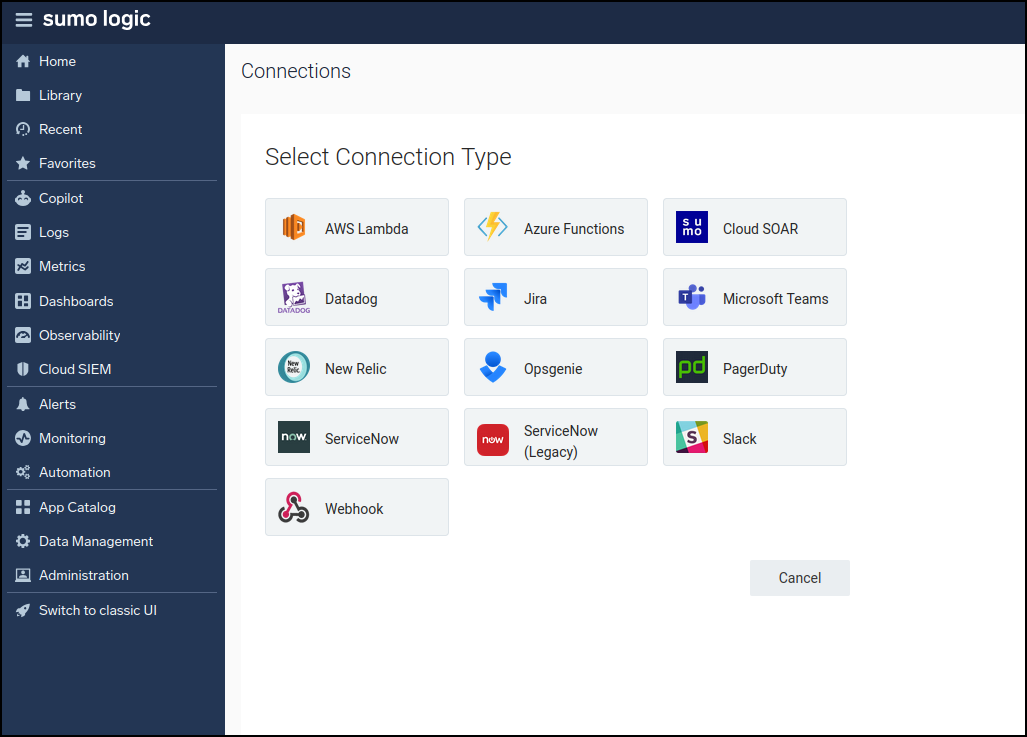
I usually use email as a catch-all to trigger things like Teams channels and Pagerduty.
There is a Pagerduty option, but I would need to create and save an API key to use it
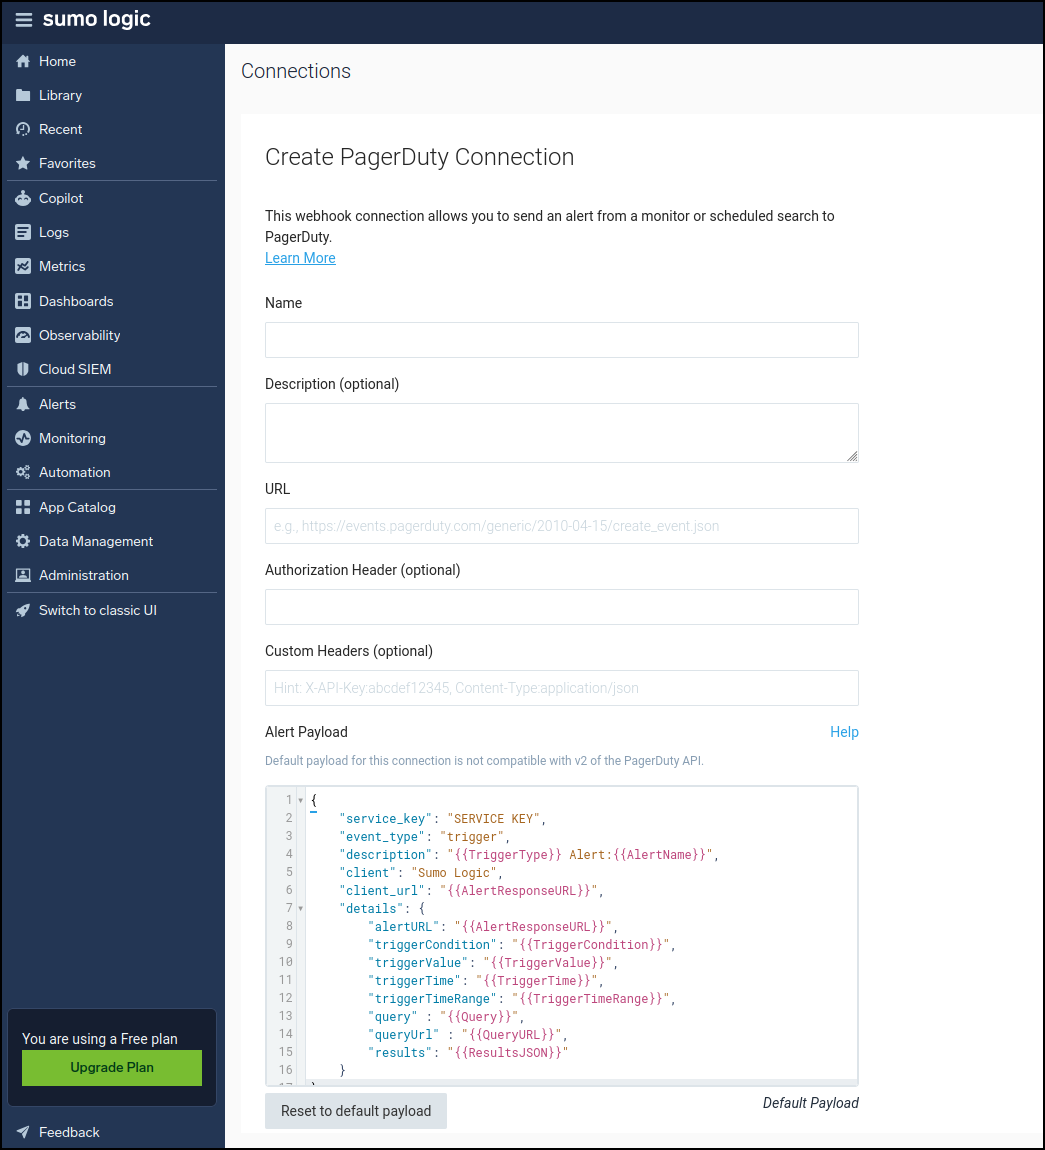
Integrations
Let’s try adding an integration for Telegram
The next screen had a configuration section for which I needed to fetch an API key. However, when i clicked away for a moment, it saved with bad values.
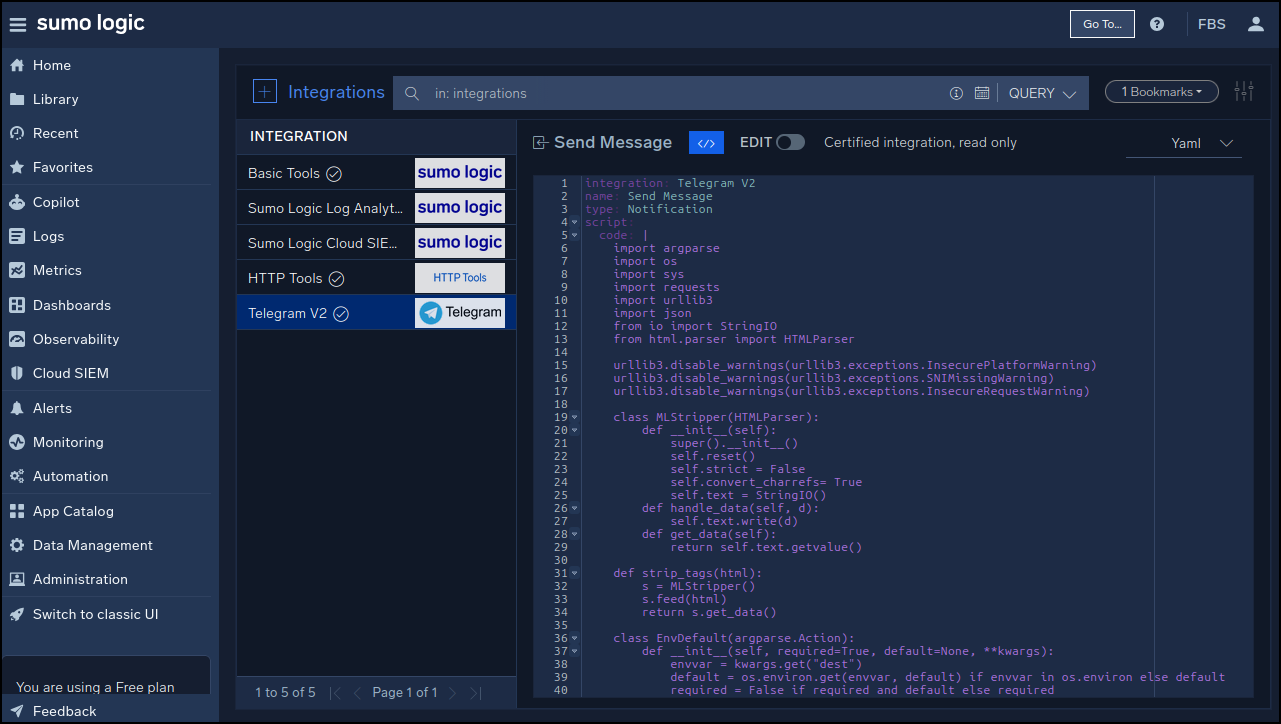
When viewing my integrations now, I can see it, but there is no way to edit it.
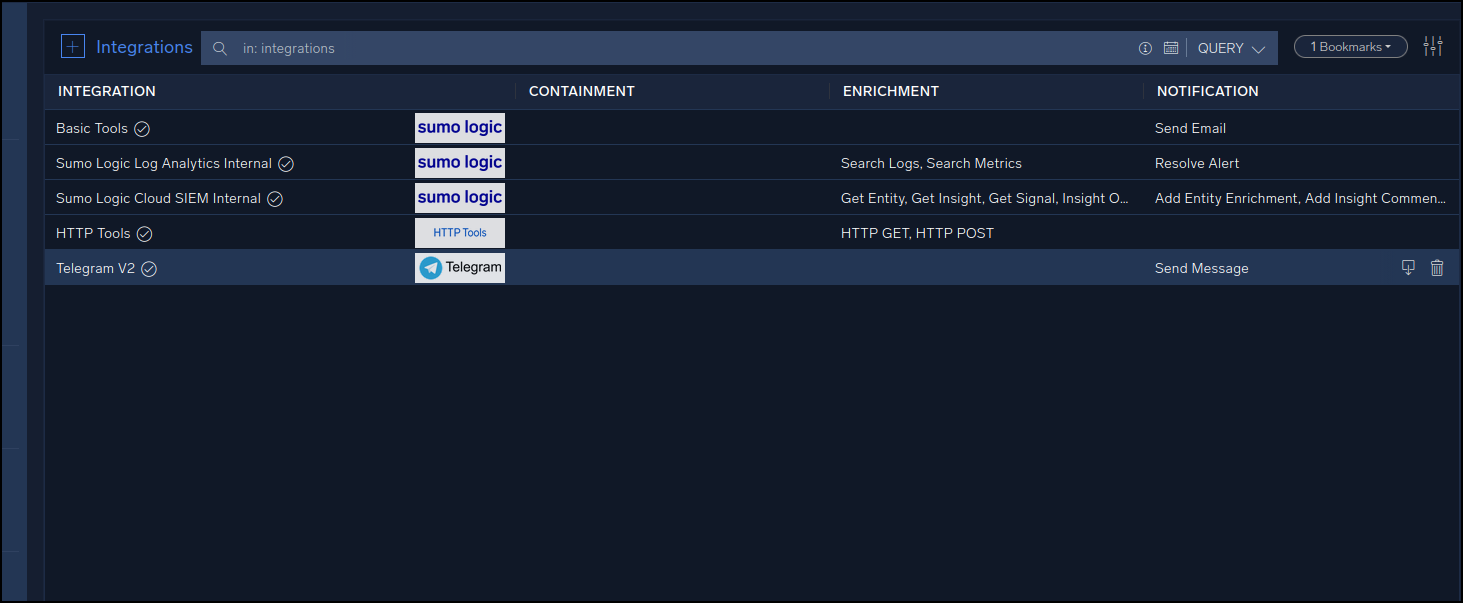
I’ll just have to delete it and start over.. but then I found I could edit the connection in a step (even though I deleted this Integration).
That then gave an error
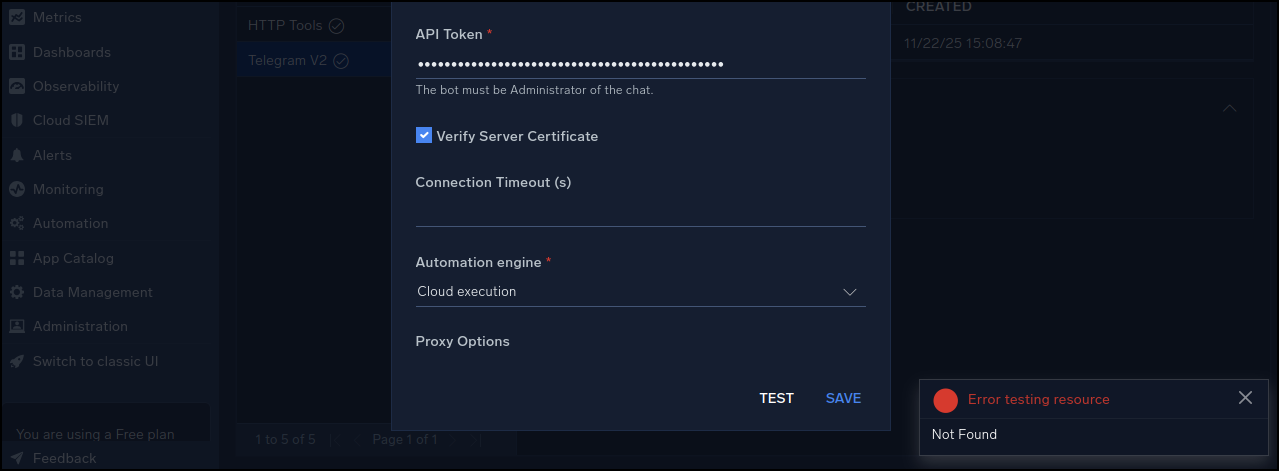
I can view the YAML code that sets up this integration, which is interesting, but I’m not sure what I would use it for
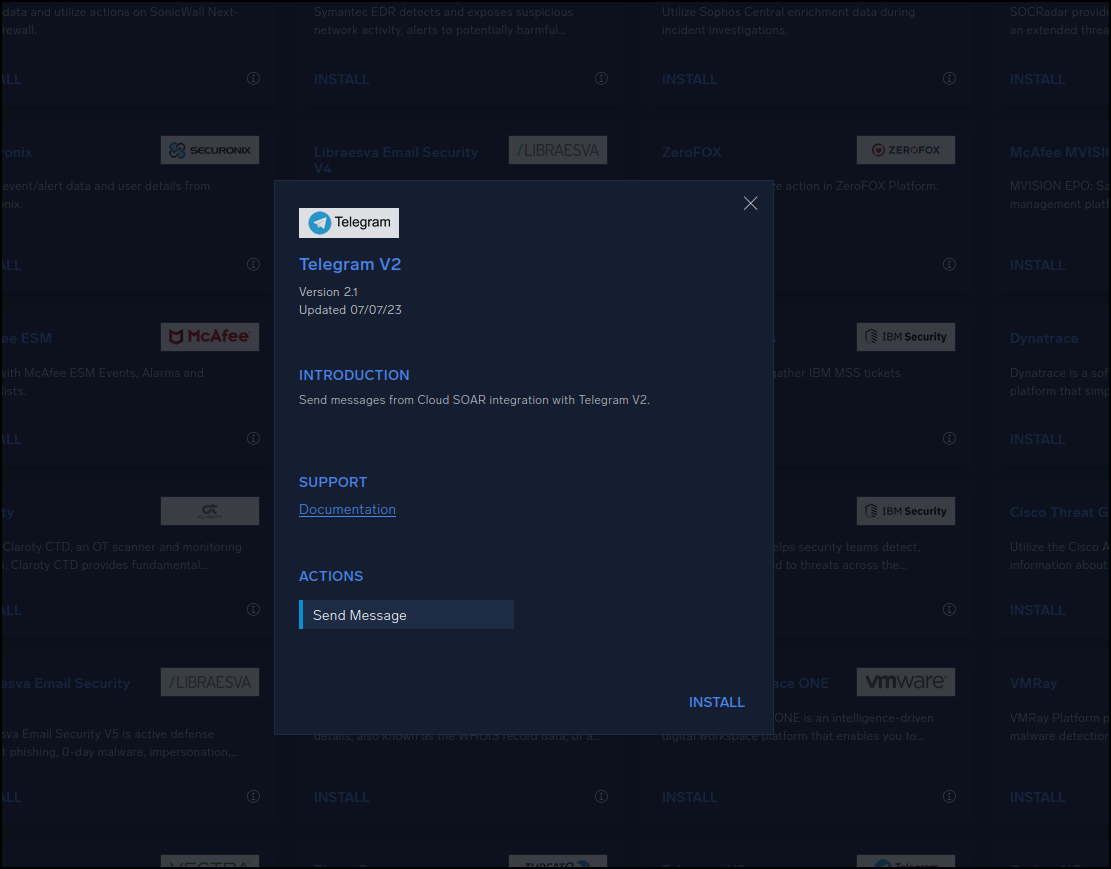
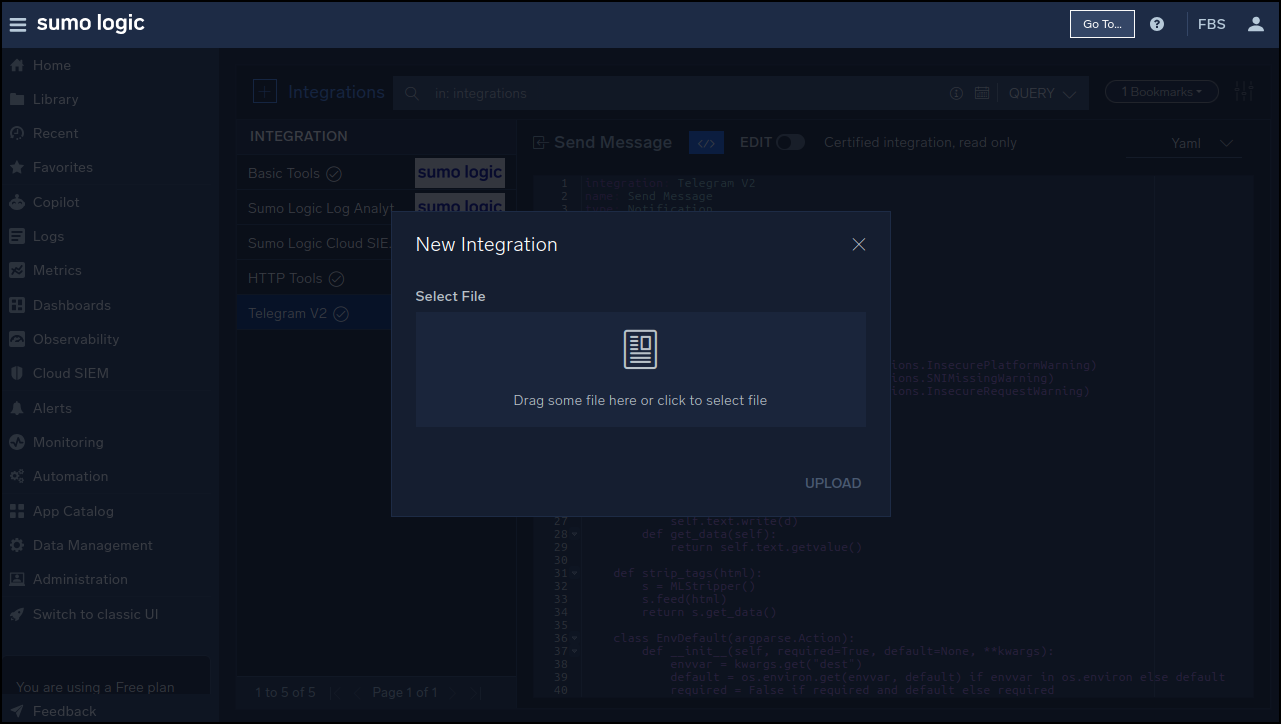
Another rather strange flow issue is that I can only add integrations with “+ Integration” in the Integrations page by uploading files. However, I can add them using a nice UI from App central
“Apps”
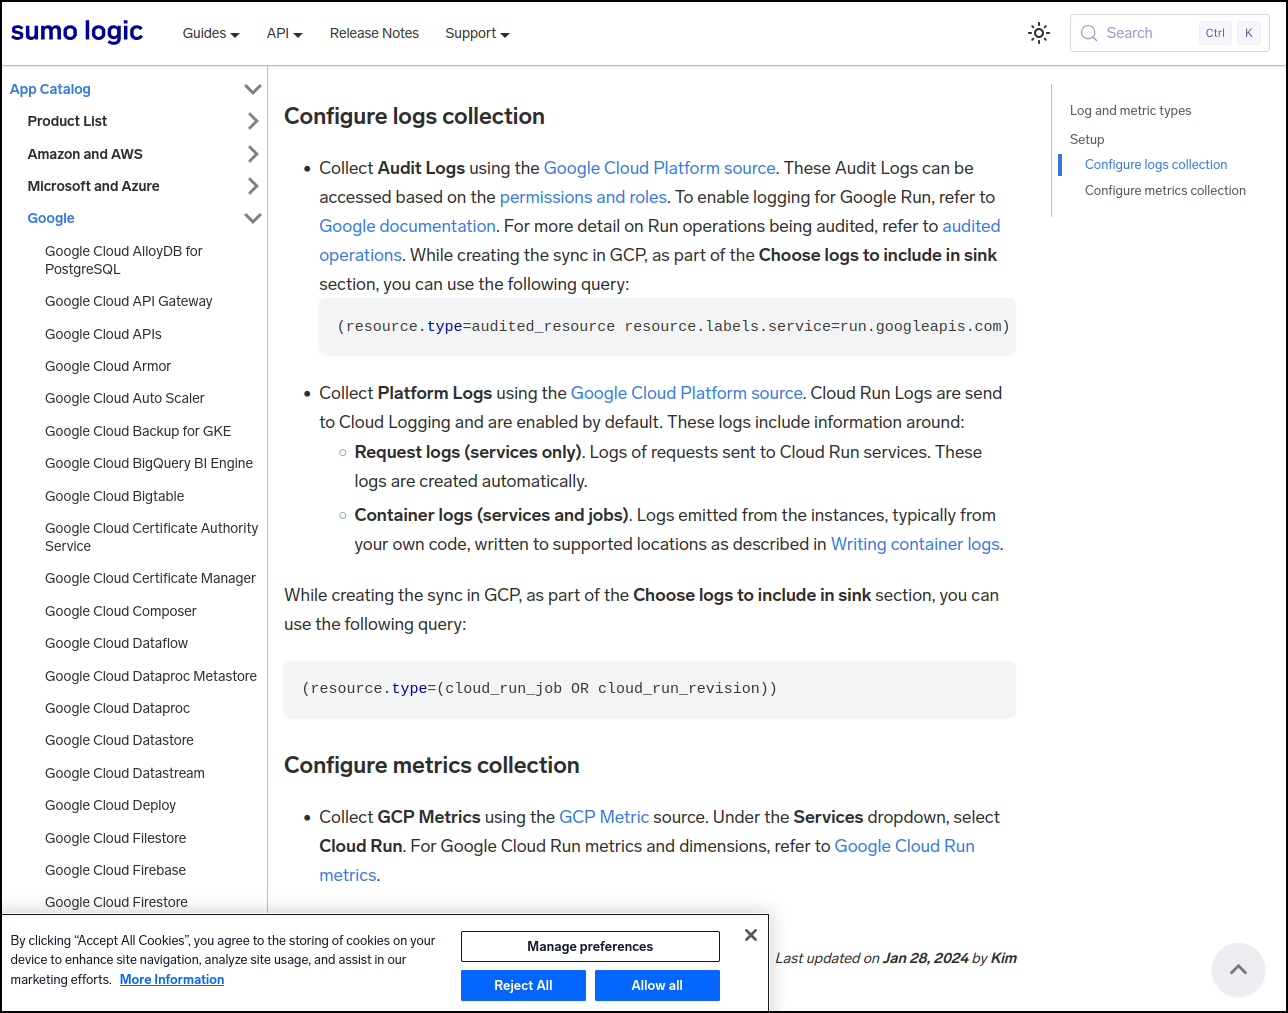
I explored the App catalog and saw I could ingest from Cloud Run which would be interesting to me
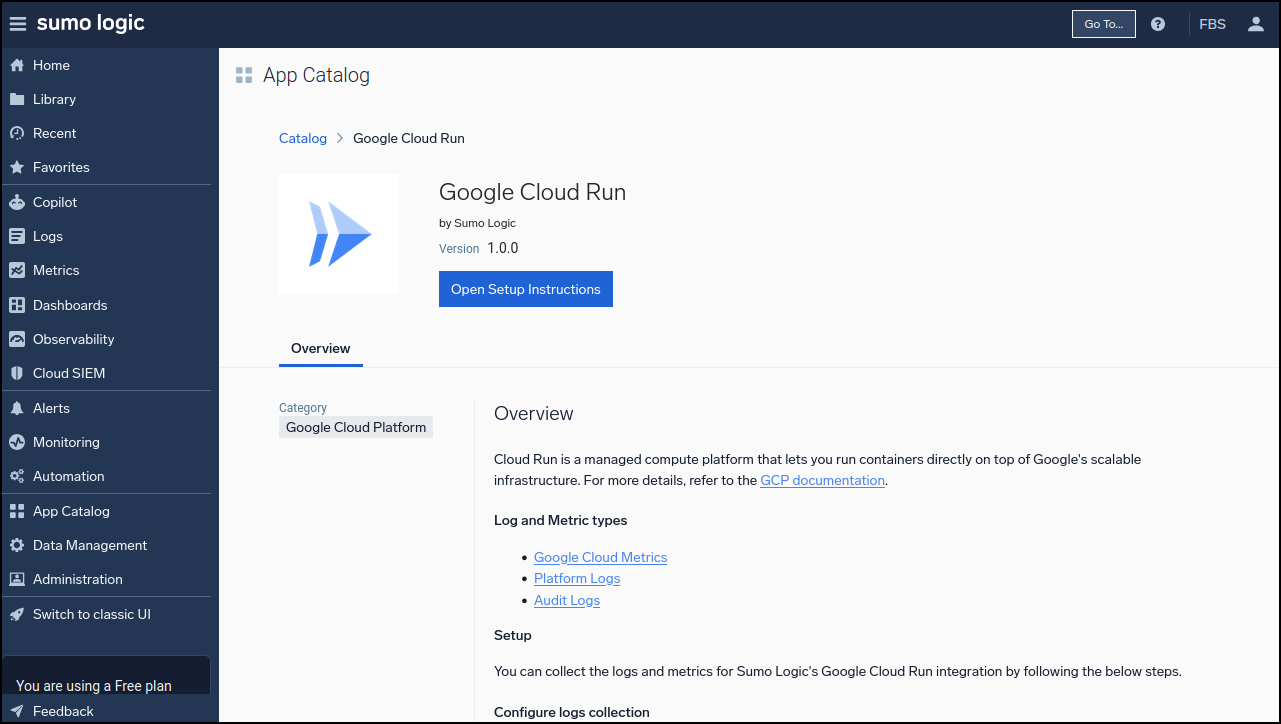
However, if you click on some of these, they are just instructions on using a more generalized collector, namely pull in the GCP source logs
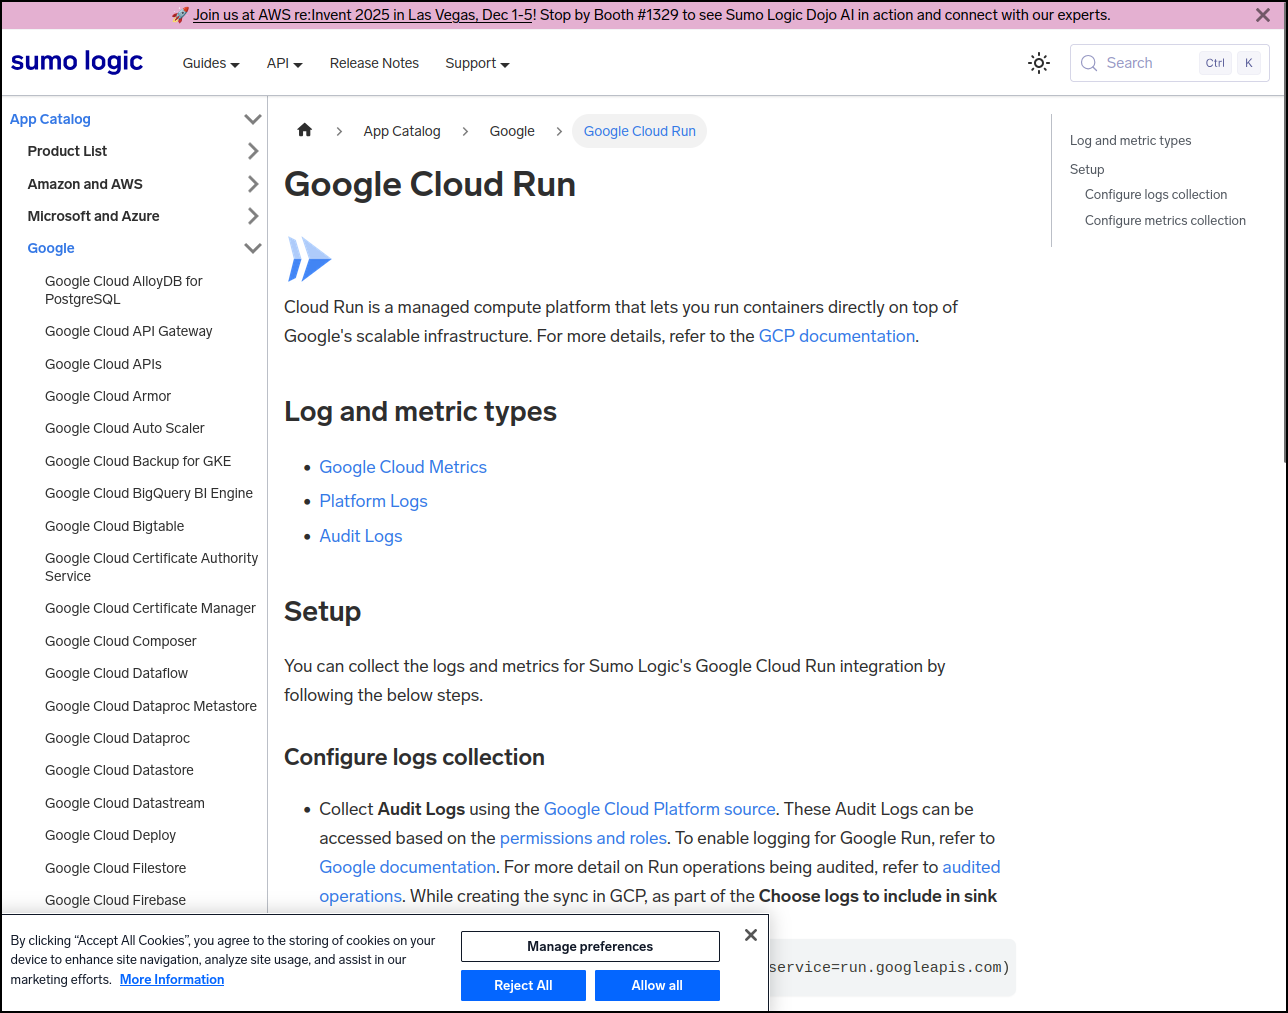
Then use a query to focus just on Cloud Run logs
Dashboards
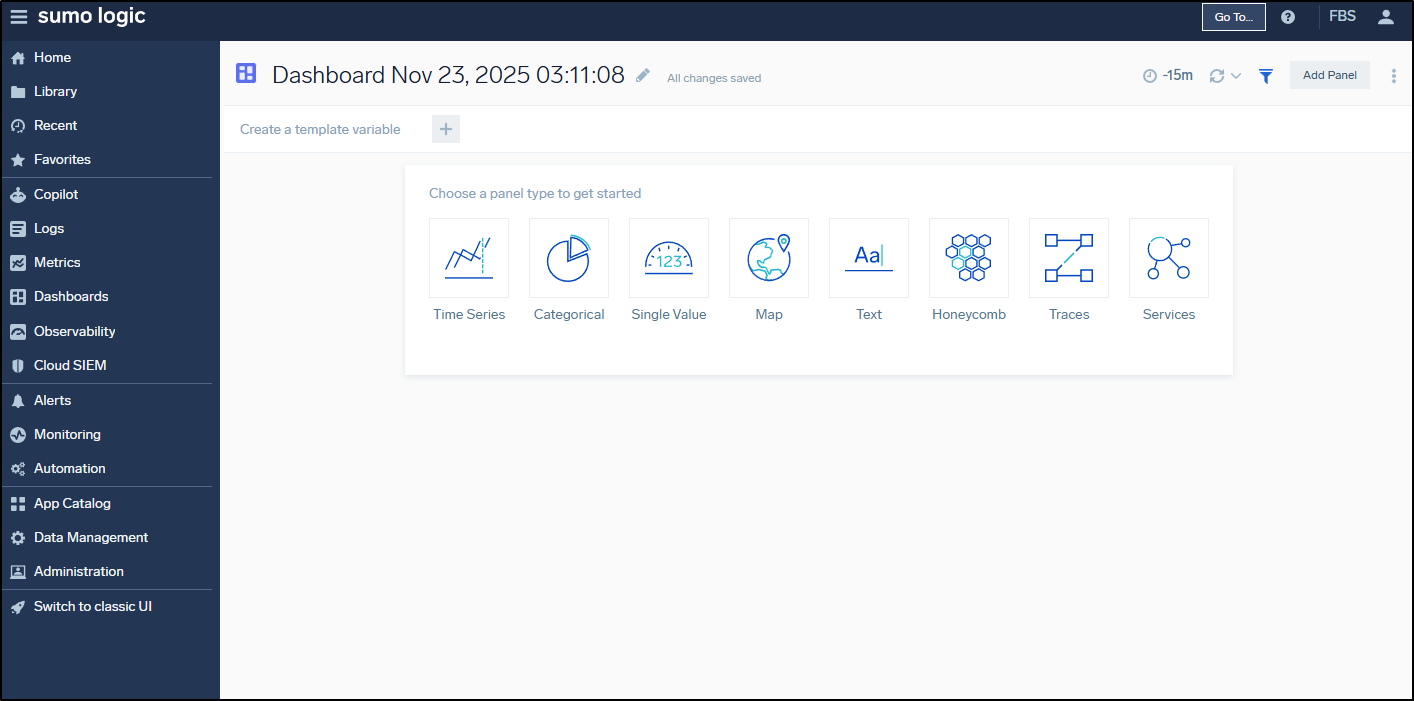
When we go to Dashboards, we can choose a new dashboard and we need to start with a panel
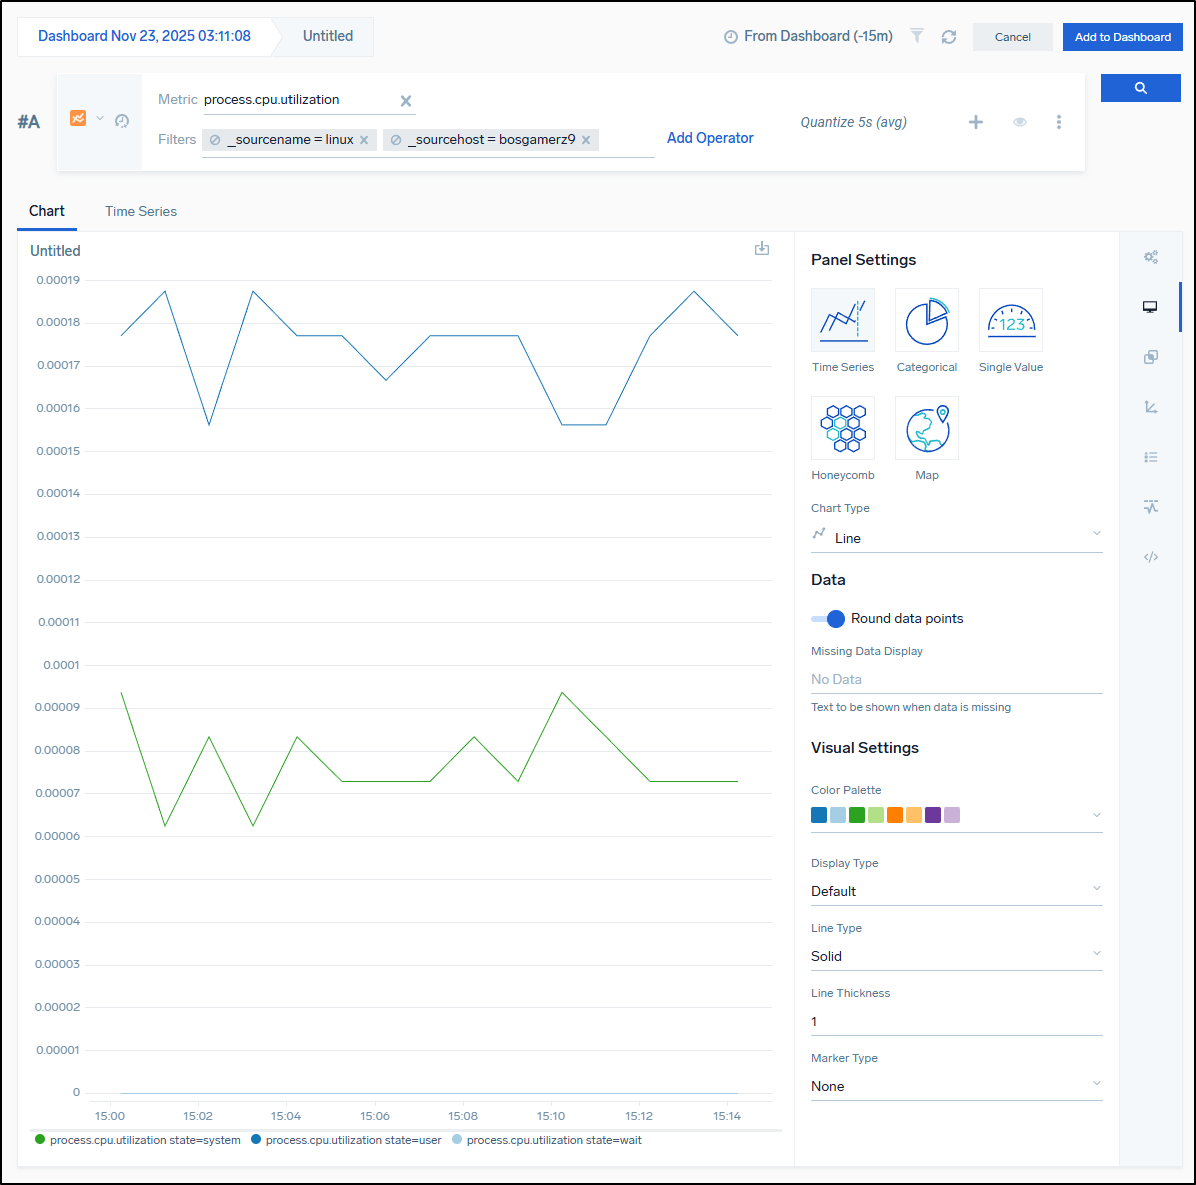
I can then work out the filter to make a functional chart. Here is one to show basic CPU utilization of Linux sources, specifically the bosgamerz9 host
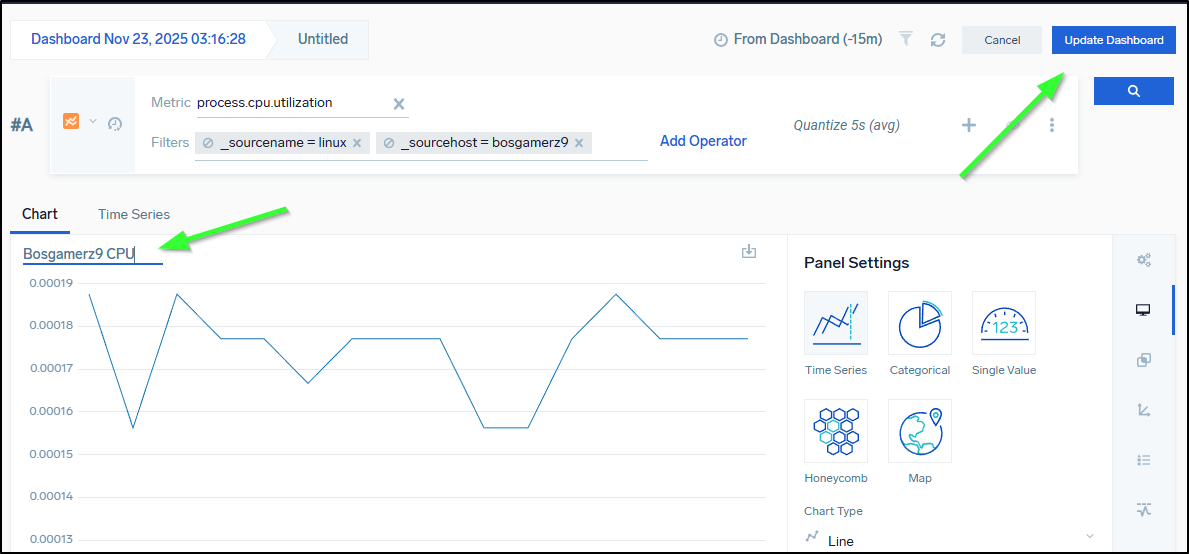
We need to name our panel then save or update the dashboard
We can do math in widgets - such as change bytes to Gb
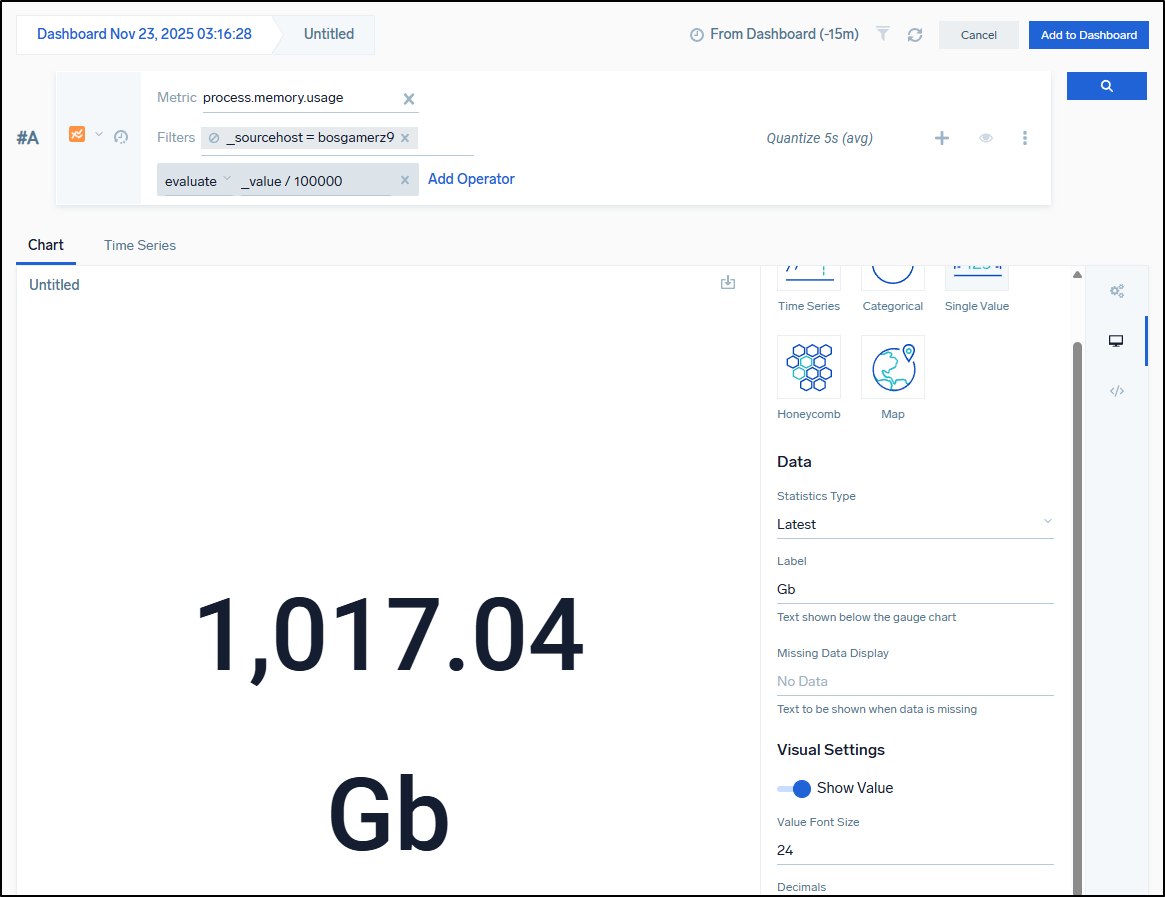
which matches the value I see presently
builder@bosgamerz9:~$ free -mh
               total        used        free      shared  buff/cache   available
Mem:            12Gi       5.1Gi       1.1Gi        97Mi       6.4Gi       7.3Gi
Swap:          4.0Gi       3.7Gi       344Mi
We can tweak the time windows:
Integrations
Let’s just take a quick look at an AWS CloudFront collector.
I was surprised this still functioned as I set it up years ago and rather forgot about it
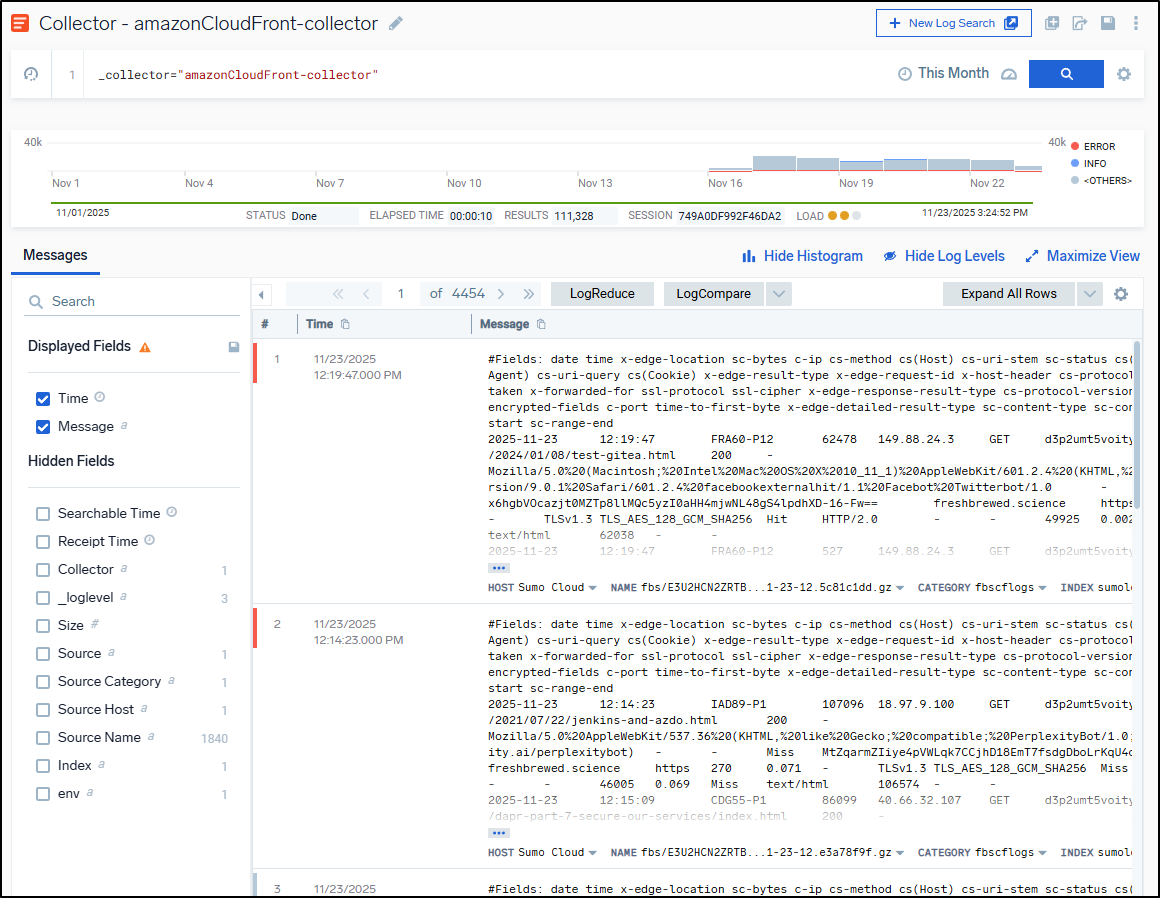
The problem is really illustrated in how much of it is bot traffic - a vast majority are error logs from places like linkup.so and openai search
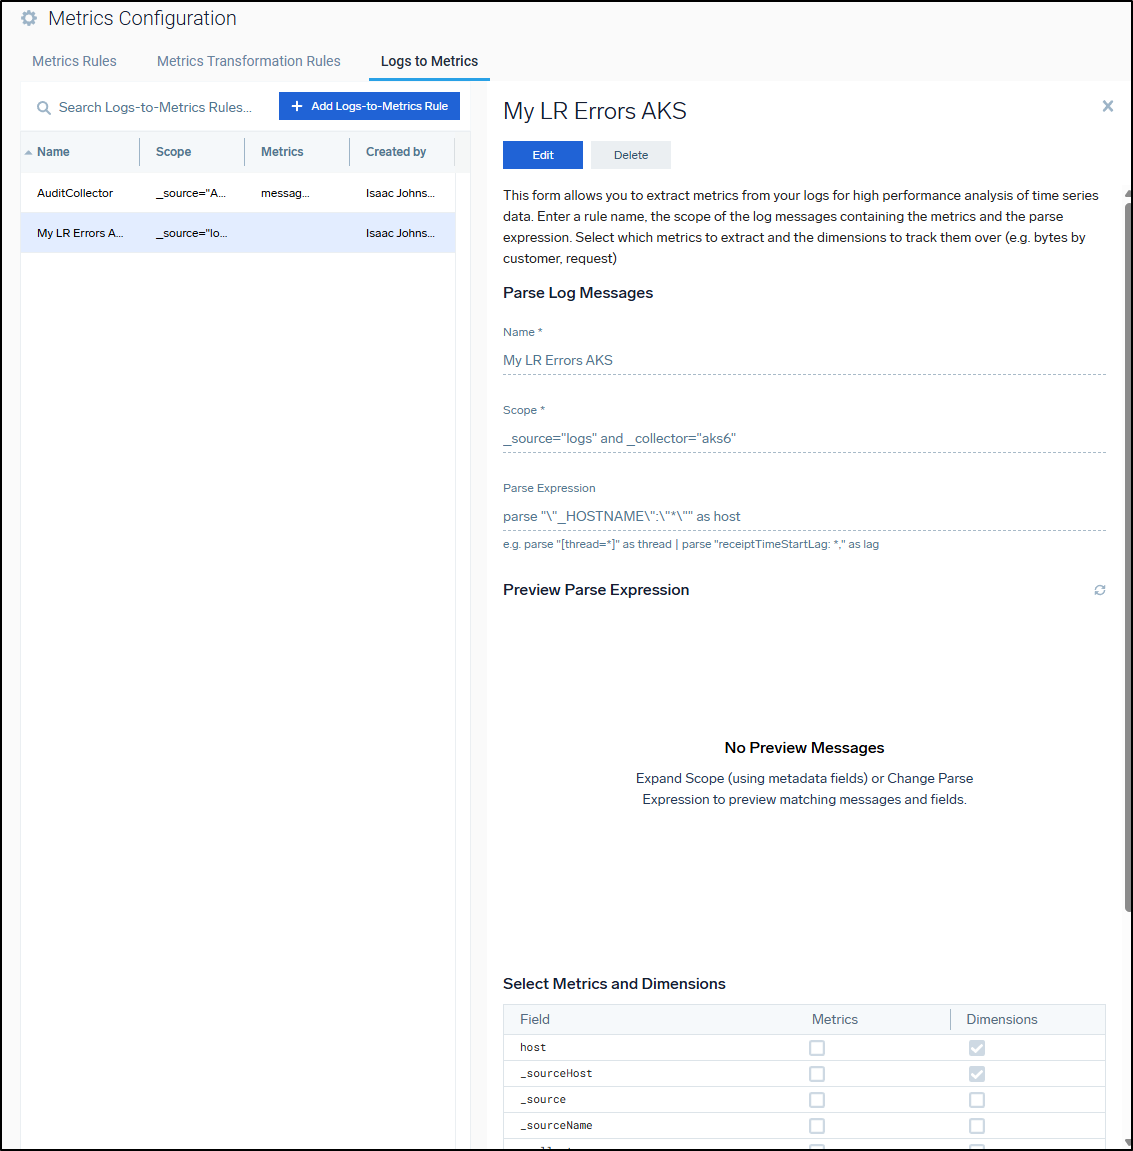
Logs to Metrics
We can see some rules that can pull out hostname from logs, for instance, and store as metrics (good for tracking host changes over time for AKS)
Usage
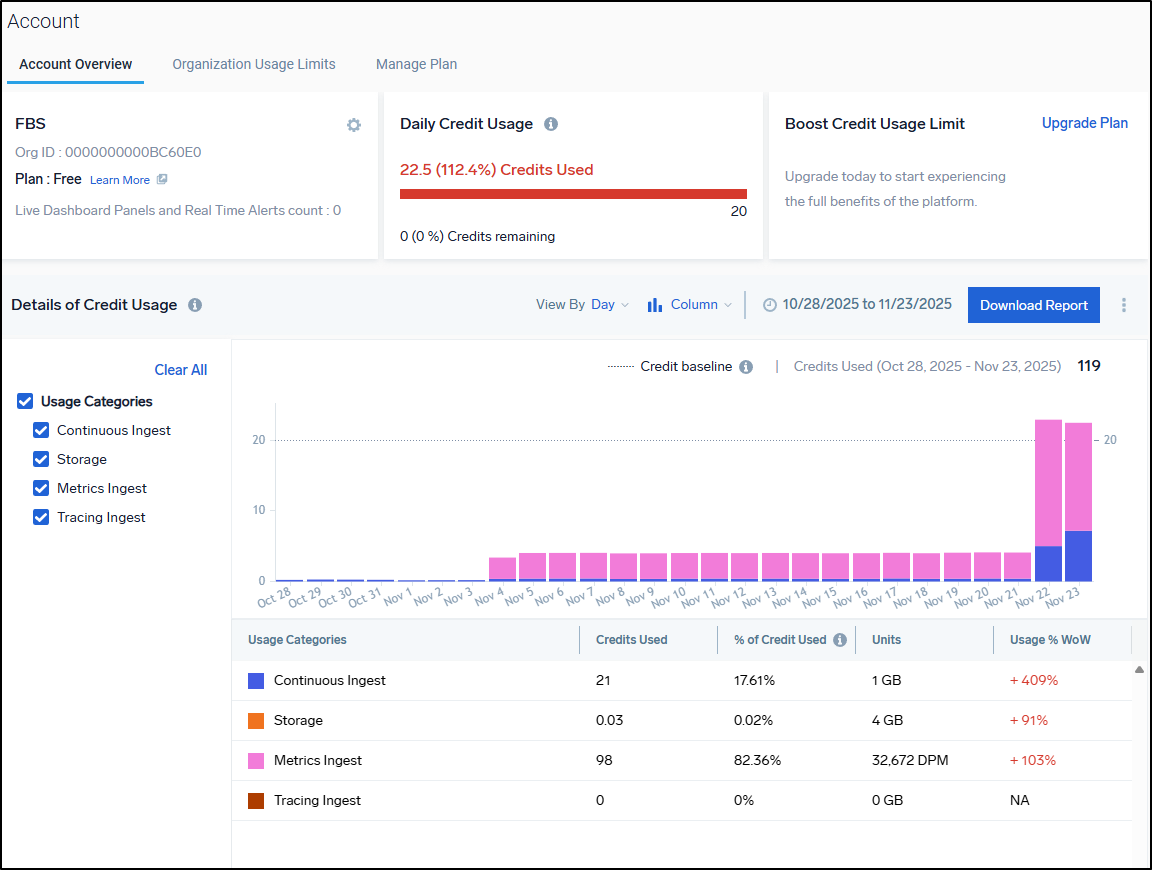
i can see from the account overview I burned through all my credits in just a few days (but free is free)
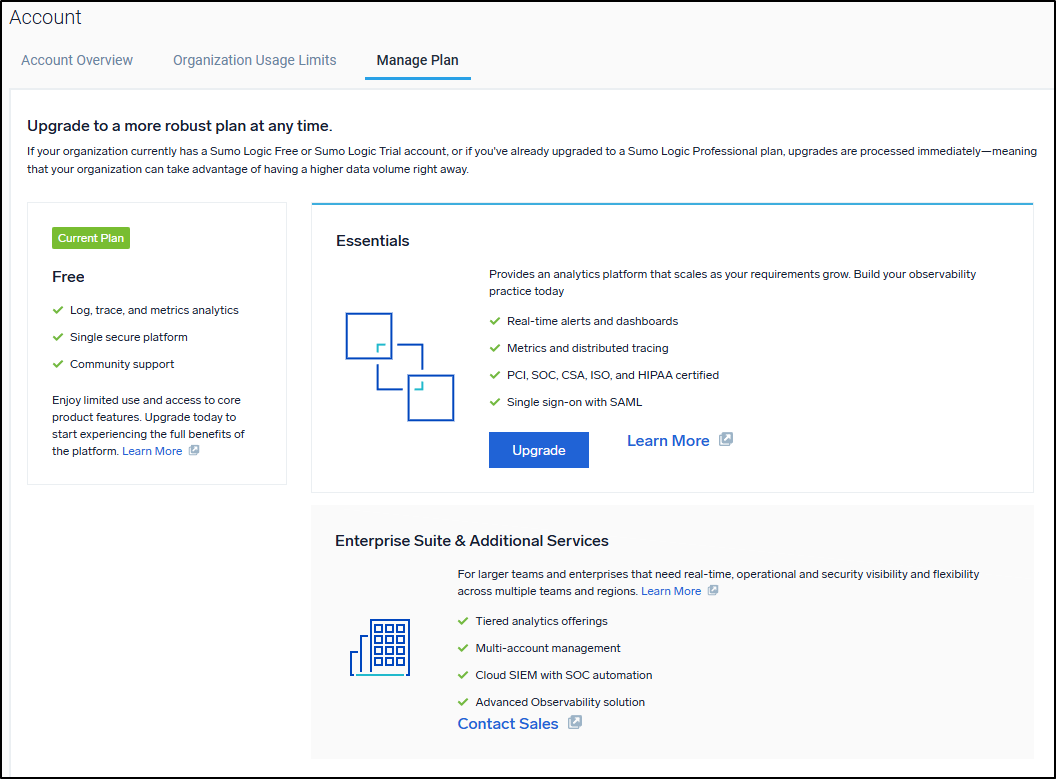
I can of course Upgrade my plan
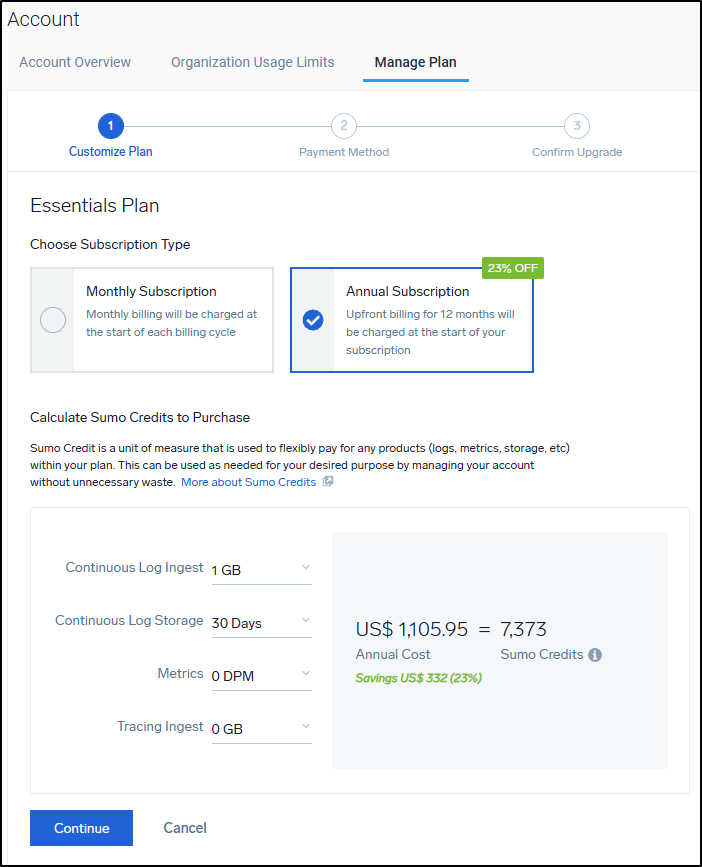
Which really only goes as cheap as $1200/year so it’s a bit out of my range
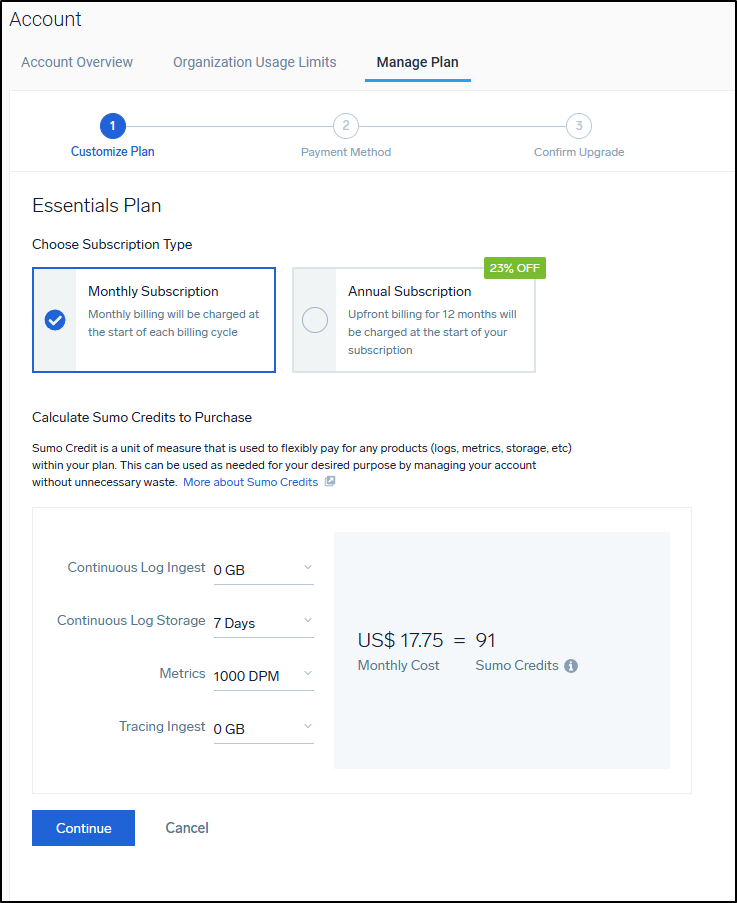
I mean, you could just use it for metrics and skip traces and logs which could be $17.75/mo which might do okay (e.g. send all things as prom or otel metrics and alert as such)
Summary
Today I worked through Kubernetes observability with Sumo Logic including setting up the App using Helm to my test cluster. We looked at metrics, logs, and looking at details by pod, namespace and container.
I covered alerts, monitors and some integrations including AWS CloudFront. I only touched on Logs to Metrics and Apps. Lastly, I wrapped with costs.
SumoLogic, in my opinion, is a perfectly fine observability suite that really focuses on metrics. Everything really revolves around queries from collectors. If you love Prometheus or writing PromQL, it’s fun, but might be a steep learning curve for others.
I think I have issues with the limited monitor destinations. I would really want email as a first class destination. The “classic apps” really just seem “how to” guides using standard cloud collectors.
Lastly, I think the costs are a bit high for what one gets. I’m happy, however, they finally have a free tier that is usable. So with some careful curation and limited ingest, it could be usable for the hobbyist.