Published: Nov 5, 2024 by Isaac Johnson
This is one of those articles where I intended to dig into several different open-source monitoring suites but really just got enamored with the first. Beszel, which I can only assume was named after a fictional city-state in this recent sci-fi book by Chin Mieville is a Container Monitoring app that is impressively complete.
Today we are going to dig into Beszel. We’ll set it up as a containerized service with TLS forwarding from Kubernetes using cert-manager with LE tied to AWS Route53. We’ll look at S3 compliant backends for storage and backups in Akamai/Linode. We’ll explore federated auth with Github and Google and lastly notifications and alerts with Sendgrid.
Let’s dig in!
Docker setup
Let’s start with the Docker compose. We need to fire up the Hub first.
I’ll create the compose file and dir
builder@builder-T100:~$ mkdir beszel
builder@builder-T100:~$ cd beszel/
builder@builder-T100:~/beszel$ vi docker-compose.yaml
builder@builder-T100:~/beszel$ cat docker-compose.yaml
services:
  beszel:
    image: 'henrygd/beszel'
    container_name: 'beszel'
    restart: unless-stopped
    ports:
      - '8090:8090'
    volumes:
      - ./beszel_data:/beszel_data
builder@builder-T100:~/beszel$ mkdir ./beszel_data
builder@builder-T100:~/beszel$ chmod 777 ./beszel_data/
Then fire it up
builder@builder-T100:~/beszel$ docker compose up
[+] Running 3/3
 ✔ beszel 2 layers [⣿⣿]      0B/0B      Pulled                                                                                                                 2.4s
   ✔ 5689fae807c6 Pull complete                                                                                                                                1.0s
   ✔ 14edb549764f Pull complete                                                                                                                                1.1s
[+] Building 0.0s (0/0)
[+] Running 2/2
 ✔ Network beszel_default  Created                                                                                                                             0.4s
 ✔ Container beszel        Created                                                                                                                             0.3s
Attaching to beszel
beszel  | 2024/10/31 00:09:27 Server started at http://0.0.0.0:8090
beszel  | ├─ REST API: http://0.0.0.0:8090/api/
beszel  | └─ Admin UI: http://0.0.0.0:8090/_/
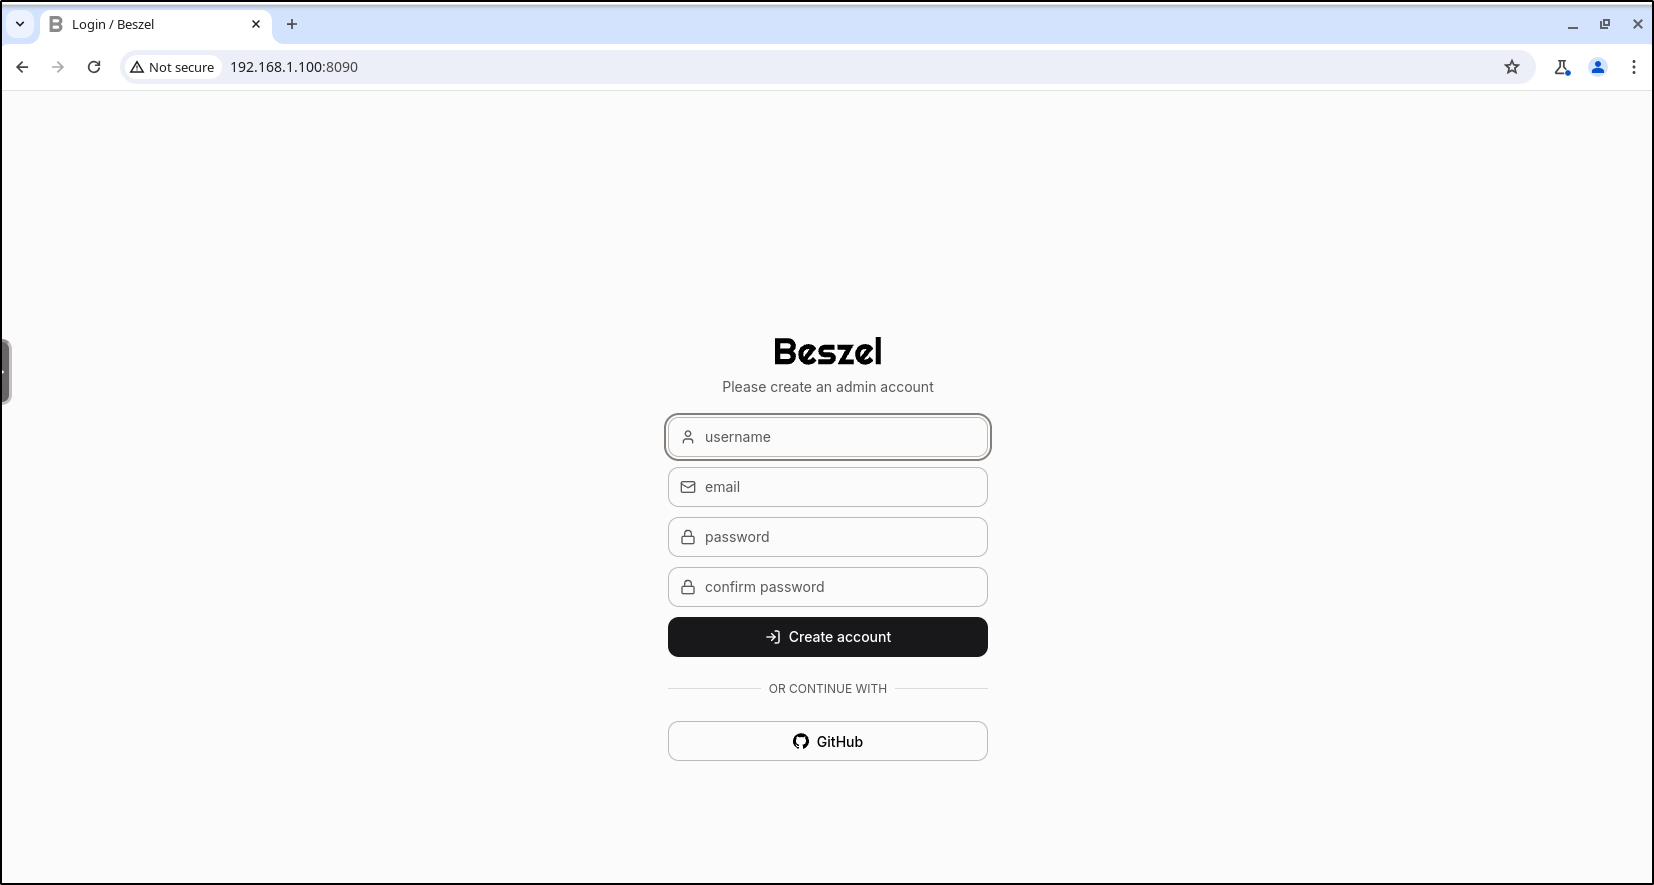
I can now access the Admin UI for Hub and create an admin user
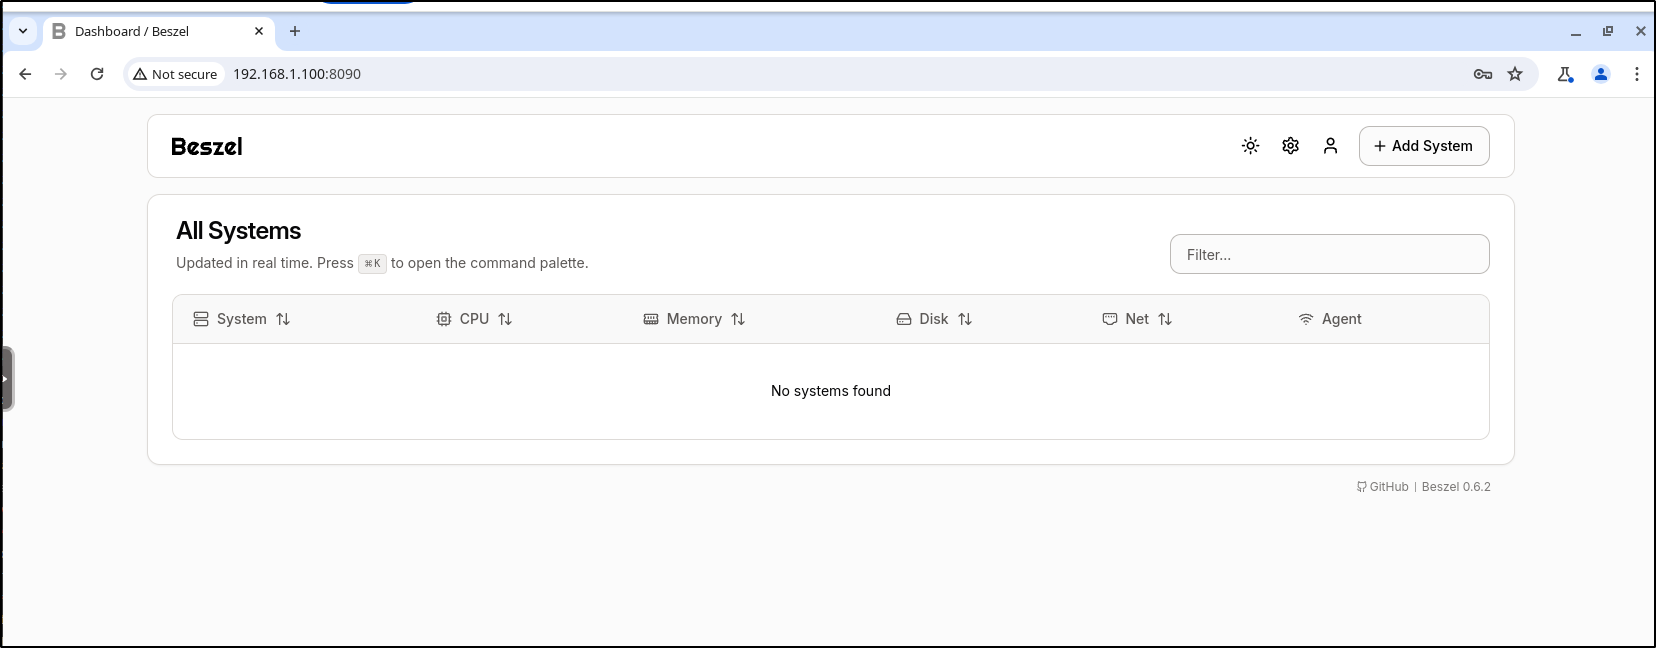
Once created, I can see the Beszel dashboard
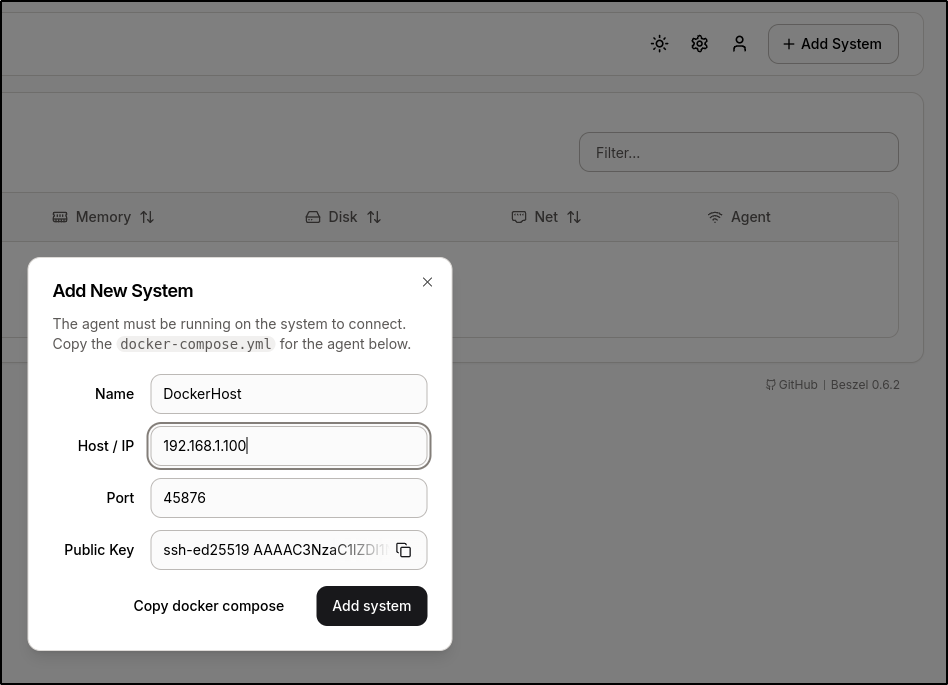
I’ll now want to add the docker host itself, so we can use “+ Add System” to do that
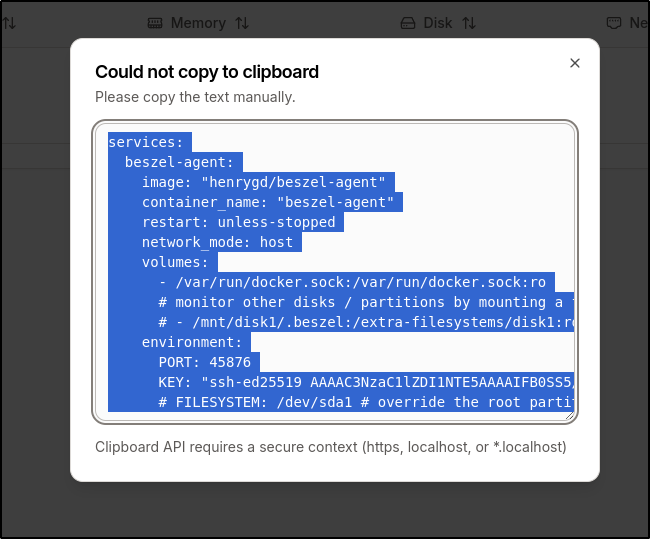
I’ll copy to clipboard
I can now make the agent directory and save that docker-compose.yaml file
builder@builder-T100:~/beszel/agent$ vi docker-compose.yaml

builder@builder-T100:~/beszel/agent$
builder@builder-T100:~/beszel/agent$ cat ./docker-compose.yaml
services:
  beszel-agent:
    image: "henrygd/beszel-agent"
    container_name: "beszel-agent"
    restart: unless-stopped
    network_mode: host
    volumes:
      - /var/run/docker.sock:/var/run/docker.sock:ro
      # monitor other disks / partitions by mounting a folder in /extra-filesystems
      # - /mnt/disk1/.beszel:/extra-filesystems/disk1:ro
    environment:
      PORT: 45876
      KEY: "ssh-ed25519 AAAAC3NzaC1lZDI1NTE5AAAAIFB0SS5/ee8IFB49ZVO3eoXg+JybfoDNatqbPfPbt6CL"
      # FILESYSTEM: /dev/sda1 # override the root partition / device for disk I/O stats
I can now start that one up
builder@builder-T100:~/beszel/agent$ docker compose up -d
[+] Running 2/2
 ✔ beszel-agent 1 layers [⣿]      0B/0B      Pulled                                                                                                            2.1s
   ✔ c392084fc449 Pull complete                                                                                                                                0.9s
[+] Building 0.0s (0/0)
[+] Running 1/1
 ✔ Container beszel-agent  Started
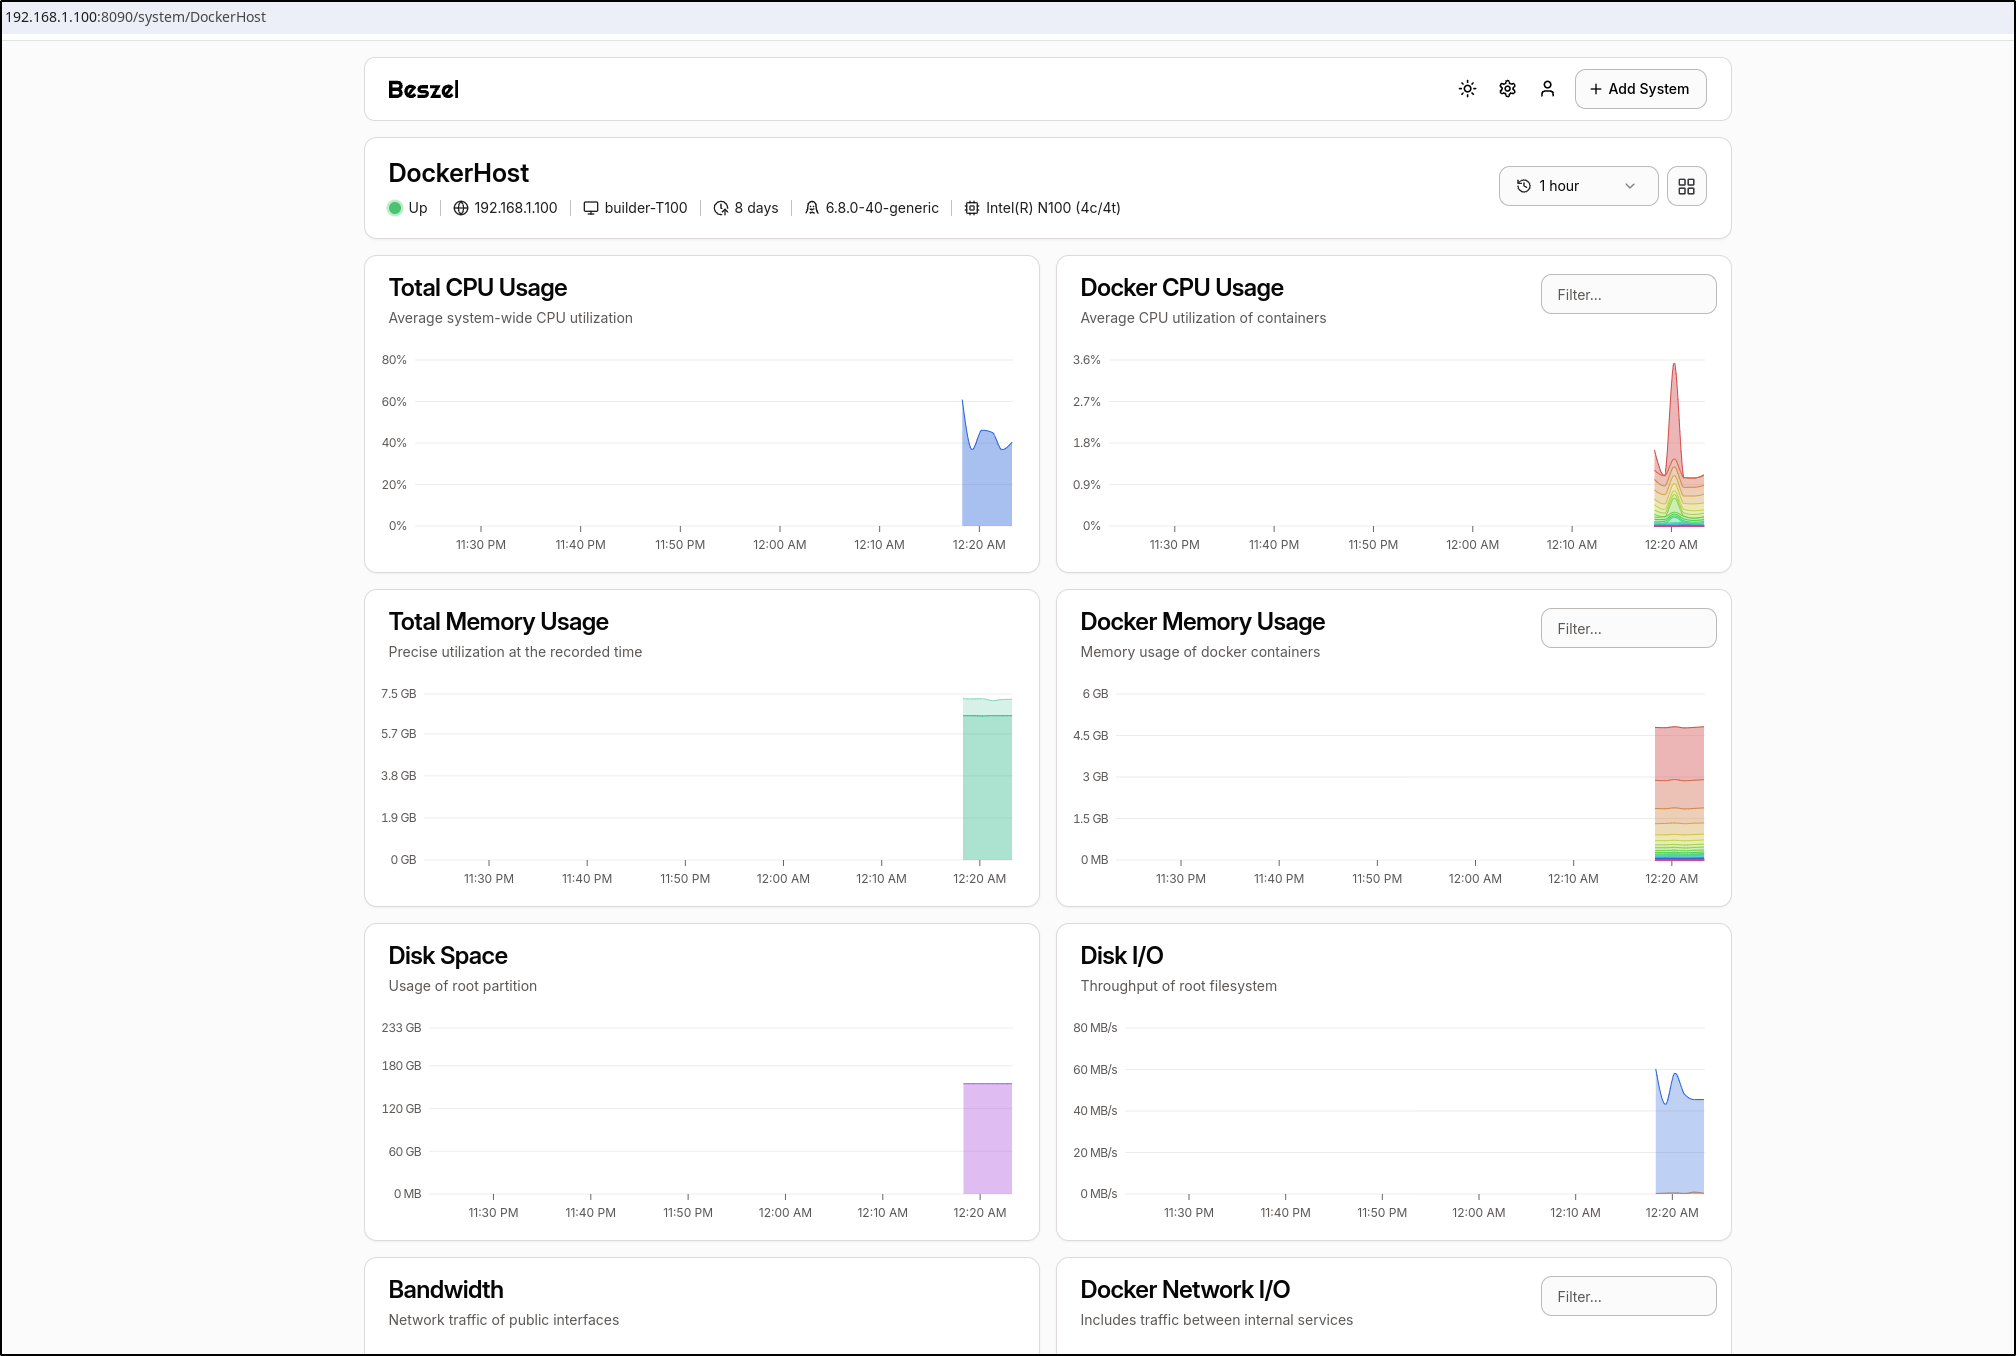
We can now see stats
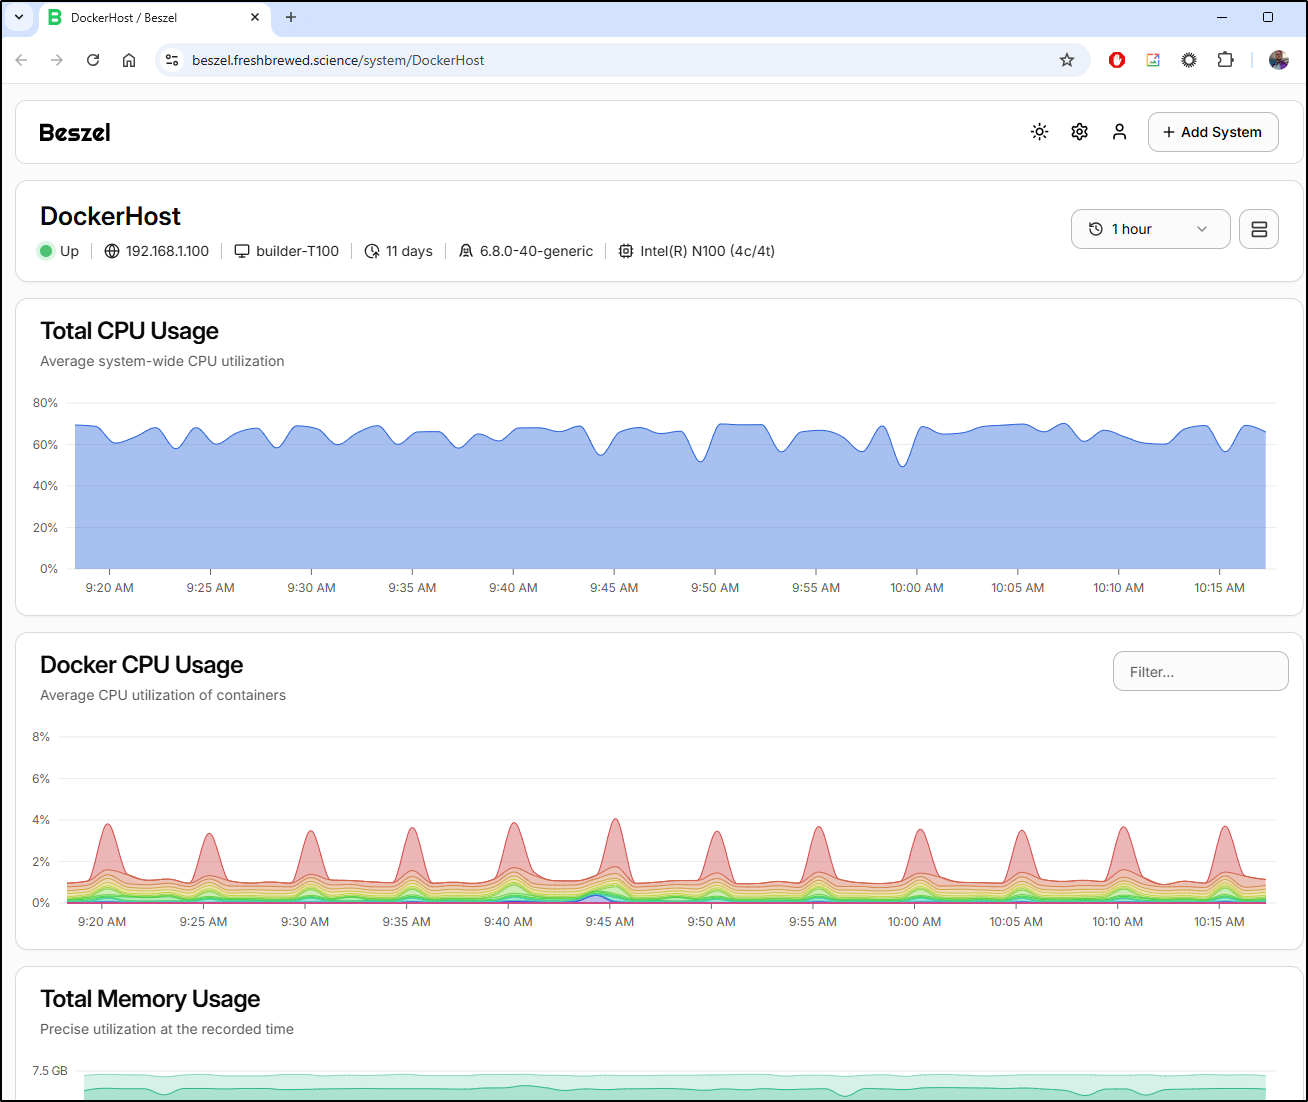
and if we click the details and see much more
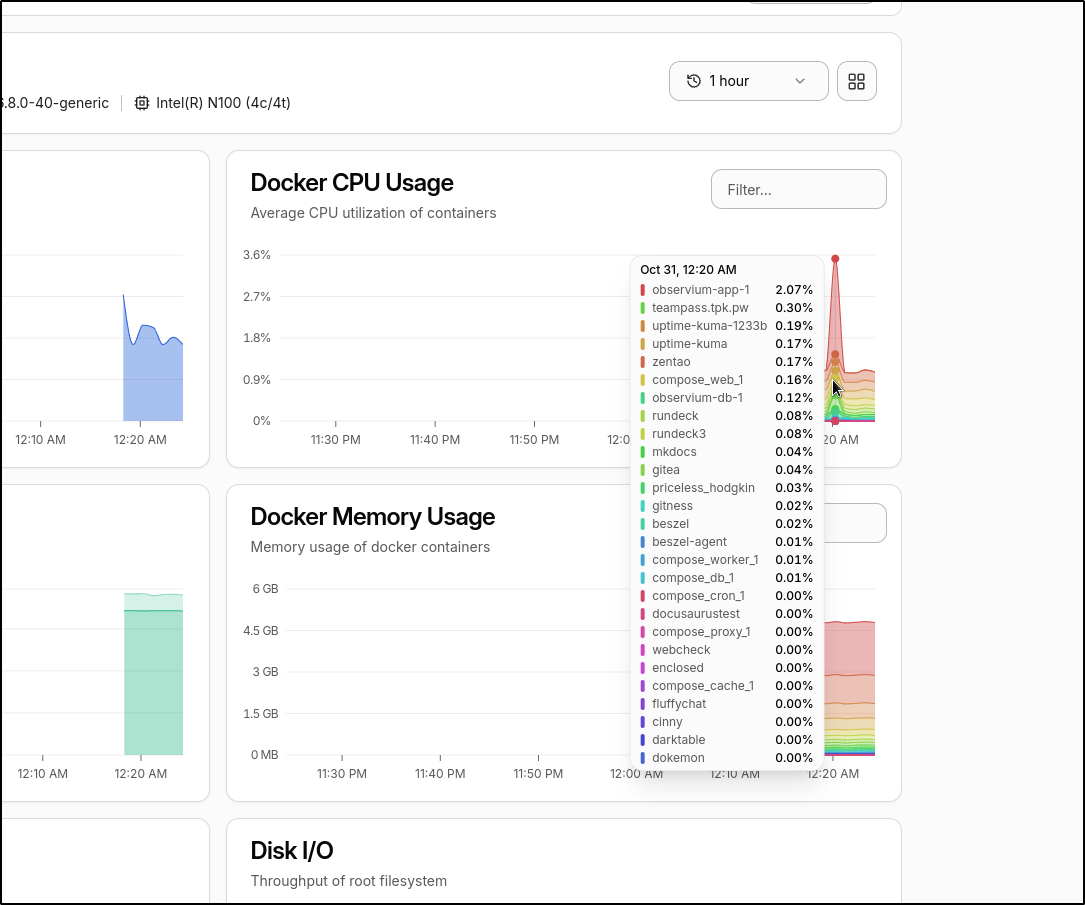
if we mouse over a graph we can see a breakdown by container. I see, for instance, the Observium one spiked momentarily
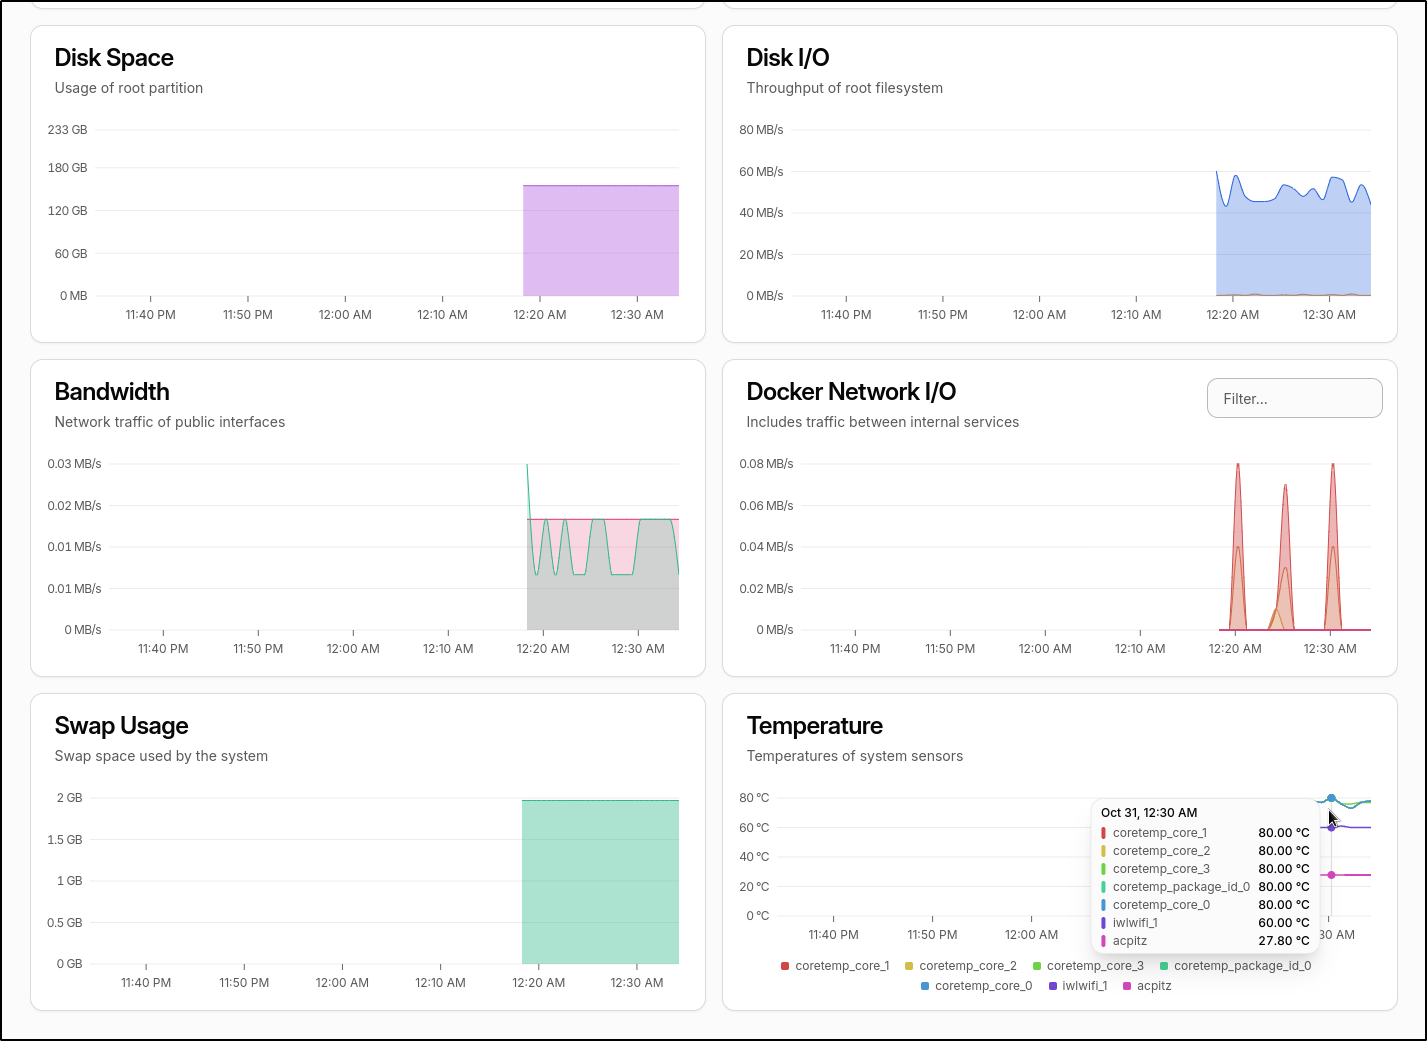
I noticed that the temps are getting a bit high
This is good to know as I do have issues with this box crashing from time to time and i suspected it might be due to temps.
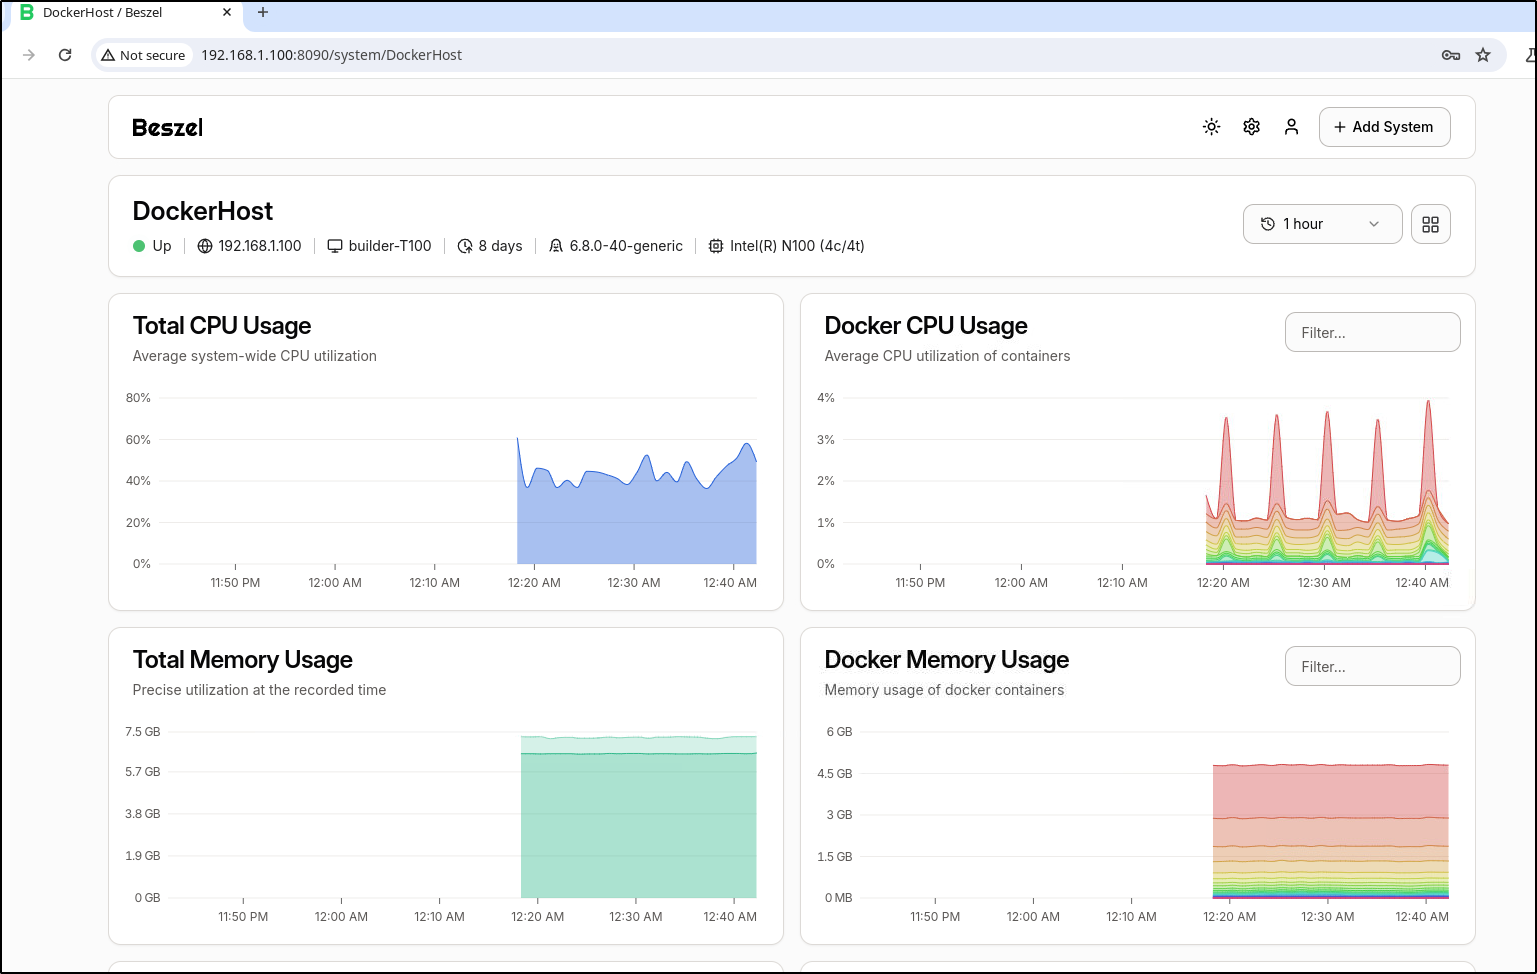
While I could continue to access via my VNC jump box
Ideally, I would expose this with proper TLS.
Exposing with Kubernetes
I’ll use AWS Route53 for this record. I’ll use a JSON to add an A Record
$ cat r53-beszel.json
{
  "Comment": "CREATE beszel fb.s A record ",
  "Changes": [
    {
      "Action": "CREATE",
      "ResourceRecordSet": {
        "Name": "beszel.freshbrewed.science",
        "Type": "A",
        "TTL": 300,
        "ResourceRecords": [
          {
            "Value": "75.73.224.240"
          }
        ]
      }
    }
  ]
}

$ aws route53 change-resource-record-sets --hosted-zone-id Z39E8QFU0F9PZP --change-batch file://r53-beszel.json
{
    "ChangeInfo": {
        "Id": "/change/C03344651OH1C7SDQURXO",
        "Status": "PENDING",
        "SubmittedAt": "2024-10-31T00:45:19.961000+00:00",
        "Comment": "CREATE beszel fb.s A record "
    }
}
I’ll now create an Endpoint, Service and Ingress that can use it
$ cat ingress.beszel.yaml
---
apiVersion: v1
kind: Endpoints
metadata:
  name: beszel-external-ip
subsets:
- addresses:
  - ip: 192.168.1.100
  ports:
  - name: beszelint
    port: 8090
    protocol: TCP
---
apiVersion: v1
kind: Service
metadata:
  name: beszel-external-ip
spec:
  clusterIP: None
  clusterIPs:
  - None
  internalTrafficPolicy: Cluster
  ipFamilies:
  - IPv4
  - IPv6
  ipFamilyPolicy: RequireDualStack
  ports:
  - name: beszel
    port: 80
    protocol: TCP
    targetPort: 8090
  sessionAffinity: None
  type: ClusterIP
---
apiVersion: networking.k8s.io/v1
kind: Ingress
metadata:
  annotations:
    cert-manager.io/cluster-issuer: letsencrypt-prod
    ingress.kubernetes.io/ssl-redirect: "true"
    kubernetes.io/ingress.class: nginx
    kubernetes.io/tls-acme: "true"
    meta.helm.sh/release-name: beszel
    meta.helm.sh/release-namespace: beszel
    nginx.ingress.kubernetes.io/ssl-redirect: "true"
  name: beszel
spec:
  rules:
  - host: beszel.freshbrewed.science
    http:
      paths:
      - backend:
          service:
            name: beszel-external-ip
            port:
              number: 80
        path: /
        pathType: ImplementationSpecific
  tls:
  - hosts:
    - beszel.freshbrewed.science
    secretName: beszel-tls

$ kubectl apply -f ./ingress.beszel.yaml
endpoints/beszel-external-ip created
service/beszel-external-ip created
ingress.networking.k8s.io/beszel created
Once we see a cert created
$ kubectl get cert beszel-tls
NAME         READY   SECRET       AGE
beszel-tls   True    beszel-tls   2m20s
I can login externally
At this point, I thought I would wrap by doing a live demo of stats
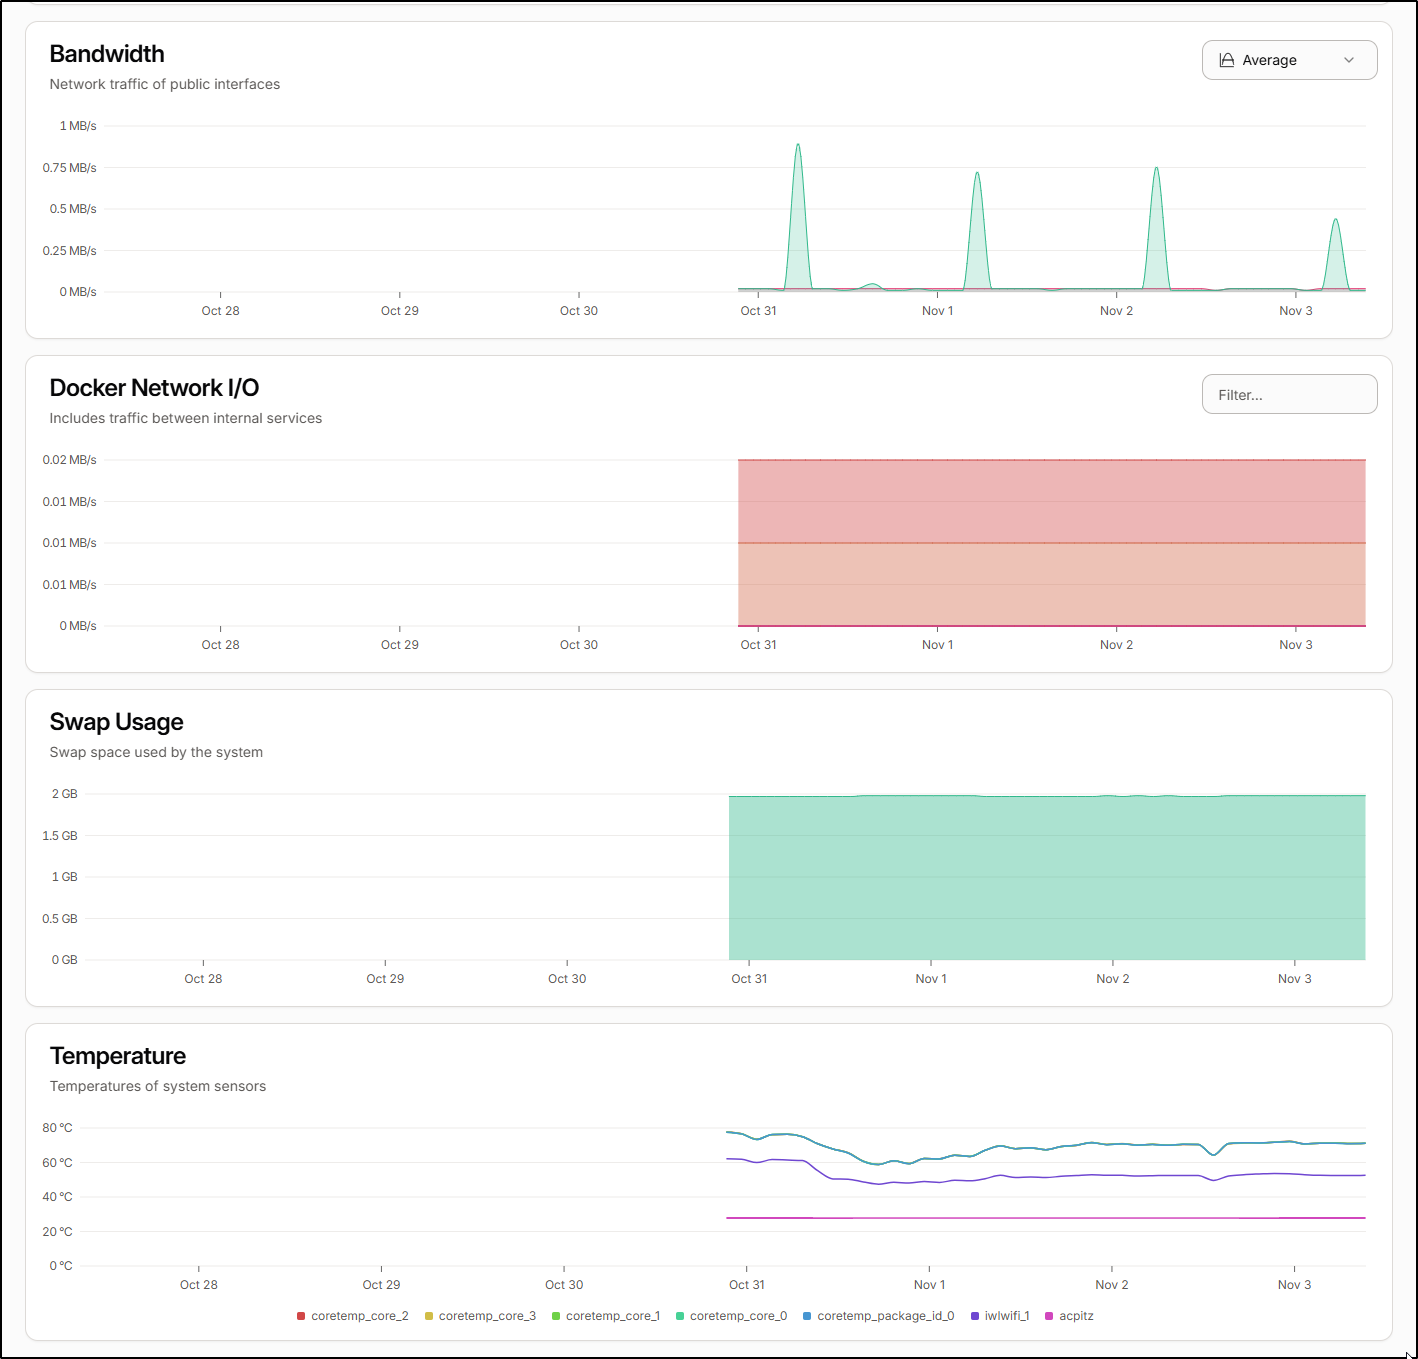
From putting in a fan, I watched the stats show a cooling effect - here that window is speeded up so you can see the effects of improved cooling
Though I do see it has steadily crept back up in the following days
I also noticed the cyclic spikes in network traffic which is likely a scheduled backup
That said, I realized there is way more to this tool I want to explore like alerts and backups.
Email Notifications
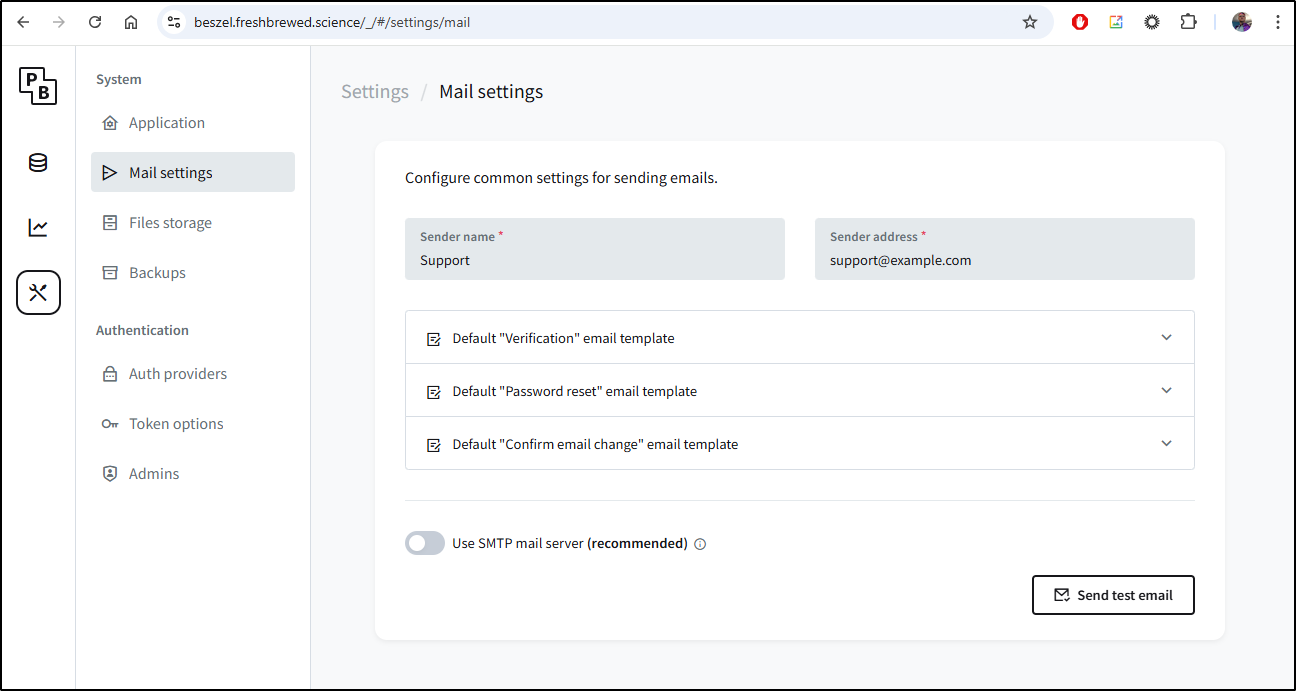
We go to settings and then in Settings/Mail settings we can start to setup the SMTP server
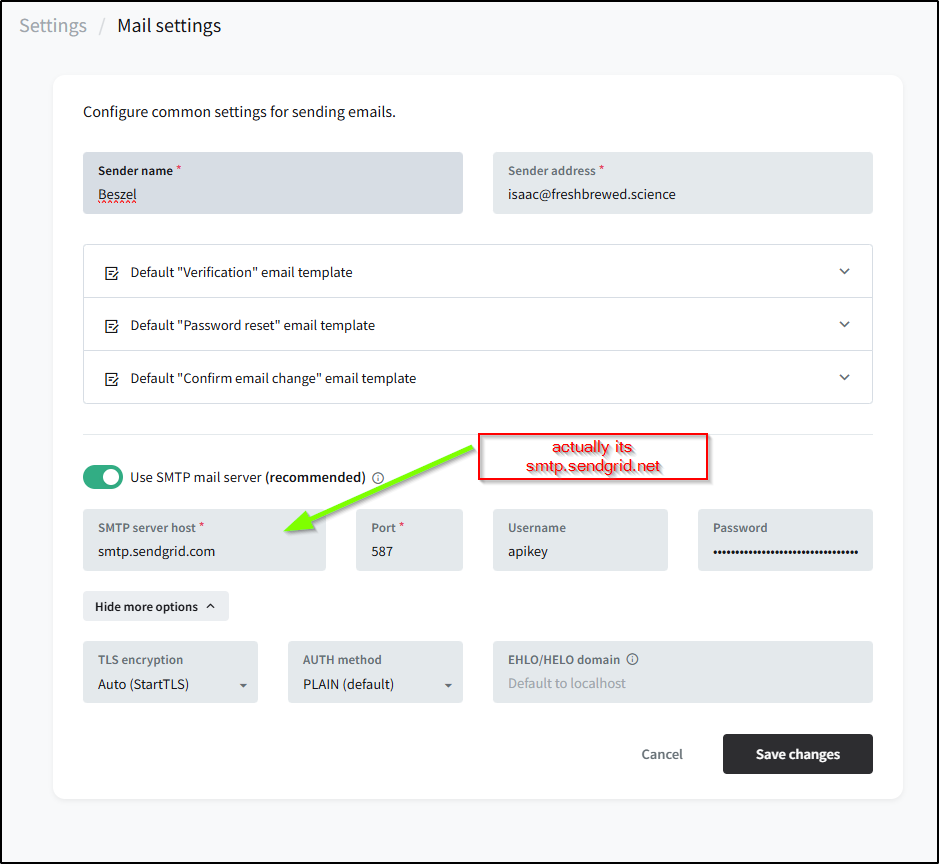
Where I can add Sendgrid
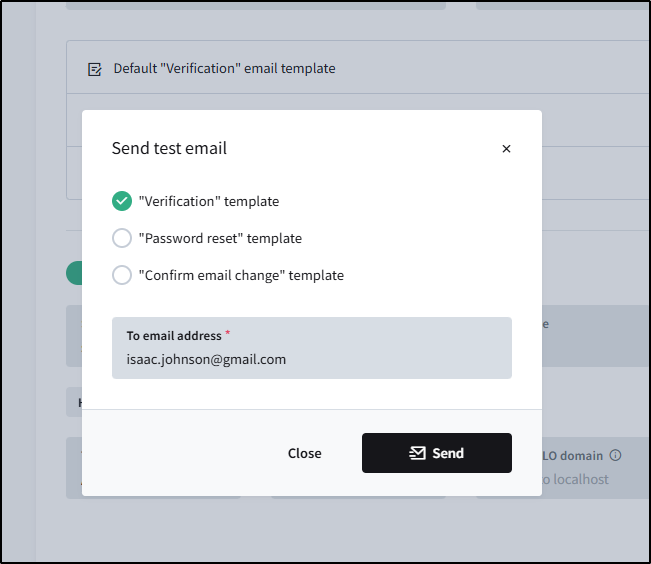
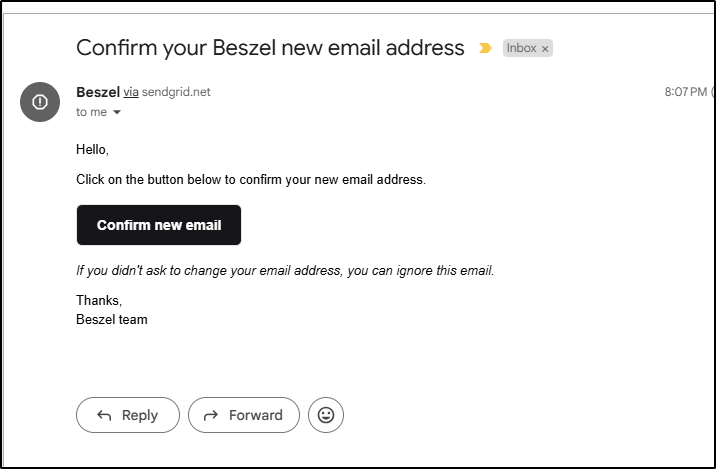
then send a test email
which worked
Logs
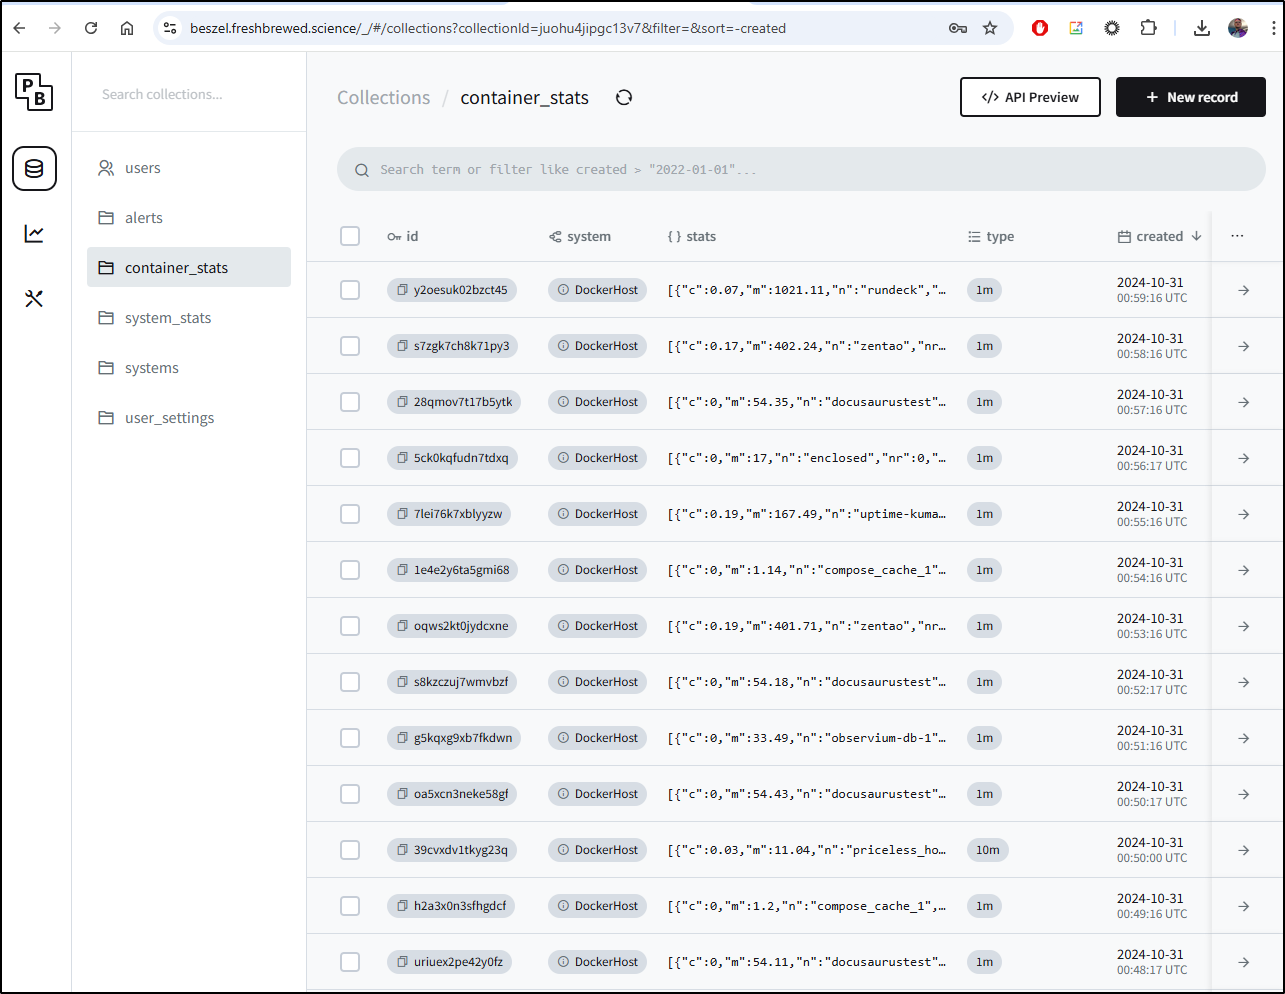
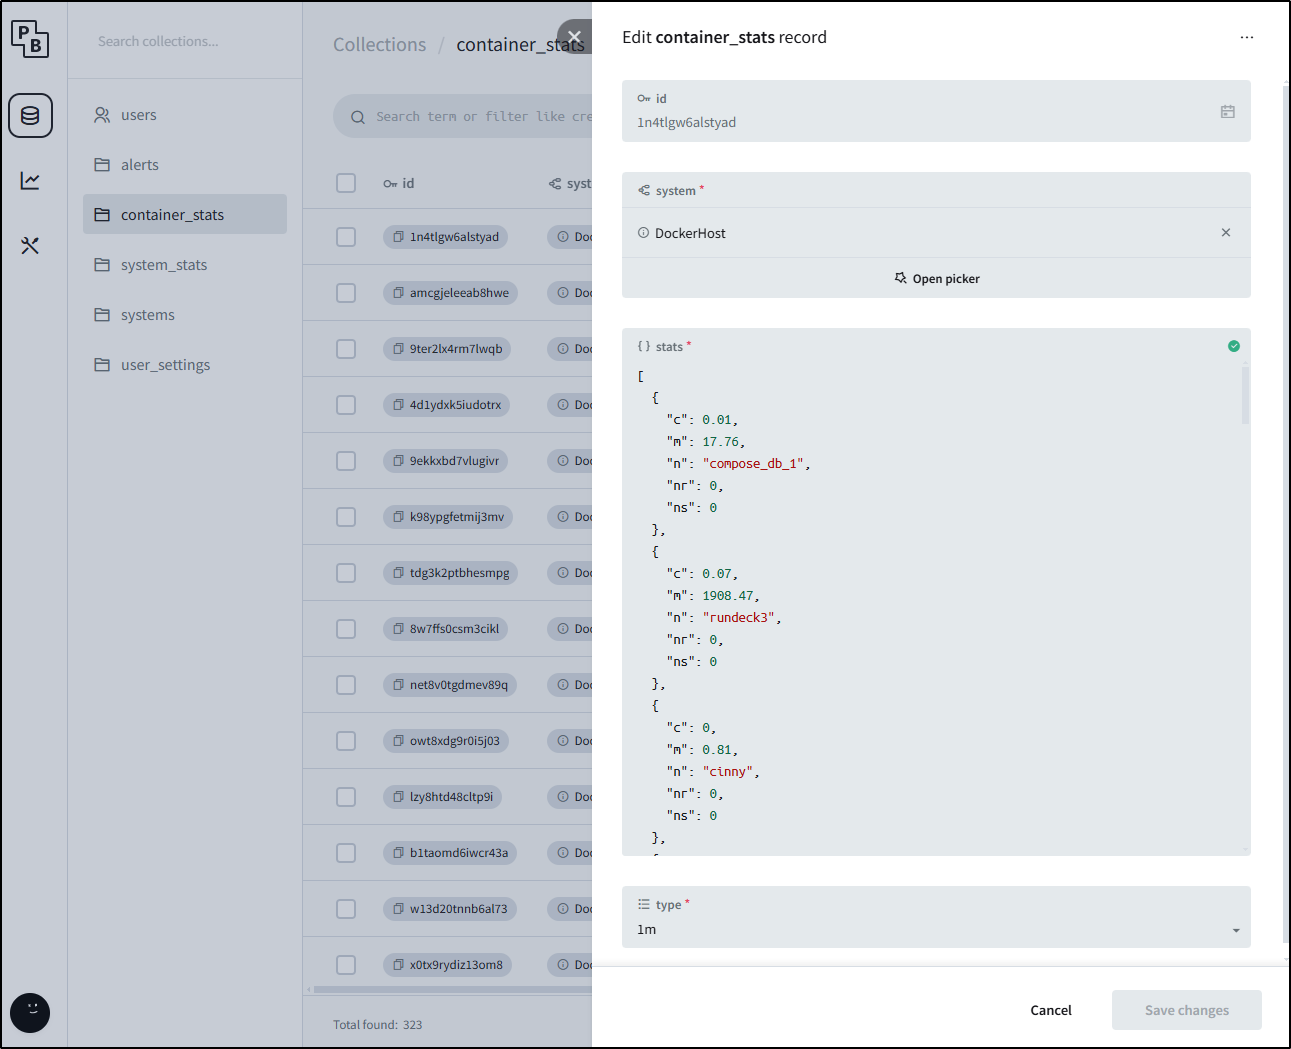
At any point we can dig into the stats being pulled in by Beszel by looking at “Collections”:
While it is nice they expose it, I’m not sure for what I might use these raw JSON logs
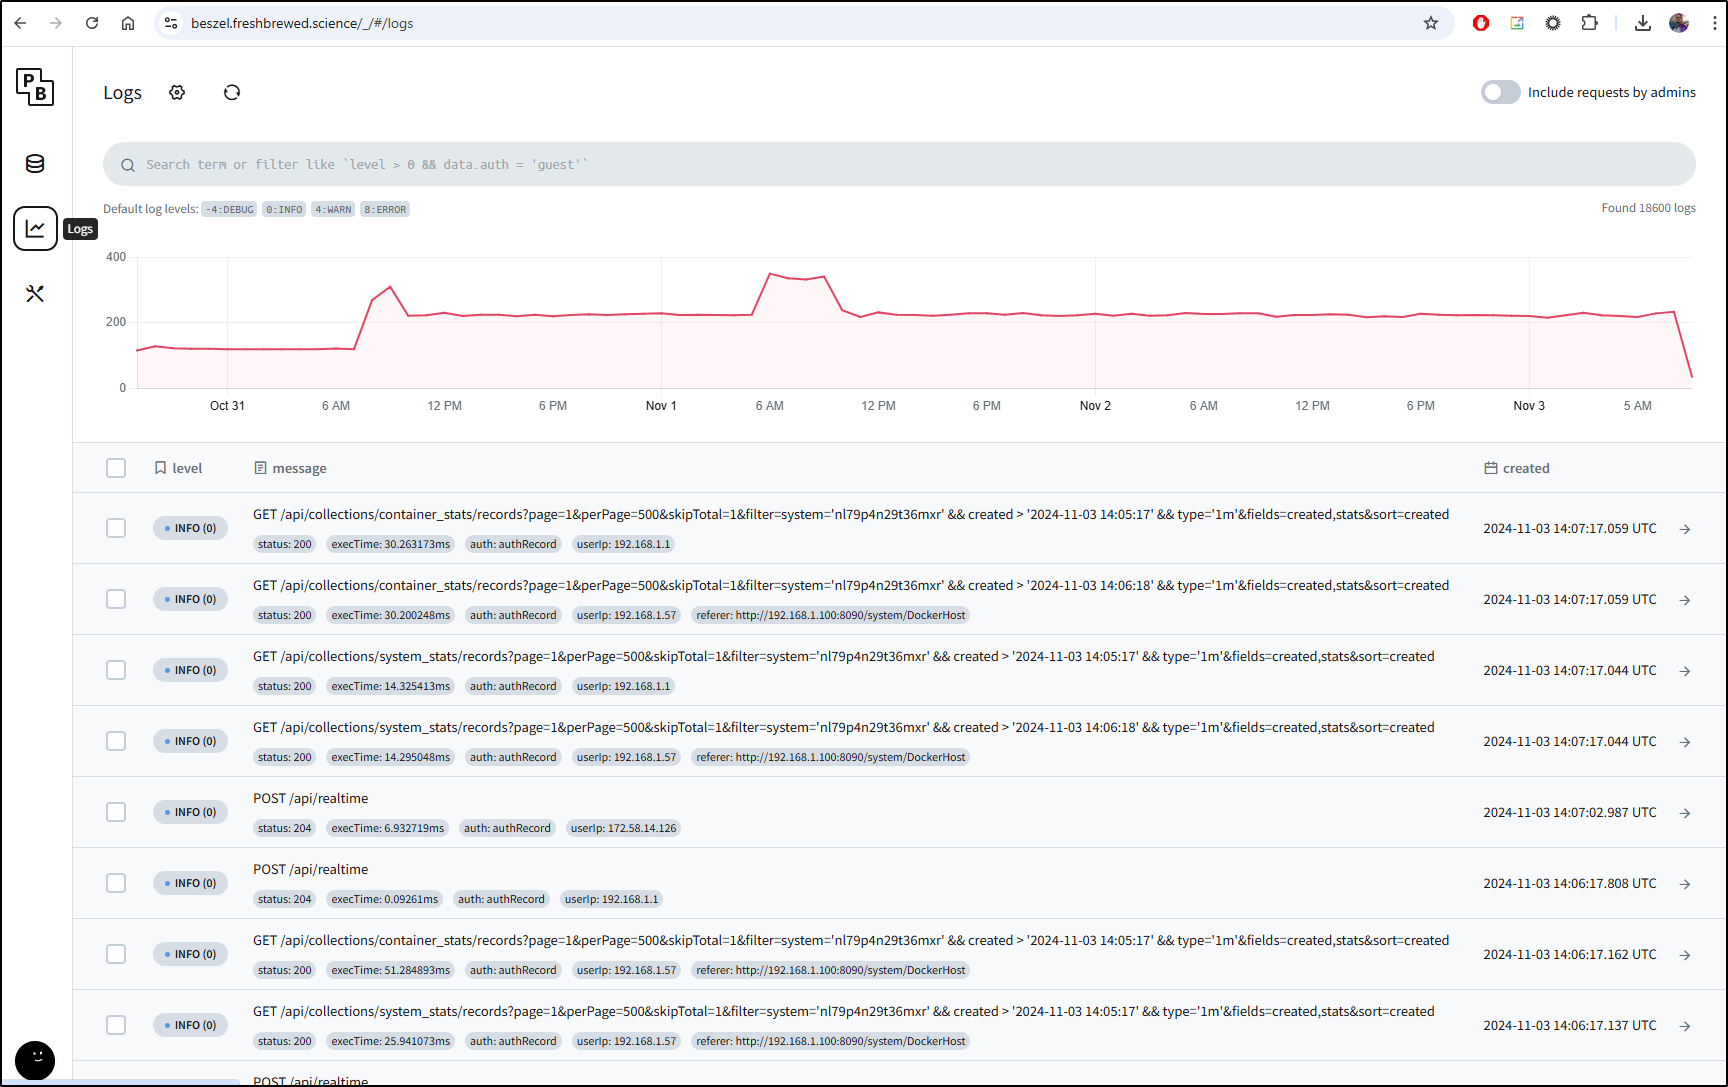
While the above are properly considered collected metrics, we can see actual logs in the Logs section
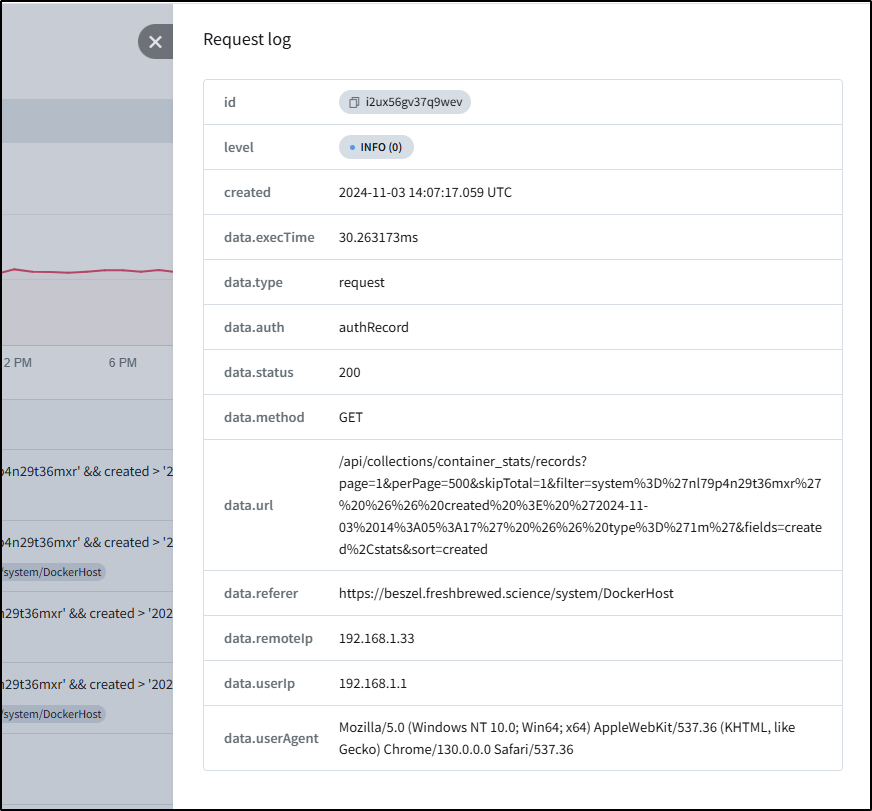
However, one thing I’m noticing is that by exposing it via Kubernetes, the remoteIp is actually my Kubernetes master node so really I can just see the source caller in my network
Storage
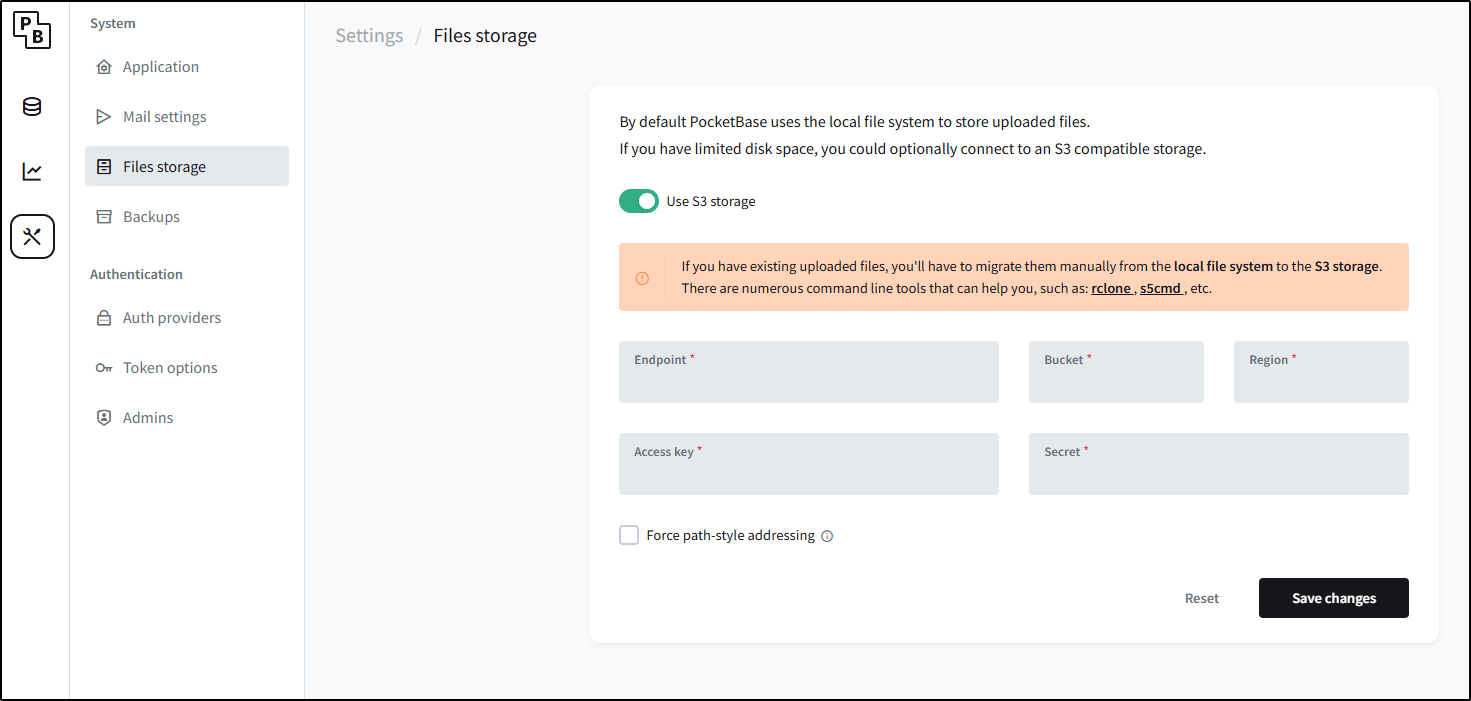
We could change this up to use an S3 compatible endpoint for storage instead of local file system
Of course, this includes AWS S3, but via Minio, that could be another other provider as well including Google, Azure or Akamai.
With Akamai (Linode) we don’t even need that Minio abstraction as their object storage is just S3 compliant natively
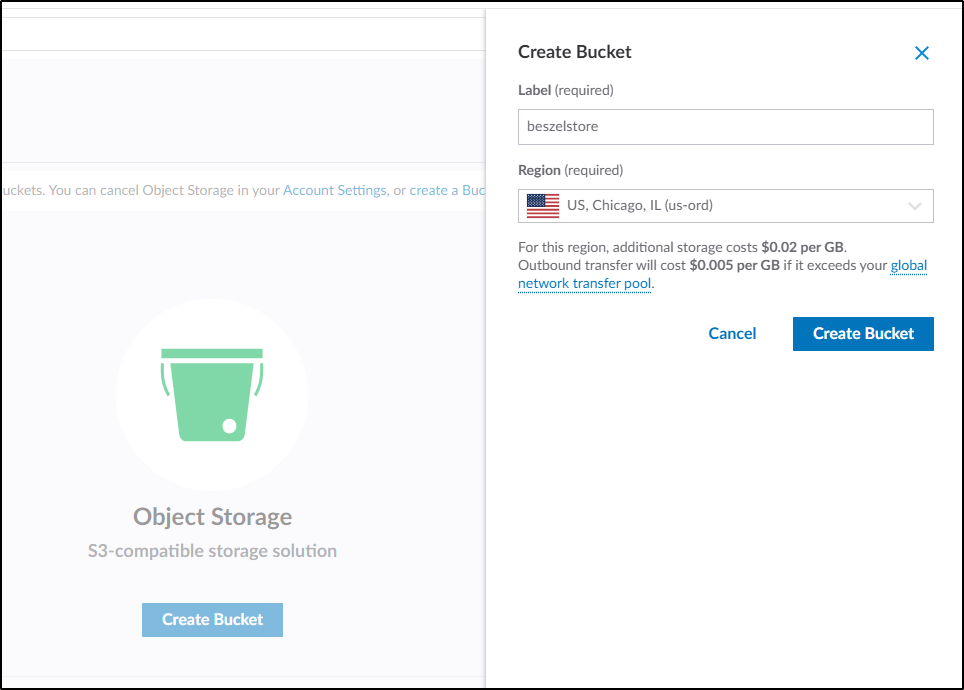
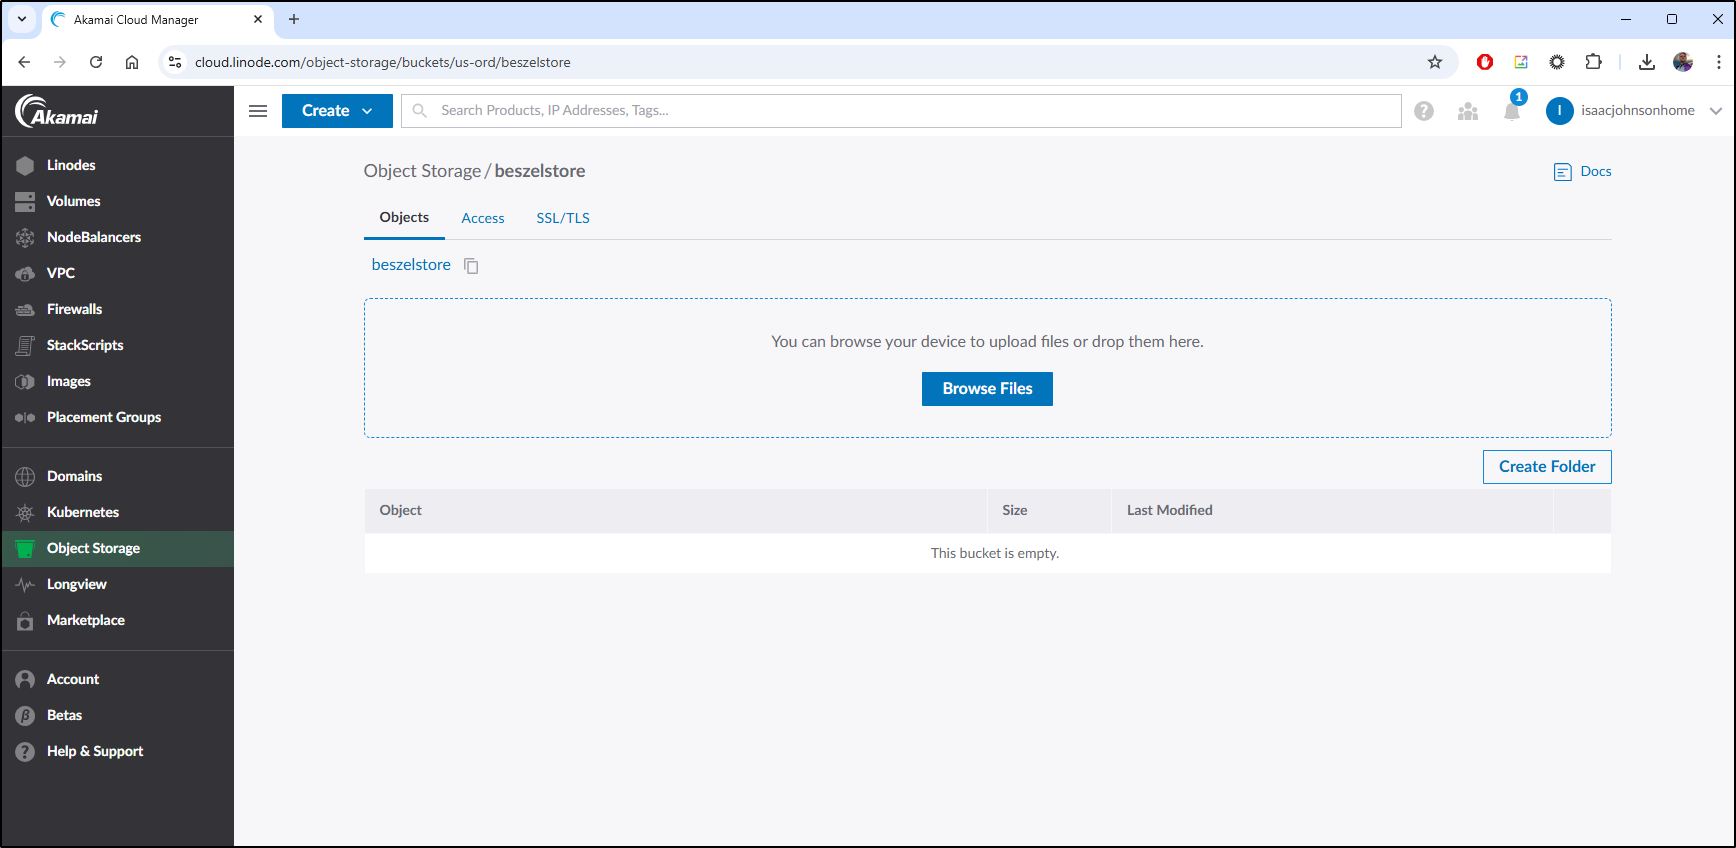
For instance, I can create a Linode Bucket
To use this with Beszel, I need the S3 compatible endpoint which we can parse from the bucket list (us-ord-1.linodeobjects.com)
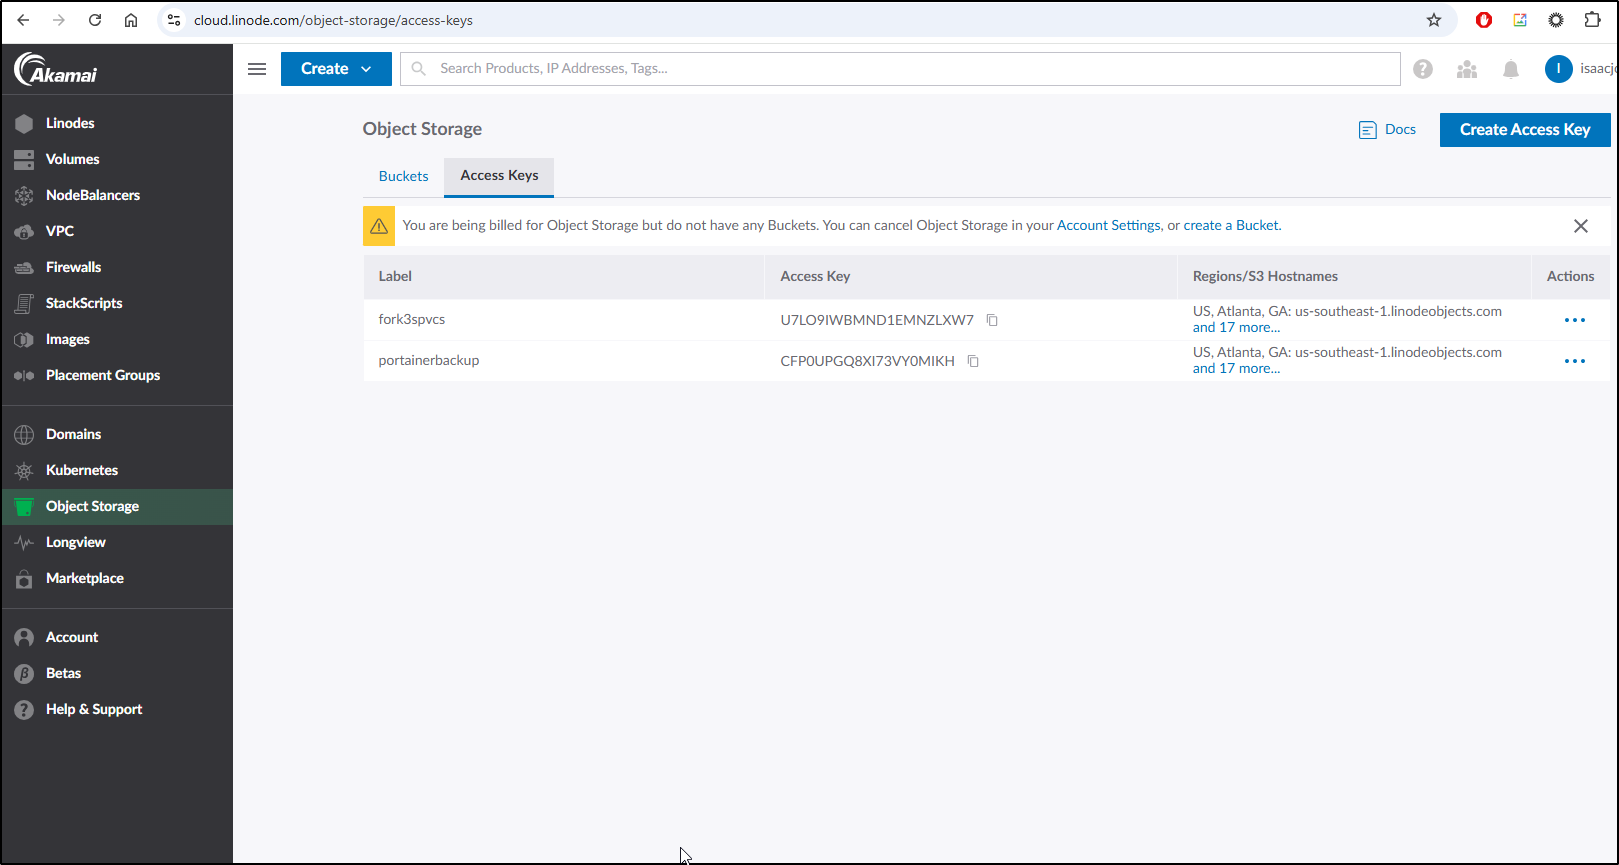
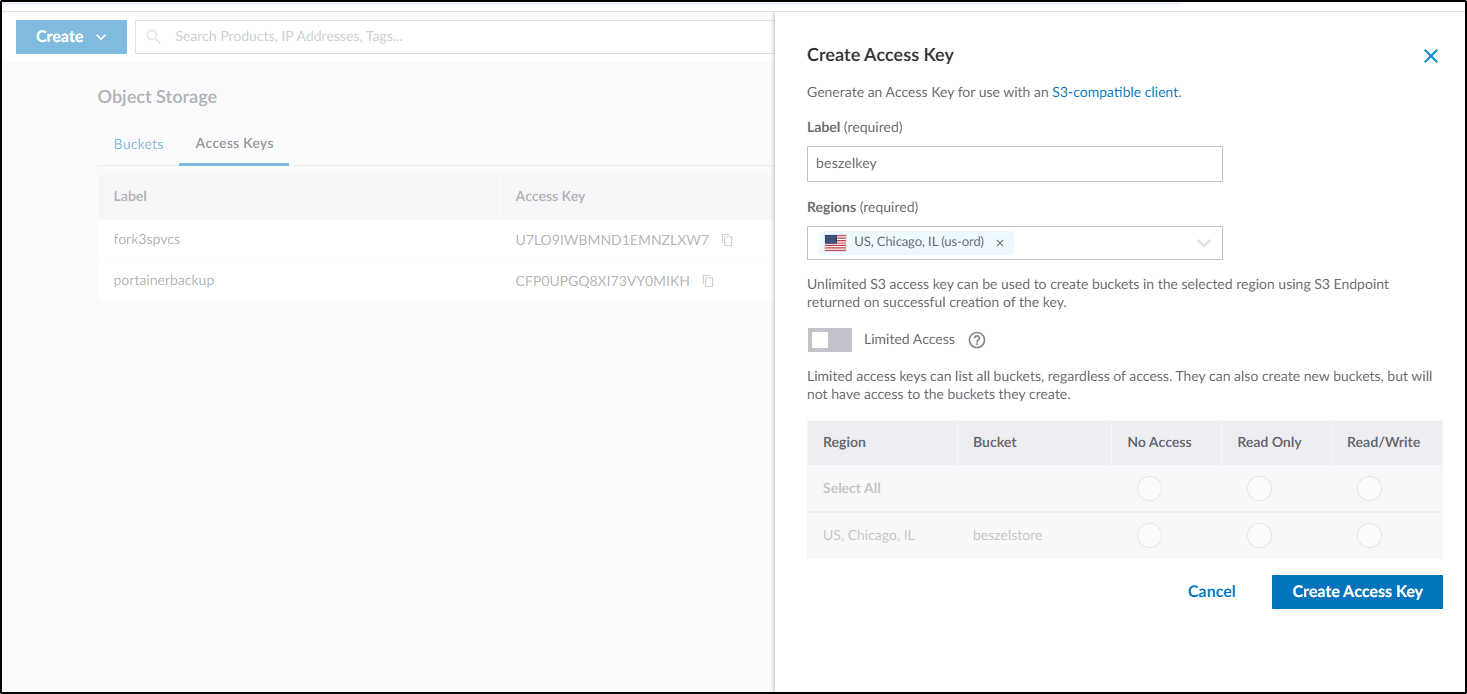
Next, I create an Access key
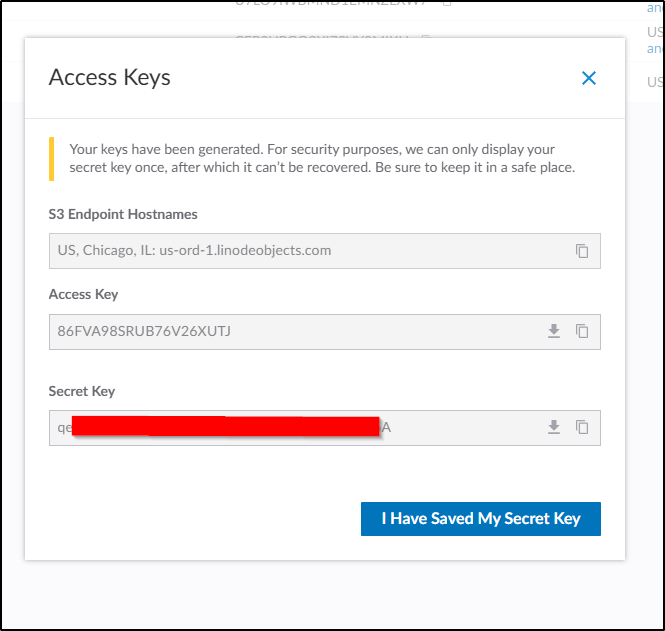
Which will show me it once
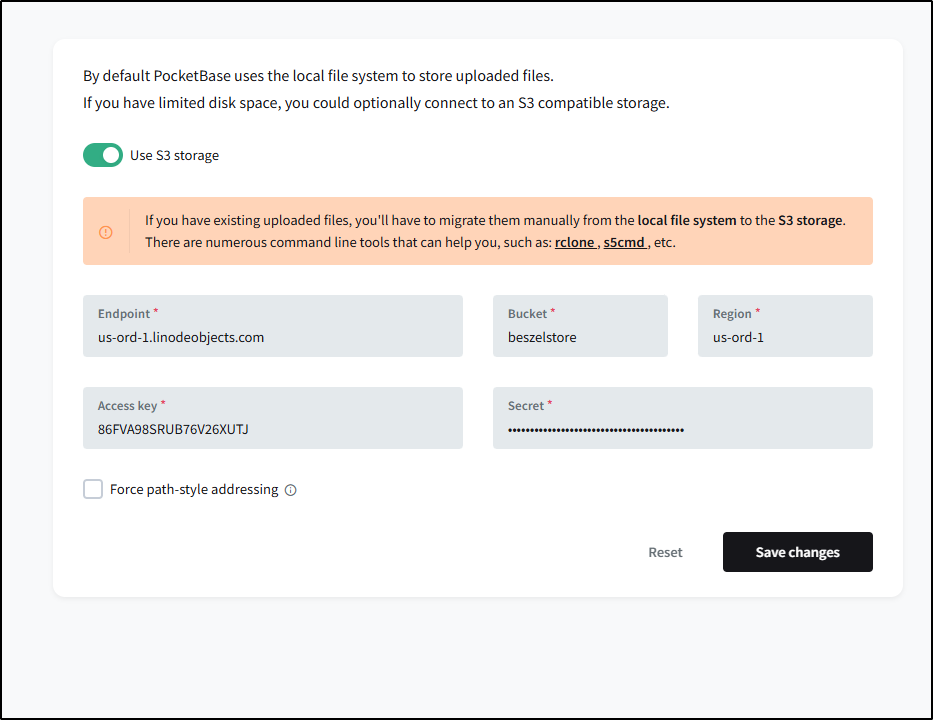
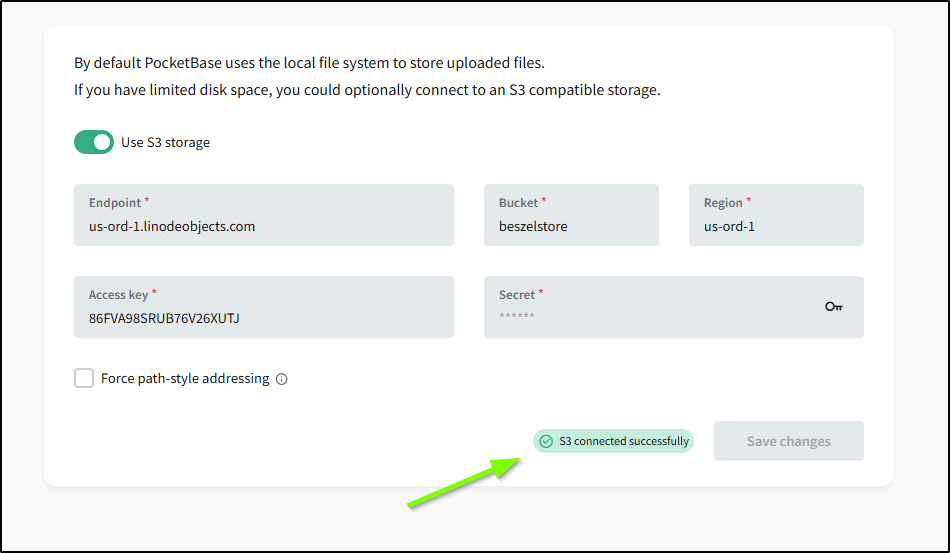
I can now save those settings in the storage menu
which was indicated as successful
So far, I am not seeing files, but I’ll check back later
Federated Auth
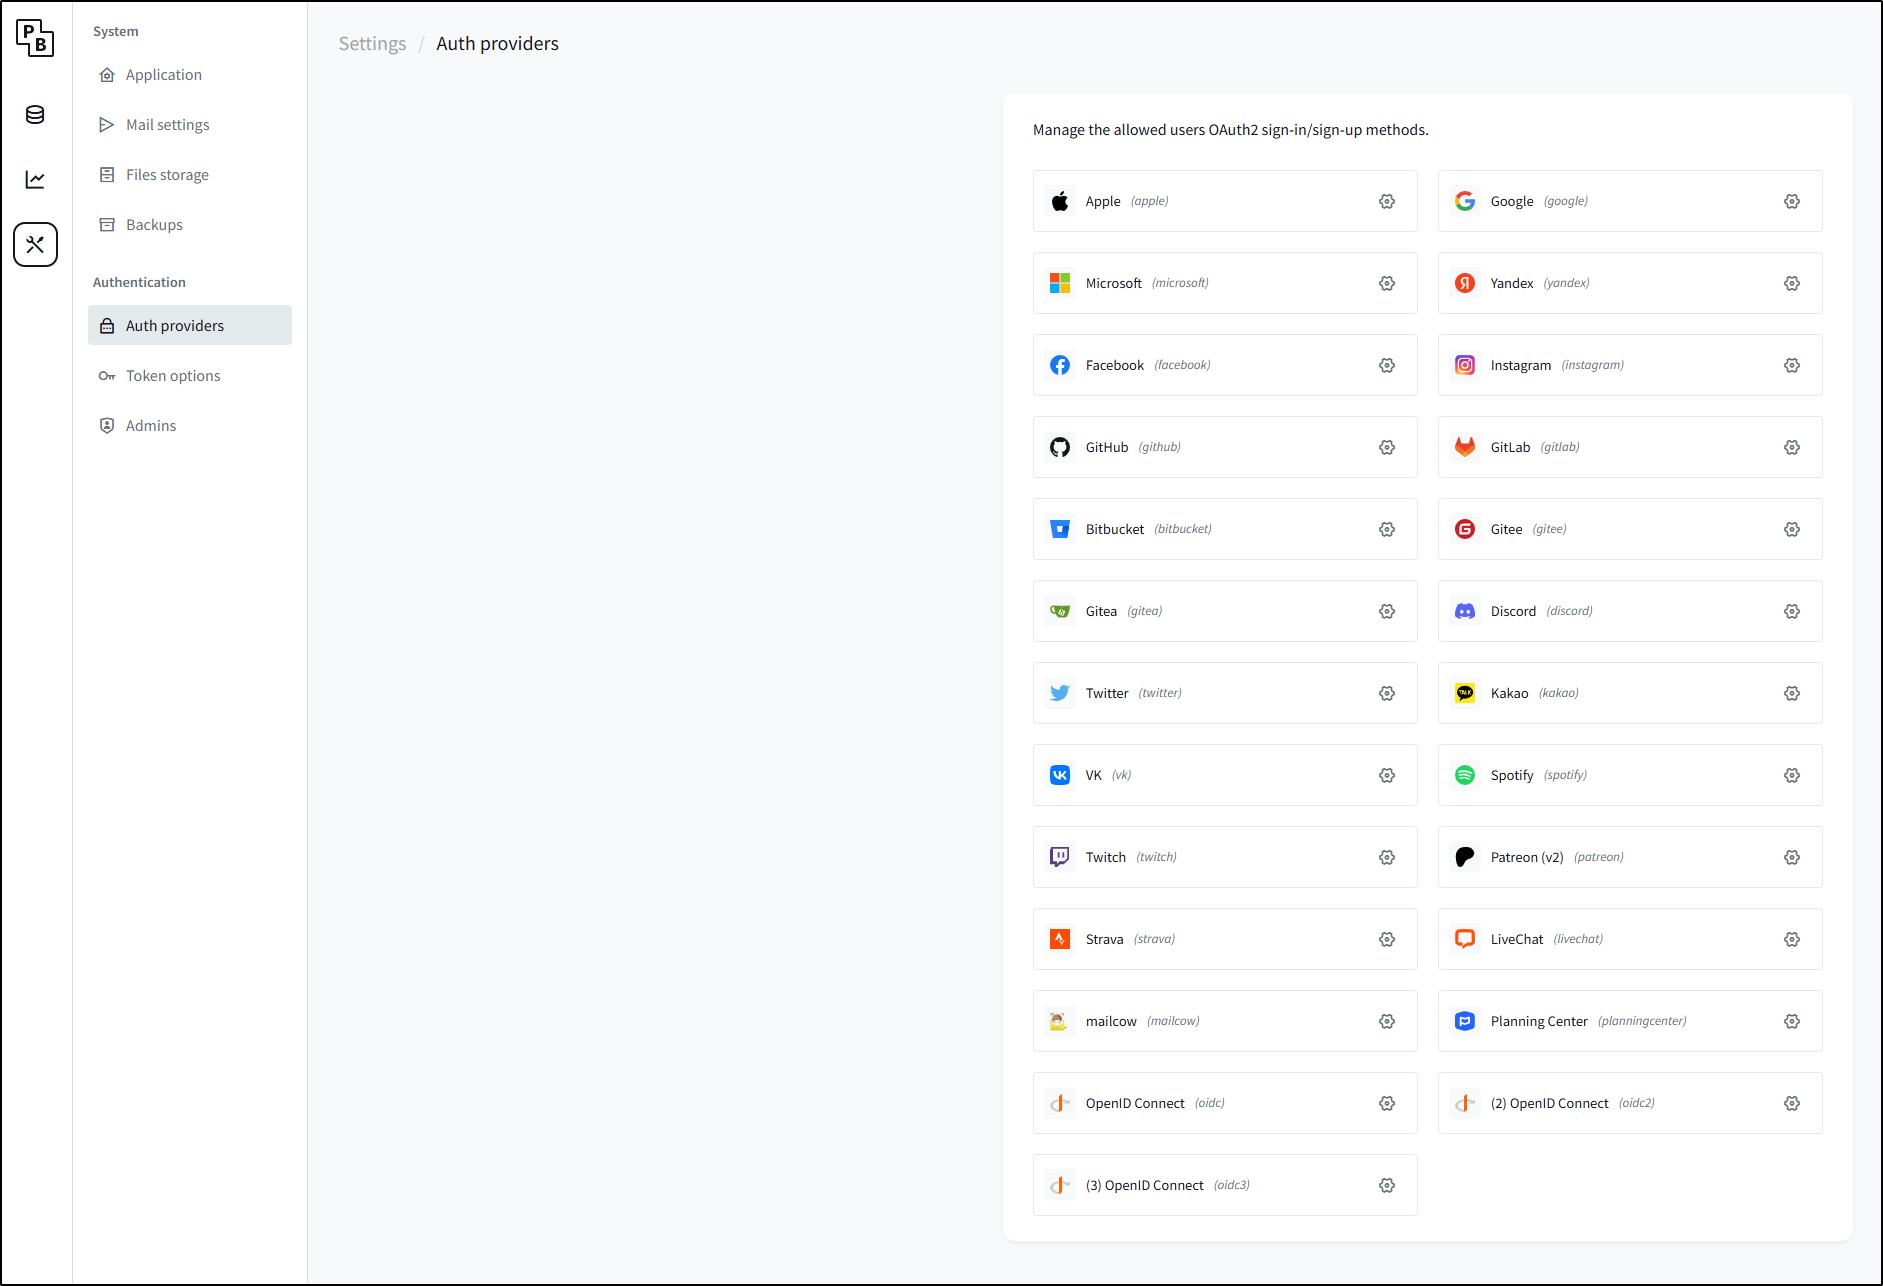
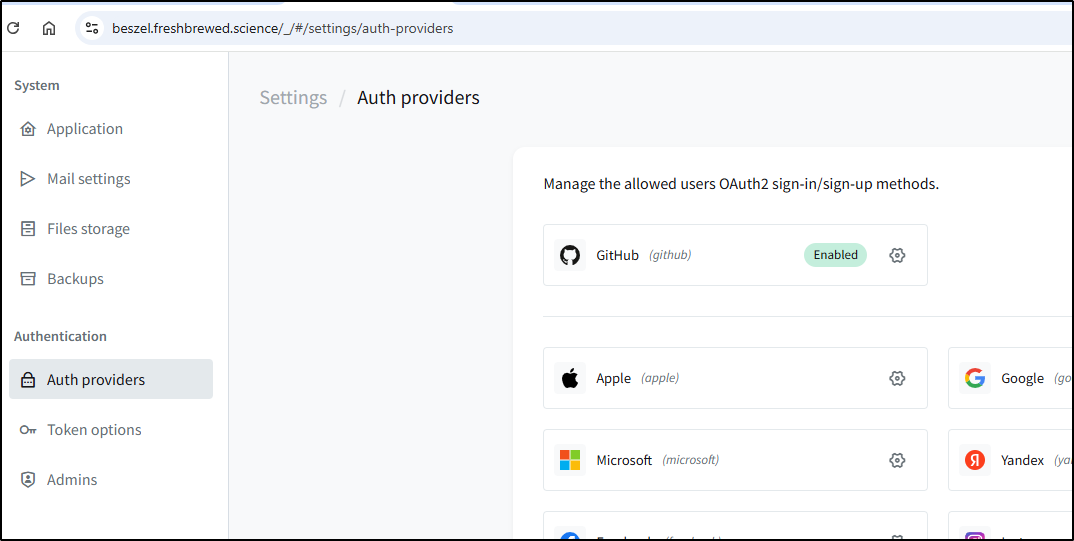
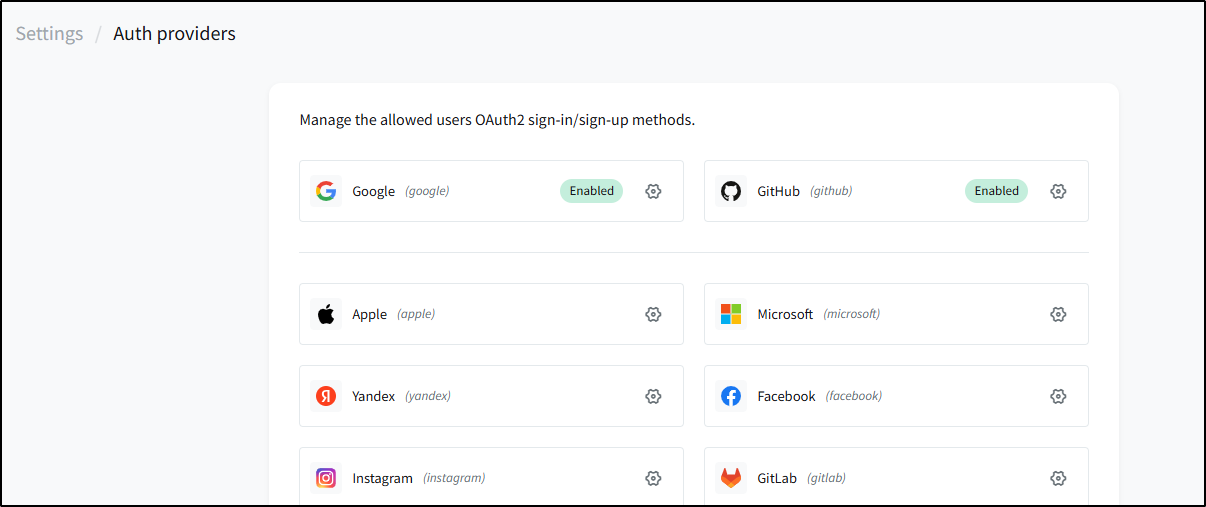
I can see we can tie to a myriad of OAuth providers
The fact that I can see OIDC 1, 2 and 3 tells me that we can cover anything at this point.
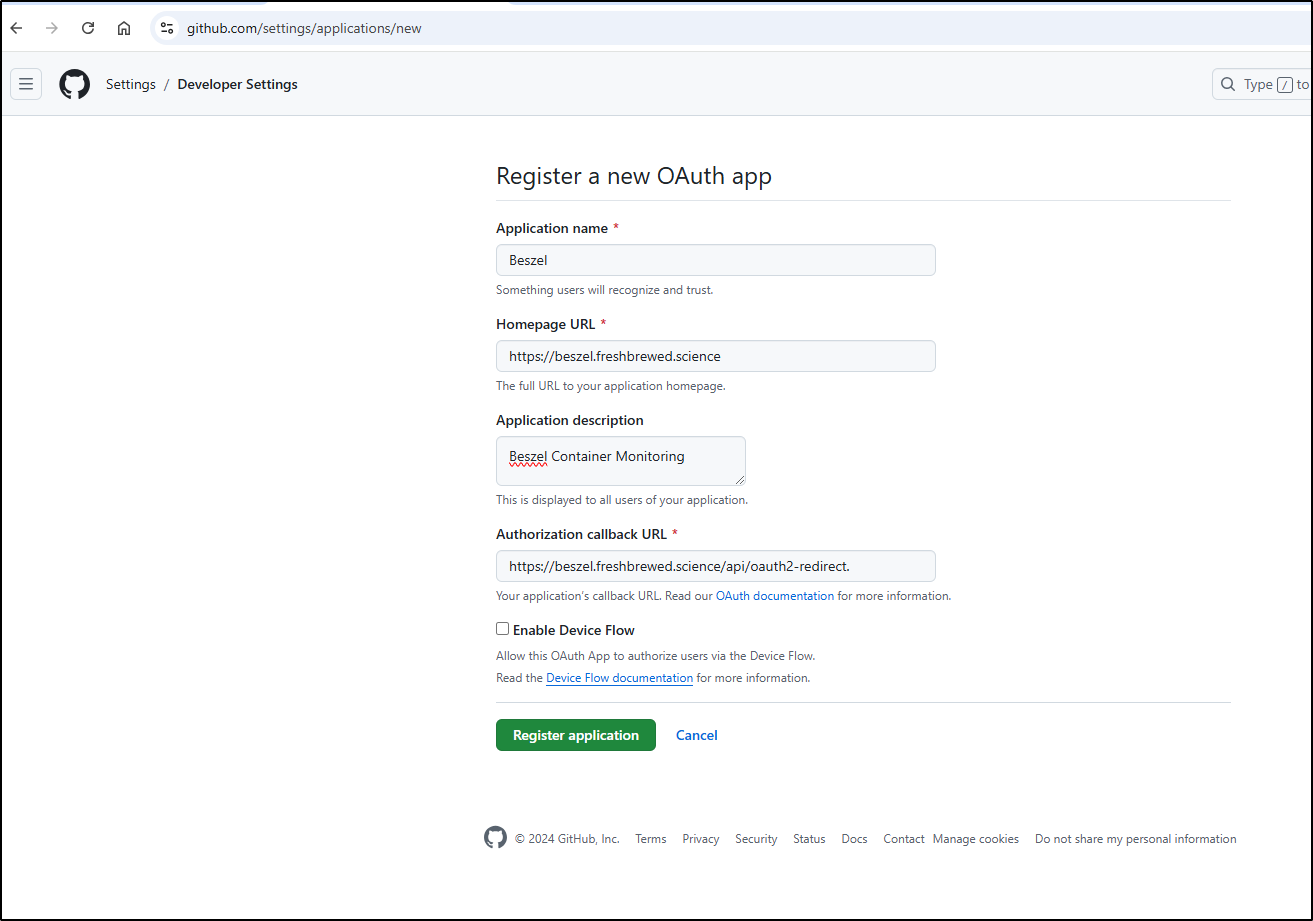
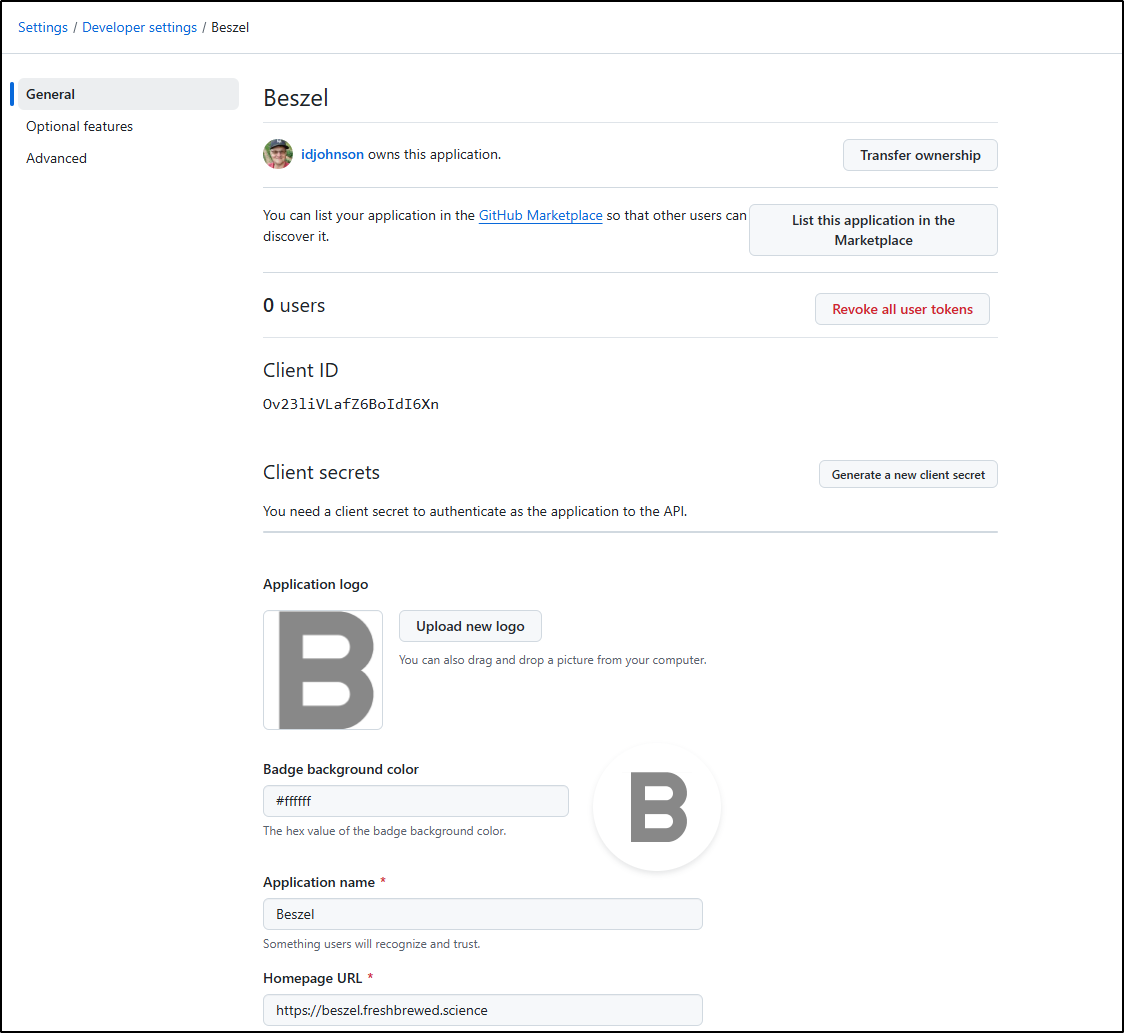
Let’s configure Github federated auth to test using https://github.com/settings/applications/new.
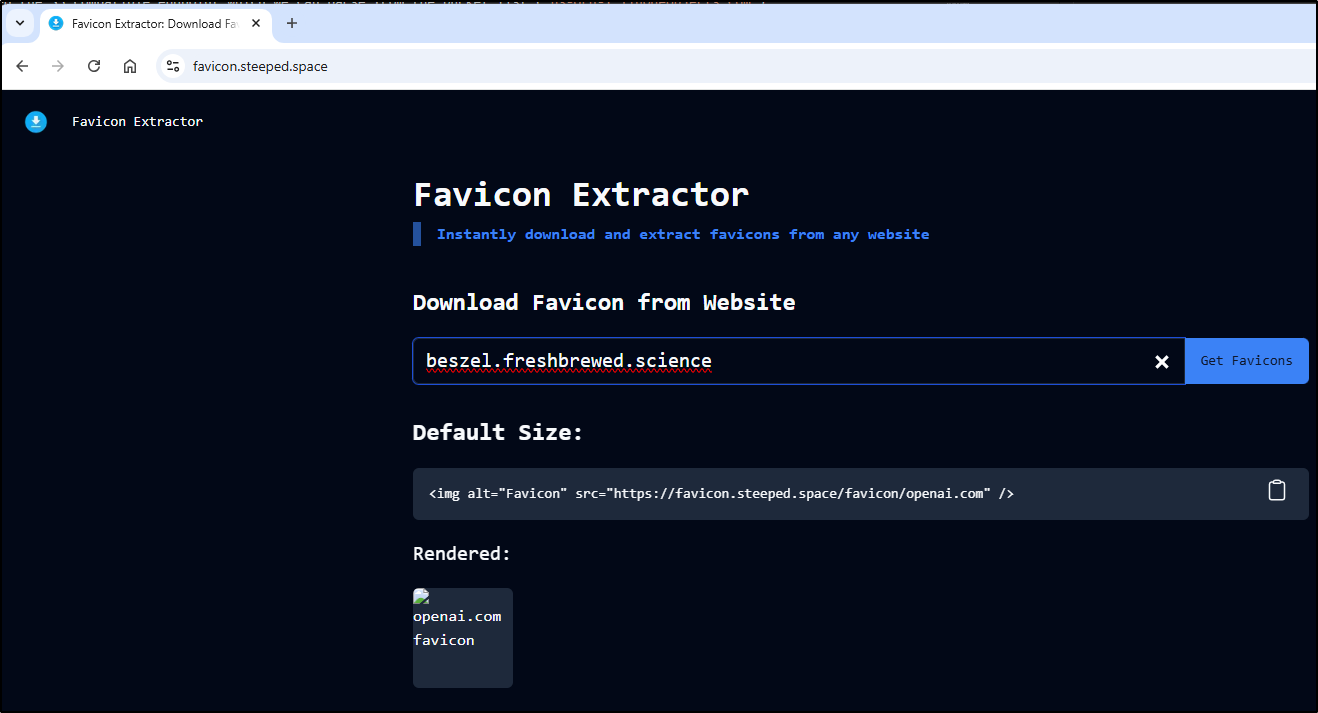
I’ll need an icon on the next page. Luckily, I have just such a tool in my cluster for that purpose
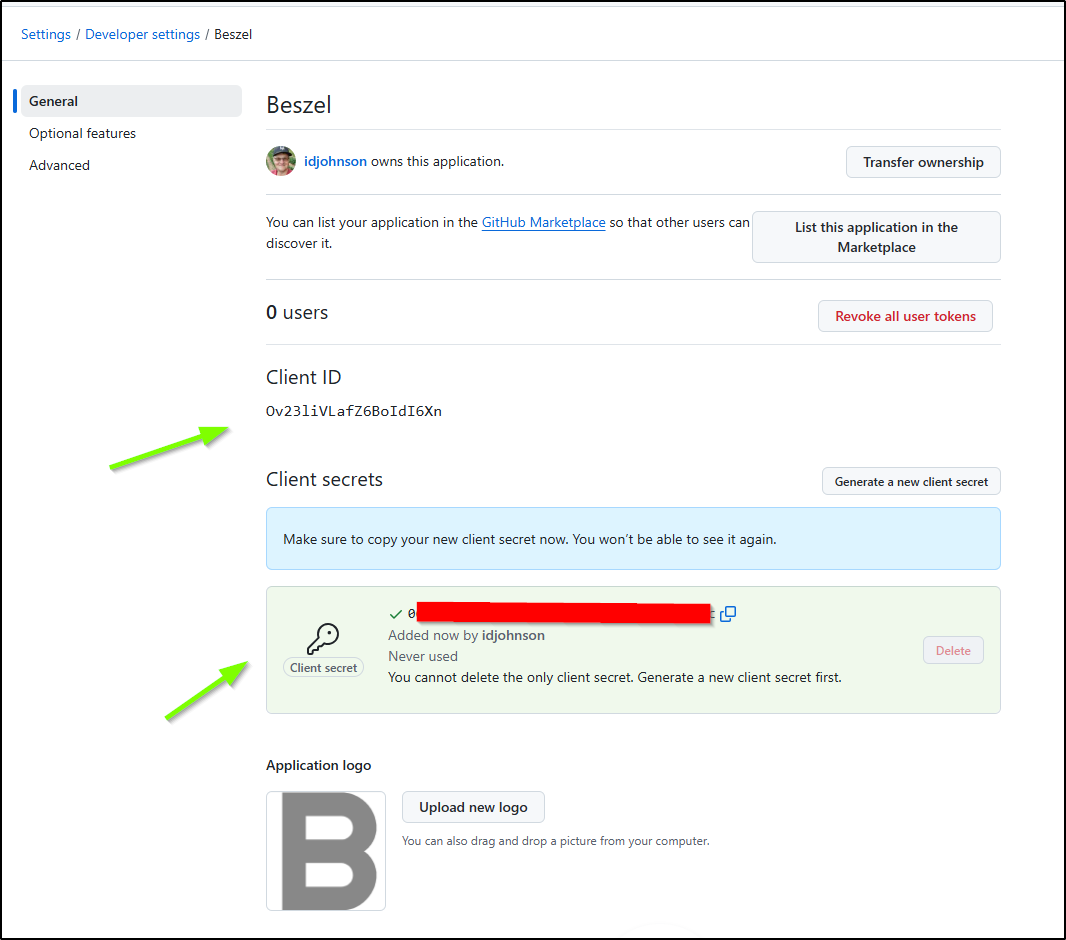
I now have an icon I can upload as well as the Client ID. I’ll need to click “Generate a new client secret” to get the secret
I now have the two values I need
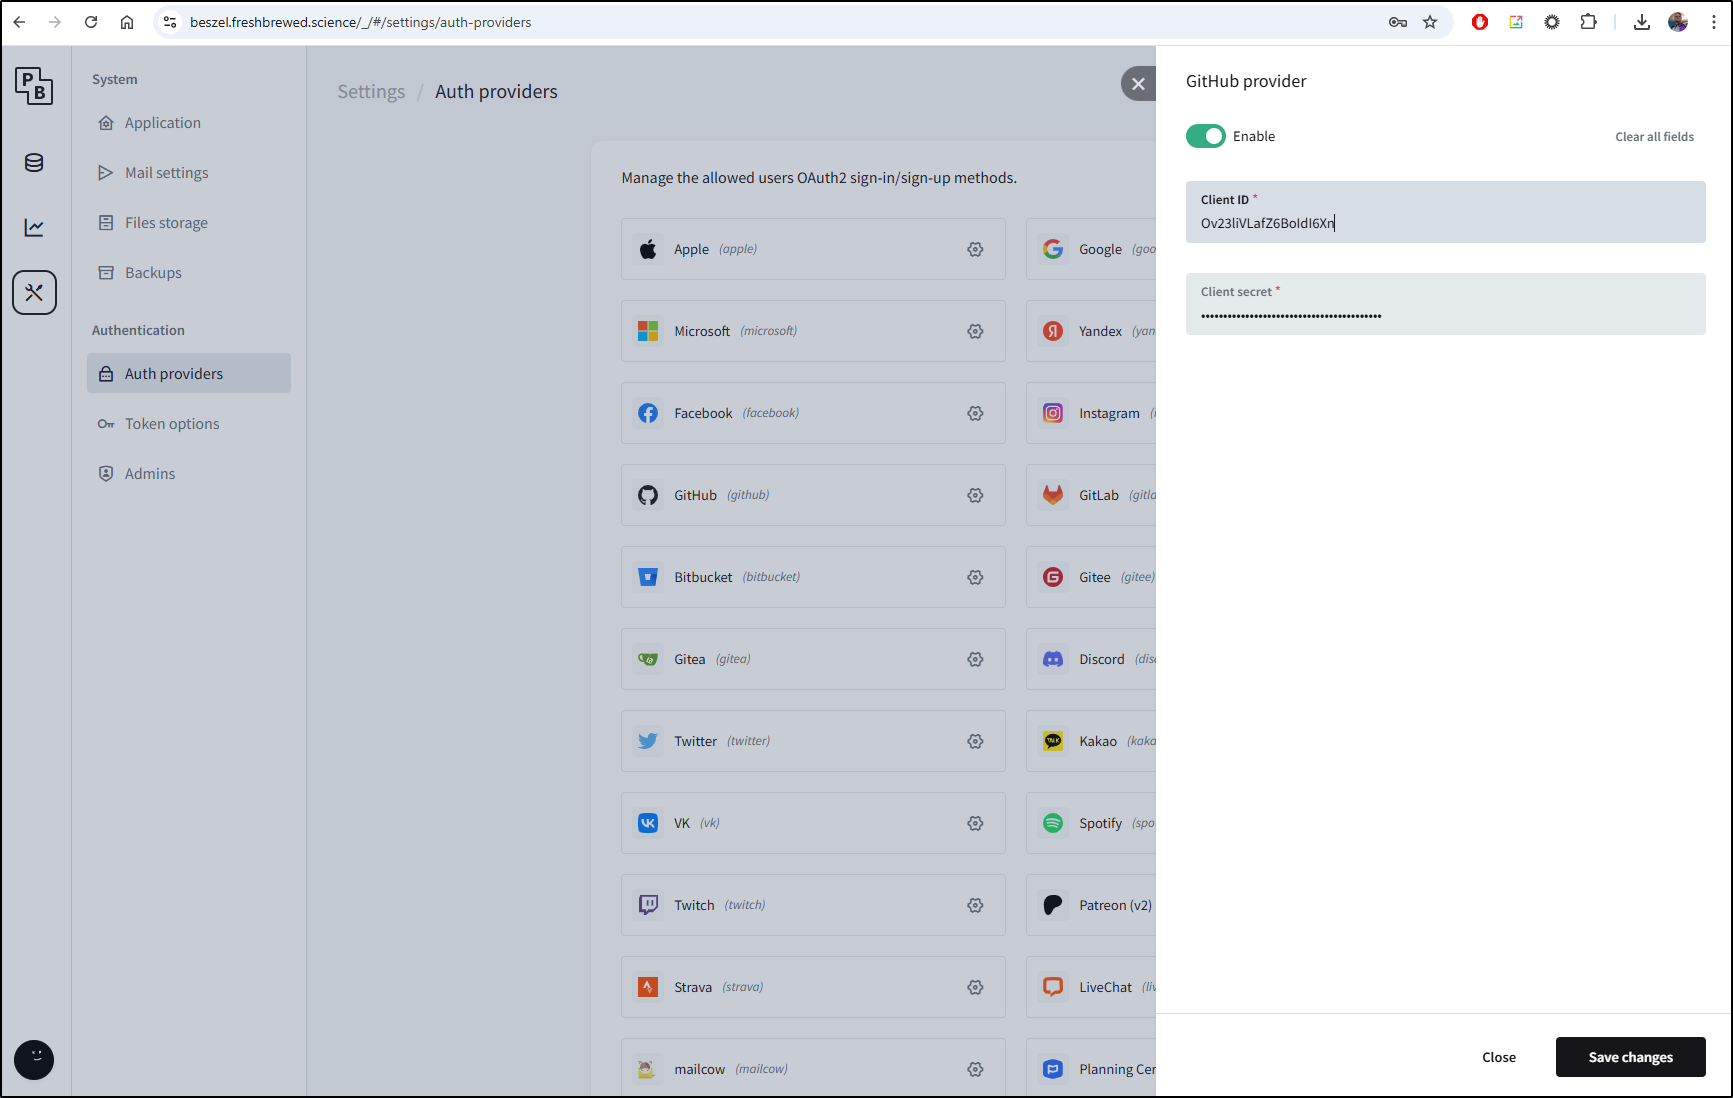
Which I’ll add to the Beszel OAuth provider settings and save
I now see Github enabled
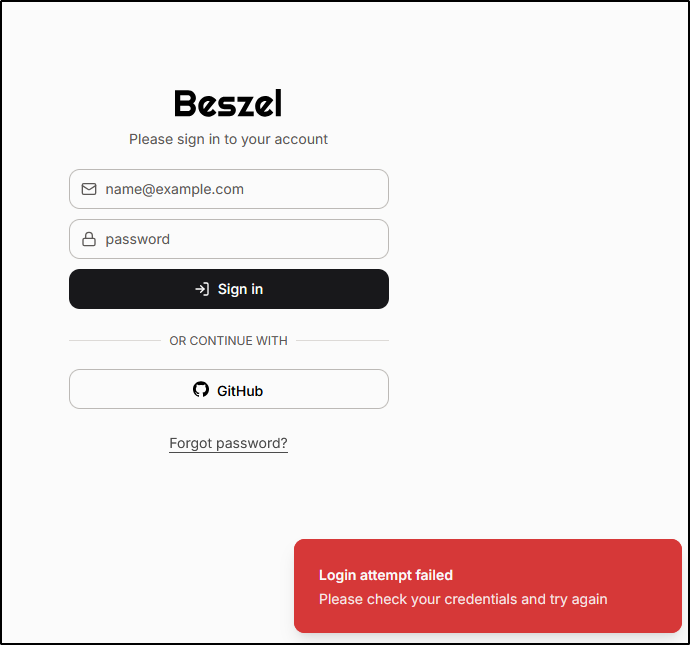
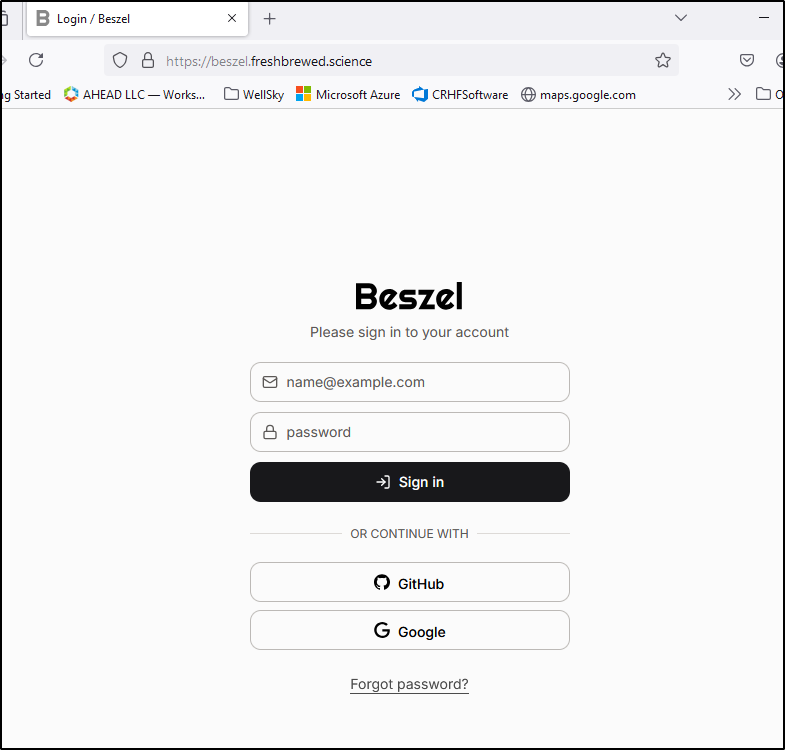
Let’s test the flow
I checked and indeed I made a typo on my callback URL (adding an errant “.”). I fixed that and tried it again
I tried other GH identities but nothing seemed to work. I even tried pre-creating the user and it still errored
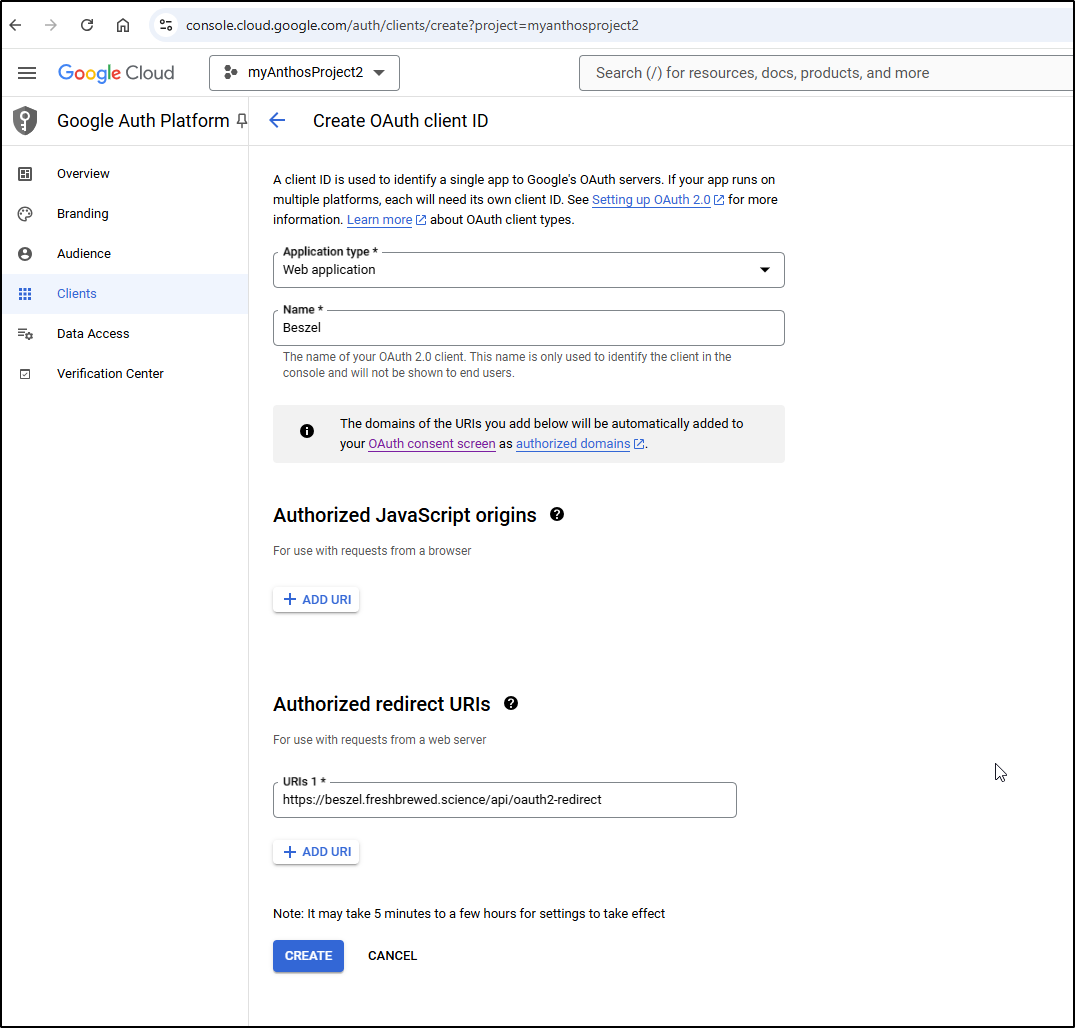
I’ll try Google to see if it’s just Github or my app. Using the new Application UI for adding clients, I can add a new client (the old/existing UI just let’s you add one OAuth per project)
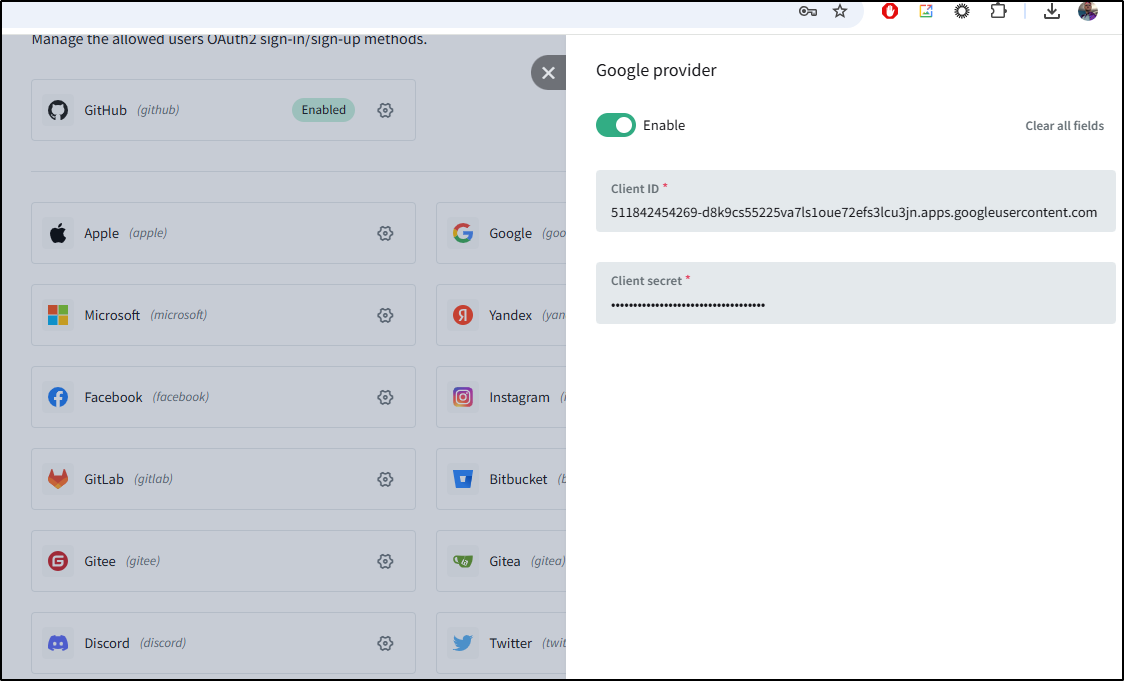
I can now enter those settings into Beszel
I now see both Github and Google listed as configured in the providers page
Now upon signin, I see Google listed
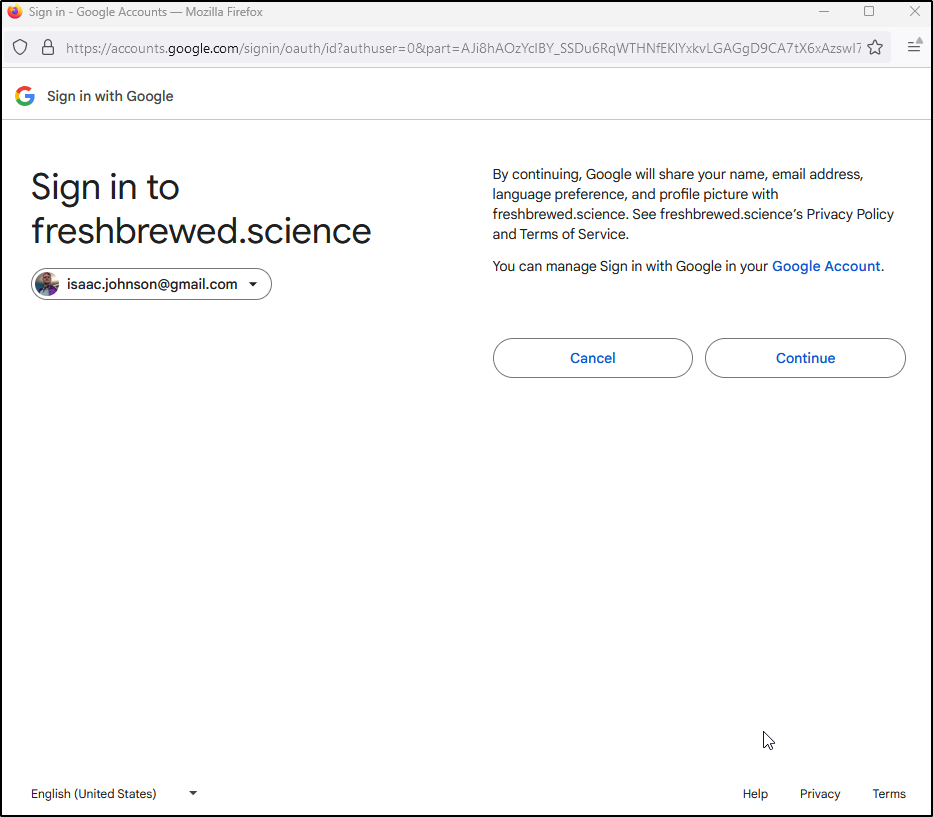
After going through all my MFA layers, I can authorize this App
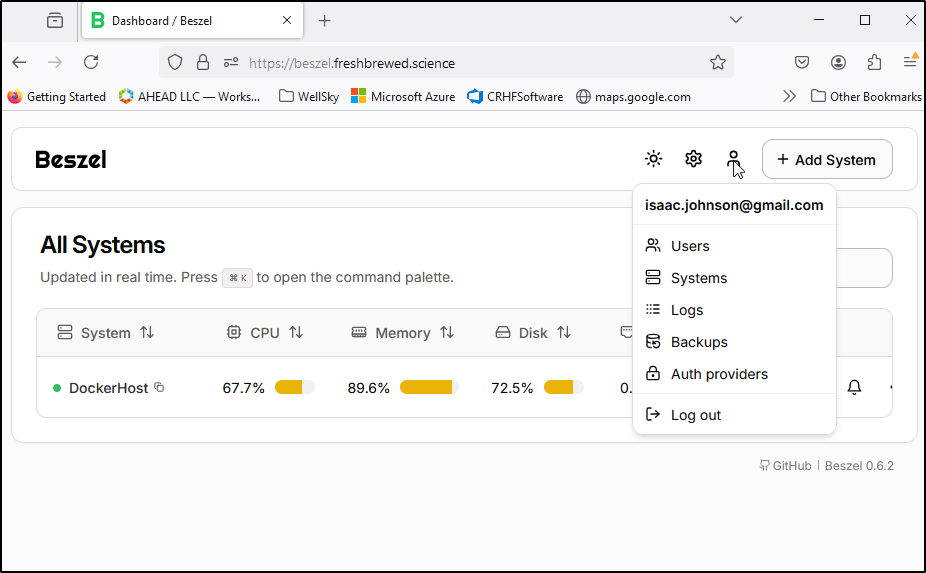
Which worked and logged me in
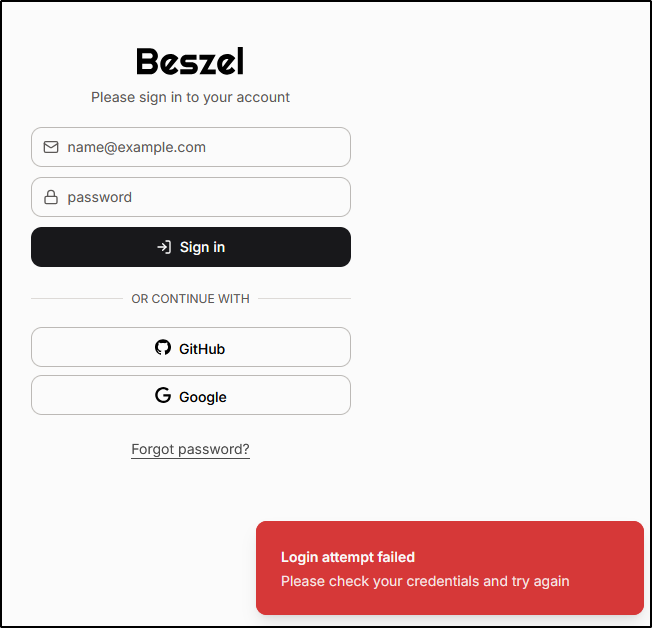
However, a brand new user from Google gets an error
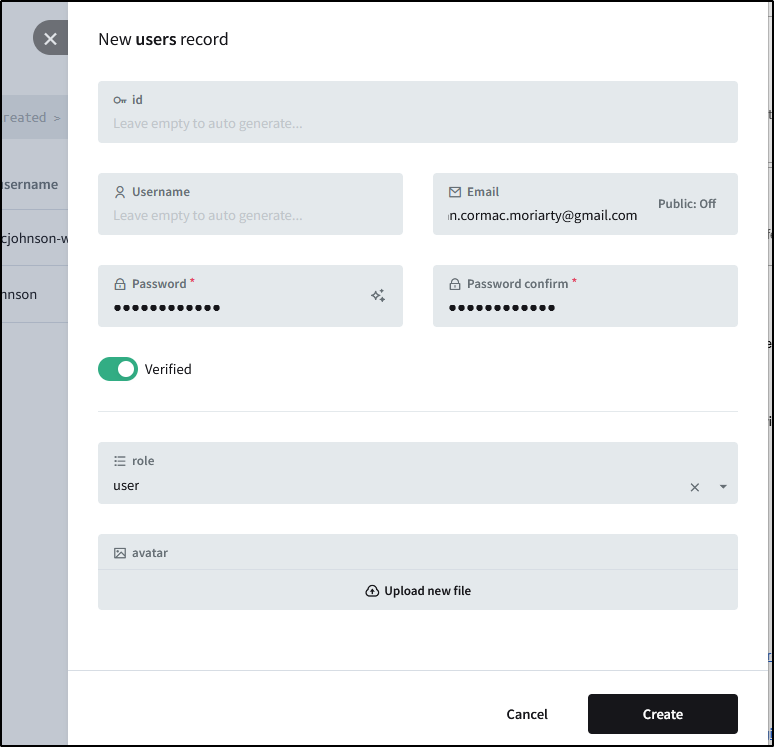
However, if I add the user email as a user and have Tristan try again
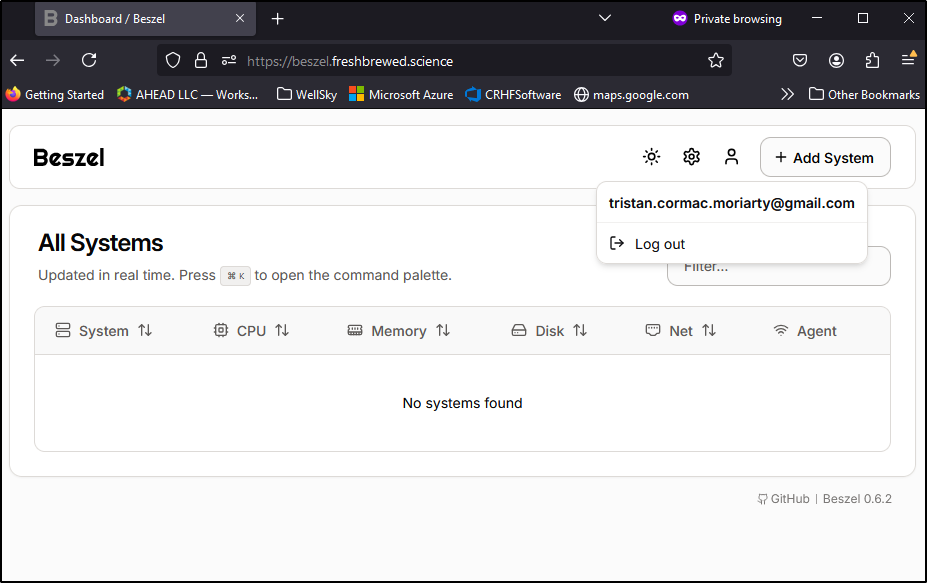
This time they can login
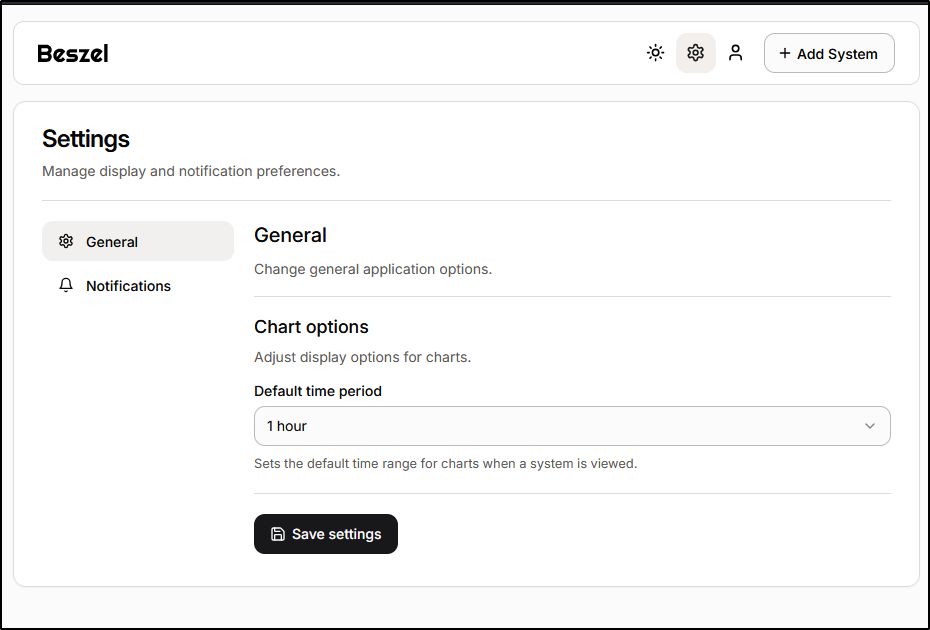
However, their settings are just limited to basic user preferences
Backups
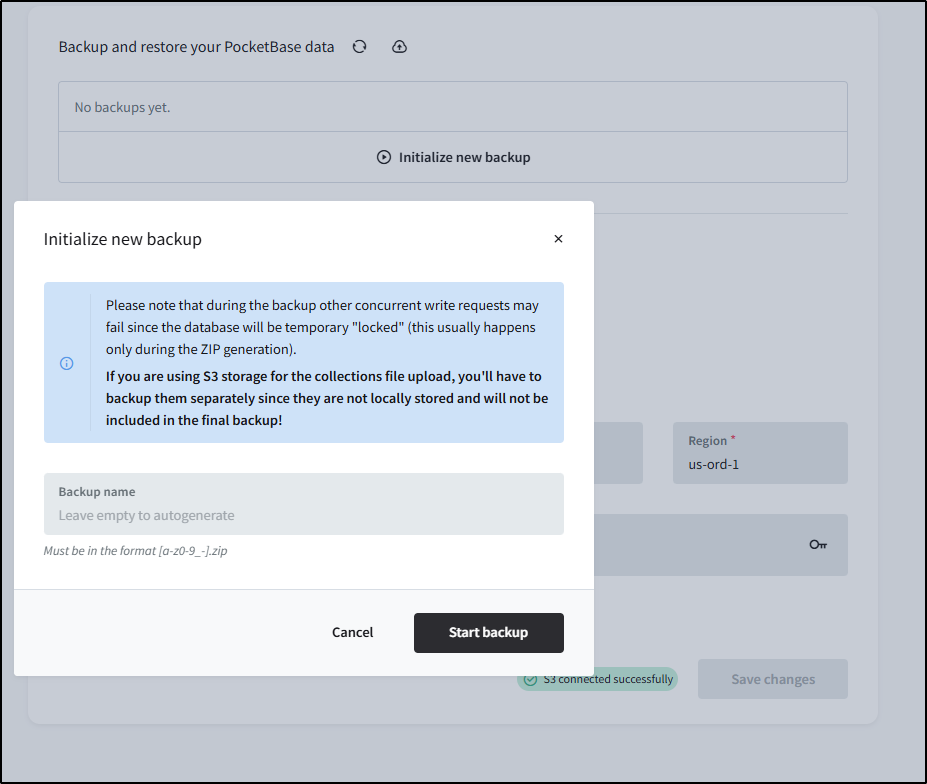
Let’s setup backups in S3 (via Akamai/Linode).
I’ll use the same settings as before then start a backup
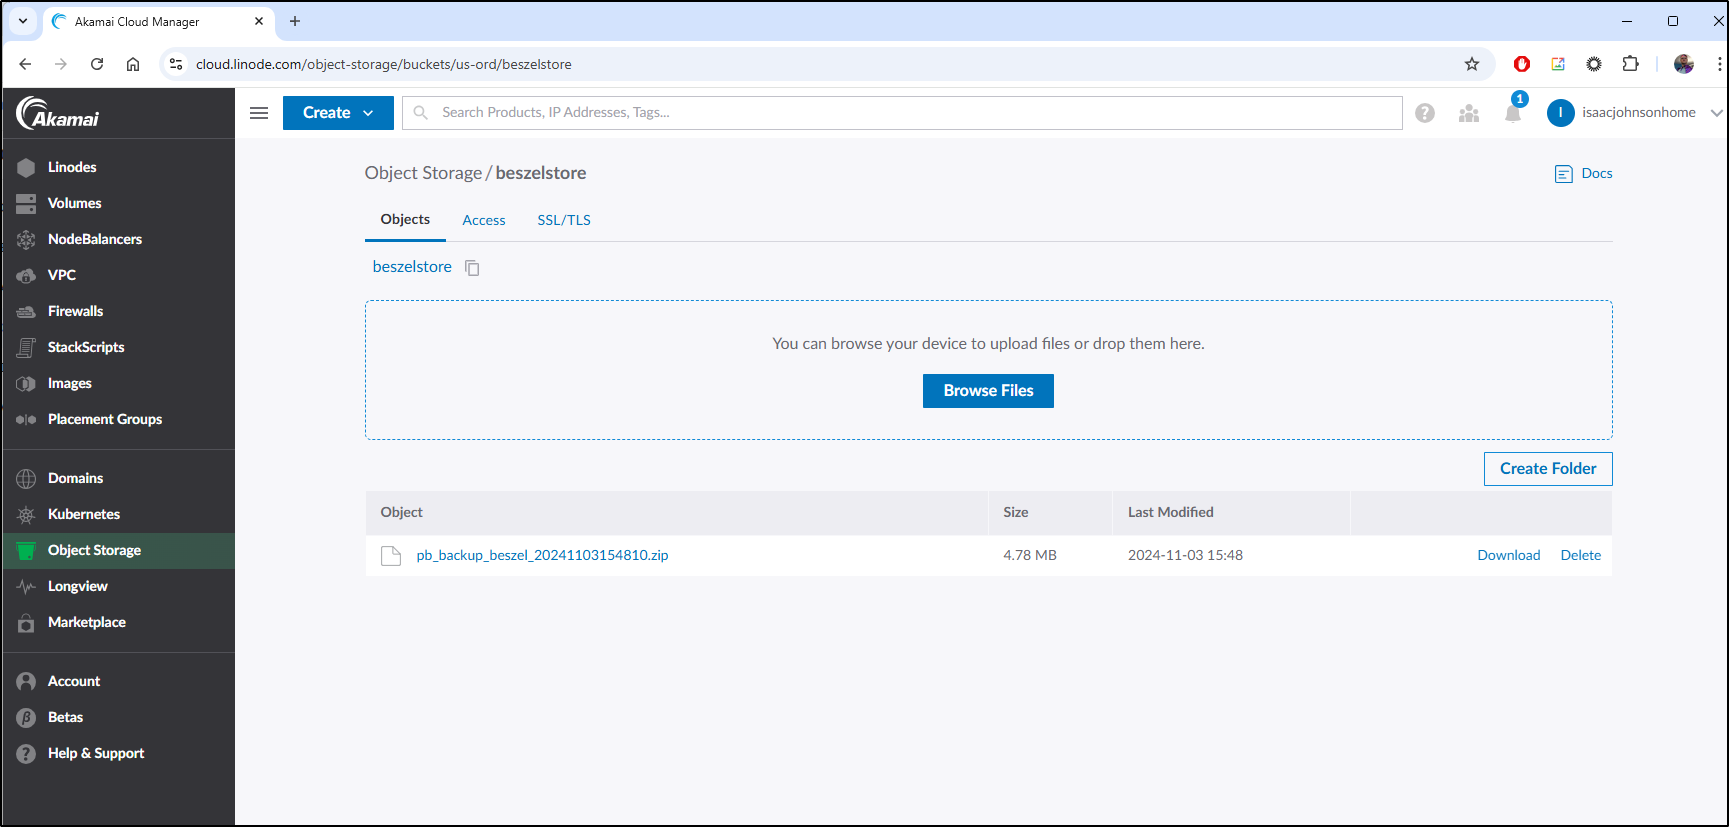
I see the resulting backup in my Linode Object Store bucket
Alerts
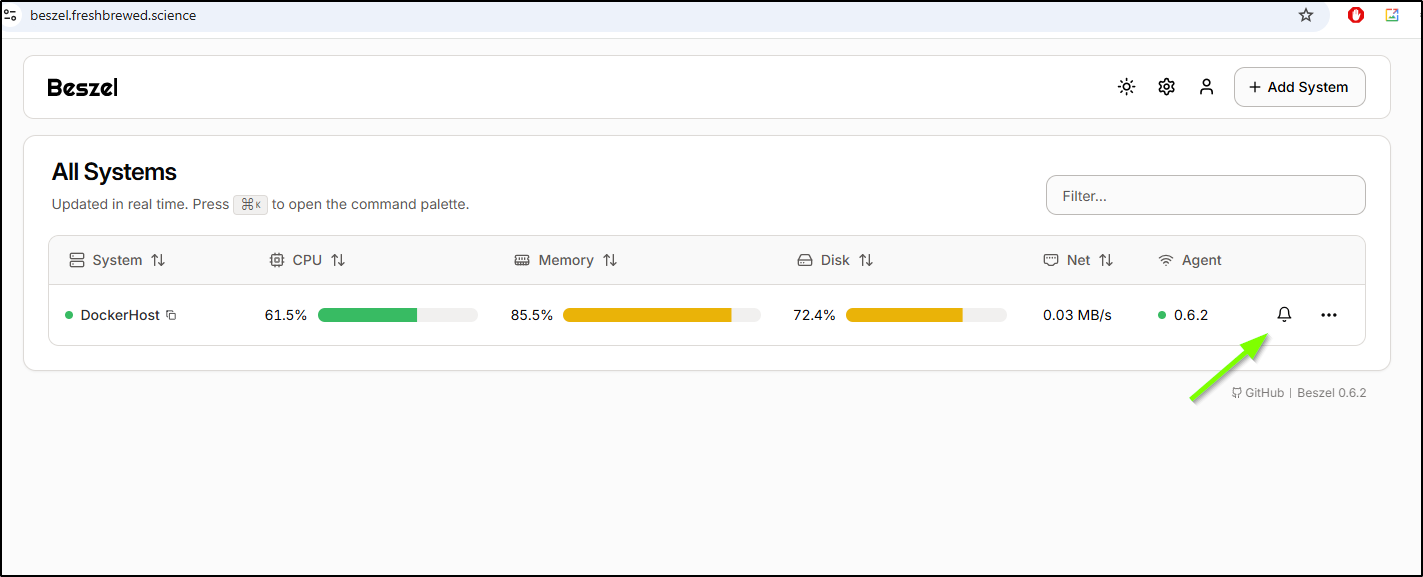
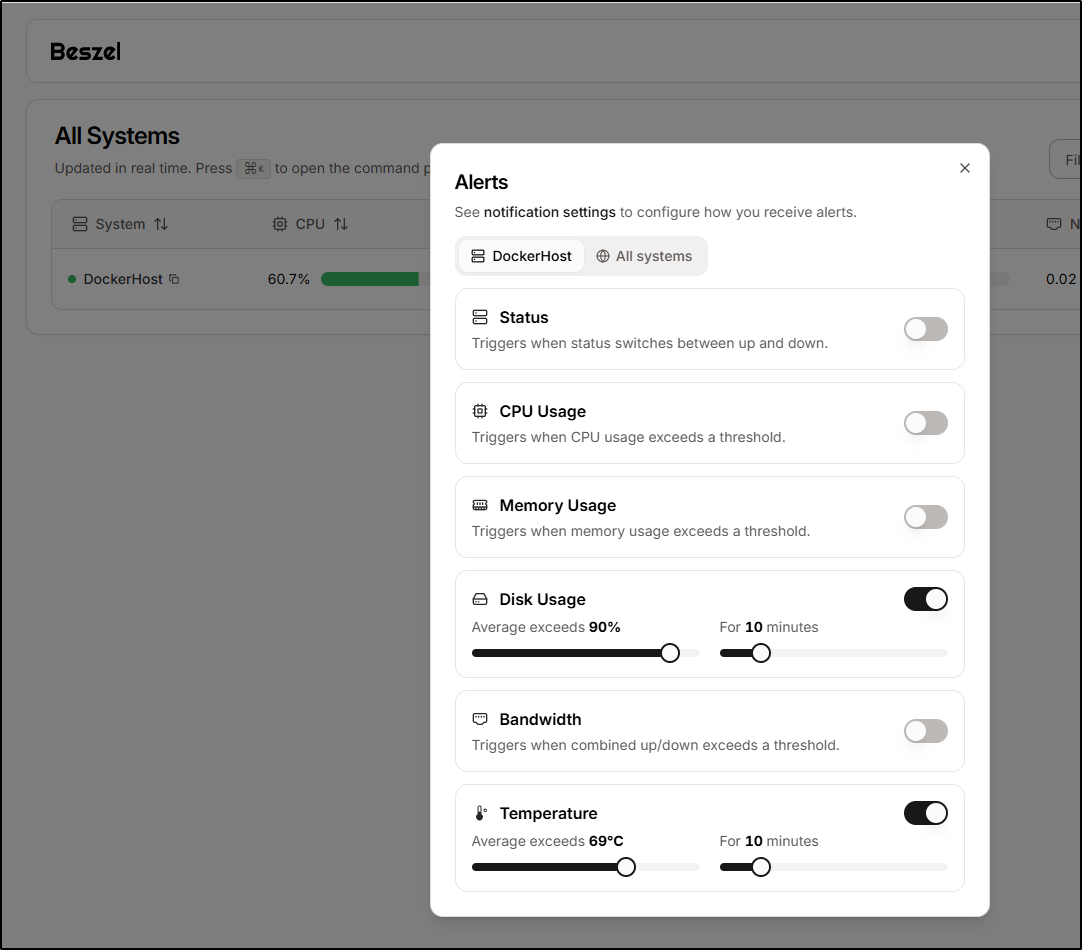
Alerts can be created by clicking the bell icon in our various tables
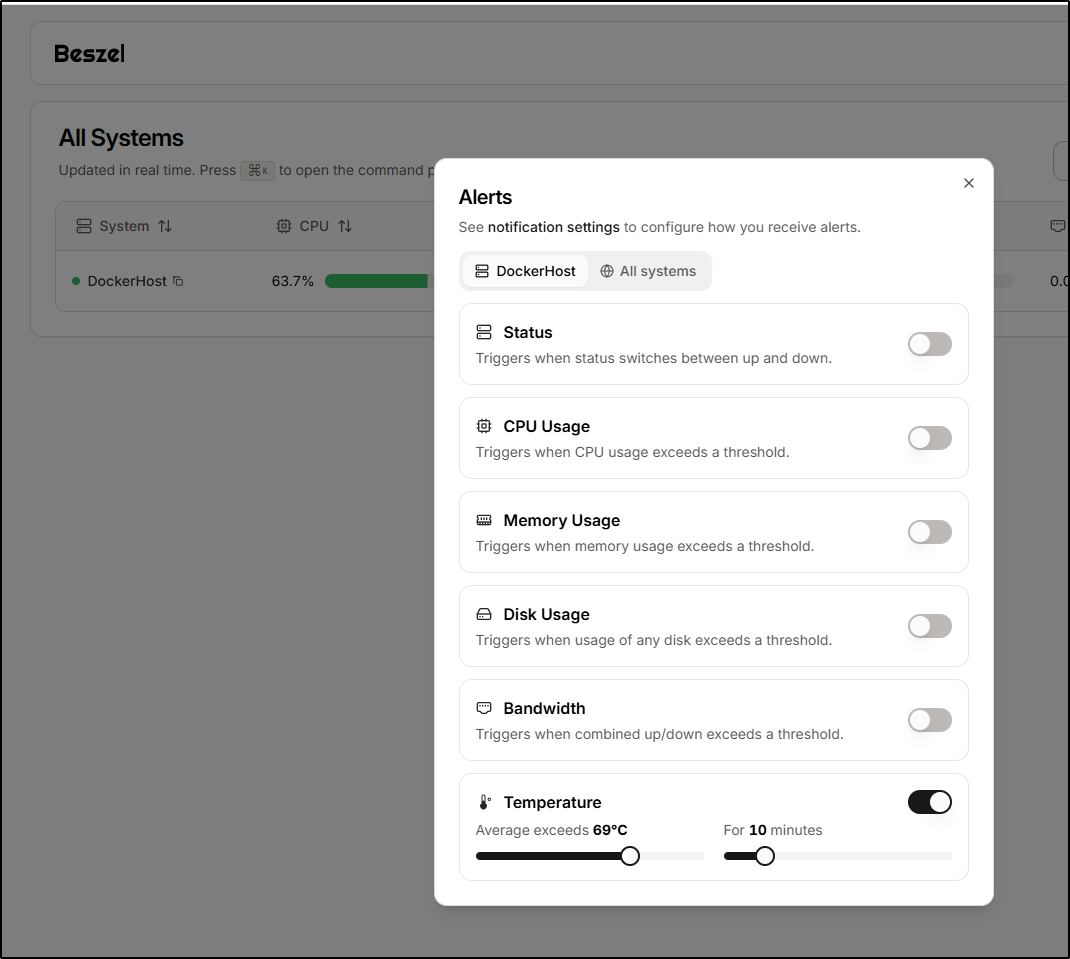
For instance, I could create an alert when the Dockerhost exceeds a temp for a duration
Maybe I’ll include disk alerts as well
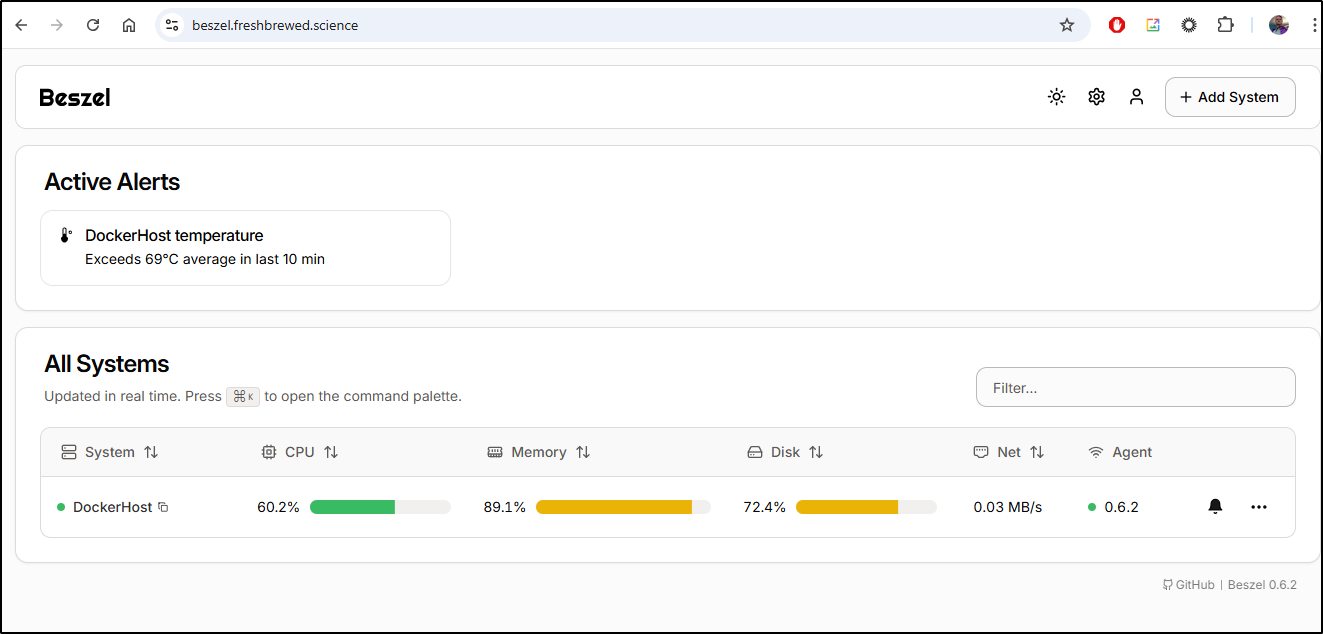
On the page itself I can see a situation is in alert already
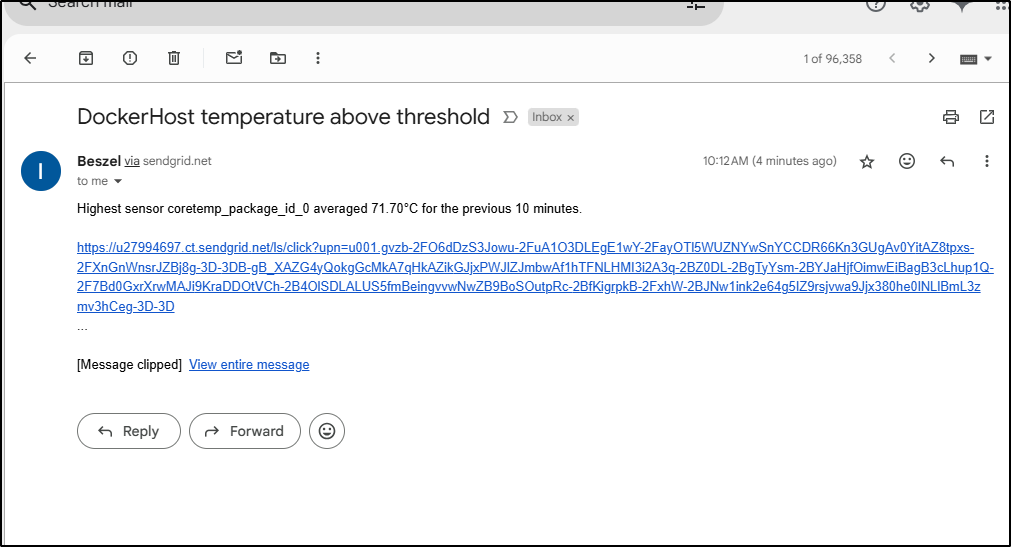
Soon thereafter, I got a Sendgrid alert
Which linked to the Dockerhost page
Temps
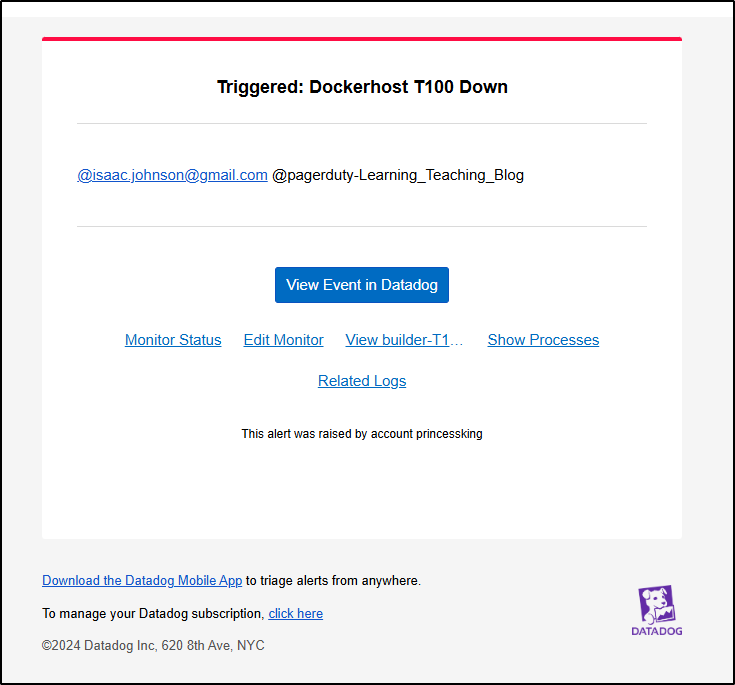
So just prior to posting this, in the morning today I had the Dockerhost seize up. I got a Pagerduty alert via Datadog
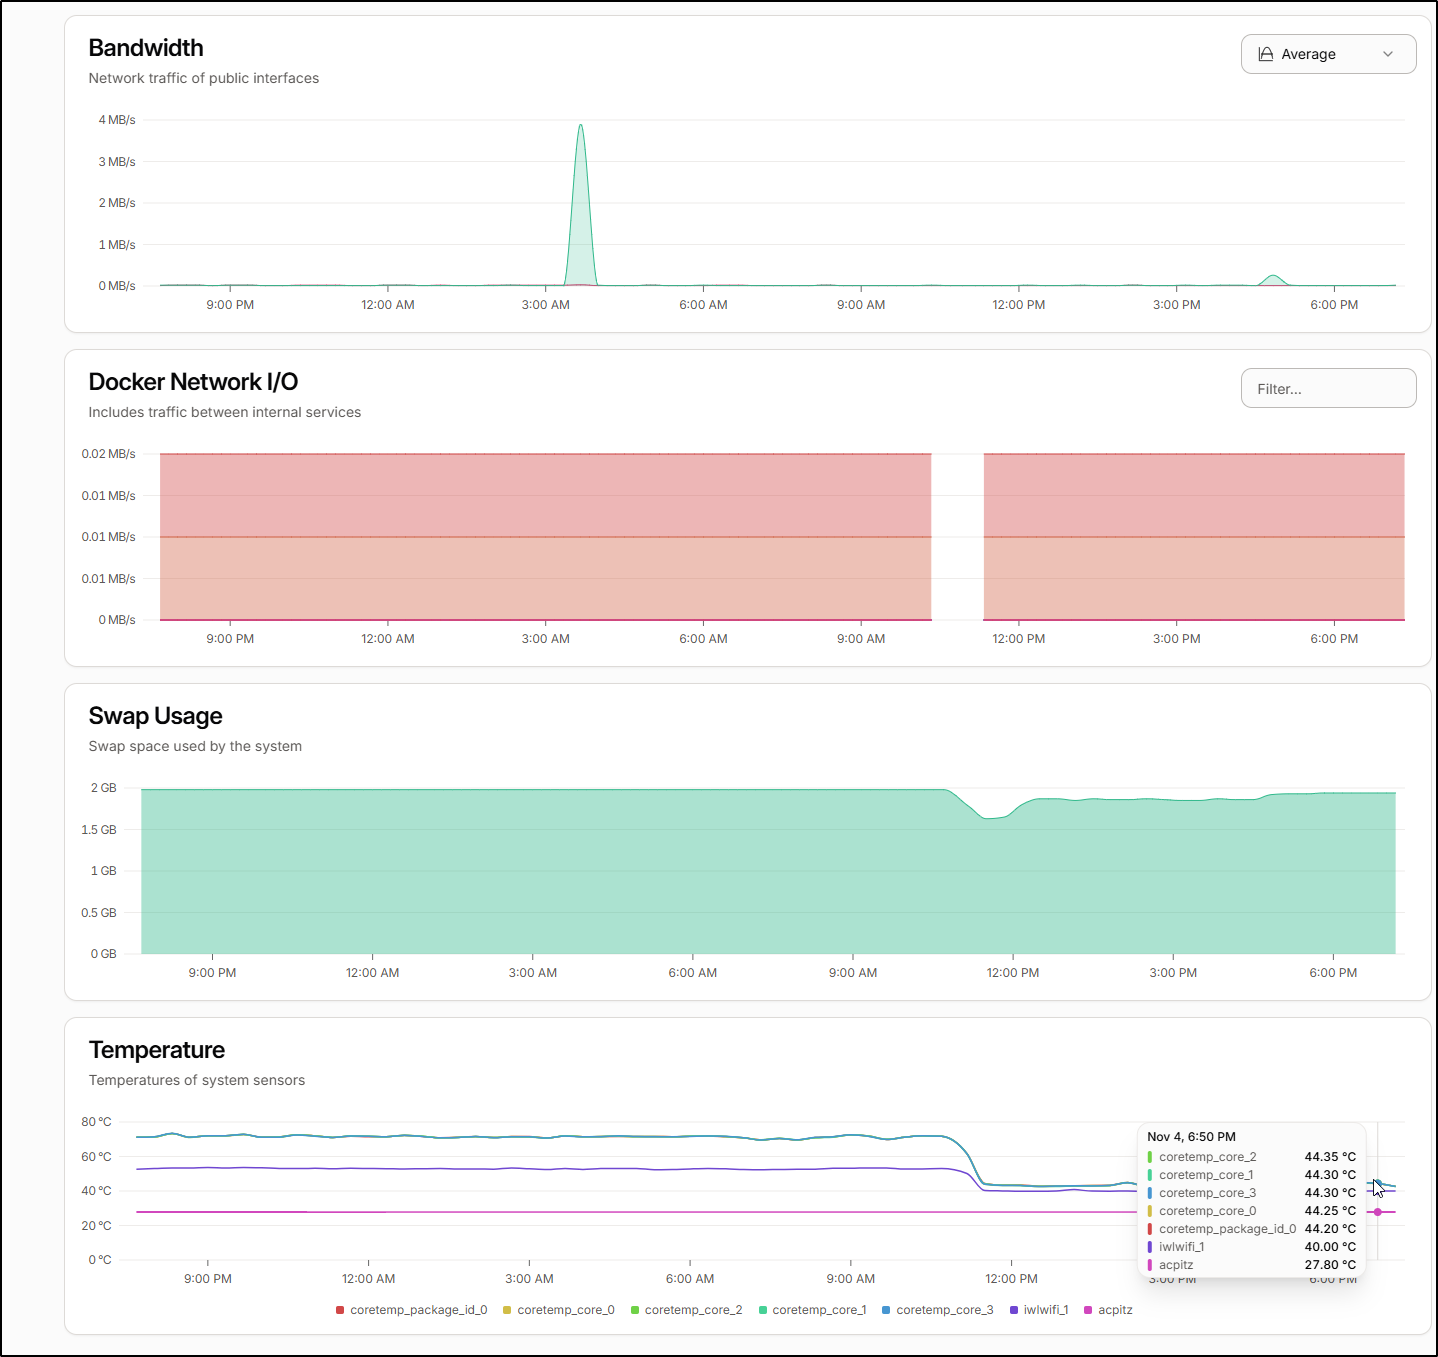
I repowered it and looked at the temps. They were still super hot. In fact, as I looked at trends, the temps had slowly increased not decreased.
I swapped the fan around. I guessed my fanless system would do better by “pushing” air in the side rather than “pulling” it out. The difference was amazing.
As you can see in the graph, I dropped from an average 71.75 degrees C (161F) to 42.75 degrees C (108F)
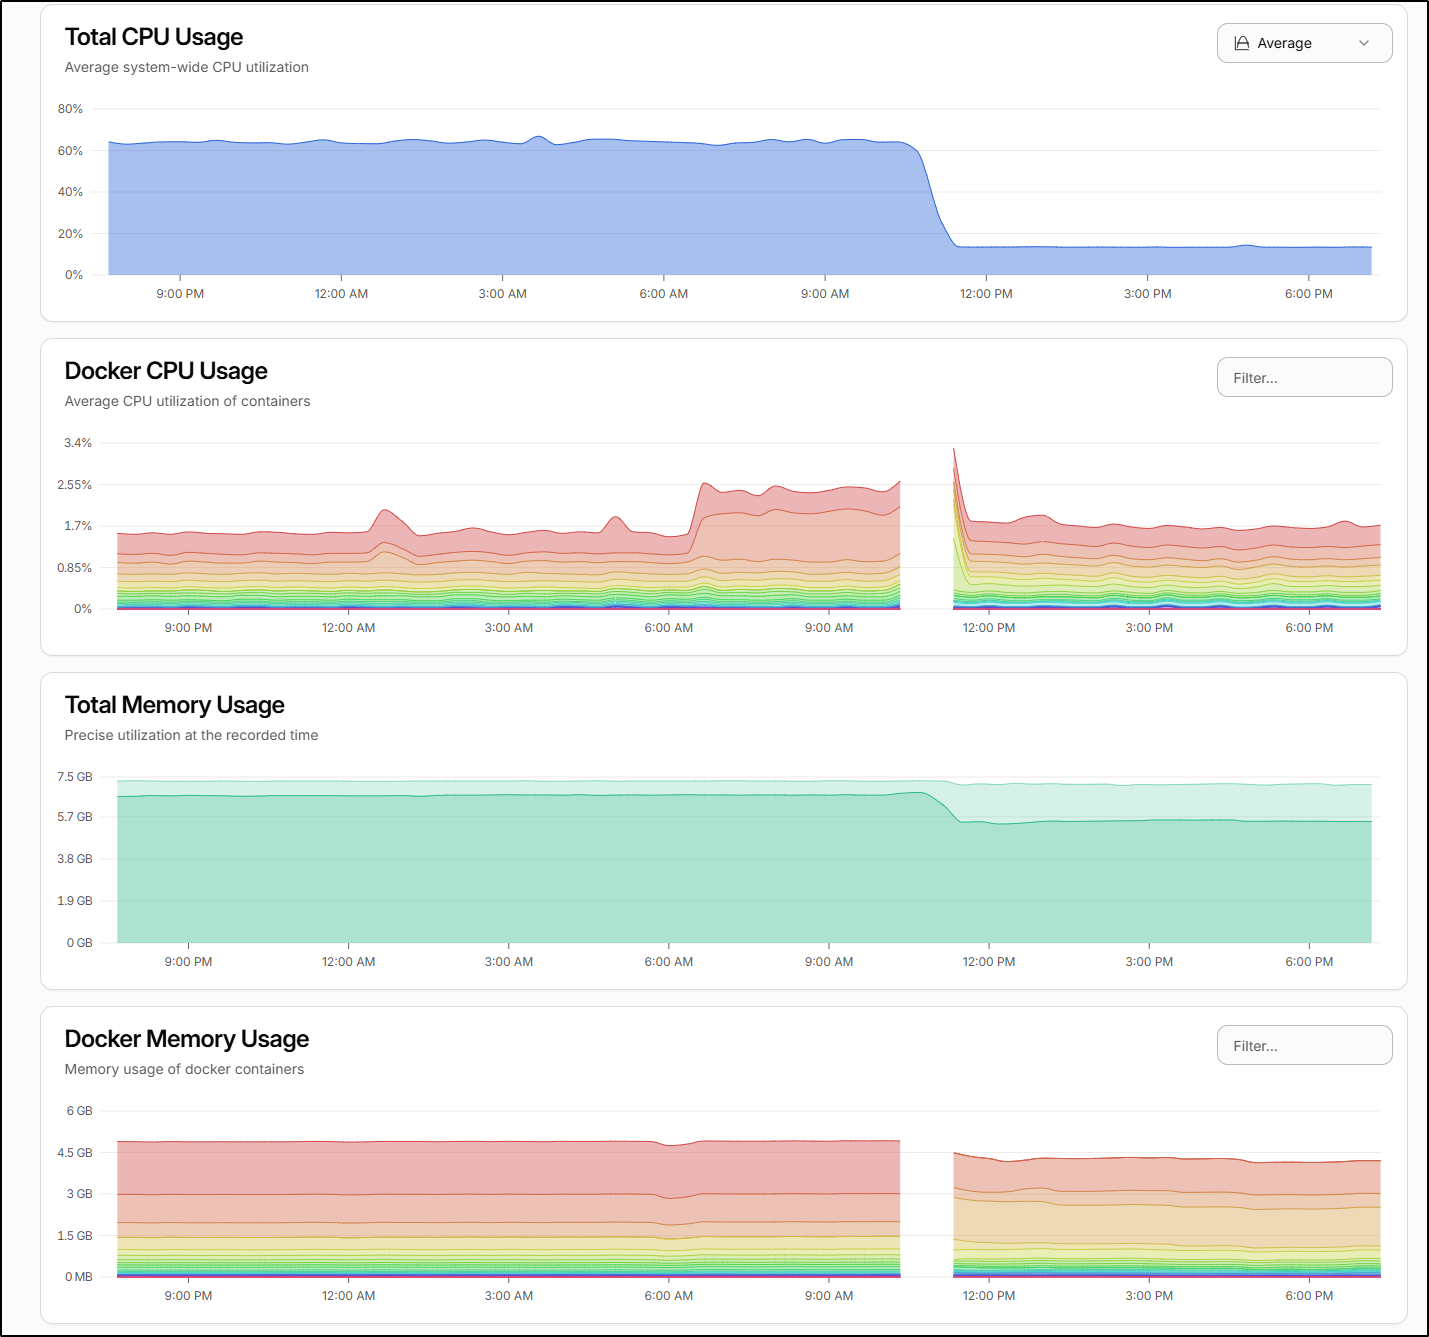
We can see the cut out but I also noted upon reboot the overall CPU usage decreased as well which I can only assume was thermal throttling as I checked Docker and all the same containers came up.
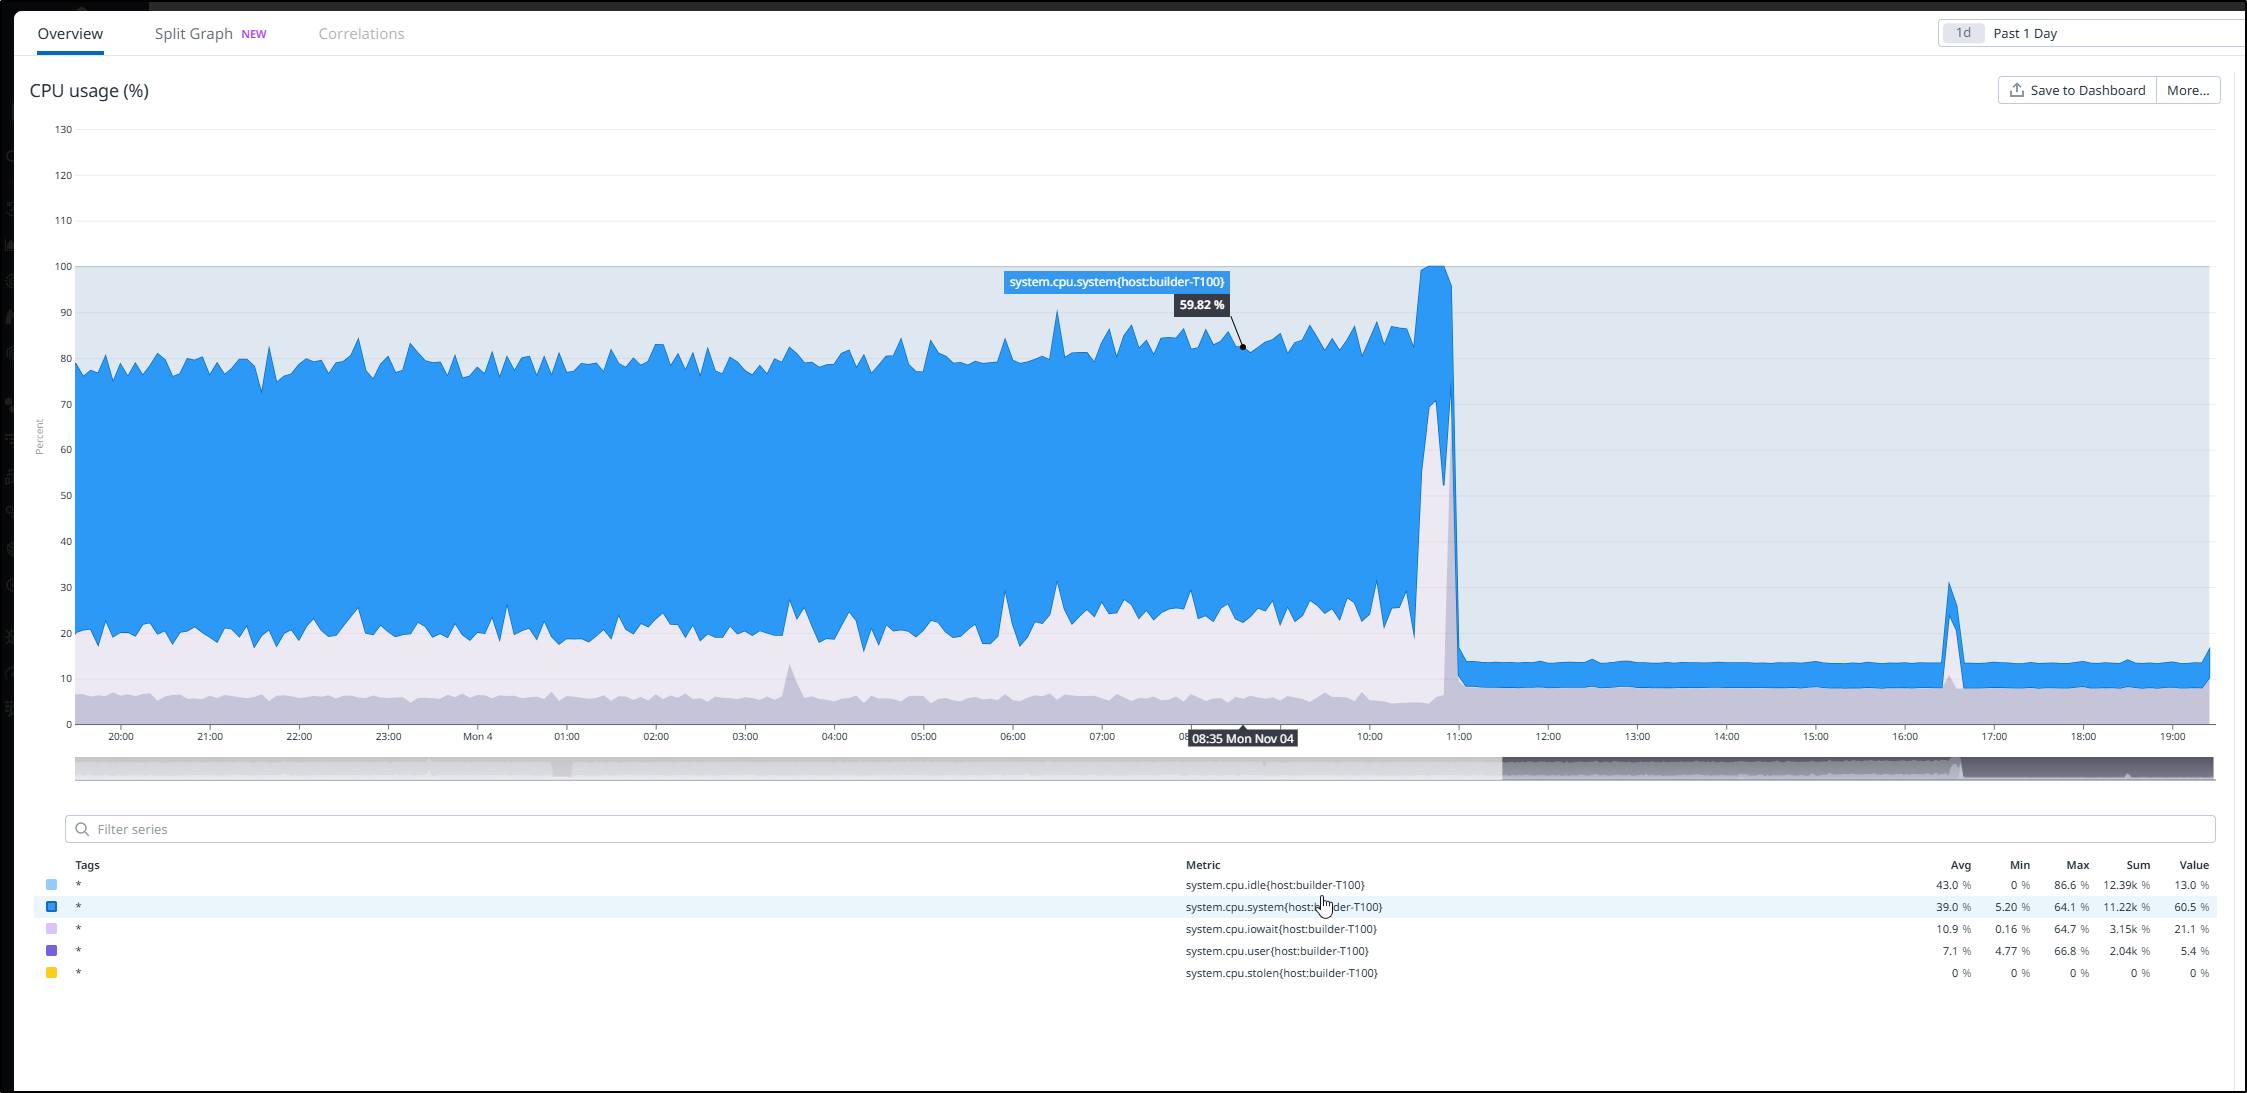
As an aside, we can see this same information from Datadog
Summary
Other than some slight nuances on user signup, I found this a rather complete full featured app for monitoring Docker/Container hosts. While I didn’t test with Podman, I’m sure it would work just as well.
We dug into metrics and monitors, emails and notifications and used temperature graphs to improve some cooling. We looked at Auth providers, setting up Github and Google (with Google working) and looked at non-privileged users as well. We touched on logs and metrics and wrapped by configuring backups to Akamai/Linode object stores.


