Published: Oct 8, 2024 by Isaac Johnson
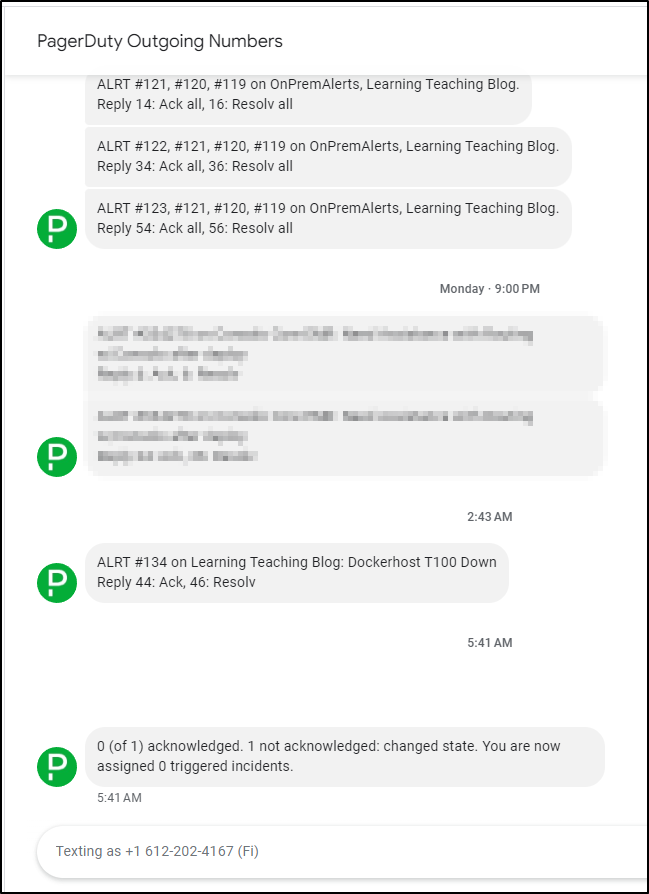
Early this morning my Pagerduty went off (though I set the schedule to not wake me, but just text).
After breakfast, I went to check my host only to find it was doing just dandy:
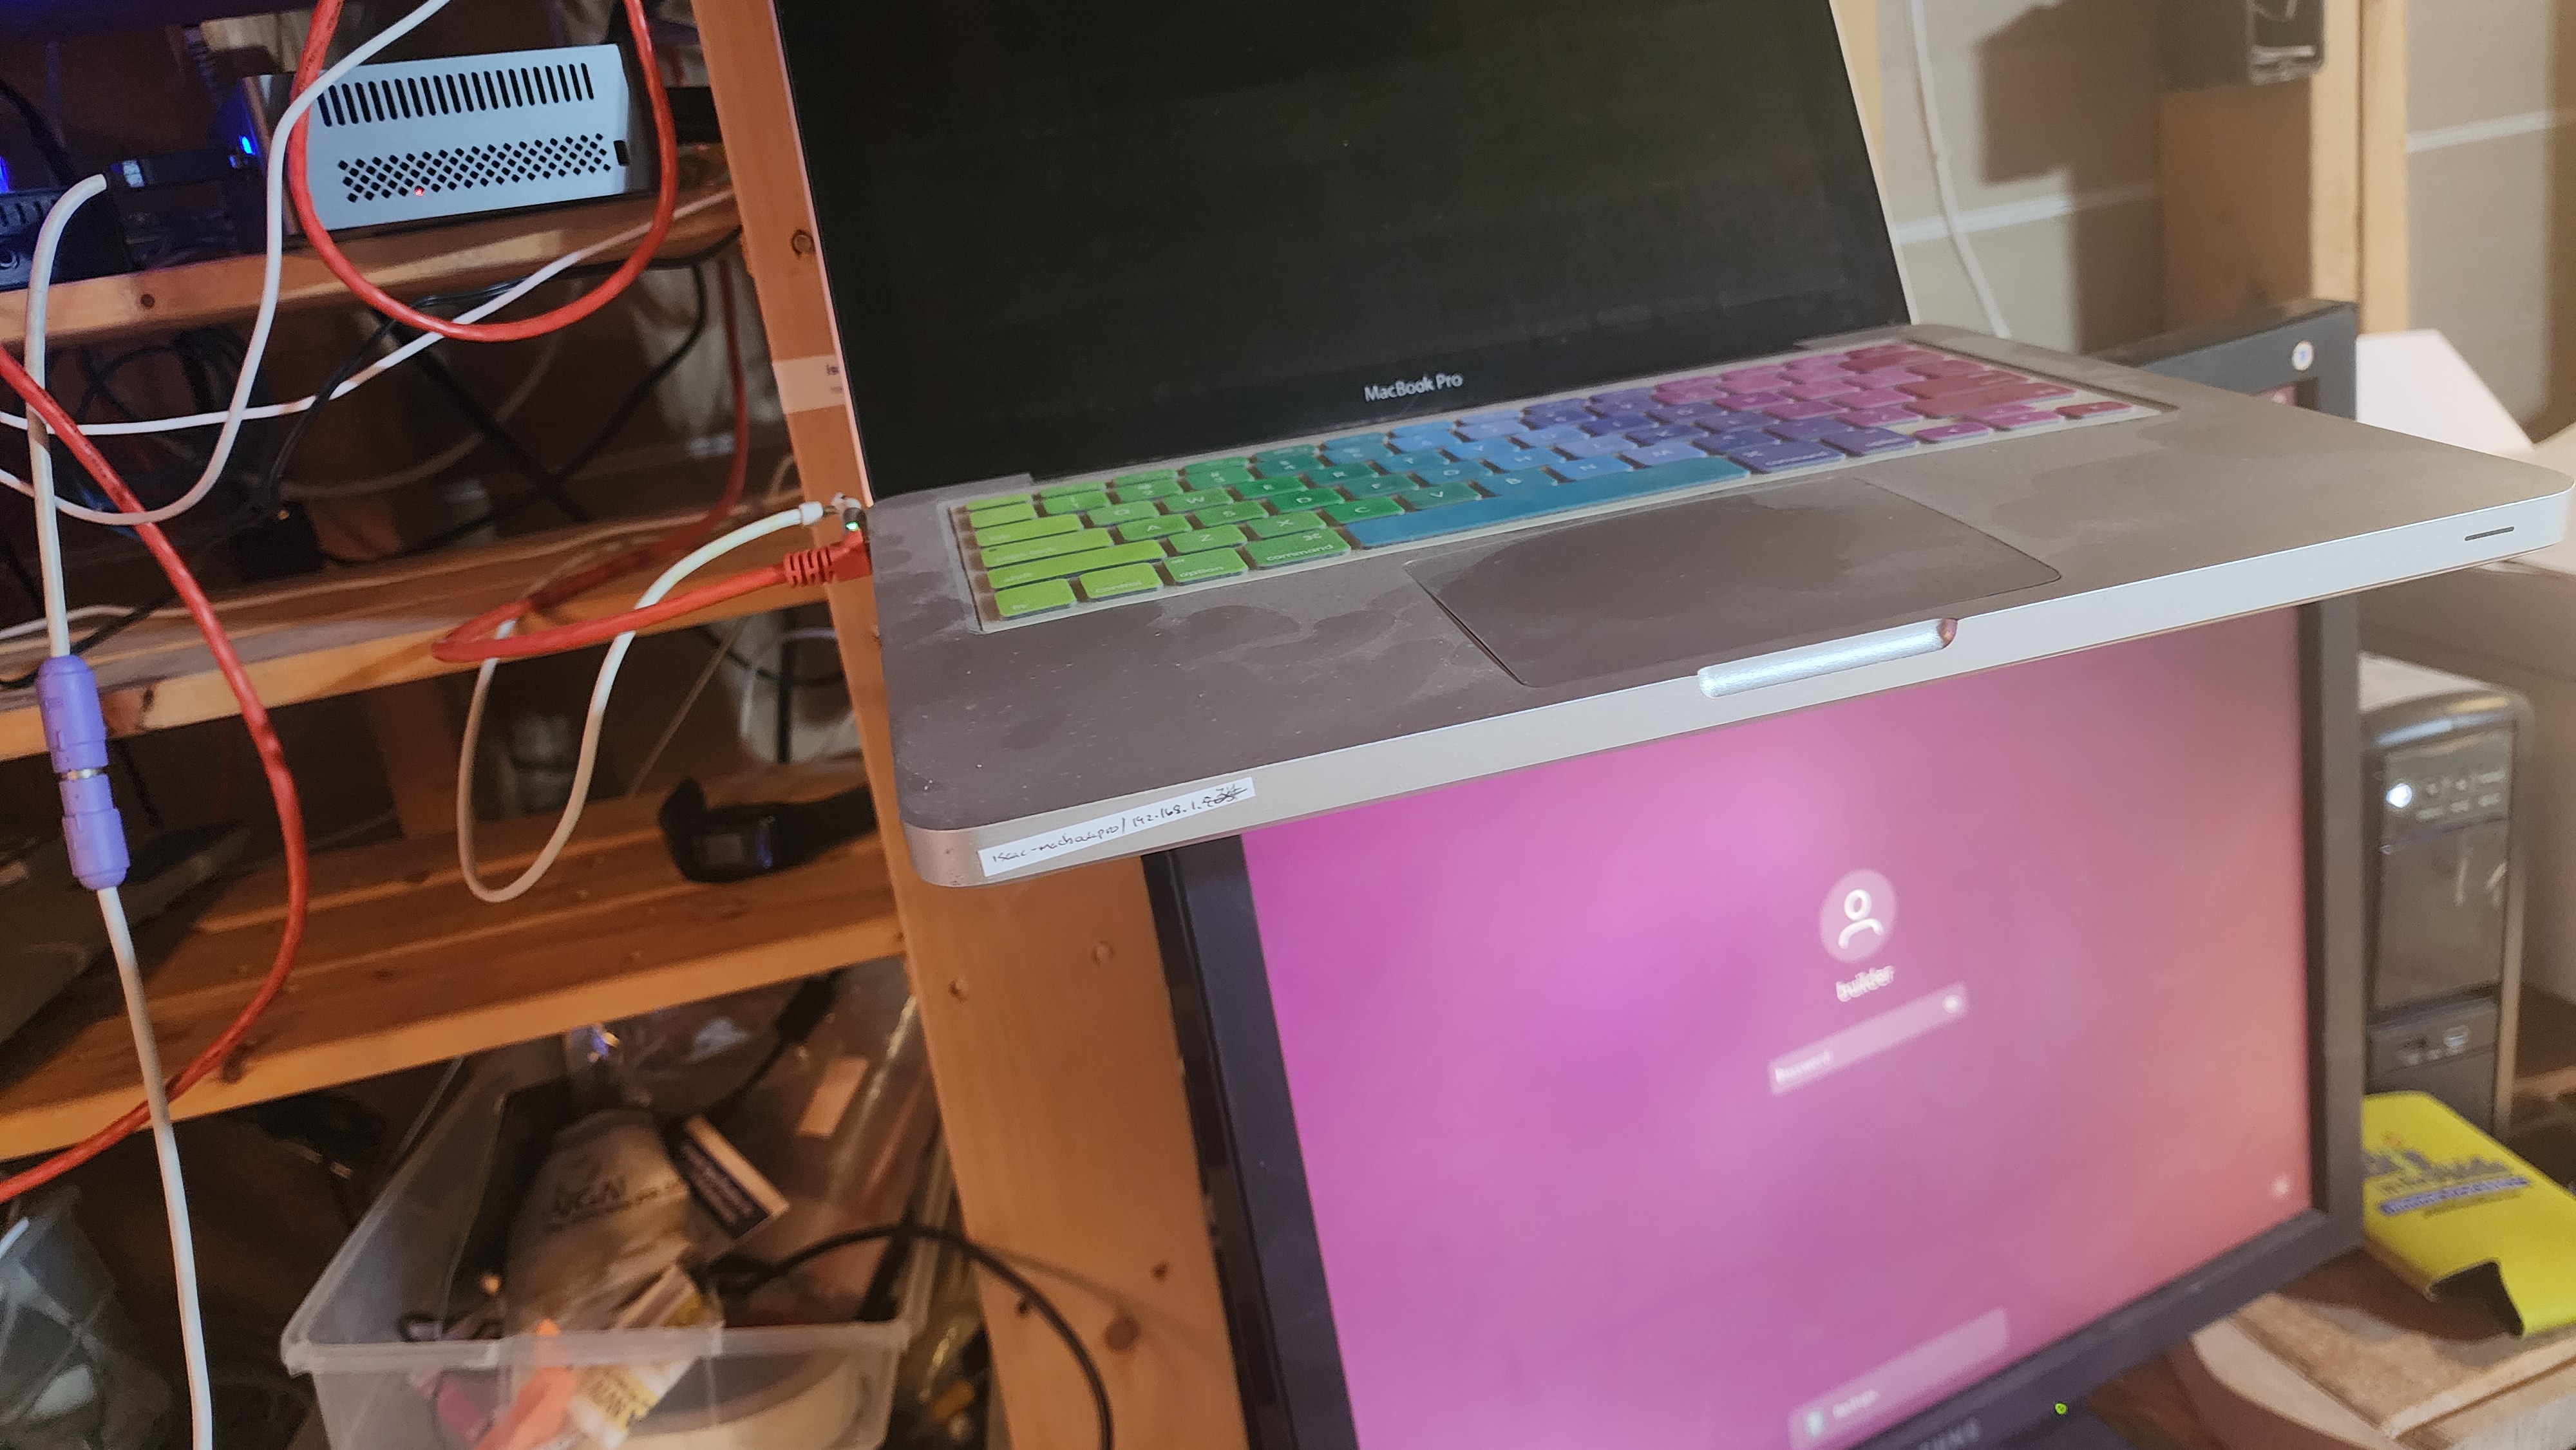
Curious… So i sat at my desk and noted the alert light was on (so the alert definately came from Datadog)
… Yet, logging in was fine
builder@DESKTOP-QADGF36:~/Workspaces/rustpad$ ssh builder@192.168.1.100
Welcome to Ubuntu 22.04.2 LTS (GNU/Linux 6.8.0-40-generic x86_64)

 * Documentation:  https://help.ubuntu.com
 * Management:     https://landscape.canonical.com
 * Support:        https://ubuntu.com/advantage

Expanded Security Maintenance for Applications is not enabled.

184 updates can be applied immediately.
To see these additional updates run: apt list --upgradable

17 additional security updates can be applied with ESM Apps.
Learn more about enabling ESM Apps service at https://ubuntu.com/esm


The list of available updates is more than a week old.
To check for new updates run: sudo apt update
*** System restart required ***
Last login: Tue Sep 17 05:57:28 2024 from 192.168.1.160
builder@builder-T100:~$ uptime
 06:00:46 up 15 days, 11:00,  2 users,  load average: 2.92, 2.82, 3.00
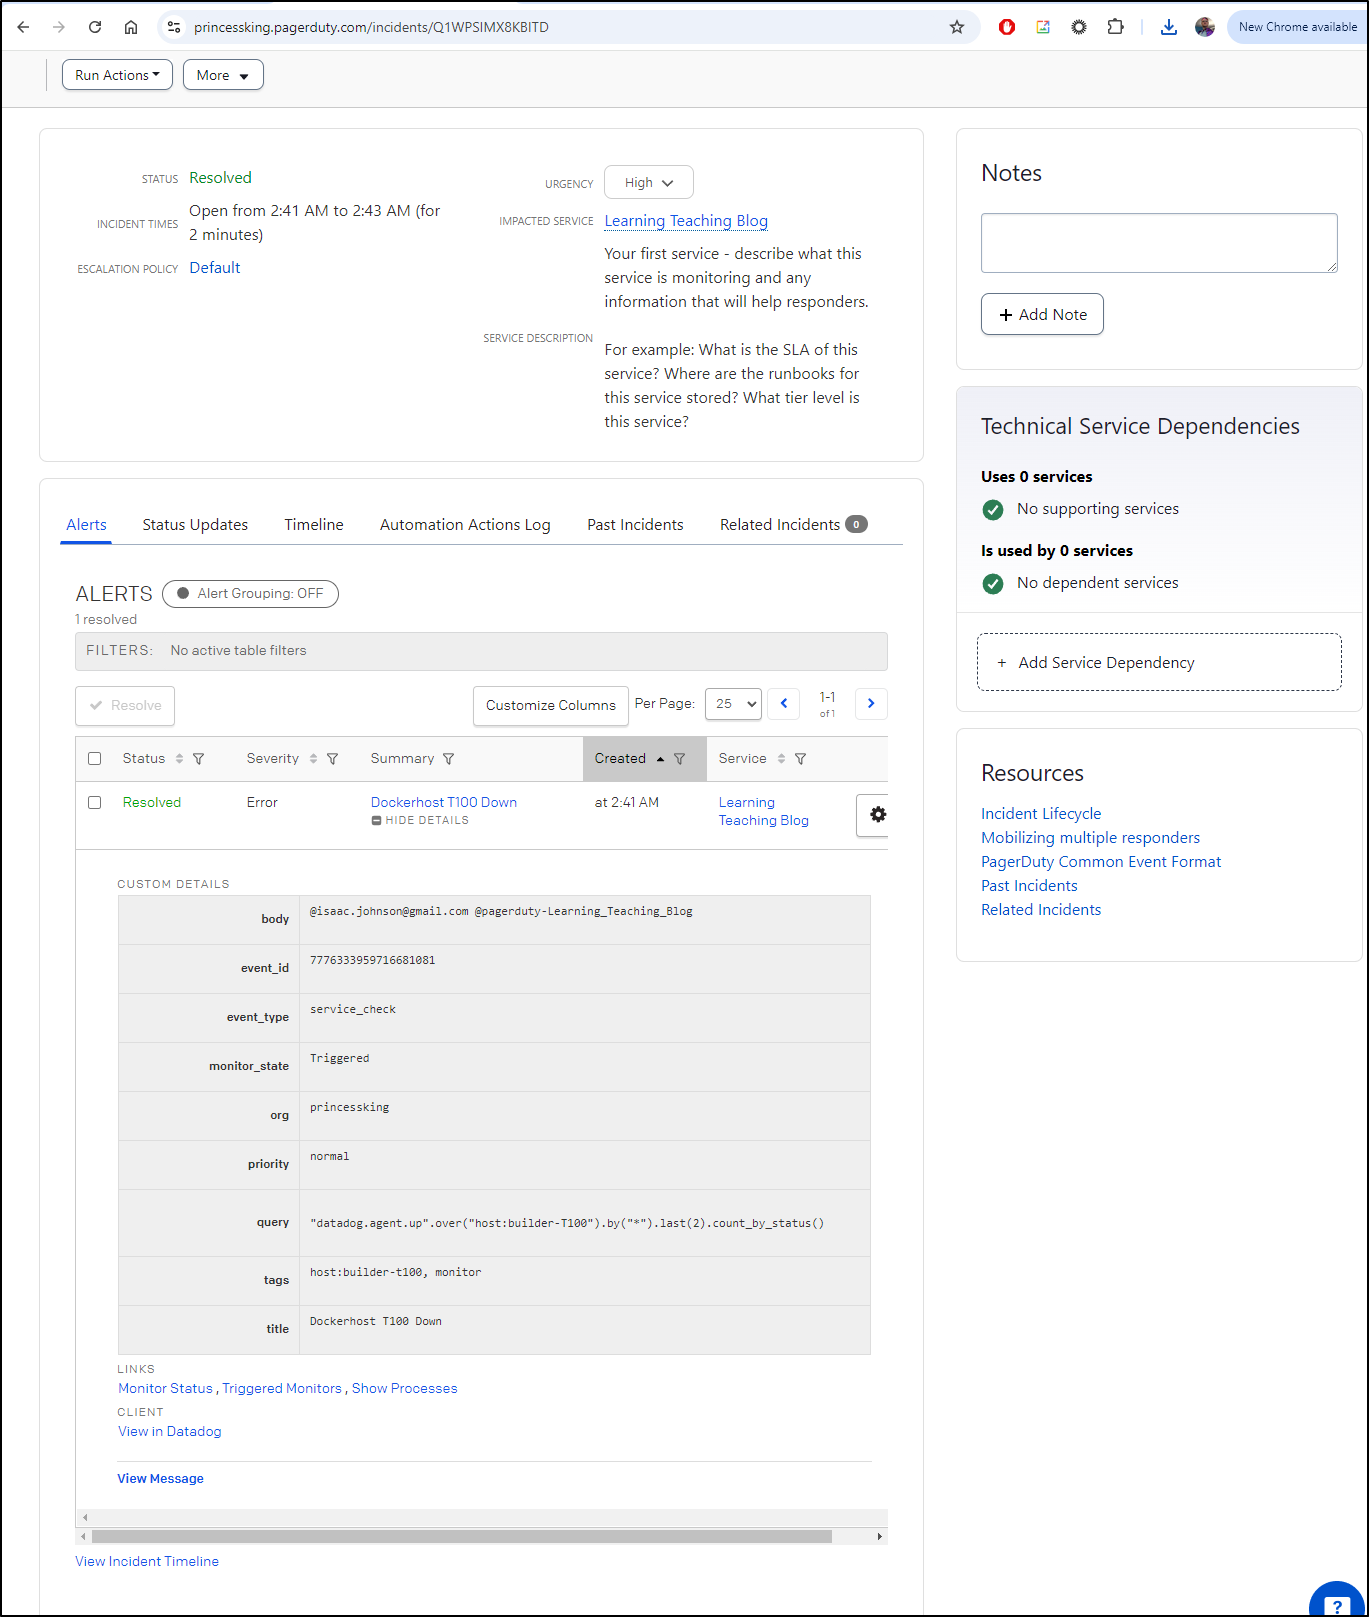
I checked Pagerduty at this point
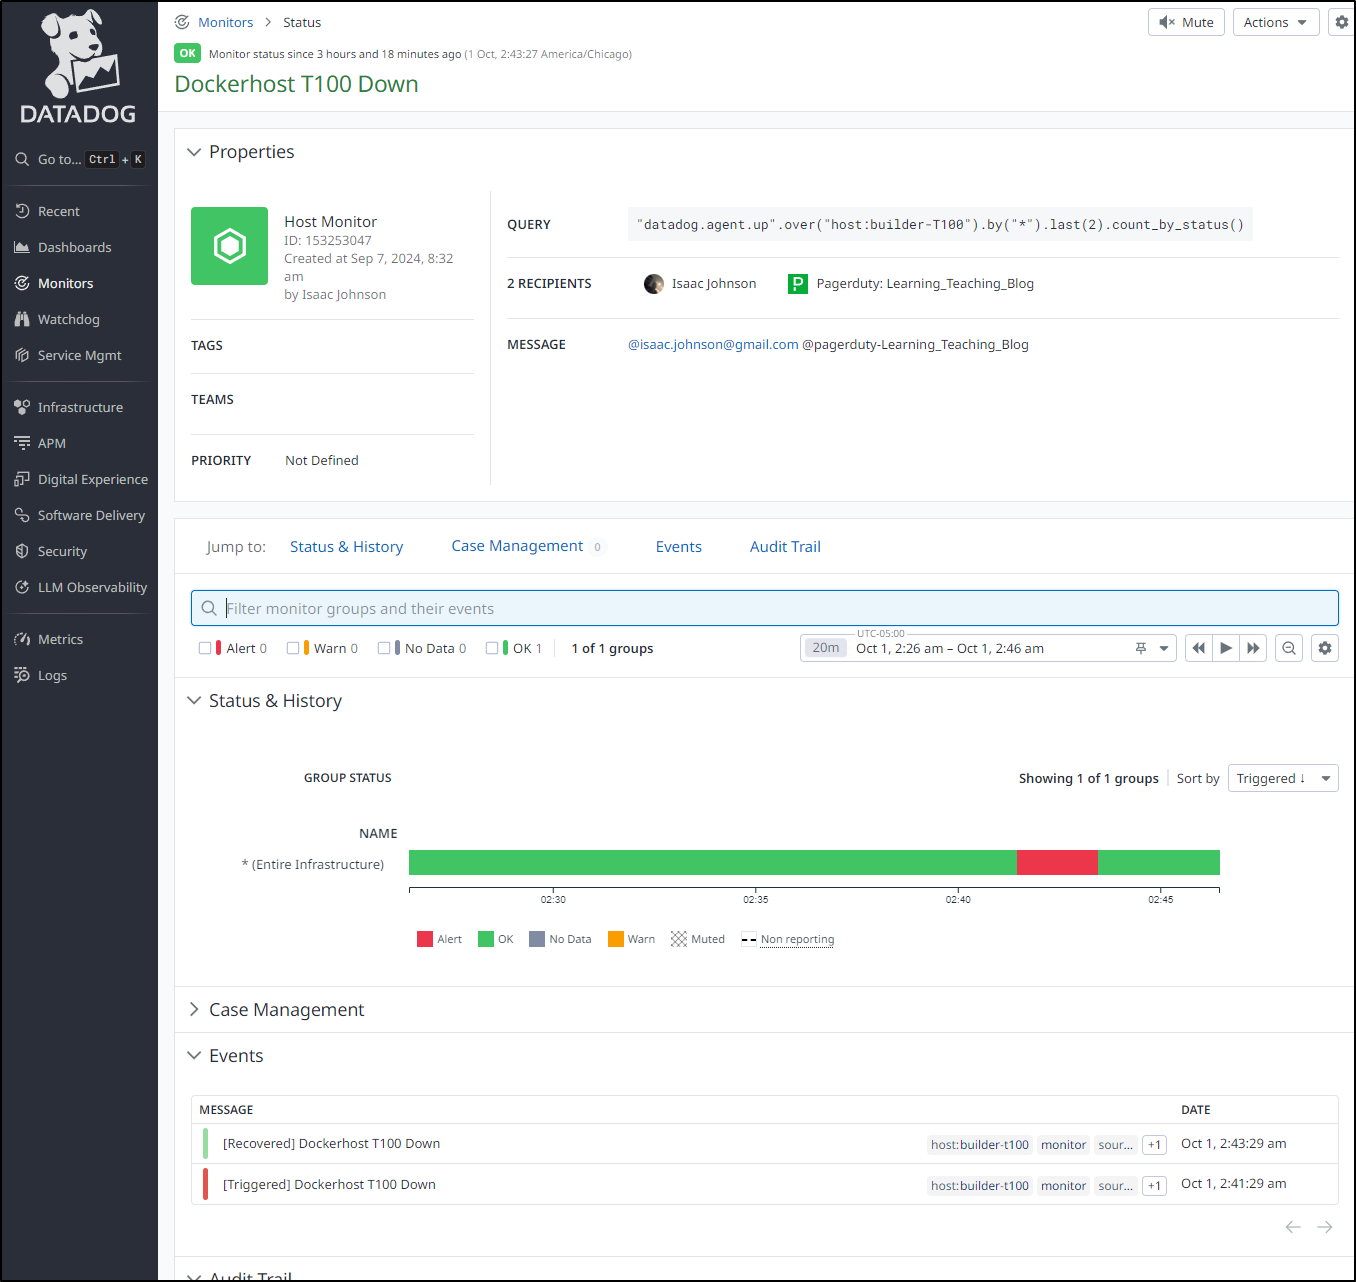
Which showed me a momentary outage (or failure to report from the DD agent) around 2:43a
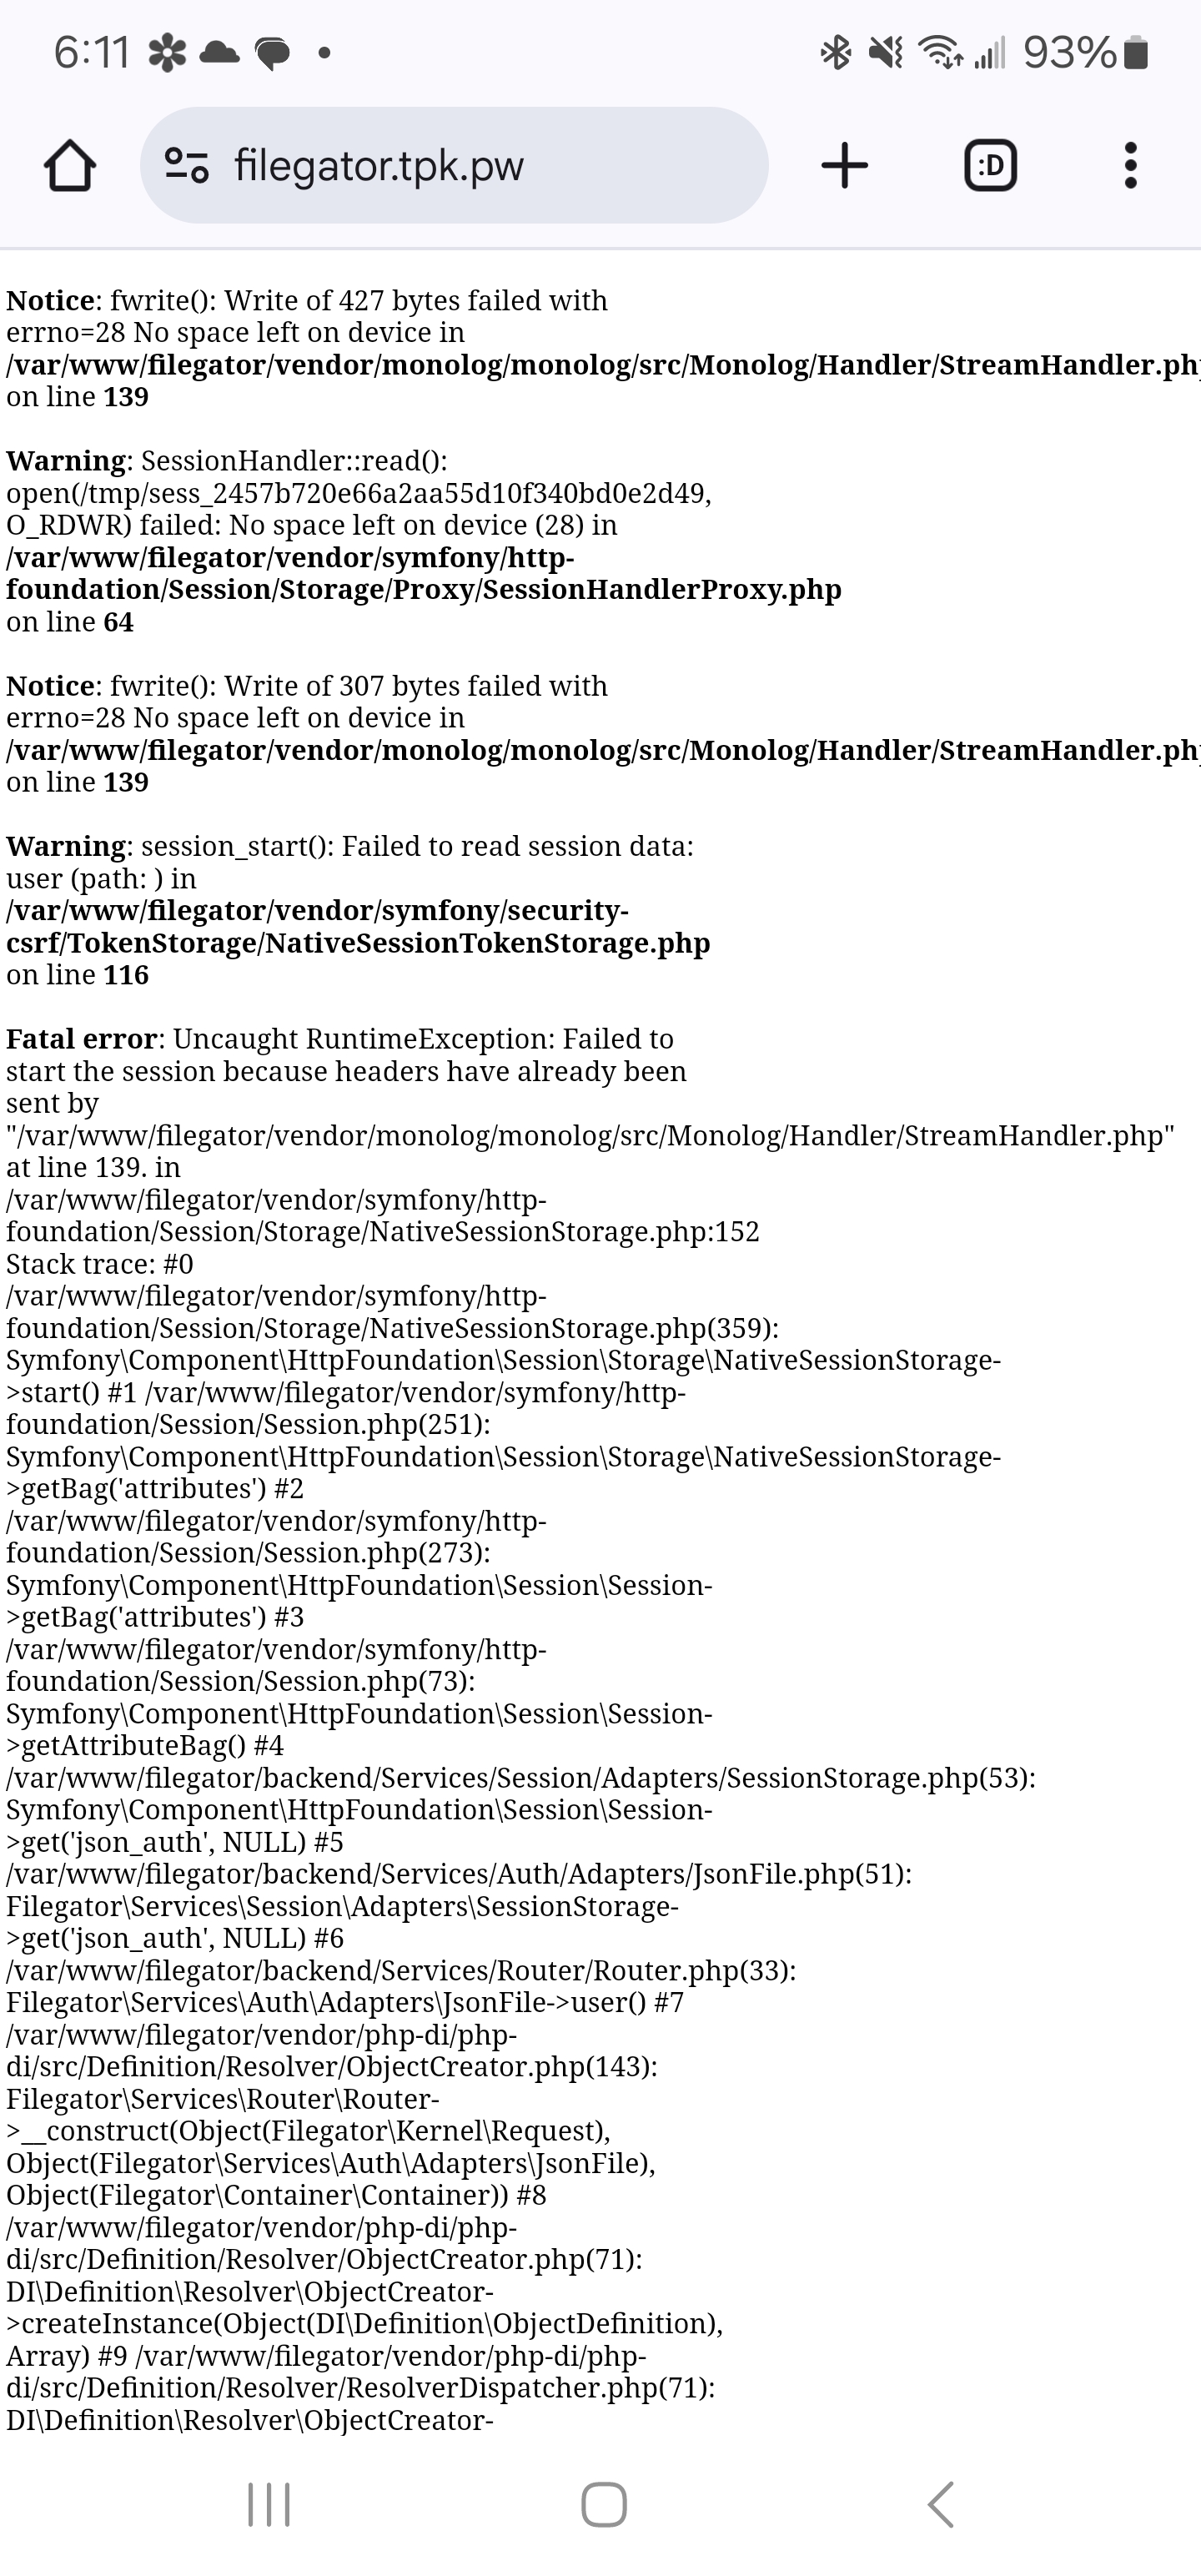
I was convinced I would need to tweak my rule so I started writing this writeup on false positives and retry logic… However, when I went to upload an image to Filegator, I was suddenly clued in to the issue
I jumped back to the terminal and checked disk space
builder@builder-T100:~$ df -h
Filesystem                                      Size  Used Avail Use% Mounted on
tmpfs                                           766M  8.1M  758M   2% /run
/dev/sda2                                       234G  222G     0 100% /
tmpfs                                           3.8G   21M  3.8G   1% /dev/shm
tmpfs                                           5.0M  4.0K  5.0M   1% /run/lock
efivarfs                                        192K   98K   90K  53% /sys/firmware/efi/efivars
/dev/sda1                                       511M  6.1M  505M   2% /boot/efi
192.168.1.116:/volume1/docker-filestation       8.8T  1.4T  7.4T  16% /mnt/filestation
192.168.1.116:/volume1/k3sPrimary01             8.8T  1.4T  7.4T  16% /mnt/sirnasilotk3sprimary01
192.168.1.129:/volume1/postgres-prod-dbbackups  5.5T  2.8T  2.8T  51% /mnt/psqlbackups
192.168.1.129:/volume1/linuxbackups             5.5T  2.8T  2.8T  51% /mnt/linuxbackups
tmpfs                                           766M  104K  766M   1% /run/user/1000
shm                                              64M     0   64M   0% /var/snap/microk8s/common/run/containerd/io.containerd.grpc.v1.cri/sandboxes/3101a3ad60188dc1a8321e996843601932b6be5e73854206678e62565a69b948/shm
shm                                              64M     0   64M   0% /var/snap/microk8s/common/run/containerd/io.containerd.grpc.v1.cri/sandboxes/07851b89301029156e652729af347514e00afe2c2d7886b75c1ad528fd0838ac/shm
shm                                              64M     0   64M   0% /var/snap/microk8s/common/run/containerd/io.containerd.grpc.v1.cri/sandboxes/31276e3ae6ca90ab18bd862f2c5a630fc254a2f7c83308454b2cbbc19df1115e/shm
shm                                              64M     0   64M   0% /var/snap/microk8s/common/run/containerd/io.containerd.grpc.v1.cri/sandboxes/8f15ea5a233ddddc4584917e57747628425226ad11c2fa263a06d62fa631914f/shm
Darf! It has run out of space!
My usual step is to first start with some du commands to see if I can find the bad egg
builder@builder-T100:~$ sudo du -chs /*
0       /bin
275M    /boot
4.0K    /cdrom
16K     /dev
32M     /etc
123G    /home
0       /lib
0       /lib32
0       /lib64
0       /libx32
16K     /lost+found
4.0K    /media
3.3G    /mnt
2.9G    /opt
du: cannot read directory '/proc/26193/task/26193/net': Invalid argument
du: cannot read directory '/proc/26193/net': Invalid argument
du: cannot access '/proc/327122/task/327122/fd/4': No such file or directory
du: cannot access '/proc/327122/task/327122/fdinfo/4': No such file or directory
du: cannot access '/proc/327122/fd/3': No such file or directory
du: cannot access '/proc/327122/fdinfo/3': No such file or directory
du: cannot read directory '/proc/544309/task/544309/net': Invalid argument
du: cannot read directory '/proc/544309/net': Invalid argument
du: cannot read directory '/proc/546520/task/546520/net': Invalid argument
du: cannot read directory '/proc/546520/net': Invalid argument
0       /proc
49M     /root
8.2M    /run
0       /sbin
9.3G    /snap
4.0K    /srv
2.1G    /swapfile
0       /sys
11M     /tmp
8.0G    /usr
du: fts_read failed: /var/lib/docker/overlay2/7c82c2381db28d47332041e2d899e82b83b45dafa94e17b1c2501c8b5b166160/merged: No such file or directory
176G    total
At that same time, I checked /var/log which is often a culprit and low-hanging-fruit to clean (but the only large file was the journal)
builder@builder-T100:/var/log$ du -chs ./* 2>&1 | tail -n1
4.4G    total
I just kept diving in looking to find my waste/cause
builder@builder-T100:/home$ sudo du -chs ./*
121G    ./builder
1.7G    ./linuxbrew
8.0K    ./node
123G    total
builder@builder-T100:/home$ cd builder
builder@builder-T100:~$ sudo du -chs ./*
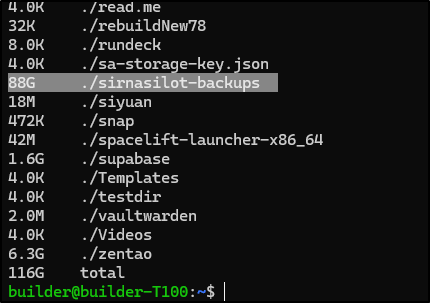
That’s when it jumped out
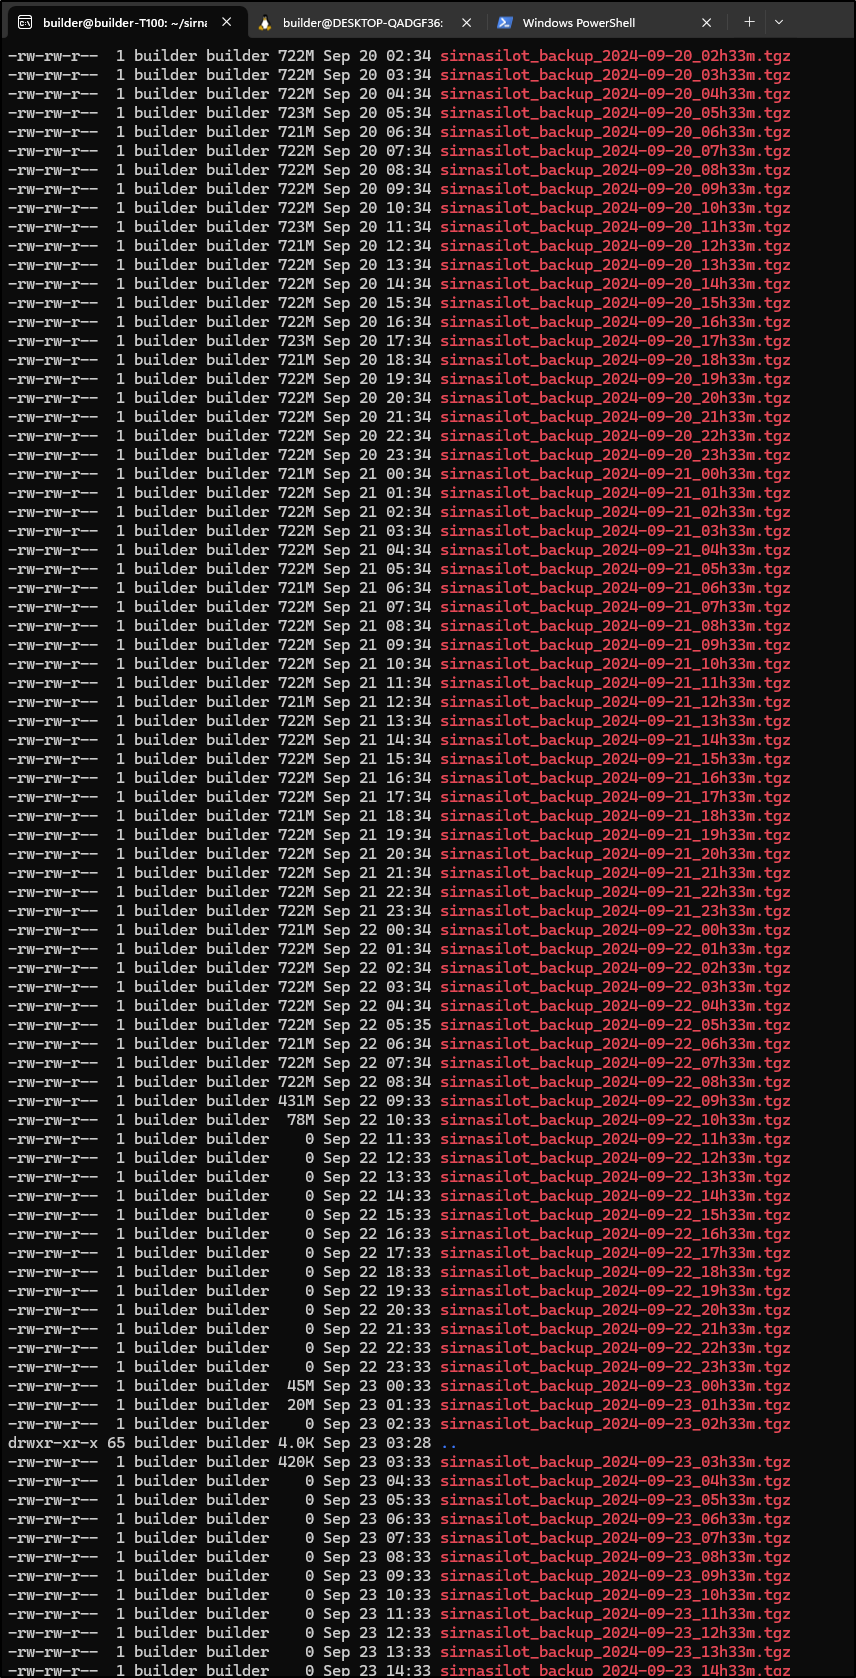
What was I thinking? A once per hour backup with no cleanup?!?!
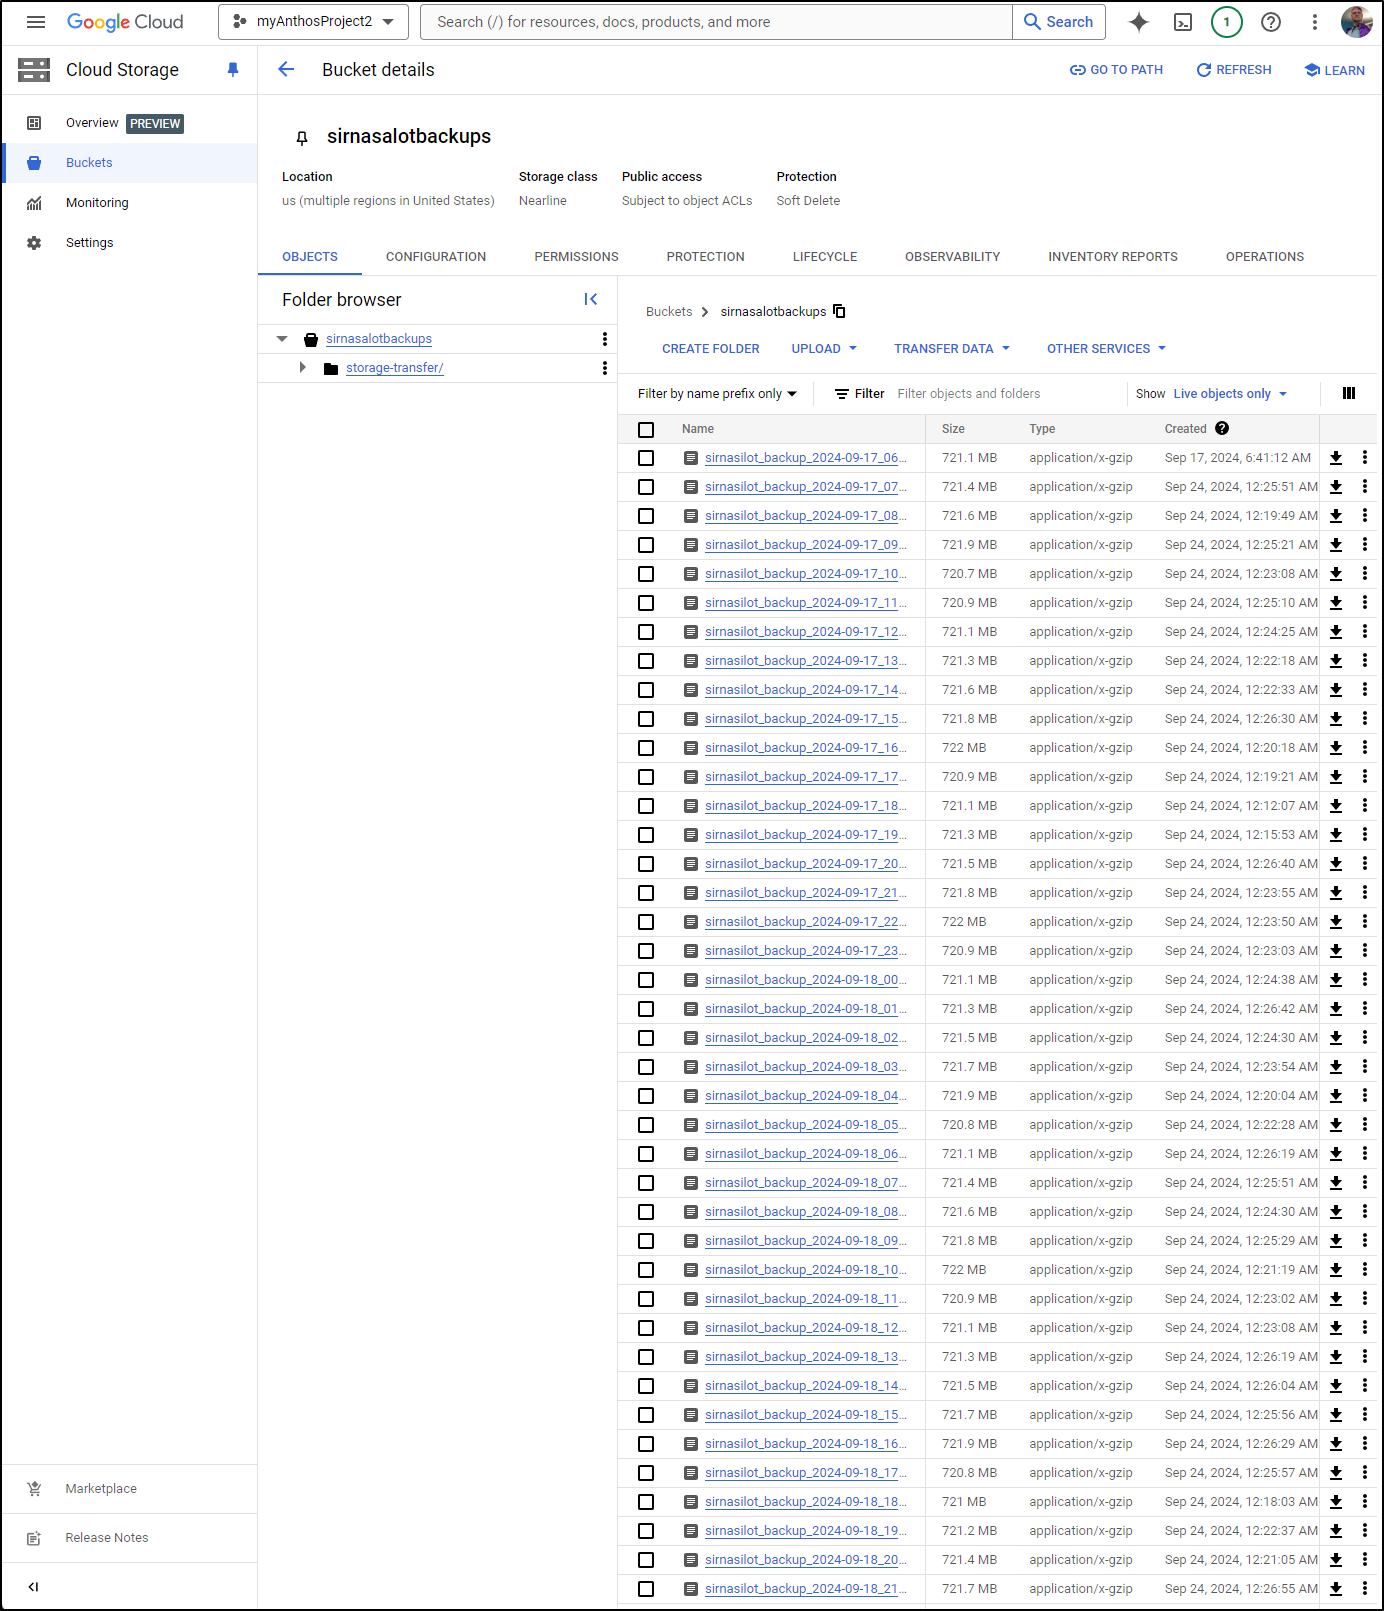
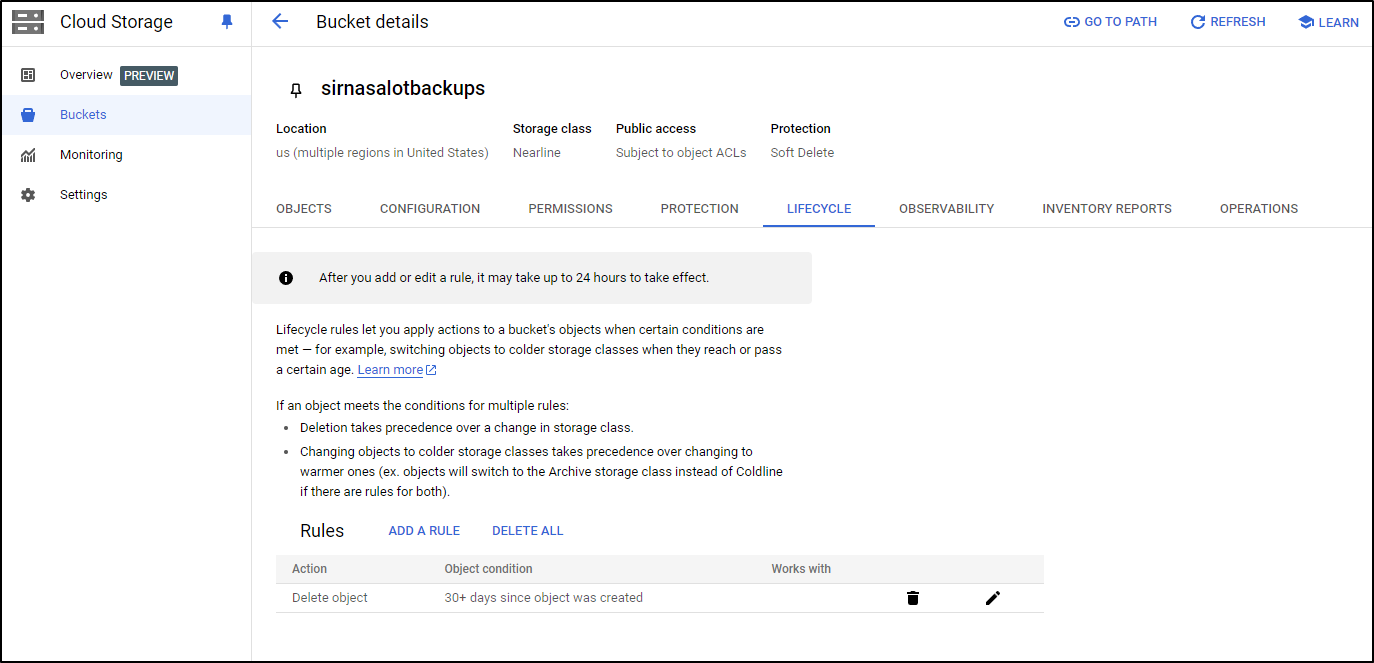
I immediately checked GCP - yes, I was keeping all of them
Though, thankfully I had a 30d delete rule so there was an upper limit in place
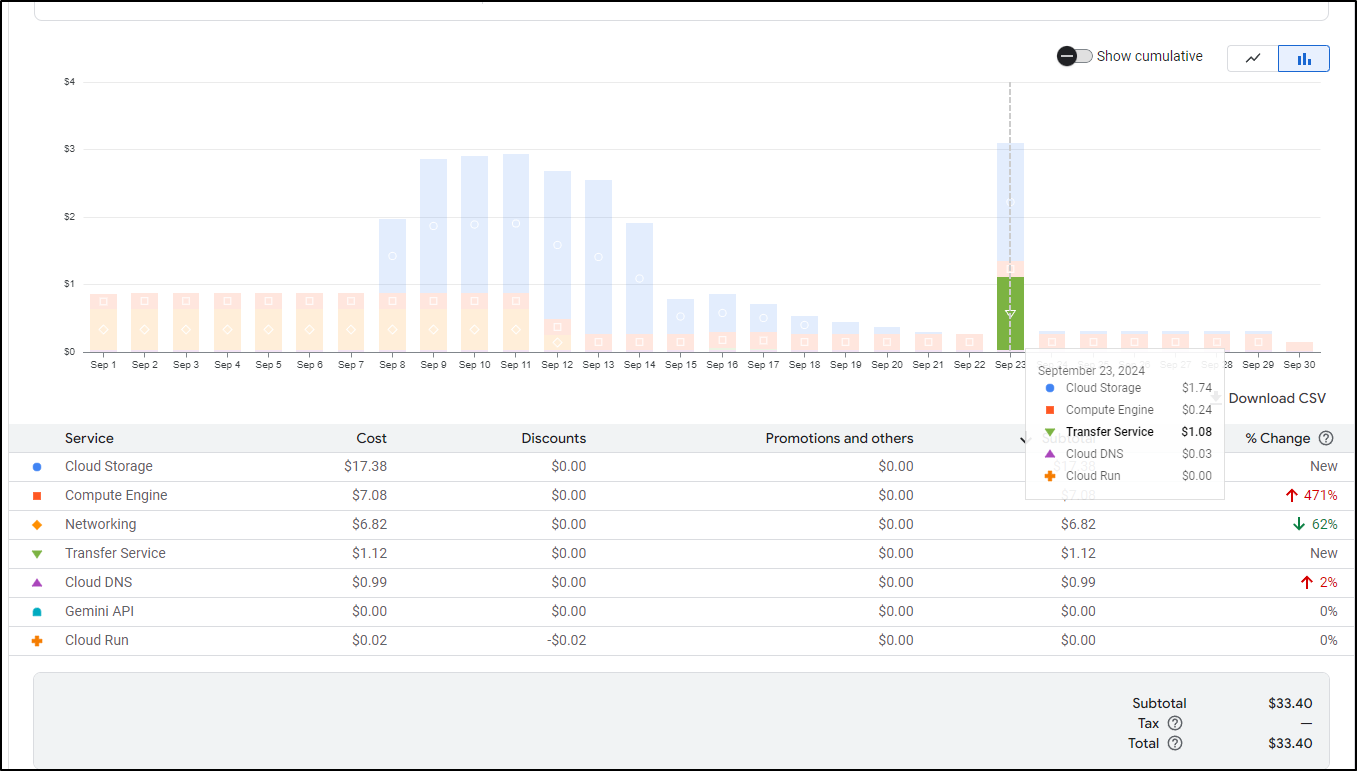
While I had an initial spike around Sept 23rd, I really haven’t been paying much extra since – That is, no GCP Budget spikes (which was my first worry)
Fixing
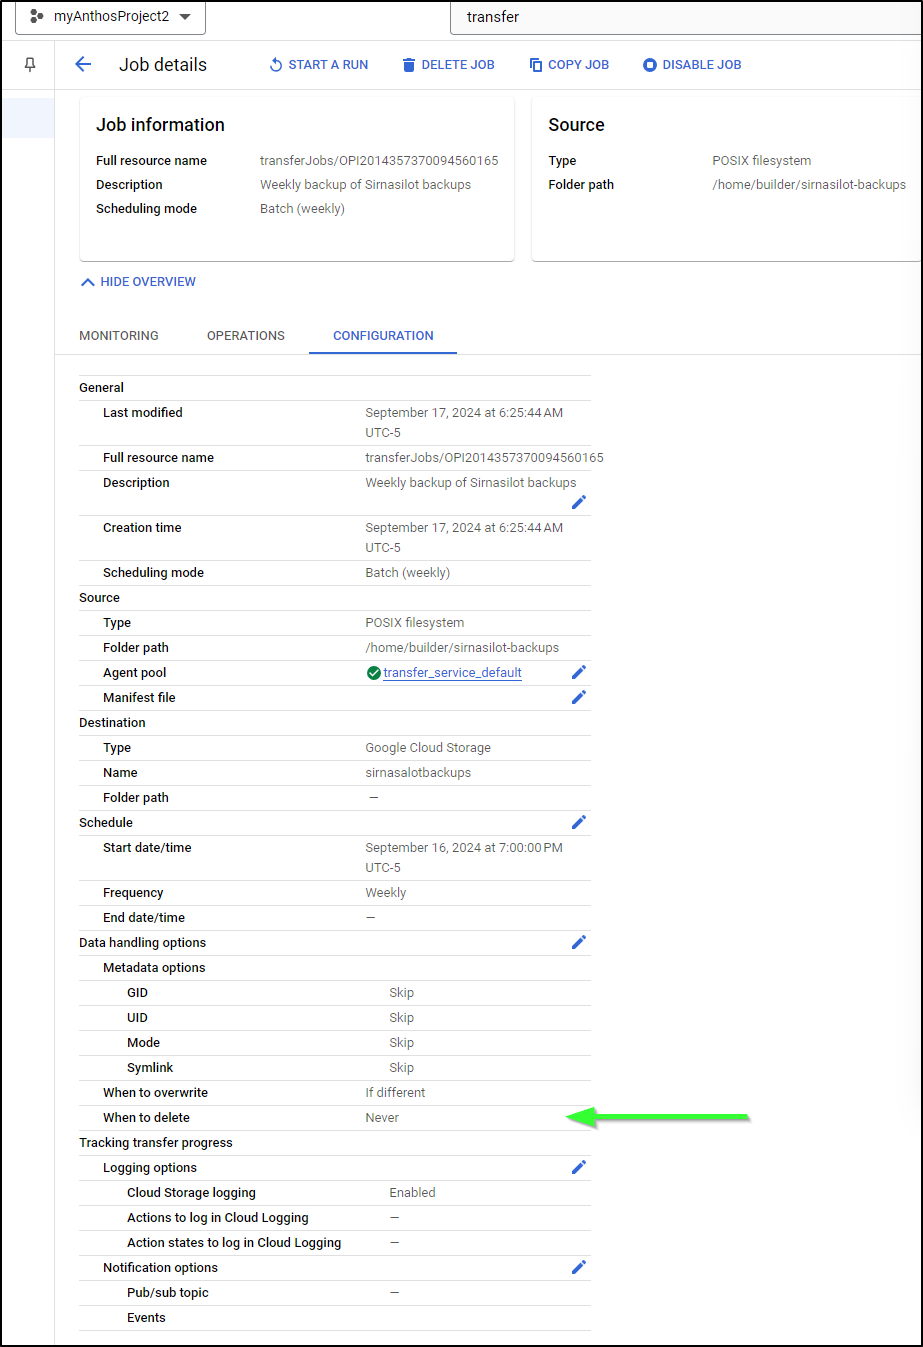
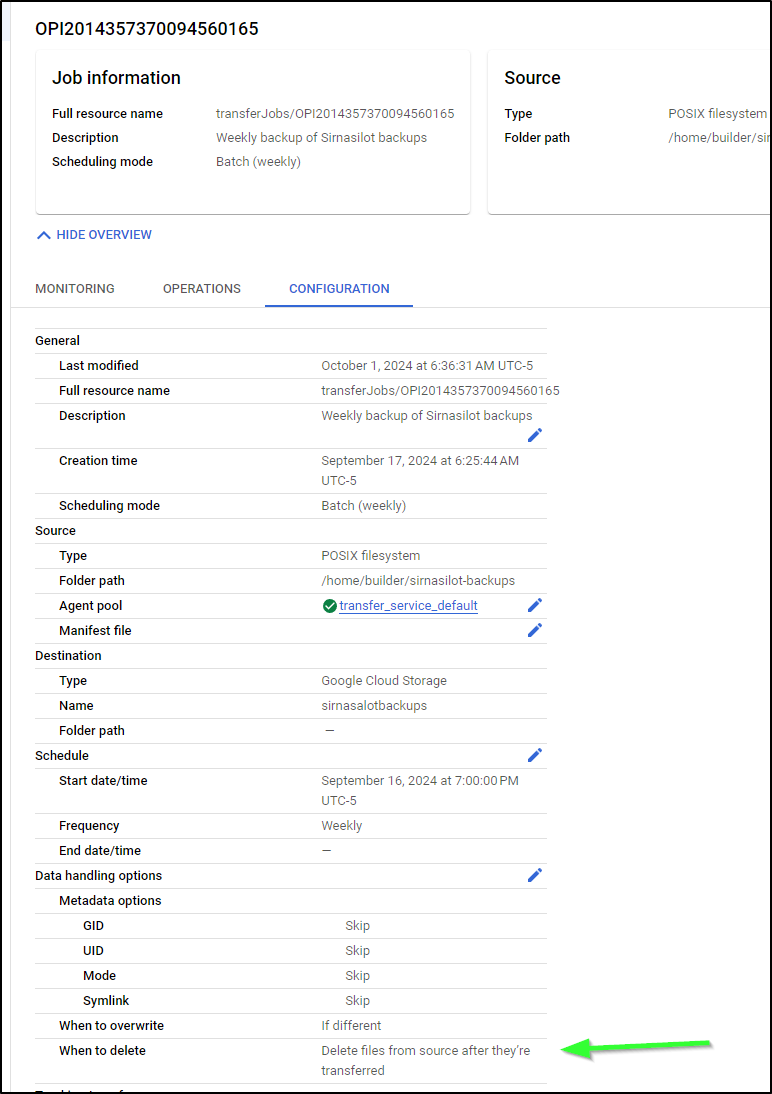
First, let’s confirm our Data Transfer service job
Indeed, it is set to weekly starting Sept 16th. And key to note is that it’s not set to delete if I cleanup the source:
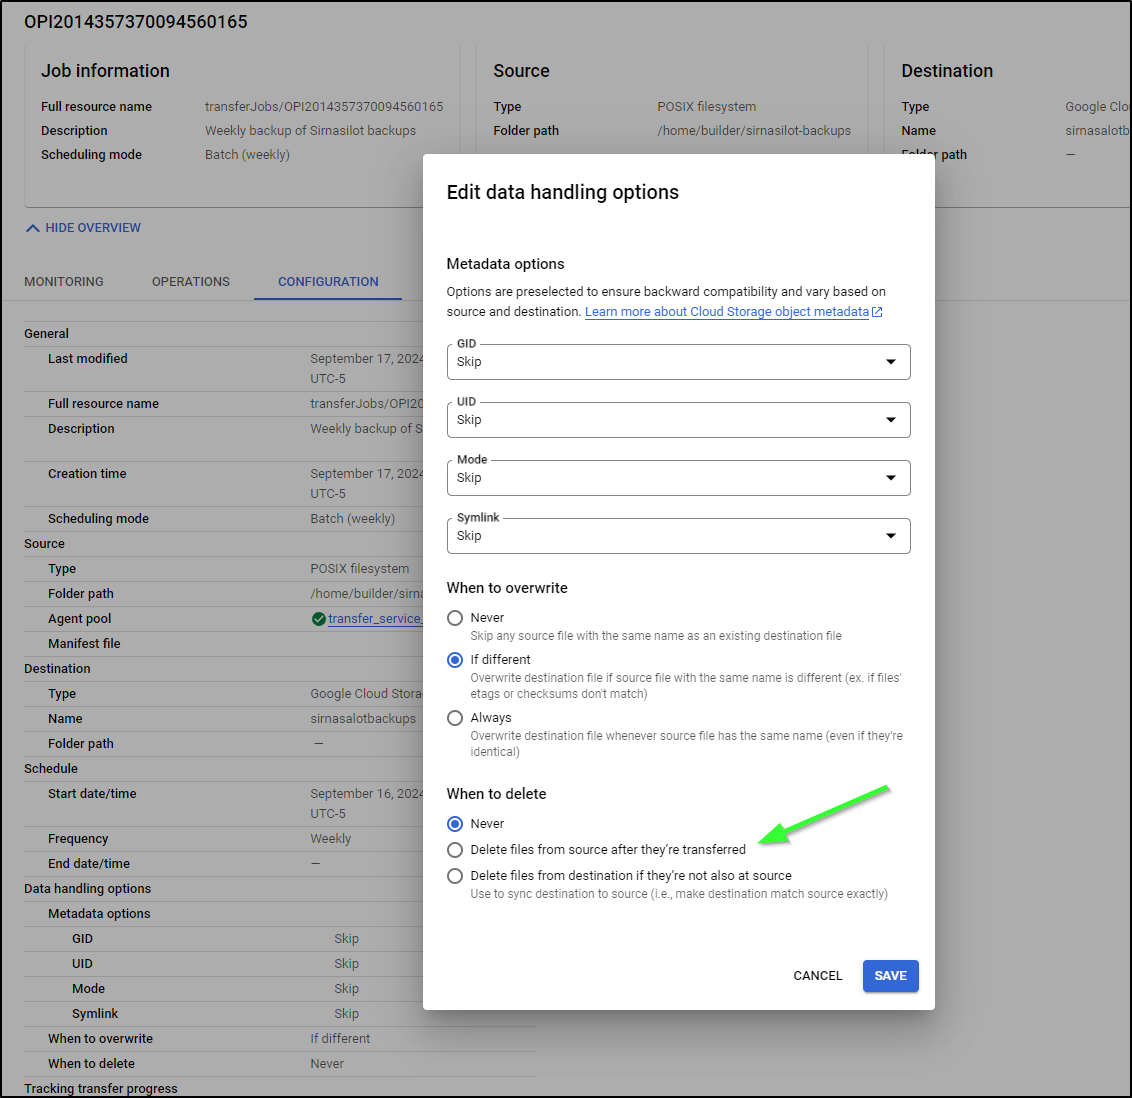
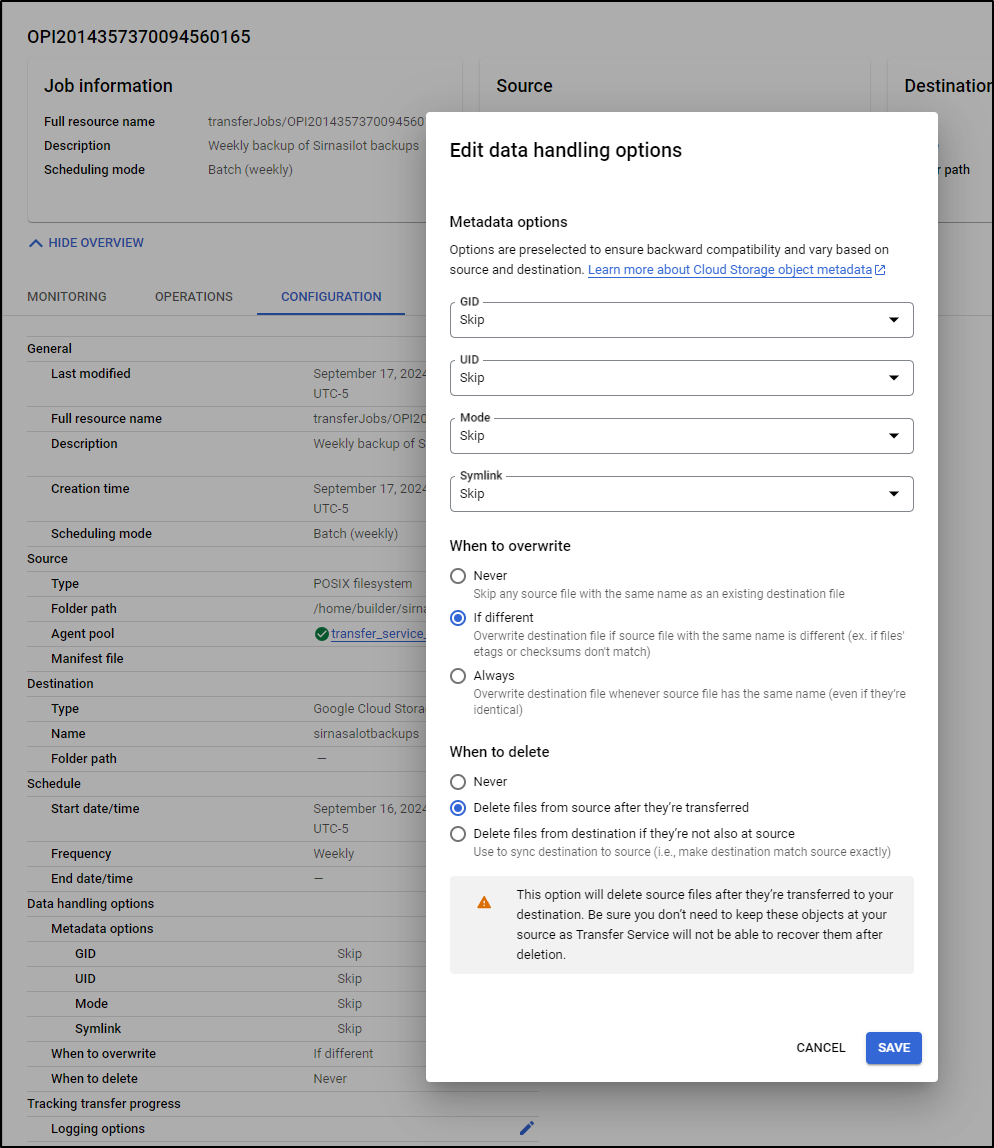
There are two ways we could solve this - first, we could have DTS/STS delete the file after transfer:
However, if there is any reason DTS does not run, we’ll fill up again.
The real issue here was/is hourly backups
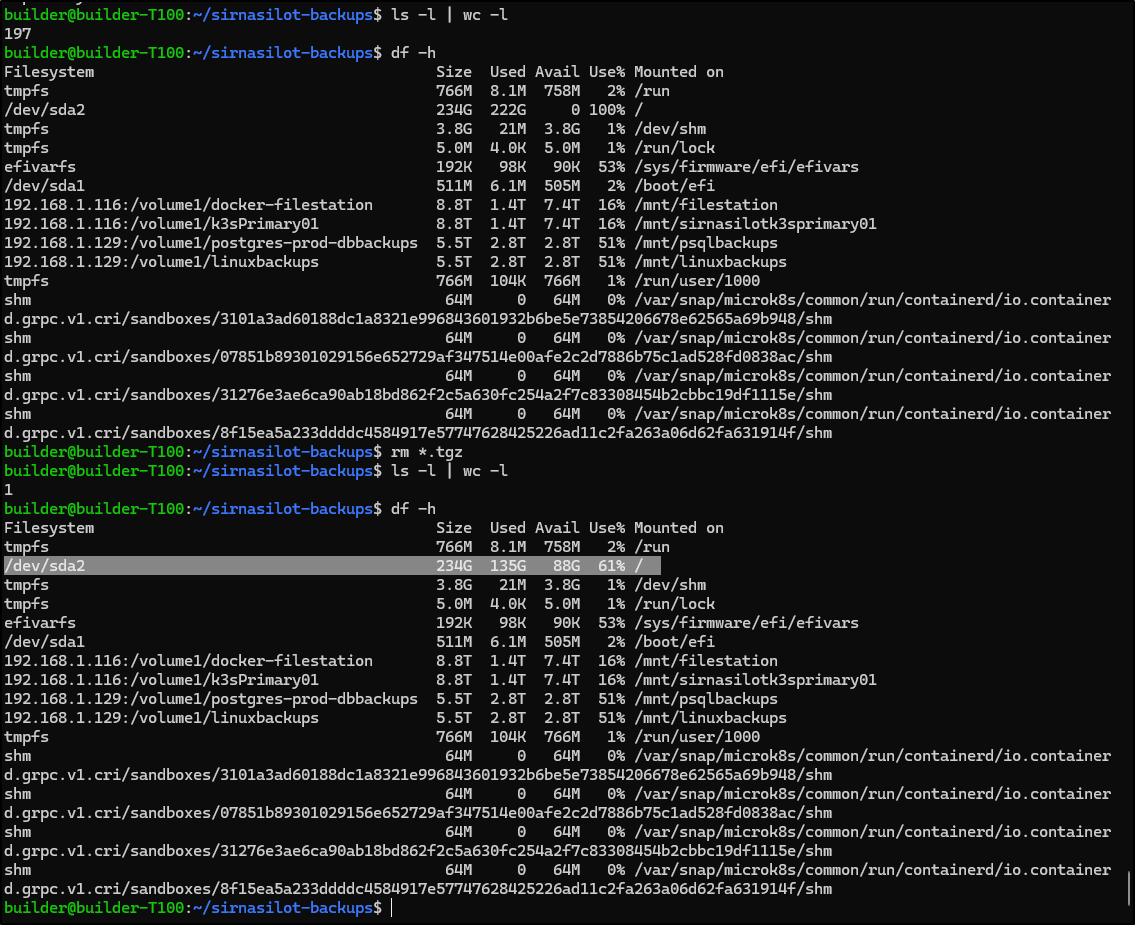
builder@builder-T100:~/sirnasilot-backups$ ls -l | wc -l
197

builder@builder-T100:~/sirnasilot-backups$ crontab -l
@reboot /sbin/swapoff -a
45 3 * * * tar -zcvf /mnt/filestation/vaultbackups.$(date '+\%Y-\%m-\%d_\%Hh\%Mm').tgz /home/builder/vaultwarden/data
16 6 * * * tar -zcvf /mnt/filestation/filegator.$(date '+\%Y-\%m-\%d_\%Hh\%Mm').tgz /home/builder/filegator/repository2
33 * * * * tar -czf /home/builder/sirnasilot-backups/sirnasilot_backup_$(date '+\%Y-\%m-\%d_\%Hh\%Mm').tgz /mnt/sirnasilotk3sprimary01
that never should have been 33 * * * * as that makes them 33m past the hour – thus 24 files a day.
Knowing that I already have the backups in GCP buckets, I first remediated the real start of our issues and wiped the existing tgz files
That remediated the first issue. I then set it the backup cron to a more reasonable daily
builder@builder-T100:~/sirnasilot-backups$ crontab -l
@reboot /sbin/swapoff -a
45 3 * * * tar -zcvf /mnt/filestation/vaultbackups.$(date '+\%Y-\%m-\%d_\%Hh\%Mm').tgz /home/builder/vaultwarden/data
16 6 * * * tar -zcvf /mnt/filestation/filegator.$(date '+\%Y-\%m-\%d_\%Hh\%Mm').tgz /home/builder/filegator/repository2
33 3 * * * tar -czf /home/builder/sirnasilot-backups/sirnasilot_backup_$(date '+\%Y-\%m-\%d_\%Hh\%Mm').tgz /mnt/sirnasilotk3sprimary01
Lastly, I decided to set the STS job to cleanup when done.
Which we can now see
I did a quick check of any crashed containers on the Docker host, but that which is up should be and that which is off should be.
builder@builder-T100:~/sirnasilot-backups$ docker ps -a
CONTAINER ID   IMAGE                                                            COMMAND                   CREATED         STATUS                      PORTS                                                                                                                                                      NAMES
829f99ee3609   gcr.io/cloud-ingest/tsop-agent:latest                            "python3 ./autoupdat…"    2 weeks ago     Up 2 weeks                                                                                                                                                                             adoring_solomon
0c60f77715b2   mbixtech/observium:23.9                                          "/usr/bin/supervisor…"    2 weeks ago     Up 2 weeks                  0.0.0.0:8078->80/tcp, :::8078->80/tcp                                                                                                                      observium-app-1
43404004ce8c   mariadb:10.6.4                                                   "docker-entrypoint.s…"    2 weeks ago     Up 2 weeks                  3306/tcp
                                                                        observium-db-1
7bac56d1c497   filegator/filegator                                              "docker-php-entrypoi…"    3 weeks ago     Up 2 weeks                  80/tcp, 0.0.0.0:7098->8080/tcp, :::7098->8080/tcp
                                                                        funny_banzai
1f0337971b9f   otel/opentelemetry-collector-contrib                             "/otelcol-contrib --…"    6 weeks ago     Exited (255) 4 weeks ago    55678-55679/tcp, 0.0.0.0:55681->55681/tcp, :::55681->55681/tcp, 0.0.0.0:54317->4317/tcp, :::54317->4317/tcp, 0.0.0.0:54318->4318/tcp, :::54318->4318/tcp   opentelemetry-collector
810a2c05f761   docmost/docmost:latest                                           "docker-entrypoint.s…"    2 months ago    Exited (1) 2 months ago
                                                                        docmost-docmost-1
66fc44ec76fa   postgres:16-alpine                                               "docker-entrypoint.s…"    2 months ago    Exited (0) 2 months ago
                                                                        docmost-db-1
44345e8c762f   redis:7.2-alpine                                                 "docker-entrypoint.s…"    2 months ago    Exited (0) 2 months ago

... snip ...
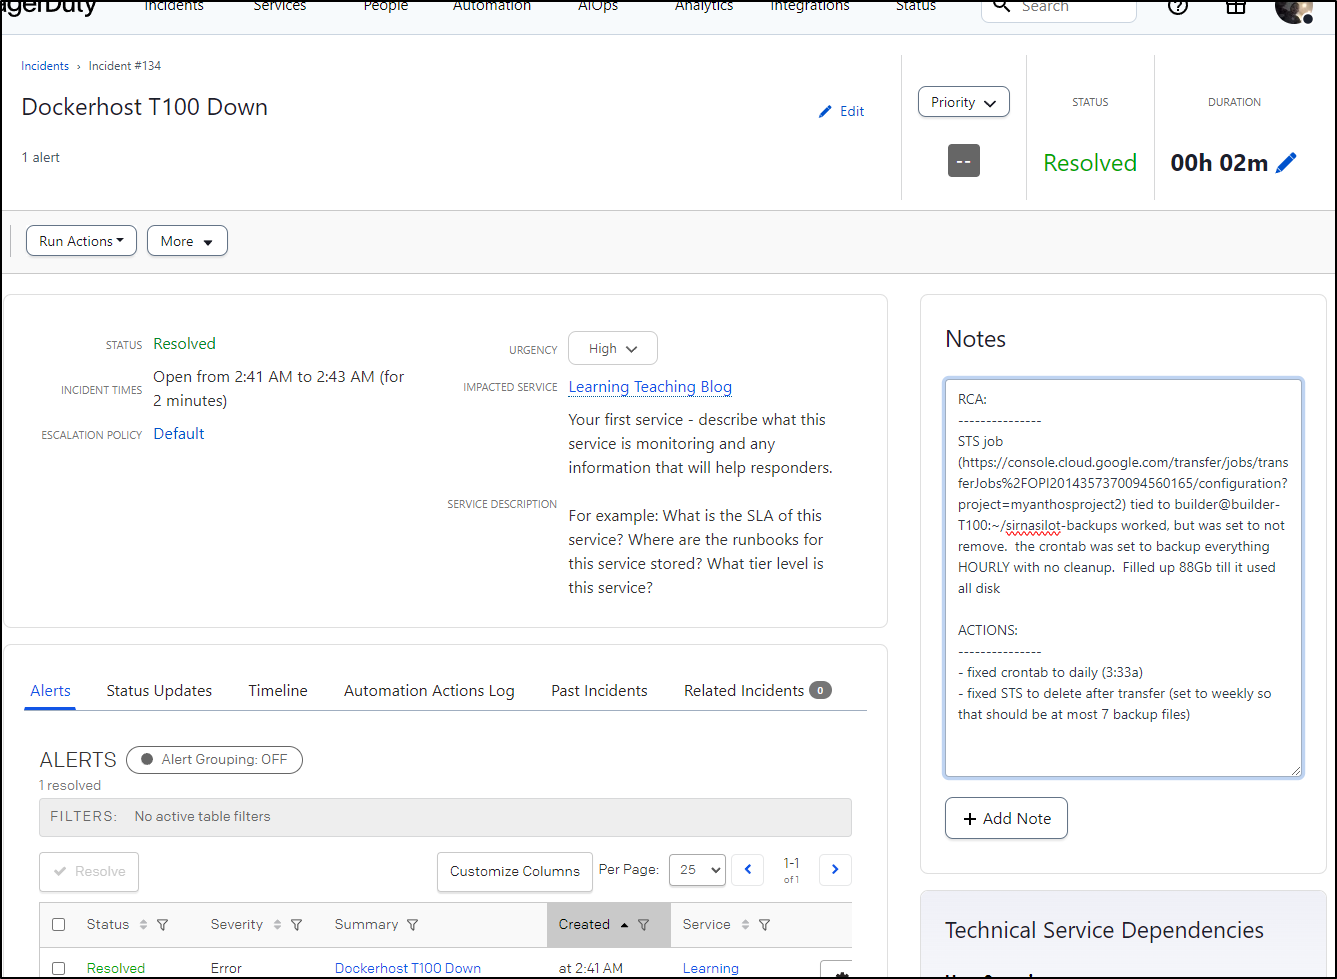
My last bit of cleanup is to make a note in PagerDuty as to why I had this, just for my own memory (The SRE term is an RCA)
And then turn off my desk alert
builder@builder-T100:~/sirnasilot-backups$ curl -X GET "https://kasarest.freshbrewed.science/off?devip=192.168.1.24&type=plug&apikey=$APIKEY"
<h1>Turning Off 192.168.1.24: Param plug
Param 192.168.1.24
Param off
Turning off OfficeLamp
Run from script
</h1>
(sorry there is no video.. but i did get a satifying little click as the Kasa plug clicked off and my modified boat trailer light went dark).
Datadog disk check
I should have been alerted to this much sooner. Seems like a really simple miss.
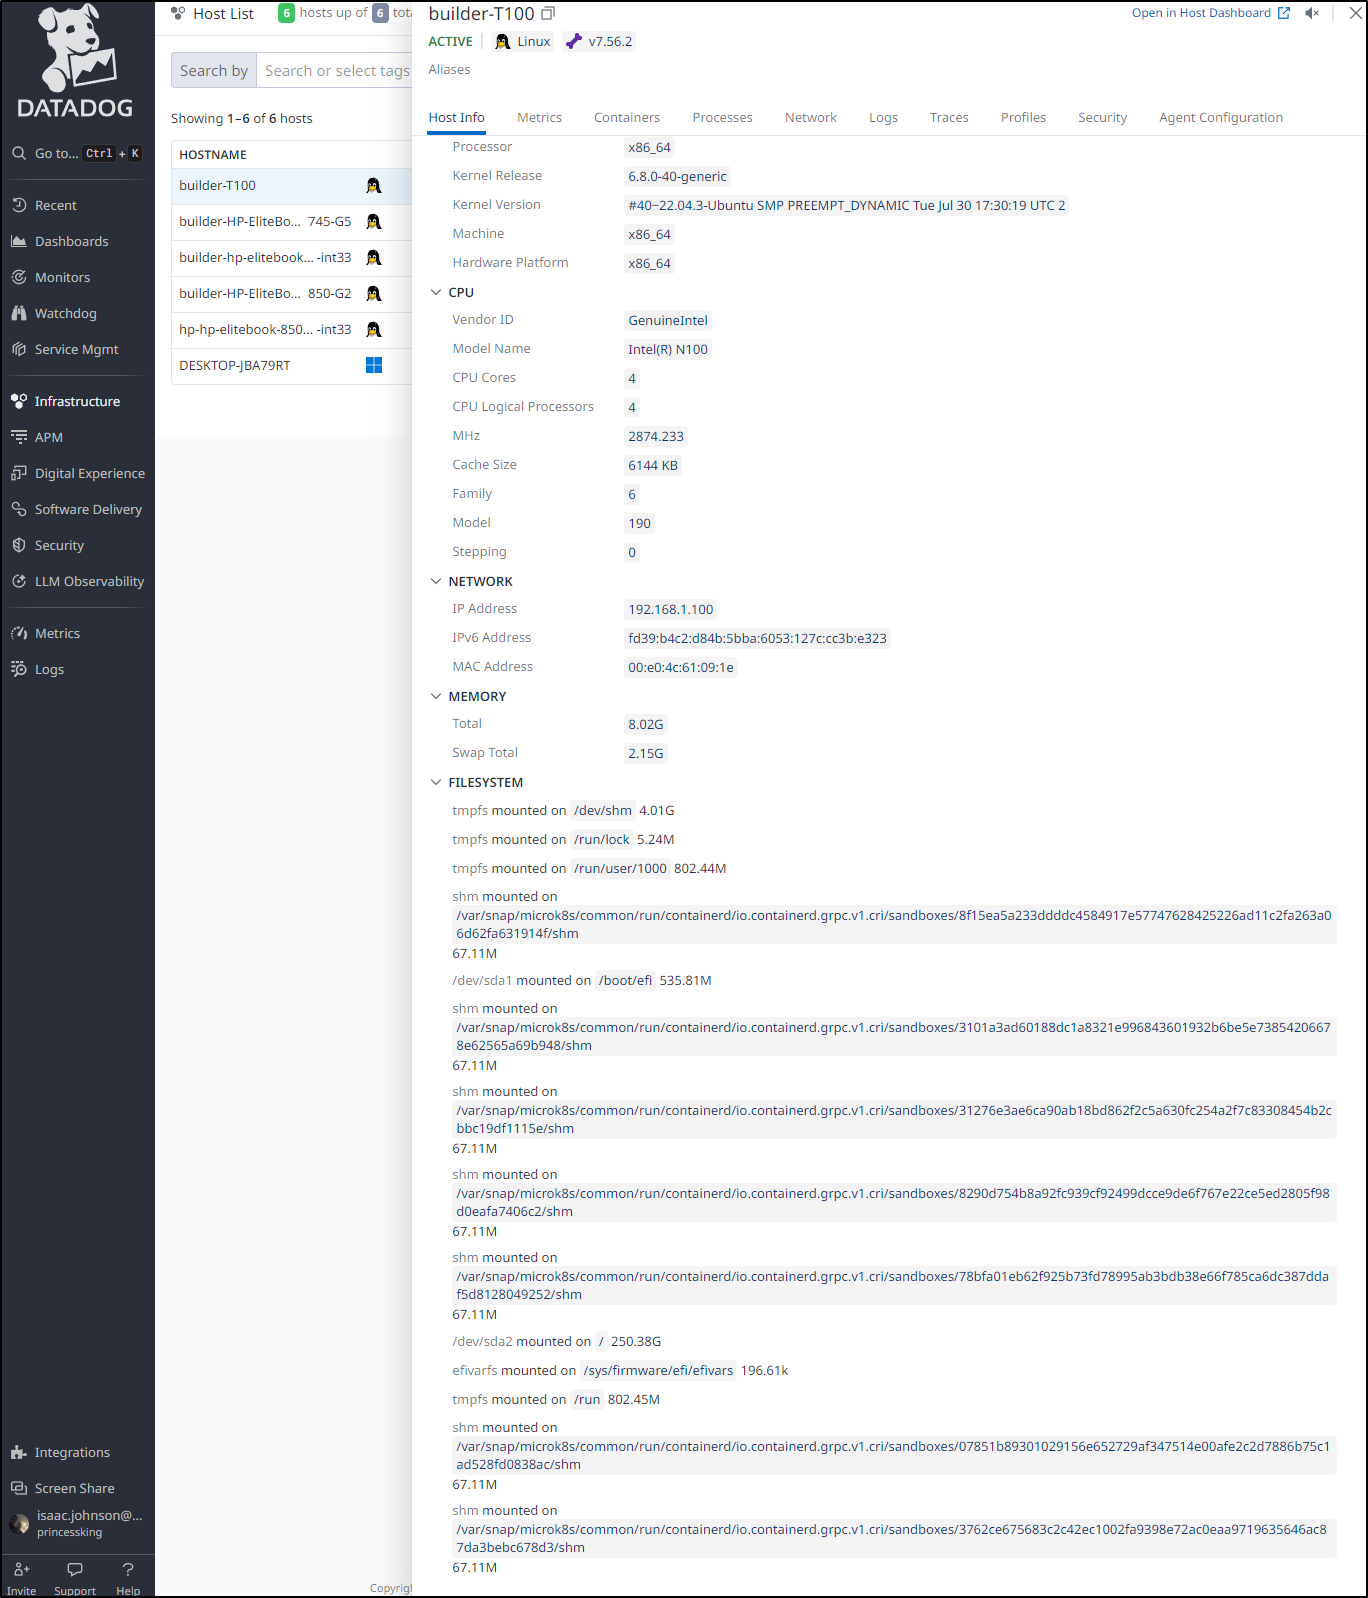
I can see Datadog knows about my volumes
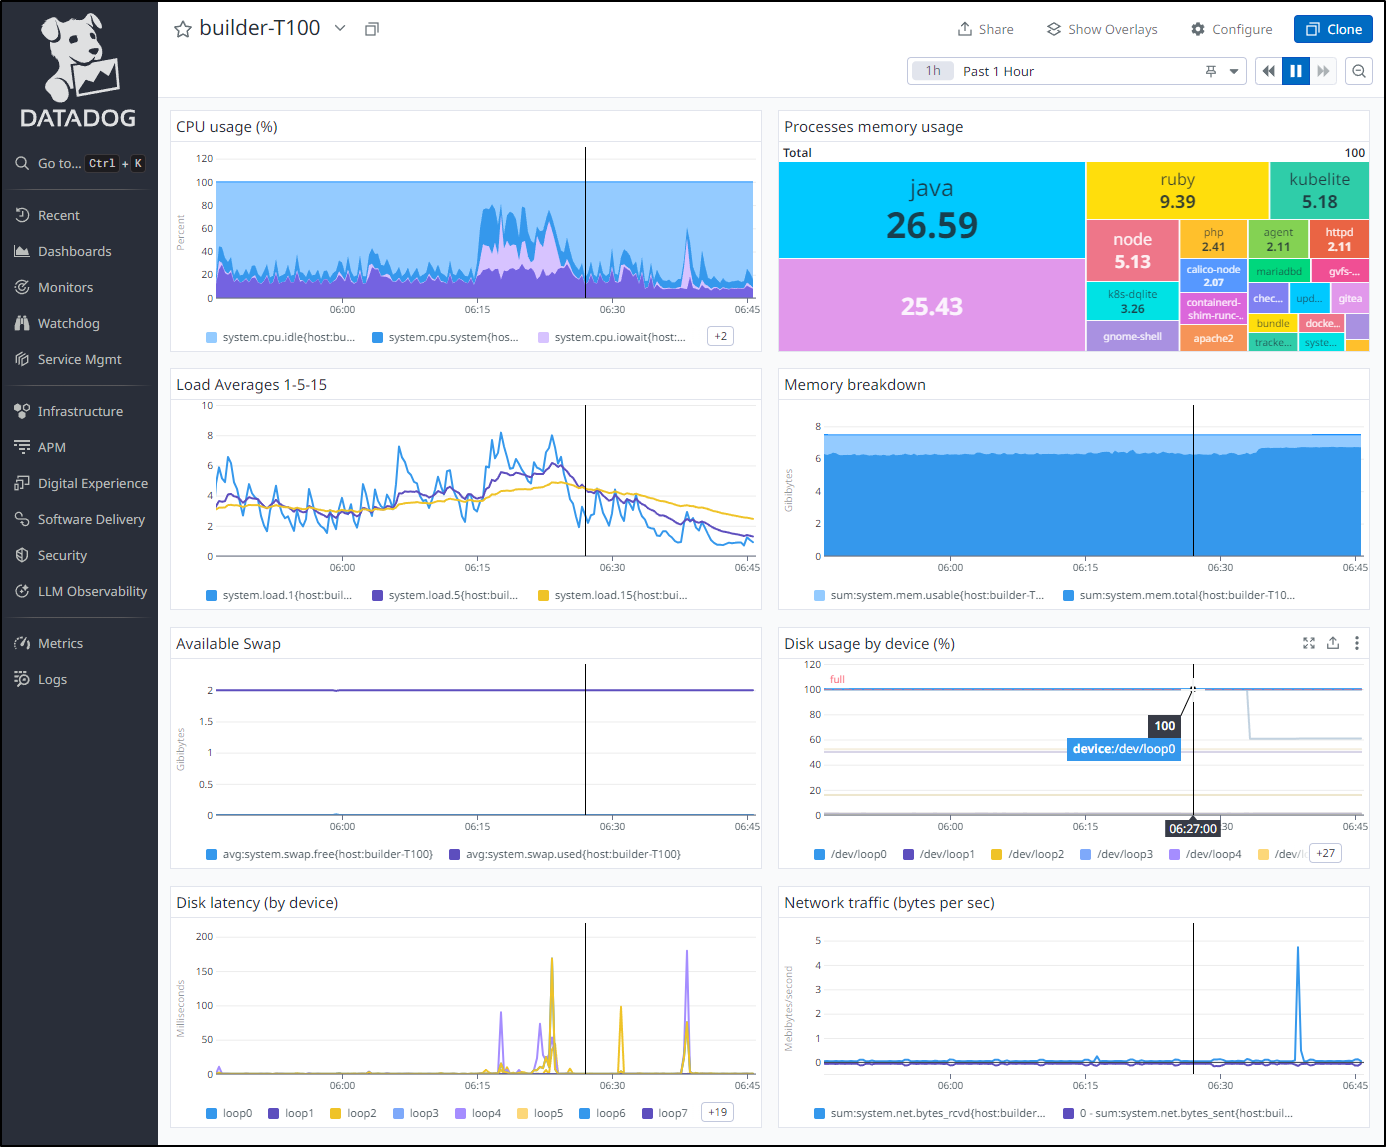
If we open it in the Host dashboard, we can clearly see it filled up (and is now a bit better)
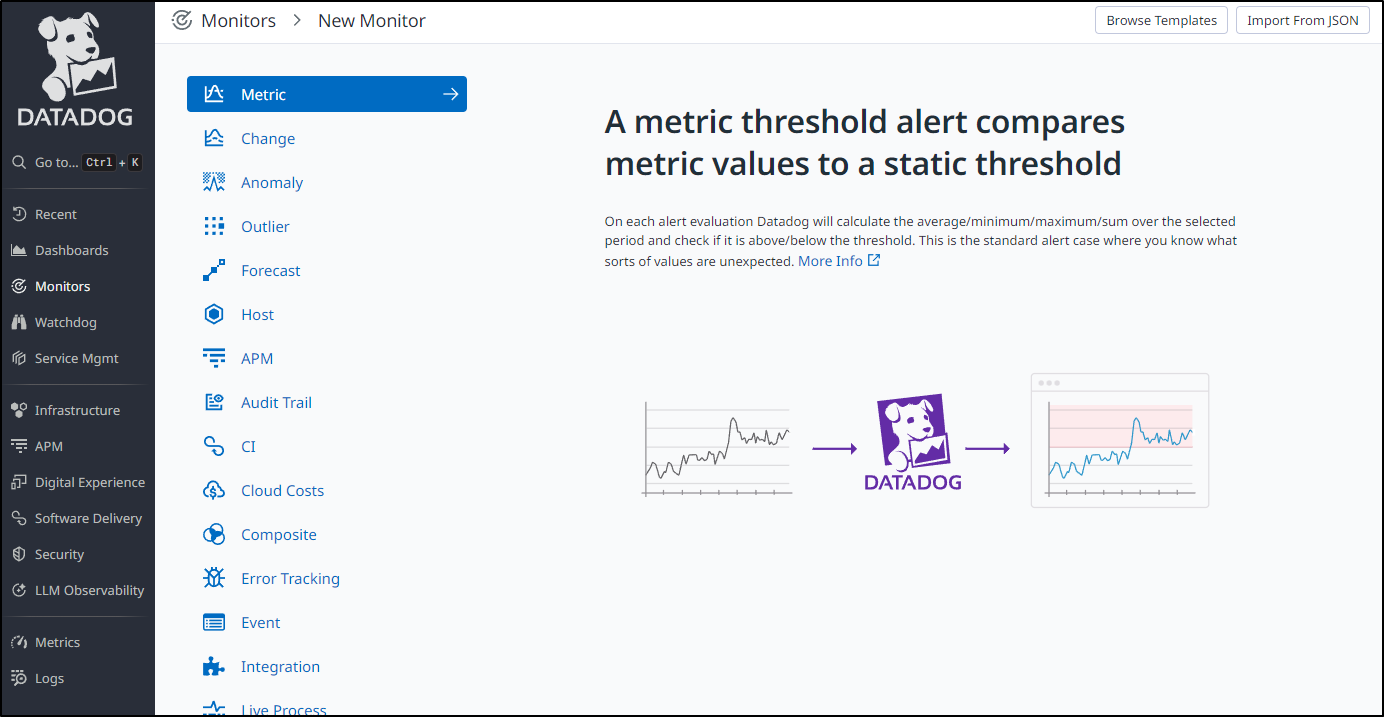
I’ll go to monitors and make a new Metric monitor
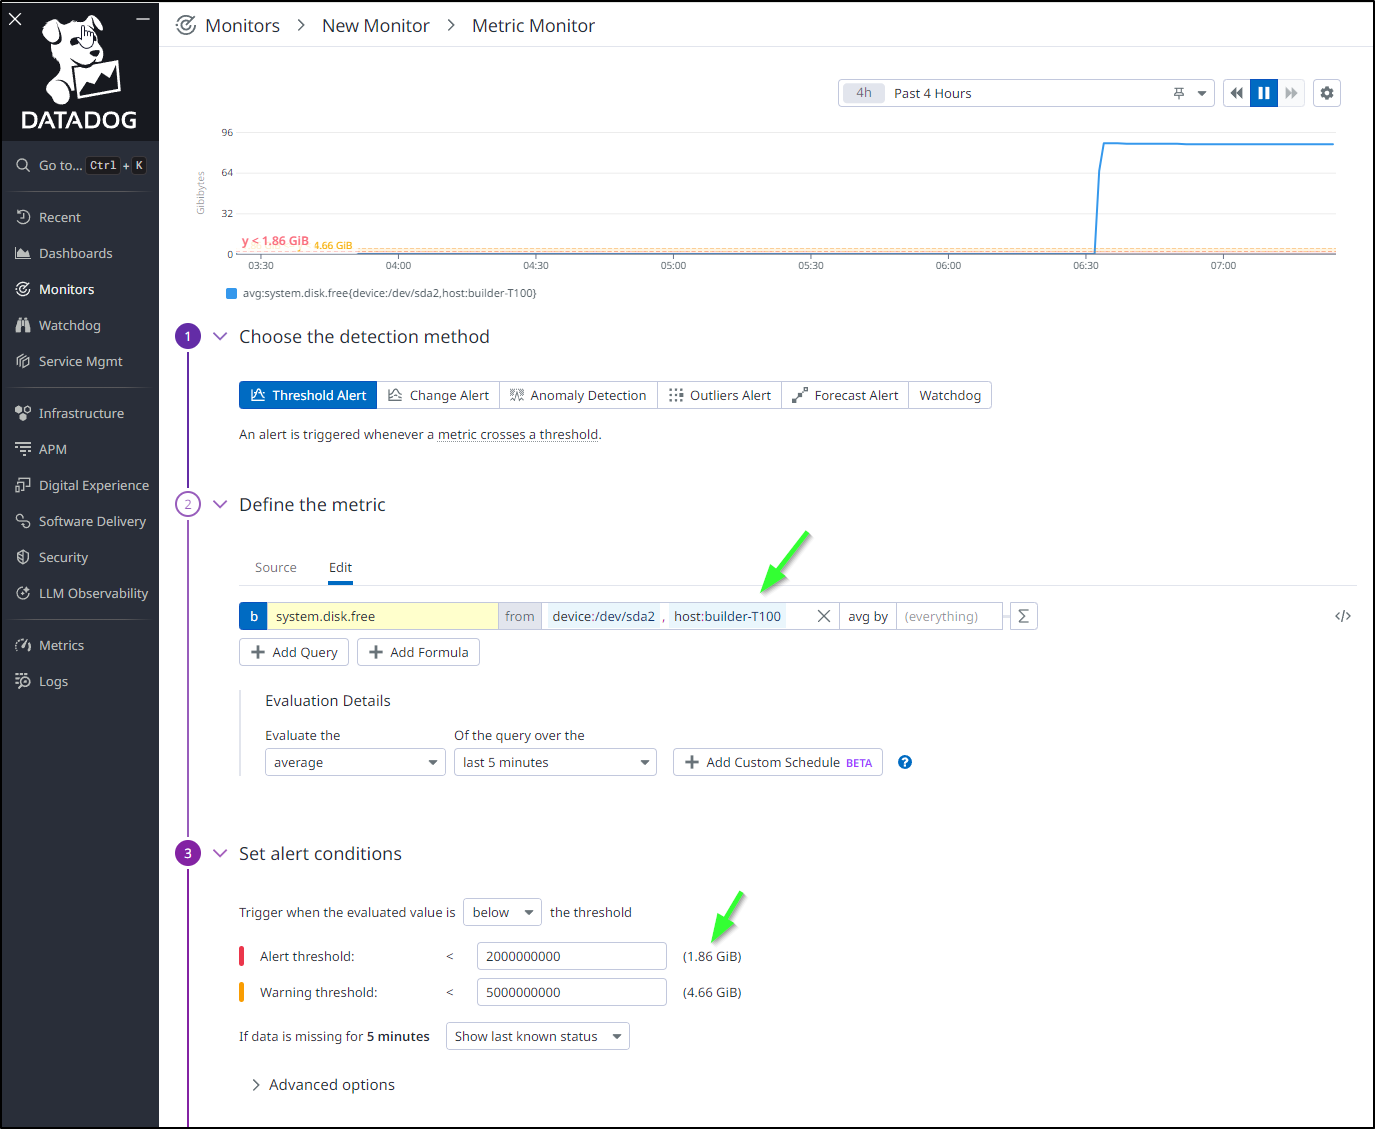
Note that I’m looking at a particular drive with the limiter on the hostname (first green arrow) and that the alert and warning thresholds are in Bytes (second arrow) so you have to use rather larger integers to create thresholds for GiB
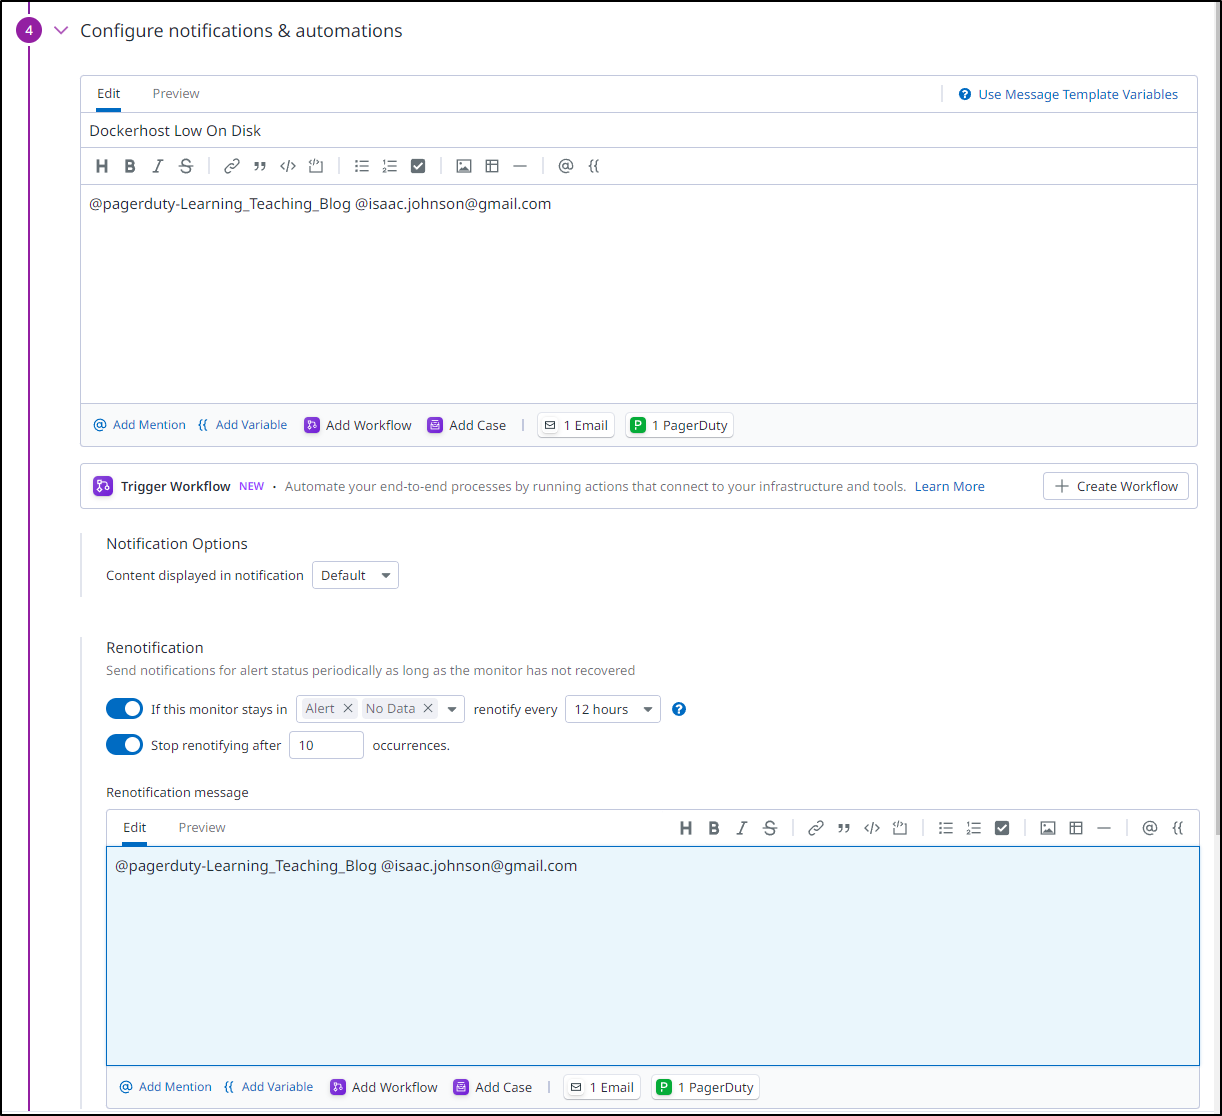
I’m going to set it to page me with Pagerduty but also email me as well. I decided to set a re-alert in case I miss it the first time
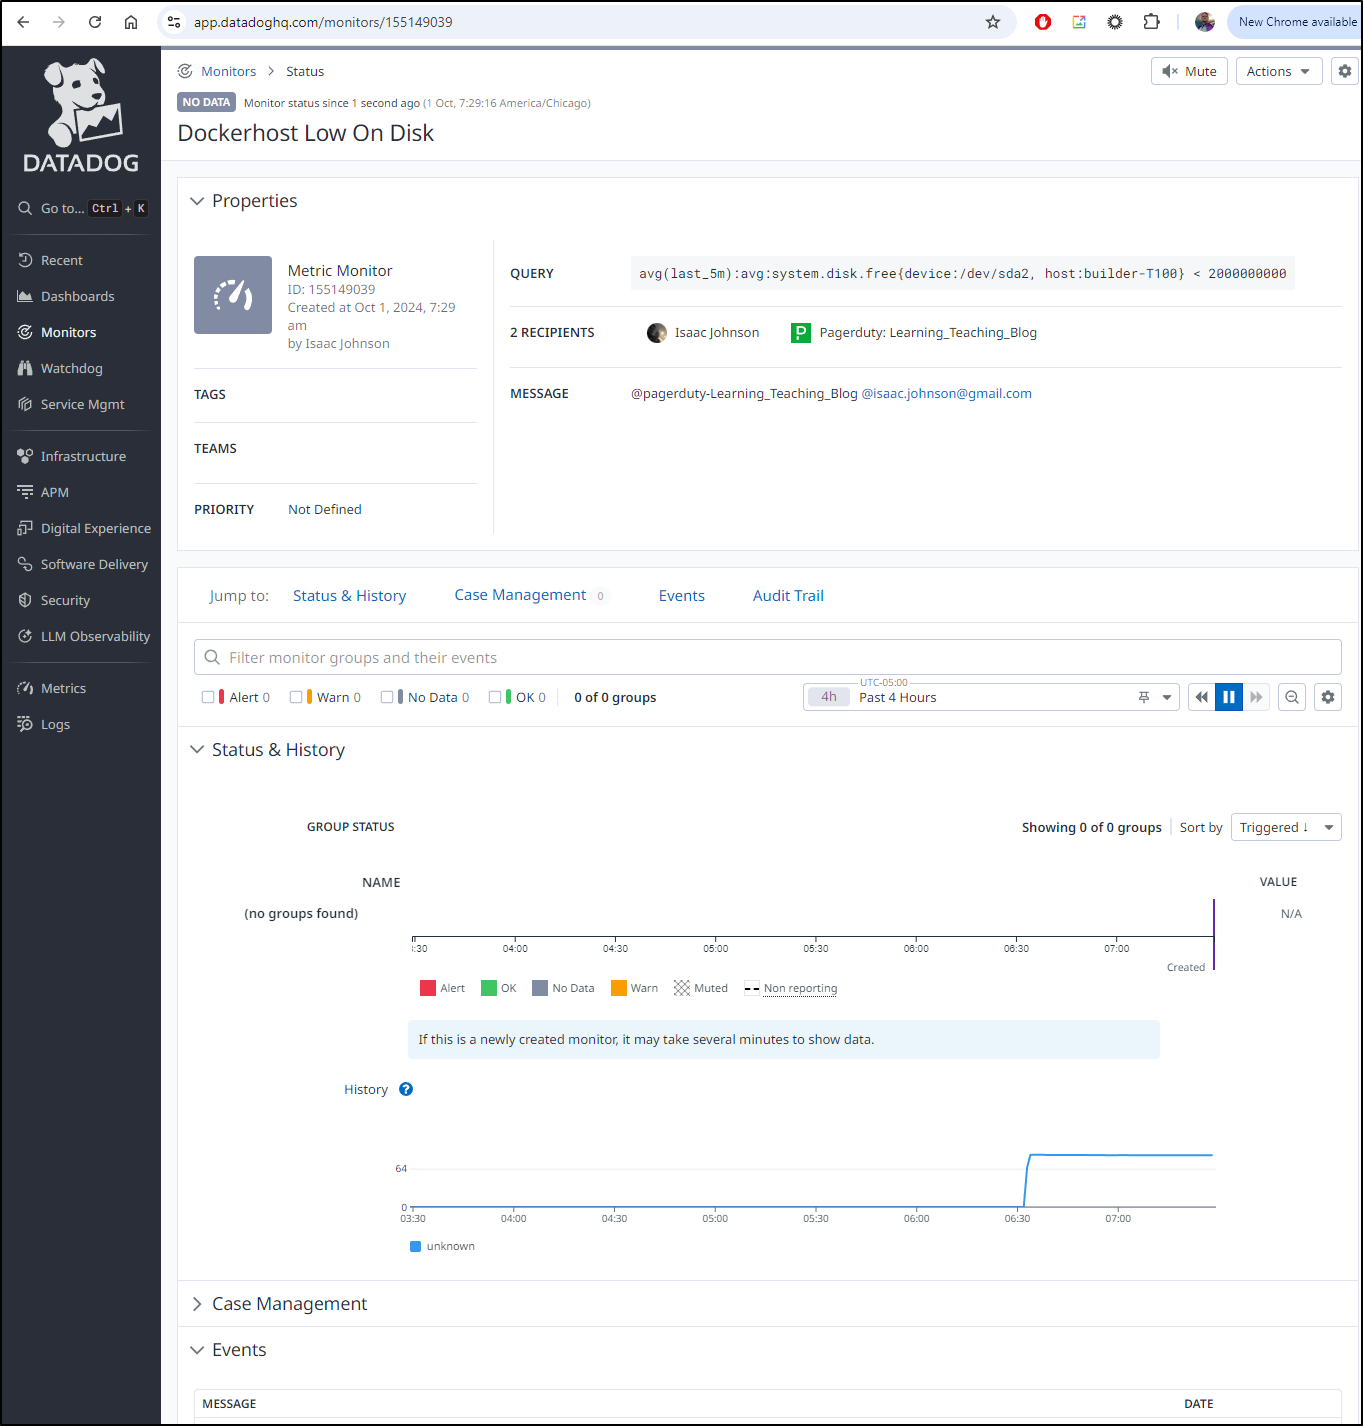
Normally I test notifications before saving, but I know (from this morning) the Datadog and Pagerduty connection is working dandy. So I saved it and can now see the active Dockerhost monitor is set up.
Summary
This was a quick post - we were alerted to a short outage at night via Pagerduty. Following that up we quick determined the host was live but upon further investigation, we saw that it had a completely full root volume.
We found and fixed the space issue, corrected the underlying backups system - both modifying Crontab and changing the delete setting for the GCP Transfer Job.
Lastly, we created a new Metric based host disk space alert in Datadog so if it ever gets close again, we can get alerted.


