Published: Jun 25, 2024 by Isaac Johnson
Recently Grafana rolled out Alloy, their OpenTelemetry Collector.
Today we’ll set it up in Kubernetes (and later Docker) and look at sending traces to Groundcover and NewRelic.
Before I go on, I should point out I worked this blog post for a month. I was soooooooooooooo stuck on protocol errors and port rejection. Spoiler Alert: I do solve it. So if you want to just get to the “how do I make this work”, you can zip down to tail end of the Docker section. The key pieces I was missing… well, I wont ruin it for those that want to follow allong.. but they are pretty obvious to me now (aren’t they always?).
We’ll end up having a working Alloy in a Dockerhost, in Kubernetes and show positive trace batch processing of OpenTelemetry data via Dapr and a Calculator app on through to Goundcover APM and NewRelic APM.
I used these two because Groundcover uses ‘Alligator’, akin to Datadog and others, namely, an ‘agent’ in the cluster that can forward on traces. NewRelic uses an OTLP endpoint that has your Auth in a header. I think both examples cover what many of you are looking to do (either use something in your network that forwards traces or a constrained public endpoint).
Let’s dig in!
Grafana Alloy Installation
There are three ways we can dig in to Grafana Alloy; Open Source, Cloud and Cloud Pro:
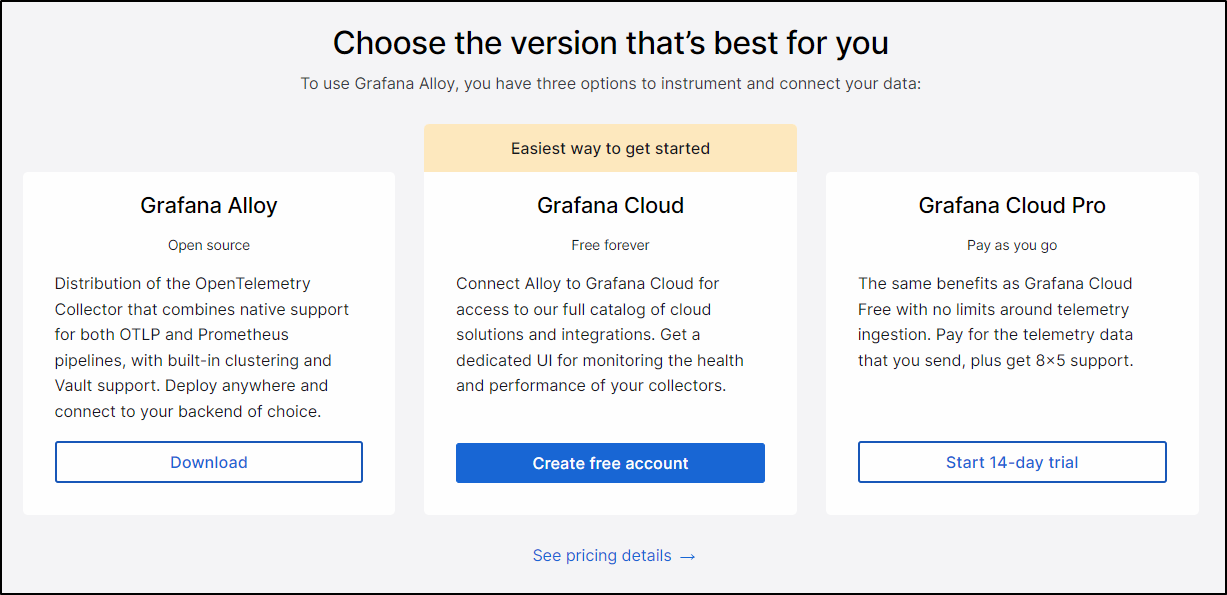
Let’s start with the download version first.
I will add the Grafana repo and update helm
$ helm repo add grafana https://grafana.github.io/helm-charts
"grafana" already exists with the same configuration, skipping
$ helm repo update
Hang tight while we grab the latest from your chart repositories...
We can then install into a new namespace
$ helm install -n grafana --create-namespace alloy grafana/alloy
NAME: alloy
LAST DEPLOYED: Mon May 27 06:55:37 2024
NAMESPACE: grafana
STATUS: deployed
REVISION: 1
TEST SUITE: None
NOTES:
Welcome to Grafana Alloy!
Initially all the pods failed to pull because Zarf had taken over this cluster.
Events:
  Type     Reason     Age                 From               Message
  ----     ------     ----                ----               -------
  Normal   Scheduled  109s                default-scheduler  Successfully assigned grafana/alloy-wqrst to anna-macbookair
  Warning  Failed     96s (x2 over 108s)  kubelet            Error: ErrImagePull
  Normal   BackOff    85s (x2 over 108s)  kubelet            Back-off pulling image "127.0.0.1:31999/grafana/alloy:v1.1.0-zarf-2371608624"
  Warning  Failed     85s (x2 over 108s)  kubelet            Error: ImagePullBackOff
  Normal   BackOff    85s (x2 over 108s)  kubelet            Back-off pulling image "127.0.0.1:31999/jimmidyson/configmap-reload:v0.12.0-zarf-3278208404"
  Warning  Failed     85s (x2 over 108s)  kubelet            Error: ImagePullBackOff
  Normal   Pulling    70s (x3 over 108s)  kubelet            Pulling image "127.0.0.1:31999/grafana/alloy:v1.1.0-zarf-2371608624"
  Warning  Failed     70s (x3 over 108s)  kubelet            Failed to pull image "127.0.0.1:31999/grafana/alloy:v1.1.0-zarf-2371608624": rpc error: code = Unknown desc = failed to pull and unpack image "127.0.0.1:31999/grafana/alloy:v1.1.0-zarf-2371608624": failed to resolve reference "127.0.0.1:31999/grafana/alloy:v1.1.0-zarf-2371608624": unexpected status from HEAD request to http://127.0.0.1:31999/v2/grafana/alloy/manifests/v1.1.0-zarf-2371608624: 401 Unauthorized
  Warning  Failed     70s (x3 over 108s)  kubelet            Error: ErrImagePull
  Normal   Pulling    70s (x3 over 108s)  kubelet            Pulling image "127.0.0.1:31999/jimmidyson/configmap-reload:v0.12.0-zarf-3278208404"
  Warning  Failed     70s (x3 over 108s)  kubelet            Failed to pull image "127.0.0.1:31999/jimmidyson/configmap-reload:v0.12.0-zarf-3278208404": rpc error: code = Unknown desc = failed to pull and unpack image "127.0.0.1:31999/jimmidyson/configmap-reload:v0.12.0-zarf-3278208404": failed to resolve reference "127.0.0.1:31999/jimmidyson/configmap-reload:v0.12.0-zarf-3278208404": unexpected status from HEAD request to http://127.0.0.1:31999/v2/jimmidyson/configmap-reload/manifests/v0.12.0-zarf-3278208404: 401 Unauthorized
I removed zarf
builder@DESKTOP-QADGF36:~$ zarf destroy --confirm

 NOTE  Saving log file to /tmp/zarf-2024-05-27-07-20-47-1192751553.log
  ✔  Waiting for cluster connection (30s timeout)
  ⠴  purge requested for zarf-docker-registry
 WARNING  Unable to uninstall the chart
  ✔  Removing Zarf-installed charts
  ⠦  Deleting the zarf namespace from this cluster (35s)
  ✔  Removing zarf metadata & secrets from existing namespaces not managed by Zarf
The pods seemed stuck still
$ kubectl get pods -n grafana
NAME          READY   STATUS             RESTARTS   AGE
alloy-5flnz   0/2     ImagePullBackOff   0          26m
alloy-g7psr   0/2     ImagePullBackOff   0          26m
alloy-wqrst   0/2     ImagePullBackOff   0          26m
I then removed and re-added with helm
builder@DESKTOP-QADGF36:~$ helm delete alloy -n grafana
release "alloy" uninstalled
builder@DESKTOP-QADGF36:~$ helm install -n grafana --create-namespace alloy grafana/alloy
NAME: alloy
LAST DEPLOYED: Mon May 27 07:22:30 2024
NAMESPACE: grafana
STATUS: deployed
REVISION: 1
TEST SUITE: None
NOTES:
Welcome to Grafana Alloy!
I could see them start up now
$ kubectl get pods -n grafana
NAME          READY   STATUS              RESTARTS   AGE
alloy-q6jzq   0/2     ContainerCreating   0          21s
alloy-xpw25   0/2     ContainerCreating   0          21s
alloy-qmgpq   1/2     Running             0          21s

$ kubectl get pods -n grafana
NAME          READY   STATUS    RESTARTS   AGE
alloy-qmgpq   2/2     Running   0          79s
alloy-q6jzq   2/2     Running   0          79s
alloy-xpw25   2/2     Running   0          79s
My next step was to follow some of the OTLP documentation to setup a New Relic exporter
otelcol.exporter.otlphttp "newrelic" {
  client {
    endpoint = "otlp.nr-data.net:4318"
    headers = {
        api-key="c87asdfasdfasdfasdfasdfasdf9dNRAL"
    }
  }
}

otelcol.receiver.otlp "httpreceiver" {
  grpc {
    endpoint = "127.0.0.1:4317"
  }

  http {
    endpoint = "127.0.0.1:4318"
  }

  output {
    metrics = [otelcol.exporter.ototlphttplp.newrelic.input]
    logs    = [otelcol.exporter.otlphttp.newrelic.input]
    traces  = [otelcol.exporter.otlphttp.newrelic.input]
  }
}
I can put that in a values file
builder@DESKTOP-QADGF36:~/Workspaces/alloy$ cat values.yaml
alloy:
  configMap:
    content: |-
      // Write your Alloy config here:
      logging {
        level = "info"
        format = "logfmt"
      }
      otelcol.exporter.otlphttp "newrelic" {
        client {
          endpoint = "otlp.nr-data.net:4318"
          headers = {
              api-key="c87asdfasdfasdfasdfasdfasdf9dNRAL"
          }
        }
      }

      otelcol.receiver.otlp "httpreceiver" {
        grpc {
          endpoint = "127.0.0.1:4317"
        }

        http {
          endpoint = "127.0.0.1:4318"
        }

        output {
          metrics = [otelcol.exporter.ototlphttplp.newrelic.input]
          logs    = [otelcol.exporter.otlphttp.newrelic.input]
          traces  = [otelcol.exporter.otlphttp.newrelic.input]
        }
      }
Then apply via helm
y$ helm upgrade -n grafana -f ./values.yaml alloy grafana/alloy
Release "alloy" has been upgraded. Happy Helming!
NAME: alloy
LAST DEPLOYED: Mon May 27 09:34:26 2024
NAMESPACE: grafana
STATUS: deployed
REVISION: 2
TEST SUITE: None
NOTES:
Welcome to Grafana Alloy!
I saw errors in the pods:
ts=2024-05-27T12:22:48.227305824Z level=info msg="peers changed" new_peers=alloy-qmgpq
ts=2024-05-27T14:34:32.924940734Z level=info msg="reload requested via /-/reload endpoint" service=http
ts=2024-05-27T14:34:32.925154521Z level=error msg="failed to reload config" service=http err="reading config path \"/etc/alloy/config.alloy\": /etc/alloy/config.alloy:10:12: expected =, got - (and 1 more diagnostics)"
So I pivoted to the file approach:
$ cat config.alloy
logging {
  level = "info"
  format = "logfmt"
}

otelcol.exporter.otlphttp "newrelic" {
  client {
    endpoint = "otlp.nr-data.net:4318"
    headers = {
        api-key="c87asdfasdfasdfasdfasdfasdf9dNRAL"
    }
  }
}

otelcol.receiver.otlp "httpreceiver" {
  grpc {
    endpoint = "127.0.0.1:4317"
  }

  http {
    endpoint = "127.0.0.1:4318"
  }

  output {
    metrics = [otelcol.exporter.ototlphttplp.newrelic.input]
    logs    = [otelcol.exporter.otlphttp.newrelic.input]
    traces  = [otelcol.exporter.otlphttp.newrelic.input]
  }
}


$ kubectl create configmap -n grafana alloy-config "--from-file=config.alloy=./config.alloy"
configmap/alloy-config created

$ cat values.yaml
alloy:
  configMap:
    create: false
    name: alloy-config
    key: config.alloy

$ helm upgrade -n grafana -f ./values.yaml alloy grafana/alloy
Release "alloy" has been upgraded. Happy Helming!
NAME: alloy
LAST DEPLOYED: Mon May 27 09:41:03 2024
NAMESPACE: grafana
STATUS: deployed
REVISION: 3
TEST SUITE: None
NOTES:
Welcome to Grafana Alloy!
If you just want to mess with settings, you can create a configfile and then delete/add in one line of bash:
$ cat config.alloy
logging {
  level = "info"
  format = "logfmt"
}

otelcol.exporter.otlphttp "newrelic" {
  client {
    endpoint = "otlp.nr-data.net:4318"
    auth     = otelcol.auth.headers.nr.handler
  }
}

otelcol.auth.headers "nr" {
  header {
    key   = "api-key"
    value = "c87asdfasdfasdfasdfasdfasdf9dNRAL"
  }
}

otelcol.receiver.otlp "httpreceiver" {
  grpc {
    endpoint = "127.0.0.1:4317"
  }

  http {
    endpoint = "127.0.0.1:4318"
  }

  output {
    metrics = [otelcol.exporter.otlphttp.newrelic.input]
    logs    = [otelcol.exporter.otlphttp.newrelic.input]
    traces  = [otelcol.exporter.otlphttp.newrelic.input]
  }
}

$ kubectl delete cm alloy-config -n grafana && kubectl create configmap -n grafana alloy-config "--from-file=config.alloy=./config.alloy"
configmap "alloy-config" deleted
configmap/alloy-config created
I could see the pods start to reload
$ kubectl get pods -n grafana
NAME          READY   STATUS    RESTARTS   AGE
alloy-xpw25   2/2     Running   0          145m
alloy-7grc7   2/2     Running   0          42s
alloy-l9vc7   1/2     Running   0          11s
At this moment, we have Alloy running, but nothing collecting.
Collecting metrics with Alloy
Let’s collect some standard Kubernetes metrics using Allow
I’ll update the config.alloy
$ cat config.alloy
logging {
  level = "info"
  format = "logfmt"
}

otelcol.exporter.otlphttp "newrelic" {
  client {
    endpoint = "otlp.nr-data.net:4318"
    auth     = otelcol.auth.headers.nr.handler
  }
}

otelcol.auth.headers "nr" {
  header {
    key   = "api-key"
    value = "c87asdfasdfasdfasdfasdfasdf9dNRAL"
  }
}

otelcol.receiver.otlp "httpreceiver" {
  grpc {
    endpoint = "127.0.0.1:4317"
  }

  http {
    endpoint = "127.0.0.1:4318"
  }

  output {
    metrics = [otelcol.exporter.otlphttp.newrelic.input]
    logs    = [otelcol.exporter.otlphttp.newrelic.input]
    traces  = [otelcol.exporter.otlphttp.newrelic.input]
  }
}

discovery.kubernetes "podmetrics" {
  role = "pod"
}

discovery.kubernetes "nodes" {
  role = "node"
}

discovery.kubernetes "services" {
  role = "service"
}

discovery.kubernetes "endpoints" {
  role = "endpoints"
}
Spoiler: One thing you’ll notice I’ve forgotten, but will realize only much later, is the ‘batch’ processor. Remember friends, with Otel collectors we receive, process, then export
Next, we rotate the ConfigMap
$ kubectl delete cm alloy-config -n grafana && kubectl create configmap -n grafana alloy-config "--from-file=config.alloy=./config.alloy"
configmap "alloy-config" deleted
configmap/alloy-config created
Though I noticed the pods didnt auto cycle
$ kubectl get pods -n grafana
NAME          READY   STATUS    RESTARTS   AGE
alloy-7grc7   2/2     Running   0          20h
alloy-l9vc7   2/2     Running   0          20h
alloy-cwnhr   2/2     Running   0          20h
However, checking the logs they did all take in the configs
ts=2024-05-28T10:52:22.601941023Z level=info msg="reload requested via /-/reload endpoint" service=http
ts=2024-05-28T10:52:22.602664505Z level=info msg="starting complete graph evaluation" controller_path=/ controller_id="" trace_id=2dcdc9a2c8ee1f7d667457199936e89f
ts=2024-05-28T10:52:22.602830541Z level=info msg="finished node evaluation" controller_path=/ controller_id="" trace_id=2dcdc9a2c8ee1f7d667457199936e89f node_id=remotecfg duration=79.95µs
ts=2024-05-28T10:52:22.602945643Z level=info msg="finished node evaluation" controller_path=/ controller_id="" trace_id=2dcdc9a2c8ee1f7d667457199936e89f node_id=labelstore duration=40.762µs
ts=2024-05-28T10:52:22.603551795Z level=info msg="Using pod service account via in-cluster config" component_path=/ component_id=discovery.kubernetes.nodes
ts=2024-05-28T10:52:22.604487213Z level=info msg="finished node evaluation" controller_path=/ controller_id="" trace_id=2dcdc9a2c8ee1f7d667457199936e89f node_id=discovery.kubernetes.nodes duration=1.461831ms
ts=2024-05-28T10:52:22.604608088Z level=info msg="finished node evaluation" controller_path=/ controller_id="" trace_id=2dcdc9a2c8ee1f7d667457199936e89f node_id=tracing duration=58.621µs
ts=2024-05-28T10:52:22.604790735Z level=info msg="finished node evaluation" controller_path=/ controller_id="" trace_id=2dcdc9a2c8ee1f7d667457199936e89f node_id=otelcol.auth.headers.nr duration=111.421µs
ts=2024-05-28T10:52:22.605026284Z level=info msg="finished node evaluation" controller_path=/ controller_id="" trace_id=2dcdc9a2c8ee1f7d667457199936e89f node_id=otelcol.exporter.otlphttp.newrelic duration=167.335µs
ts=2024-05-28T10:52:22.605303433Z level=info msg="finished node evaluation" controller_path=/ controller_id="" trace_id=2dcdc9a2c8ee1f7d667457199936e89f node_id=otelcol.receiver.otlp.httpreceiver duration=210.539µs
ts=2024-05-28T10:52:22.605437167Z level=info msg="finished node evaluation" controller_path=/ controller_id="" trace_id=2dcdc9a2c8ee1f7d667457199936e89f node_id=logging duration=70.318µs
ts=2024-05-28T10:52:22.60574833Z level=info msg="Using pod service account via in-cluster config" component_path=/ component_id=discovery.kubernetes.services
ts=2024-05-28T10:52:22.605972209Z level=info msg="finished node evaluation" controller_path=/ controller_id="" trace_id=2dcdc9a2c8ee1f7d667457199936e89f node_id=discovery.kubernetes.services duration=457.636µs
ts=2024-05-28T10:52:22.606021603Z level=info msg="finished node evaluation" controller_path=/ controller_id="" trace_id=2dcdc9a2c8ee1f7d667457199936e89f node_id=http duration=21.434µs
ts=2024-05-28T10:52:22.606079273Z level=info msg="finished node evaluation" controller_path=/ controller_id="" trace_id=2dcdc9a2c8ee1f7d667457199936e89f node_id=ui duration=22.078µs
ts=2024-05-28T10:52:22.6061366Z level=info msg="finished node evaluation" controller_path=/ controller_id="" trace_id=2dcdc9a2c8ee1f7d667457199936e89f node_id=cluster duration=19.108µs
ts=2024-05-28T10:52:22.606321521Z level=info msg="Using pod service account via in-cluster config" component_path=/ component_id=discovery.kubernetes.endpoints
ts=2024-05-28T10:52:22.60663581Z level=info msg="finished node evaluation" controller_path=/ controller_id="" trace_id=2dcdc9a2c8ee1f7d667457199936e89f node_id=discovery.kubernetes.endpoints duration=464.522µs
ts=2024-05-28T10:52:22.606789645Z level=info msg="Using pod service account via in-cluster config" component_path=/ component_id=discovery.kubernetes.podmetrics
ts=2024-05-28T10:52:22.607011759Z level=info msg="finished node evaluation" controller_path=/ controller_id="" trace_id=2dcdc9a2c8ee1f7d667457199936e89f node_id=discovery.kubernetes.podmetrics duration=349.376µs
ts=2024-05-28T10:52:22.60706232Z level=info msg="finished node evaluation" controller_path=/ controller_id="" trace_id=2dcdc9a2c8ee1f7d667457199936e89f node_id=otel duration=22.691µs
ts=2024-05-28T10:52:22.607100423Z level=info msg="finished complete graph evaluation" controller_path=/ controller_id="" trace_id=2dcdc9a2c8ee1f7d667457199936e89f duration=4.726677ms
ts=2024-05-28T10:52:22.60715816Z level=info msg="config reloaded" service=http
ts=2024-05-28T10:52:22.607256864Z level=info msg="scheduling loaded components and services"
I didn’t see anything immediately in New Relic, so I used the Ask AI to get me a basic NRQL for the data
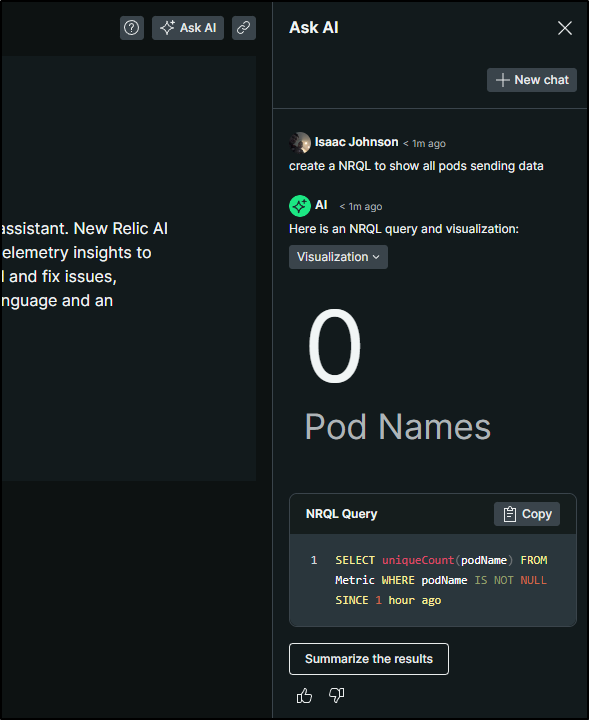
SELECT uniqueCount(podName) FROM Metric WHERE podName IS NOT NULL SINCE 1 hour ago
I can also use the new UI to query as well
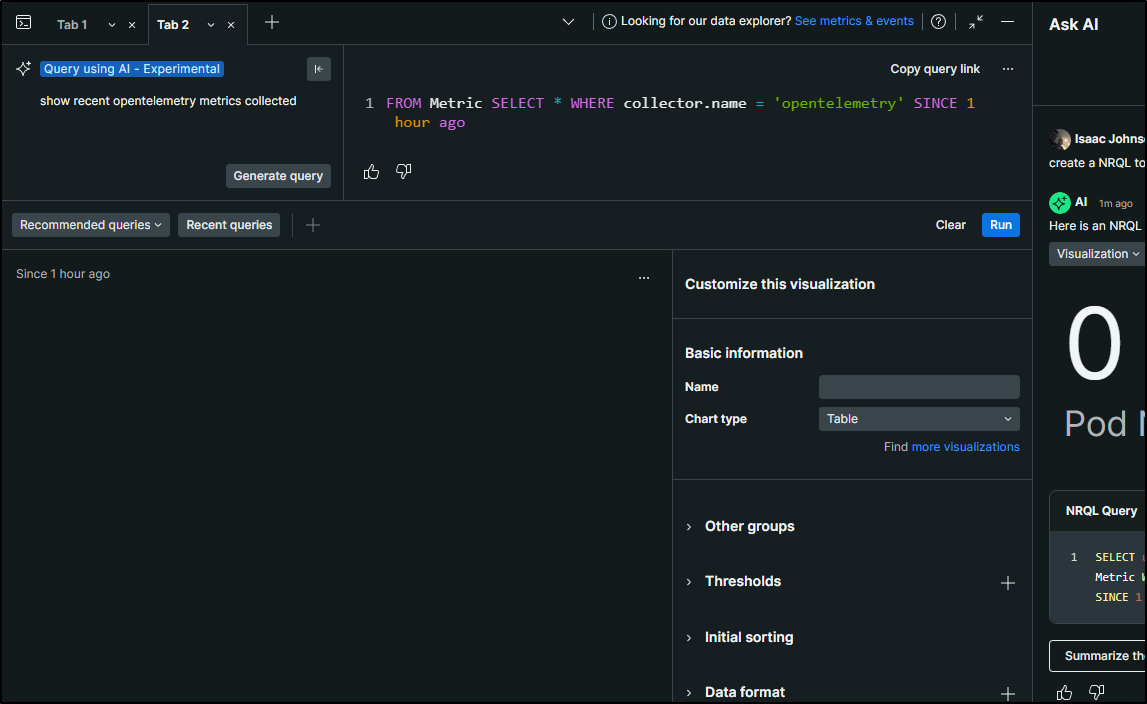
FROM Metric SELECT * WHERE collector.name = 'opentelemetry' SINCE 1 hour ago
My suspicion, just thinking about the standard Otel collector, is that I need a processor in the mix. Even if the “T” is a no-op, ETL doesn’t really work to gather, send, but no transform.
$ cat config.alloy
logging {
  level = "info"
  format = "logfmt"
}

otelcol.exporter.otlphttp "newrelic" {
  client {
    endpoint = "otlp.nr-data.net:4318"
    auth     = otelcol.auth.headers.nr.handler
  }
}

otelcol.auth.headers "nr" {
  header {
    key   = "api-key"
    value = "c87asdfasdfasdfasdfasdfasdf9dNRAL"
  }
}

otelcol.receiver.otlp "httpreceiver" {
  grpc {
    endpoint = "127.0.0.1:4317"
  }

  http {
    endpoint = "127.0.0.1:4318"
  }

  output {
    metrics = [otelcol.exporter.otlphttp.newrelic.input]
    logs    = [otelcol.exporter.otlphttp.newrelic.input]
    traces  = [otelcol.exporter.otlphttp.newrelic.input]
  }
}

otelcol.processor.batch "default" {
  // Preserve the tenant_id metadata.
  metadata_keys = ["tenant_id"]

  output {
    metrics = [otelcol.exporter.otlphttp.newrelic.input]
    logs    = [otelcol.exporter.otlphttp.newrelic.input]
    traces  = [otelcol.exporter.otlphttp.newrelic.input]
  }
}

discovery.kubernetes "podmetrics" {
  role = "pod"
}

discovery.kubernetes "nodes" {
  role = "node"
}

discovery.kubernetes "services" {
  role = "service"
}

discovery.kubernetes "endpoints" {
  role = "endpoints"
}
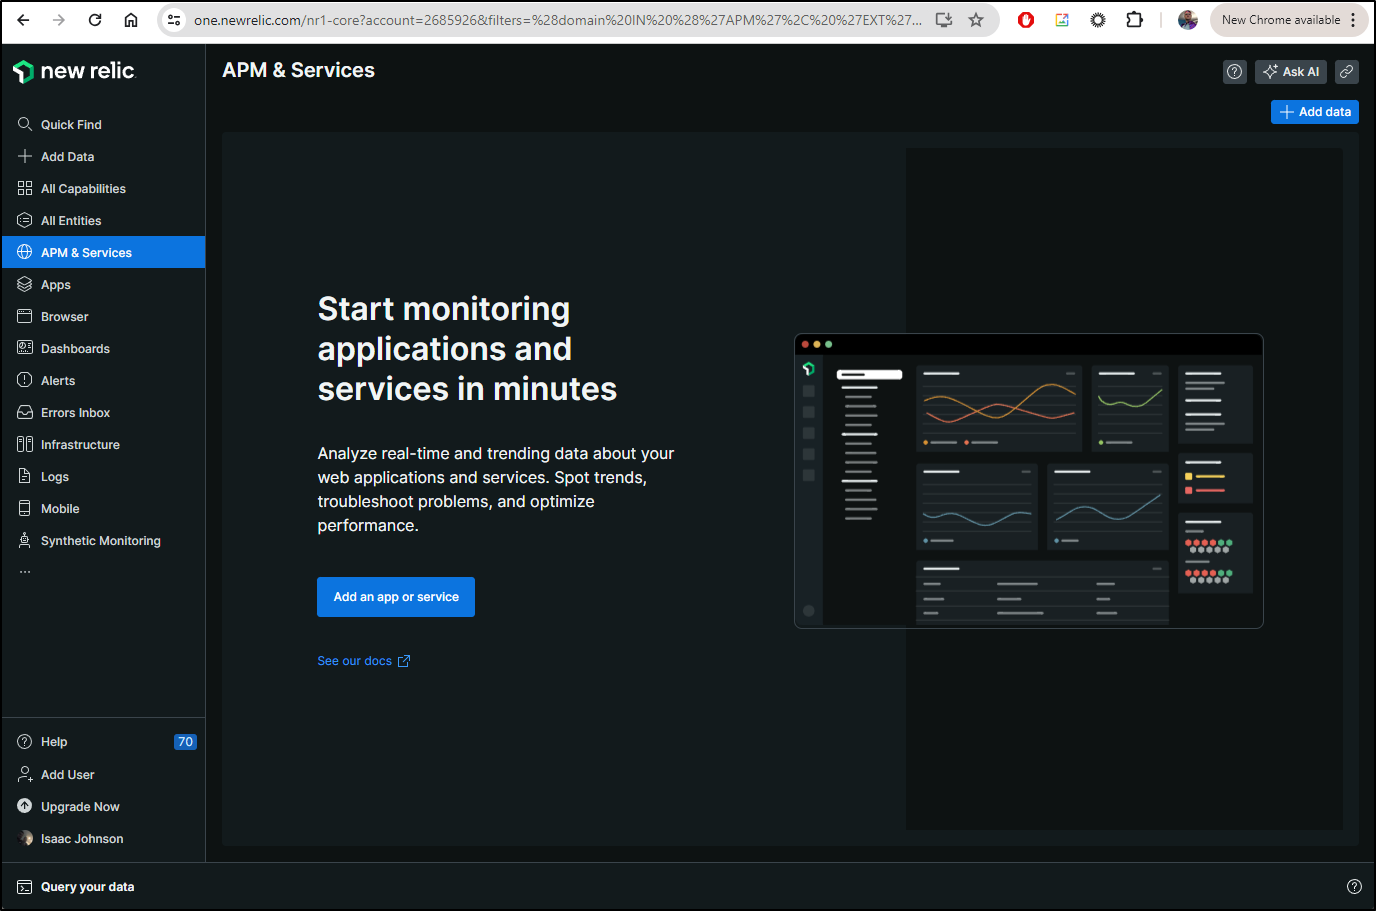
I can see from the logs it rotated, but I have yet to see data in NR. The UI is a bit funny, but when you have no data it just refreshes to a collector page
In reviewing the docs, I noticed they receive then send to the processor which then sends to the exporter. I had skipped over the send to processor part before. Let’s fix (and add some comments)
Spoiler: There are two real problems I have yet to see below, but will correct later. One is a protocol and the other has to do with IP addresses. See if you can spot them
logging {
  level = "info"
  format = "logfmt"
}

// Send to New Relic
otelcol.exporter.otlphttp "newrelic" {
  client {
    endpoint = "otlp.nr-data.net:4318"
    auth     = otelcol.auth.headers.nr.handler
  }
}

otelcol.auth.headers "nr" {
  header {
    key   = "api-key"
    value = "c87asdfasdfasdfasdfasdfasdf9dNRAL"
  }
}

// Collect OTLP
otelcol.receiver.otlp "httpreceiver" {
  grpc {
    endpoint = "127.0.0.1:4317"
  }

  http {
    endpoint = "127.0.0.1:4318"
  }

  output {
    metrics = [otelcol.processor.batch.default.input]
    logs    = [otelcol.processor.batch.default.input]
    traces  = [otelcol.processor.batch.default.input]
  }
}

// Process and send
otelcol.processor.batch "default" {
  // Preserve the tenant_id metadata.
  metadata_keys = ["tenant_id"]

  output {
    metrics = [otelcol.exporter.otlphttp.newrelic.input]
    logs    = [otelcol.exporter.otlphttp.newrelic.input]
    traces  = [otelcol.exporter.otlphttp.newrelic.input]
  }
}

// Collect
discovery.kubernetes "podmetrics" {
  role = "pod"
}

discovery.kubernetes "nodes" {
  role = "node"
}

discovery.kubernetes "services" {
  role = "service"
}

discovery.kubernetes "endpoints" {
  role = "endpoints"
}
One more rotate
$ kubectl delete cm alloy-config -n grafana && kubectl create configmap -n grafana alloy-config "--from-file=config.alloy=./config.alloy"
configmap "alloy-config" deleted
configmap/alloy-config created
However, even after a day I saw no entries in New Relic
Dapr
I want to get some OTel data with which to play.
Let’s add the Dapr CLI if we don’t have it already
$ wget -q https://raw.githubusercontent.com/dapr/cli/master/install/install.sh -O - | /bin/bash
Getting the latest Dapr CLI...
Your system is linux_amd64
Installing Dapr CLI...

Installing v1.13.0 Dapr CLI...
Downloading https://github.com/dapr/cli/releases/download/v1.13.0/dapr_linux_amd64.tar.gz ...
[sudo] password for builder:
dapr installed into /usr/local/bin successfully.
CLI version: 1.13.0
Runtime version: n/a

To get started with Dapr, please visit https://docs.dapr.io/getting-started/
Then to add Dapr to our cluster, we need to just init -k
$ dapr init -k
⌛  Making the jump to hyperspace...
ℹ️  Note: To install Dapr using Helm, see here: https://docs.dapr.io/getting-started/install-dapr-kubernetes/#install-with-helm-advanced

ℹ️  Container images will be pulled from Docker Hub
✅  Deploying the Dapr control plane with latest version to your cluster...
✅  Deploying the Dapr dashboard with latest version to your cluster...
✅  Success! Dapr has been installed to namespace dapr-system. To verify, run `dapr status -k' in your terminal. To get started, go here: https://aka.ms/dapr-getting-started
I’m going to install Redis to the Dapr namespace next
$ helm install bitnami/redis -n dapr-system --generate-name
NAME: redis-1717194313
LAST DEPLOYED: Fri May 31 17:25:17 2024
NAMESPACE: dapr-system
STATUS: deployed
REVISION: 1
TEST SUITE: None
NOTES:
CHART NAME: redis
CHART VERSION: 19.0.2
APP VERSION: 7.2.4

** Please be patient while the chart is being deployed **

Redis® can be accessed on the following DNS names from within your cluster:

    redis-1717194313-master.dapr-system.svc.cluster.local for read/write operations (port 6379)
    redis-1717194313-replicas.dapr-system.svc.cluster.local for read-only operations (port 6379)


To get your password run:

    export REDIS_PASSWORD=$(kubectl get secret --namespace dapr-system redis-1717194313 -o jsonpath="{.data.redis-password}" | base64 -d)

To connect to your Redis® server:

1. Run a Redis® pod that you can use as a client:

   kubectl run --namespace dapr-system redis-client --restart='Never'  --env REDIS_PASSWORD=$REDIS_PASSWORD  --image docker.io/bitnami/redis:7.2.4-debian-12-r9 --command -- sleep infinity

   Use the following command to attach to the pod:

   kubectl exec --tty -i redis-client \
   --namespace dapr-system -- bash

2. Connect using the Redis® CLI:
   REDISCLI_AUTH="$REDIS_PASSWORD" redis-cli -h redis-1717194313-master
   REDISCLI_AUTH="$REDIS_PASSWORD" redis-cli -h redis-1717194313-replicas

To connect to your database from outside the cluster execute the following commands:

    kubectl port-forward --namespace dapr-system svc/redis-1717194313-master 6379:6379 &
    REDISCLI_AUTH="$REDIS_PASSWORD" redis-cli -h 127.0.0.1 -p 6379

WARNING: There are "resources" sections in the chart not set. Using "resourcesPreset" is not recommended for production. For production installations, please set the following values according to your workload needs:
  - master.resources
  - replica.resources
+info https://kubernetes.io/docs/concepts/configuration/manage-resources-containers/
Now let’s add to Dapr
$ cat redis_in_dapr.yaml
apiVersion: dapr.io/v1alpha1
kind: Component
metadata:
  name: statestore
spec:
  type: state.redis
  version: v1
  metadata:
  # These settings will work out of the box if you use `helm install
  # bitnami/redis`. If you have your own setup, replace
  # `redis-master:6379` with your own Redis master address, and the
  # Redis password with your own Secret's name. For more information,
  # see https://docs.dapr.io/operations/components/component-secrets .
  - name: redisHost
    value: redis-1717194313-master:6379
  - name: redisPassword
    secretKeyRef:
      name: redis-1717194313
      key: redis-password
auth:
  secretStore: kubernetes

$ kubectl apply -f ./redis_in_dapr.yaml -n dapr-system
component.dapr.io/statestore created
Our Dapr system should be operational
Prometheus
Let me now add Prometheus for metrics
$ helm repo add prometheus-community https://prometheus-community.github.io/helm-charts
"prometheus-community" already exists with the same configuration, skipping

$ helm install prometheus-community prometheus-community/prometheus
NAME: prometheus-community
LAST DEPLOYED: Tue May 28 05:40:17 2024
NAMESPACE: default
STATUS: deployed
REVISION: 1
TEST SUITE: None
NOTES:
The Prometheus server can be accessed via port 80 on the following DNS name from within your cluster:
prometheus-community-server.default.svc.cluster.local


Get the Prometheus server URL by running these commands in the same shell:
  export POD_NAME=$(kubectl get pods --namespace default -l "app.kubernetes.io/name=prometheus,app.kubernetes.io/instance=prometheus-community" -o jsonpath="{.items[0].metadata.name}")
  kubectl --namespace default port-forward $POD_NAME 9090


The Prometheus alertmanager can be accessed via port 9093 on the following DNS name from within your cluster:
prometheus-community-alertmanager.default.svc.cluster.local


Get the Alertmanager URL by running these commands in the same shell:
  export POD_NAME=$(kubectl get pods --namespace default -l "app.kubernetes.io/name=alertmanager,app.kubernetes.io/instance=prometheus-community" -o jsonpath="{.items[0].metadata.name}")
  kubectl --namespace default port-forward $POD_NAME 9093
#################################################################################
######   WARNING: Pod Security Policy has been disabled by default since    #####
######            it deprecated after k8s 1.25+. use                        #####
######            (index .Values "prometheus-node-exporter" "rbac"          #####
###### .          "pspEnabled") with (index .Values                         #####
######            "prometheus-node-exporter" "rbac" "pspAnnotations")       #####
######            in case you still need it.                                #####
#################################################################################


The Prometheus PushGateway can be accessed via port 9091 on the following DNS name from within your cluster:
prometheus-community-prometheus-pushgateway.default.svc.cluster.local


Get the PushGateway URL by running these commands in the same shell:
  export POD_NAME=$(kubectl get pods --namespace default -l "app=prometheus-pushgateway,component=pushgateway" -o jsonpath="{.items[0].metadata.name}")
  kubectl --namespace default port-forward $POD_NAME 9091

For more information on running Prometheus, visit:
https://prometheus.io/
I can test if it is working by forwarding out to the Prometheus server
$ export POD_NAME=$(kubectl get pods --namespace default -l "app.kubernetes.io/name=prometheus,app.kubernetes.io/instance=prometheus-community" -o jsonpath="{.items[0].metadata.name}")

$ kubectl --namespace default port-forward $POD_NAME 9090
Forwarding from 127.0.0.1:9090 -> 9090
Forwarding from [::1]:9090 -> 9090
Handling connection for 9090
Handling connection for 9090
Handling connection for 9090
And I can see it’s gathering metrics

Alloy Config: ExtraPorts
I wonder if one issue is I’m not telling the helm chart to route ports through the service on to the collector pods
(Spoiler: yes, this is one of the issues)
Let’s set the values
$ cat ./values.yaml
alloy:
  configMap:
    create: false
    key: config.alloy
    name: alloy-config
  extraPorts:
  - name: "otelgrpc"
    port: 4317
    targetPort: 4317
    protocol: "TCP"
  - name: "otelhttp"
    port: 4318
    targetPort: 4318
    protocol: "TCP"
Let’s upgrade
$ helm upgrade -n grafana -f ./values.yaml alloy grafana/alloy
Release "alloy" has been upgraded. Happy Helming!
NAME: alloy
LAST DEPLOYED: Mon Jun 17 18:46:34 2024
NAMESPACE: grafana
STATUS: deployed
REVISION: 4
TEST SUITE: None
NOTES:
Welcome to Grafana Alloy!
We can now see the service has exposed the ports
$ kubectl get svc -n grafana
NAME    TYPE        CLUSTER-IP      EXTERNAL-IP   PORT(S)                       AGE
alloy   ClusterIP   10.43.231.164   <none>        12345/TCP,4317/TCP,4318/TCP   21d
I can add zipkin as well
$ cat values.yaml
alloy:
  configMap:
    create: false
    key: config.alloy
    name: alloy-config
  extraPorts:
  - name: "otelgrpc"
    port: 4317
    targetPort: 4317
    protocol: "TCP"
  - name: "otelhttp"
    port: 4318
    targetPort: 4318
    protocol: "TCP"
  - name: "zipkin"
    port: 9411
    targetPort: 9411
    protocol: "TCP"
$ helm upgrade -n grafana -f ./values.yaml alloy grafana/alloy
Release "alloy" has been upgraded. Happy Helming!
NAME: alloy
LAST DEPLOYED: Mon Jun 17 19:00:57 2024
NAMESPACE: grafana
STATUS: deployed
REVISION: 6
TEST SUITE: None
NOTES:
Welcome to Grafana Alloy!
I can now see the Zipkin port enabled
$ kubectl get svc -n grafana
NAME    TYPE        CLUSTER-IP      EXTERNAL-IP   PORT(S)                                AGE
alloy   ClusterIP   10.43.231.164   <none>        12345/TCP,4317/TCP,4318/TCP,9411/TCP   21d
We can now use it in our dapr config “appconfig”
$ cat /mnt/c/Users/isaac/Downloads/collector-config.yaml
apiVersion: dapr.io/v1alpha1
kind: Configuration
metadata:
  name: appconfig
  namespace: default
spec:
  tracing:
    samplingRate: "1"
    zipkin:
      endpointAddress: "http://10.43.231.164:9411/api/v2/spans"
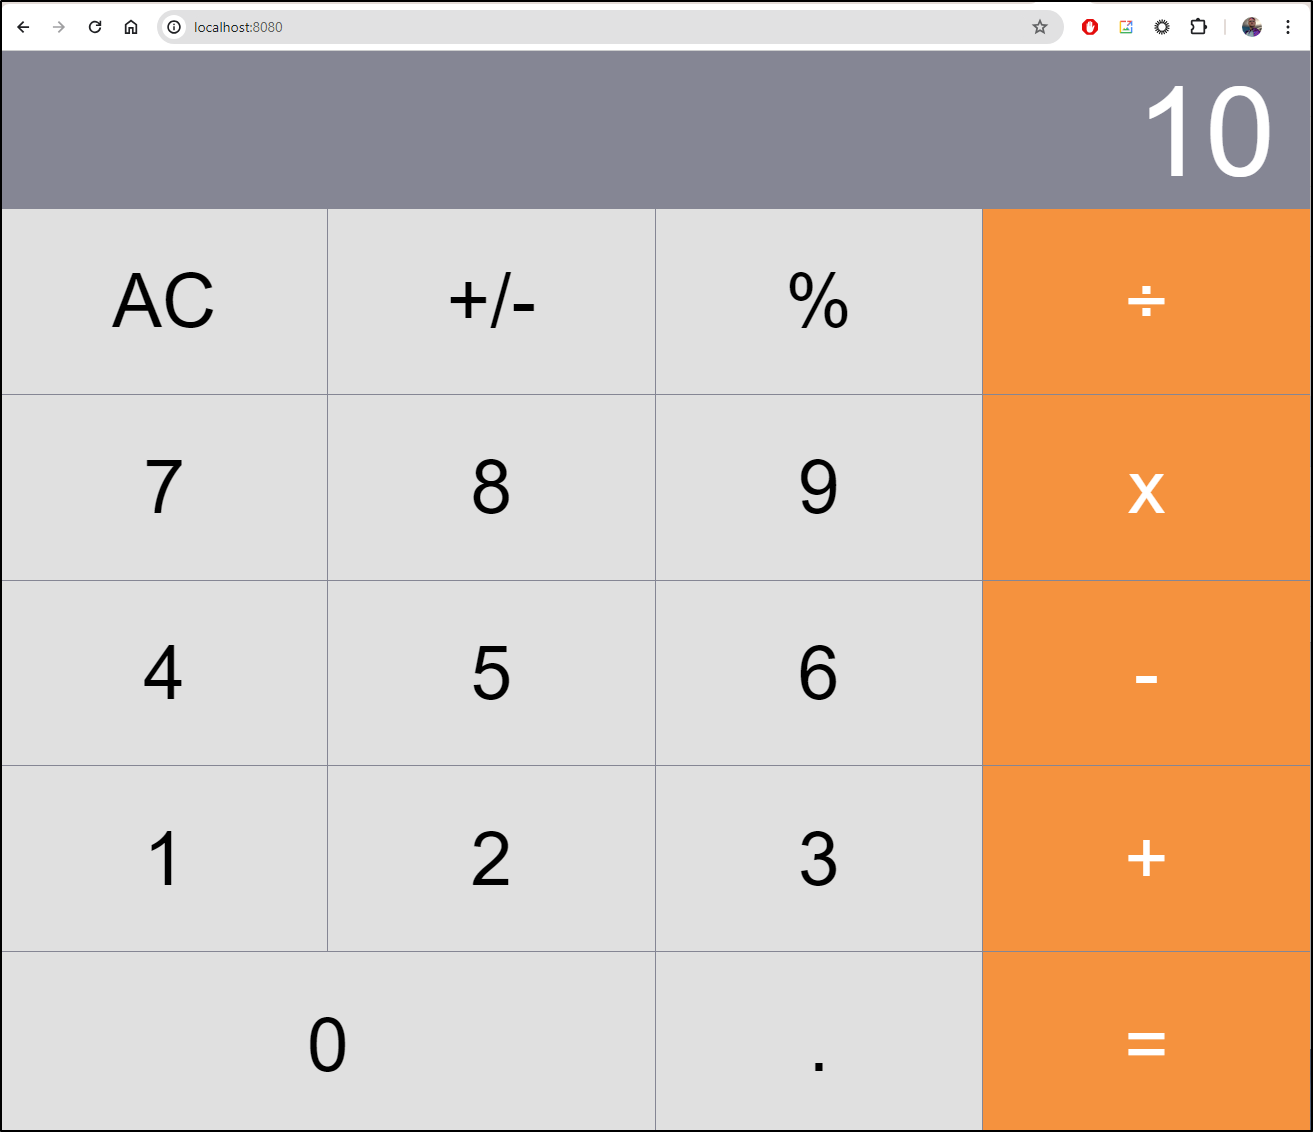
I’ll now load the deployment for the calculator app
builder@DESKTOP-QADGF36:~/Workspaces/quickstarts/tutorials/distributed-calculator/deploy$ kubectl apply -f .
configuration.dapr.io/appconfig created
deployment.apps/subtractapp created
deployment.apps/zipkin created
service/zipkin created
deployment.apps/addapp created
deployment.apps/divideapp created
deployment.apps/multiplyapp created
service/calculator-front-end created
deployment.apps/calculator-front-end created
component.dapr.io/statestore created
Error from server (BadRequest): error when creating "cobol-adder.yaml": Deployment in version "v1" cannot be handled as a Deployment: strict decoding error: unknown field "spec.template.spec.containers[0].imagePullSecrets"
I fixed the OTel statestore, but still saw no traces.
I can see from the Granfana logs that even though I added zipkin, it’s only listening to OTLP (4317,4318)
ts=2024-06-18T00:19:12.607267338Z level=info msg="starting cluster node" peers="" advertise_addr=127.0.0.1:12345
ts=2024-06-18T00:19:12.607731886Z level=info msg="peers changed" new_peers=alloy-fv4mc
ts=2024-06-18T00:19:12.608363078Z level=info msg="Starting GRPC server" component_path=/ component_id=otelcol.receiver.otlp.httpreceiver endpoint=127.0.0.1:4317
ts=2024-06-18T00:19:12.608756388Z level=info msg="Starting HTTP server" component_path=/ component_id=otelcol.receiver.otlp.httpreceiver endpoint=127.0.0.1:4318
Let me try using OTel http:
$ diff appconfig.yaml.new appconfig.yaml.bak
20,24c20,21
<     stdout: true
<     otel:
<       endpointAddress: 10.43.231.164:4318
<       isSecure: false
<       protocol: http
---
>     zipkin:
>       endpointAddress: http://zipkin.default.svc.cluster.local:9411/api/v2/spans
And apply
$ kubectl apply -f ./appconfig.yaml.new
configuration.dapr.io/appconfig configured
The problem now is I seee connection refused:
$ kubectl get svc -n grafana
NAME    TYPE        CLUSTER-IP      EXTERNAL-IP   PORT(S)                                AGE
alloy   ClusterIP   10.43.231.164   <none>        12345/TCP,4317/TCP,4318/TCP,9411/TCP   21d


$ kubectl logs multiplyapp-64ff57bb6d-lmsgt -c daprd | tail -n 5
time="2024-06-18T00:32:49.285387658Z" level=info msg="Workflow engine initialized." app_id=multiplyapp instance=multiplyapp-64ff57bb6d-lmsgt scope=dapr.runtime type=log ver=1.13.4
time="2024-06-18T00:32:49.285413947Z" level=info msg="dapr initialized. Status: Running. Init Elapsed 108ms" app_id=multiplyapp instance=multiplyapp-64ff57bb6d-lmsgt scope=dapr.runtime type=log ver=1.13.4
time="2024-06-18T00:32:49.301797593Z" level=info msg="Placement tables updated, version: 0" app_id=multiplyapp instance=multiplyapp-64ff57bb6d-lmsgt scope=dapr.runtime.actors.placement type=log ver=1.13.4
time="2024-06-18T00:34:24.190381354Z" level=info msg="[CallLocal/multiplyapp/multiply] Trace: e01a55d7296ca5515048f4042f6ef791 Span: 56482761940761f7/09d30d2aca40fbb3 Time: [2024-06-18 00:34:22.242588704 +0000 UTC m=+93.360134196 ->  2024-06-18 00:34:23.248000759 +0000 UTC m=+94.365546251] Annotations: []" instance=multiplyapp-64ff57bb6d-lmsgt scope=dapr.runtime.trace type=log ver=1.13.4
2024/06/18 00:34:24 traces export: Post "http://10.43.231.164:4318/v1/traces": dial tcp 10.43.231.164:4318: connect: connection refused
I tried GRPC
2024/06/18 00:43:58 traces export: context deadline exceeded: rpc error: code = Unavailable desc = connection error: desc = "transport: Error while dialing: dial tcp 10.43.231.164:4317: connect: connection refused"
I tried directly sending to the podIP
18 00:47:54.380781096 +0000 UTC m=+79.526899506] Annotations: []" instance=addapp-5b74bb667-g9bg8 scope=dapr.runtime.trace type=log ver=1.13.4
2024/06/18 00:48:05 traces export: context deadline exceeded: rpc error: code = Unavailable desc = connection error: desc = "transport: Error while dialing: dial tcp 10.42.2.35:4317: connect: connection refused"
Maybe if I give the helm a listen port for 4317
Spoiler: wrong! listen port is for the UI to view status of Alloy
$ cat values.yaml
alloy:
  configMap:
    create: false
    key: config.alloy
    name: alloy-config
  listenPort: 4317
  extraPorts:
  - name: "otelgrpc"
    port: 4317
    targetPort: 4317
    protocol: "TCP"
  - name: "otelhttp"
    port: 4318
    targetPort: 4318
    protocol: "TCP"
  - name: "zipkin"
    port: 9411
    targetPort: 9411
    protocol: "TCP"

$ helm upgrade -n grafana -f ./values.yaml alloy grafana/alloy
Release "alloy" has been upgraded. Happy Helming!
NAME: alloy
LAST DEPLOYED: Mon Jun 17 19:50:39 2024
NAMESPACE: grafana
STATUS: deployed
REVISION: 7
TEST SUITE: None
NOTES:
Welcome to Grafana Alloy!

$ kubectl get svc -n grafana
NAME    TYPE        CLUSTER-IP      EXTERNAL-IP   PORT(S)                      AGE
alloy   ClusterIP   10.43.231.164   <none>        4317/TCP,4318/TCP,9411/TCP   21d
This time I’ll use the service
$ cat appconfig.yaml.new4
apiVersion: dapr.io/v1alpha1
kind: Configuration
metadata:
  annotations:
    kubectl.kubernetes.io/last-applied-configuration: |
      {"apiVersion":"dapr.io/v1alpha1","kind":"Configuration","metadata":{"annotations":{},"creationTimestamp":"2024-06-18T00:05:40Z","generation":3,"name":"appconfig","namespace":"default","resourceVersion":"3246038","uid":"d612c9c1-46a9-4142-ac79-8d57fc836212"},"spec":{"metric":{"enabled":true},"metrics":{"enabled":true},"tracing":{"otel":{"endpointAddress":"10.42.2.35:4317","isSecure":false,"protocol":"grpc"},"samplingRate":"1","stdout":true}}}
  creationTimestamp: "2024-06-18T00:05:40Z"
  generation: 4
  name: appconfig
  namespace: default
  resourceVersion: "3246560"
  uid: d612c9c1-46a9-4142-ac79-8d57fc836212
spec:
  metric:
    enabled: true
  metrics:
    enabled: true
  tracing:
    otel:
      endpointAddress: alloy.grafana.svc.cluster.local:4317
      isSecure: false
      protocol: grpc
    samplingRate: "1"
    stdout: true

$ kubectl apply -f ./appconfig.yaml.new4
configuration.dapr.io/appconfig configured
Rotate the pods and try again
$ kubectl delete pods -l app=subtract & kubectl delete pods -l app=multiply & kubectl delete pods -l app=add & kubectl delete pods -l app=divide
 & kubectl delete pod -l app=calculator-front-end &

$ kubectl port-forward `kubectl get pod -l app=calculator-front-end -o go-template='{{range .items}}{{.metadata.name}}{{end}}'` 8080:8080
Forwarding from 127.0.0.1:8080 -> 8080
Forwarding from [::1]:8080 -> 8080
Yet still it refuses
$ kubectl logs multiplyapp-64ff57bb6d-q2q9d -c daprd | tail -n2
2024/06/18 00:54:49 traces export: context deadline exceeded: rpc error: code = Unavailable desc = connection error: desc = "transport: Error while dialing: dial tcp 10.43.231.164:4317: connect: connection refused"
2024/06/18 00:55:04 traces export: context deadline exceeded: rpc error: code = Unavailable desc = connection error: desc = "transport: Error while dialing: dial tcp 10.43.231.164:4317: connect: connection refused"
No matter how I try, it refuses the connection
$ cat appconfig.yaml.new5
apiVersion: dapr.io/v1alpha1
kind: Configuration
metadata:
  annotations:
    kubectl.kubernetes.io/last-applied-configuration: |
      {"apiVersion":"dapr.io/v1alpha1","kind":"Configuration","metadata":{"annotations":{},"creationTimestamp":"2024-06-18T00:05:40Z","generation":4,"name":"appconfig","namespace":"default","resourceVersion":"3246560","uid":"d612c9c1-46a9-4142-ac79-8d57fc836212"},"spec":{"metric":{"enabled":true},"metrics":{"enabled":true},"tracing":{"otel":{"endpointAddress":"alloy.grafana.svc.cluster.local:4317","isSecure":false,"protocol":"grpc"},"samplingRate":"1","stdout":true}}}
  creationTimestamp: "2024-06-18T00:05:40Z"
  generation: 5
  name: appconfig
  namespace: default
  resourceVersion: "3247251"
  uid: d612c9c1-46a9-4142-ac79-8d57fc836212
spec:
  metric:
    enabled: true
  metrics:
    enabled: true
  tracing:
    otel:
      endpointAddress: alloy.grafana.svc.cluster.local:4318
      isSecure: false
      protocol: http
    samplingRate: "1"
    stdout: true

# rotate pods, etc etc...

$ kubectl logs divideapp-85888845-9ptnk -c daprd | tail -n1
2024/06/18 01:01:49 traces export: Post "http://alloy.grafana.svc.cluster.local:4318/v1/traces": dial tcp 10.43.231.164:4318: connect: connection refused
I tried launching Allow into the same namespace but that didnt help
2024/06/18 01:13:16 traces export: Post "http://alloy.default.svc.cluster.local:4318/v1/traces": dial tcp 10.43.238.186:4318: connect: connection refused
I used the podIP (now in the same namespace)
2024/06/18 01:17:07 traces export: Post "http://10.42.2.44:4318/v1/traces": dial tcp 10.42.2.44:4318: connect: connection refused
Forcing a Test Trace
In desperation, I pivoted from Dapr and tried just shoving a test span in there
$ cat test_span.json
{
 "resourceSpans": [
   {
     "resource": {
       "attributes": [
         {
           "key": "service.name",
           "value": {
             "stringValue": "test-with-curl"
           }
         }
       ]
     },
     "scopeSpans": [
       {
         "scope": {
           "name": "manual-test"
         },
         "spans": [
           {
             "traceId": "71699b6fe85982c7c8995ea3d9c95df2",
             "spanId": "3c191d03fa8be065",
             "name": "spanitron",
             "kind": 2,
             "droppedAttributesCount": 0,
             "events": [],
             "droppedEventsCount": 0,
             "status": {
               "code": 1
             }
           }
         ]
       }
     ]
   }
 ]
}
Then port-forward and push
builder@DESKTOP-QADGF36:~/Workspaces/quickstarts/tutorials/distributed-calculator/deploy$ kubectl port-forward svc/alloy 4318:4318
Forwarding from 127.0.0.1:4318 -> 4318
Forwarding from [::1]:4318 -> 4318
^Cbuilder@DESKTOP-QADGF36:~/Workspaces/quickstarts/tutorials/distributed-calculator/deploy$ kubectl port-forward svc/alloy 4318:4318 &
[1] 24454
builder@DESKTOP-QADGF36:~/Workspaces/quickstarts/tutorials/distributed-calculator/deploy$ Forwarding from 127.0.0.1:4318 -> 4318
Forwarding from [::1]:4318 -> 4318

builder@DESKTOP-QADGF36:~/Workspaces/quickstarts/tutorials/distributed-calculator/deploy$ curl -i http://localhost:4318/v1/traces -X POST -H "Content-Type: application/json" -d @test_span.json
Handling connection for 4318
HTTP/1.1 200 OK
Content-Type: application/json
Date: Tue, 18 Jun 2024 01:20:43 GMT
Content-Length: 21

{"partialSuccess":{}}
If I use 4317, then I get:
ts=2024-06-18T01:28:53.384170175Z level=info msg="Exporting failed. Will retry the request after interval." component_path=/ component_id=otelcol.exporter.otlphttp.newrelic error="failed to make an HTTP request: Post \"otlp.nr-data.net:4317/v1/traces\": unsupported protocol scheme \"otlp.nr-data.net\"" interval=21.133584707s
ts=2024-06-18T01:29:07.018645958Z level=info msg="Exporting failed. Will retry the request after interval." component_path=/ component_id=otelcol.exporter.otlphttp.newrelic error="failed to make an HTTP request: Post \"otlp.nr-data.net:4317/v1/traces\": unsupported protocol scheme \"otlp.nr-data.net\"" interval=30.867460541s
I even switched to OTLP in the Alloy config for New Relic, still without luck (albeit no errors)
$ kubectl get cm alloy-config -o 'go-template={{index .data "config.alloy"}}'
logging {
  level = "info"
  format = "logfmt"
}

// Send to New Relic
otelcol.exporter.otlp "newrelic" {
  client {
    endpoint = "otlp.nr-data.net:4317"
    auth     = otelcol.auth.headers.nr.handler
  }
}

otelcol.auth.headers "nr" {
  header {
    key   = "api-key"
    value = "c87asdfasdfasdfasdfasdfasdf9dNRAL"
  }
}

// Collect OTLP
otelcol.receiver.otlp "httpreceiver" {
  grpc {
    endpoint = "127.0.0.1:4317"
  }

  http {
    endpoint = "127.0.0.1:4318"
  }

  output {
    metrics = [otelcol.processor.batch.default.input]
    logs    = [otelcol.processor.batch.default.input]
    traces  = [otelcol.processor.batch.default.input]
  }
}

// Process and send
otelcol.processor.batch "default" {
  // Preserve the tenant_id metadata.
  metadata_keys = ["tenant_id"]

  output {
    metrics = [otelcol.exporter.otlp.newrelic.input]
    logs    = [otelcol.exporter.otlp.newrelic.input]
    traces  = [otelcol.exporter.otlp.newrelic.input]
  }
}

// Collect
discovery.kubernetes "podmetrics" {
  role = "pod"
}

discovery.kubernetes "nodes" {
  role = "node"
}

discovery.kubernetes "services" {
  role = "service"
}

discovery.kubernetes "endpoints" {
  role = "endpoints"
}
(and I did verify c87asdfasdfasdfasdfasdfasdf9dNRAL is my current and active API key in New Relic and that is the current OTel collector URL)
Trying Groundcover
Let’s use Groundcover’s Alligator. Here we will really just skip OTel/Alloy and see if we can get Dapr to send OTel formatted traces directly through Groundcover Alligator to Groundcover APM.
$ cat appconfig.yaml.new7
apiVersion: dapr.io/v1alpha1
kind: Configuration
metadata:
  annotations:
    kubectl.kubernetes.io/last-applied-configuration: |
      {"apiVersion":"dapr.io/v1alpha1","kind":"Configuration","metadata":{"annotations":{},"creationTimestamp":"2024-06-18T00:05:40Z","generation":7,"name":"appconfig","namespace":"default","resourceVersion":"3249469","uid":"d612c9c1-46a9-4142-ac79-8d57fc836212"},"spec":{"metric":{"enabled":true},"metrics":{"enabled":true},"tracing":{"otel":{"endpointAddress":"10.42.2.44:4318","isSecure":false,"protocol":"http"},"samplingRate":"1","stdout":true}}}
  creationTimestamp: "2024-06-18T00:05:40Z"
  generation: 8
  name: appconfig
  namespace: default
  resourceVersion: "3249954"
  uid: d612c9c1-46a9-4142-ac79-8d57fc836212
spec:
  metric:
    enabled: true
  metrics:
    enabled: true
  tracing:
    otel:
      endpointAddress: groundcover-alligator.groundcover.svc.cluster.local:4318
      isSecure: false
      protocol: http
    samplingRate: "1"
    stdout: true

$ kubectl apply -f ./appconfig.yaml.new7
configuration.dapr.io/appconfig configured
I’ll rotate my Dapr application pods
$ !2195
kubectl delete pods -l app=subtract & kubectl delete pods -l app=multiply & kubectl delete pods -l app=add & kubectl delete pods -l app=divide & kubectl delete pod -l app=calculator-front-end &
[1] 29433
[2] 29434
[3] 29435
[4] 29436
[5] 29437
I port-forwarded and tested
$ !2198
kubectl port-forward `kubectl get pod -l app=calculator-front-end -o go-template='{{range .items}}{{.metadata.name}}{{end}}'` 8080:8080
Forwarding from 127.0.0.1:8080 -> 8080
Forwarding from [::1]:8080 -> 8080
Handling connection for 8080
Handling connection for 8080
Handling connection for 8080
Handling connection for 8080
This time I see traces going out
$ kubectl logs divideapp-85888845-6b9gg -c daprd | tail -n5
time="2024-06-18T10:57:41.928507273Z" level=info msg="Initializing Dapr workflow component" app_id=divideapp component="dapr (workflow.dapr/v1)" instance=divideapp-85888845-6b9gg scope=dapr.contrib type=log ver=1.13.4
time="2024-06-18T10:57:41.928564493Z" level=info msg="Workflow engine initialized." app_id=divideapp instance=divideapp-85888845-6b9gg scope=dapr.runtime type=log ver=1.13.4
time="2024-06-18T10:57:41.928750167Z" level=info msg="dapr initialized. Status: Running. Init Elapsed 1416ms" app_id=divideapp instance=divideapp-85888845-6b9gg scope=dapr.runtime type=log ver=1.13.4
time="2024-06-18T10:57:41.95201367Z" level=info msg="Placement tables updated, version: 0" app_id=divideapp instance=divideapp-85888845-6b9gg scope=dapr.runtime.actors.placement type=log ver=1.13.4
time="2024-06-18T10:59:25.524951645Z" level=info msg="[CallLocal/divideapp/divide] Trace: 78a730cdecb6c629b4a7a799a8440374 Span: 4979bed68412f026/26b27254443e8a2d Time: [2024-06-18 10:59:21.917368175 +0000 UTC m=+102.371635773 ->  2024-06-18 10:59:22.285361358 +0000 UTC m=+102.739628956] Annotations: []" instance=divideapp-85888845-6b9gg scope=dapr.runtime.trace type=log ver=1.13.4
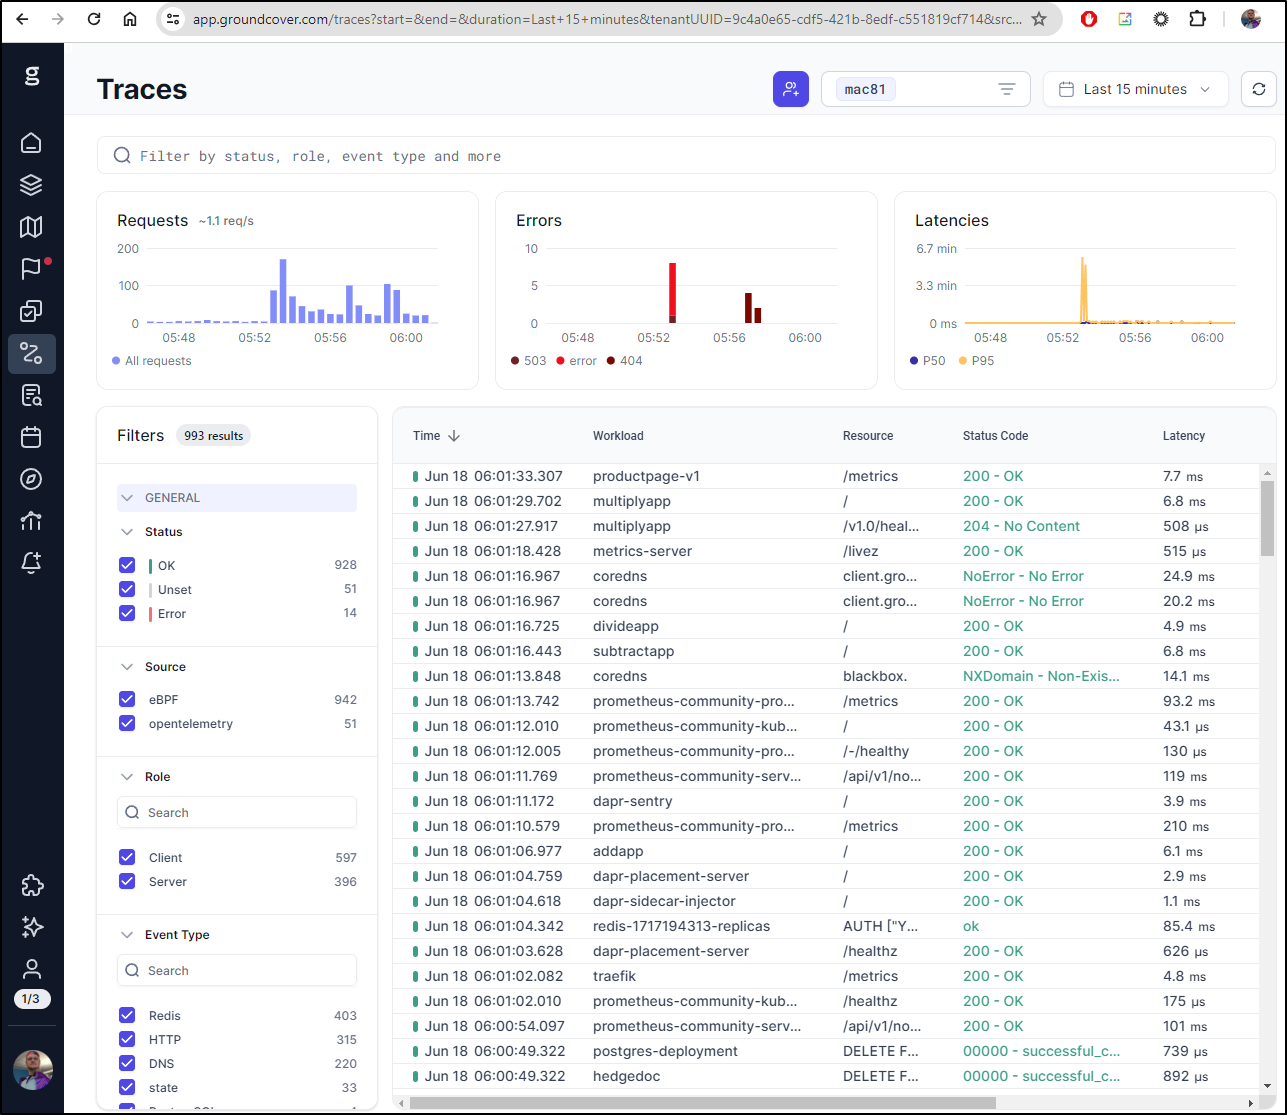
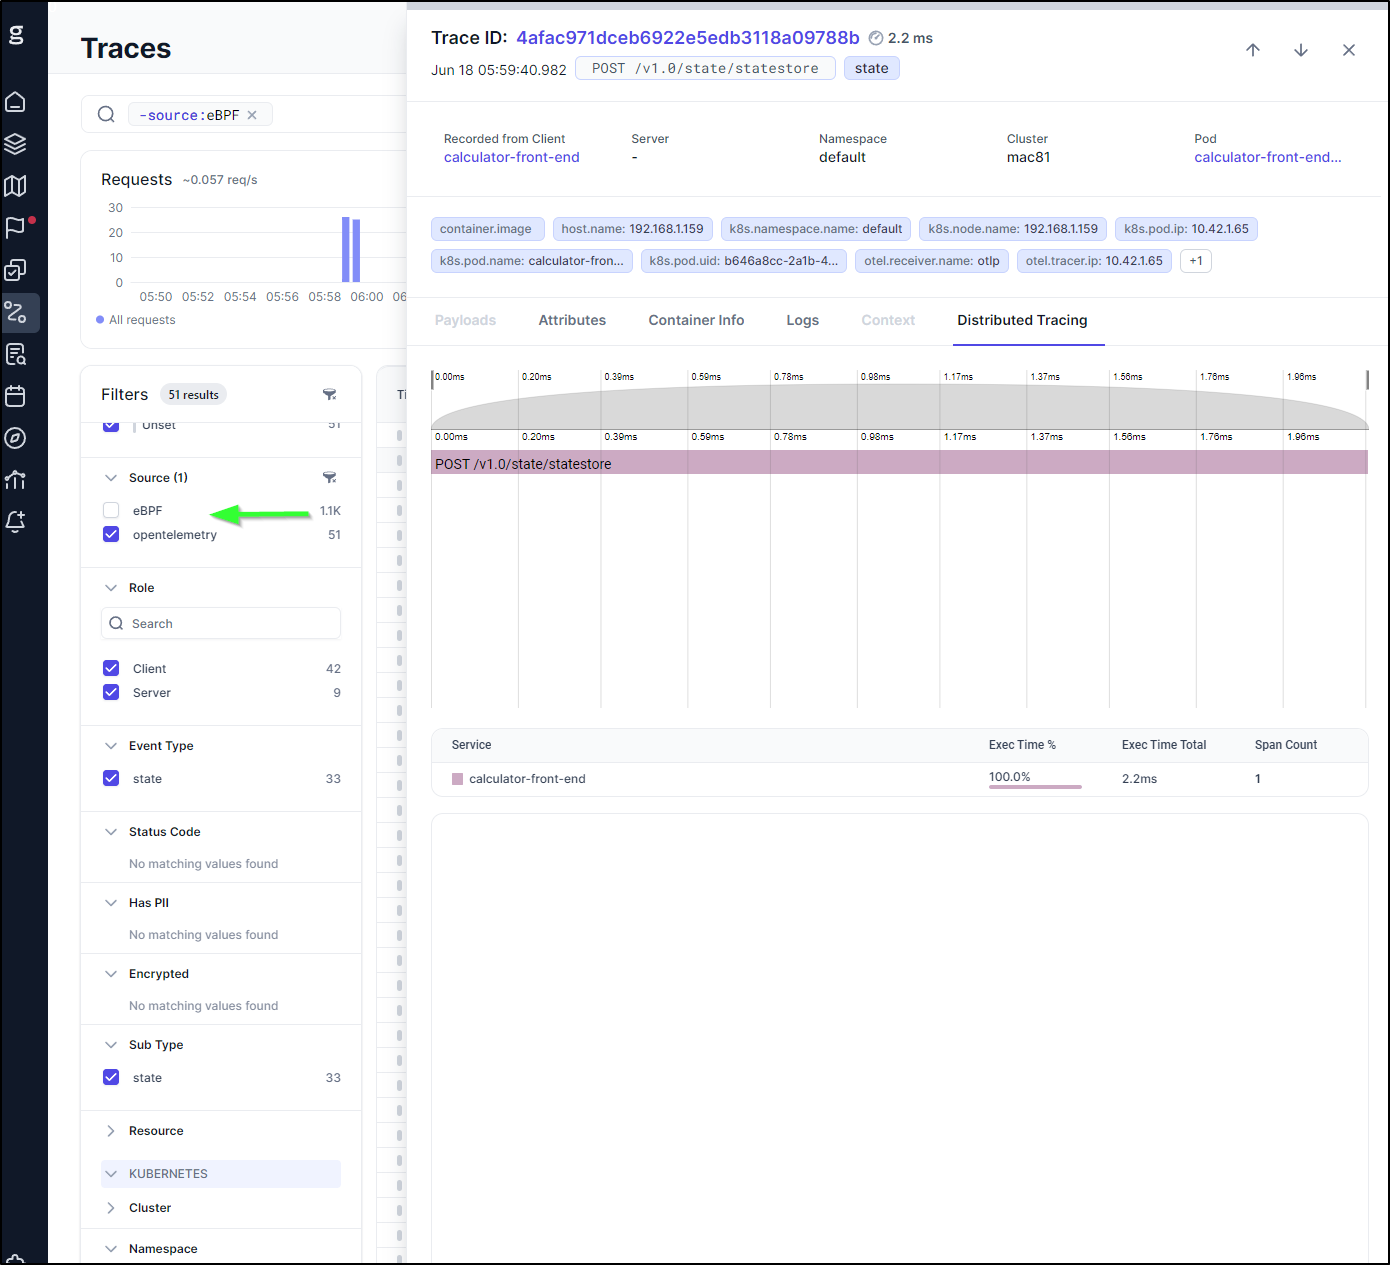
and I can see traces!
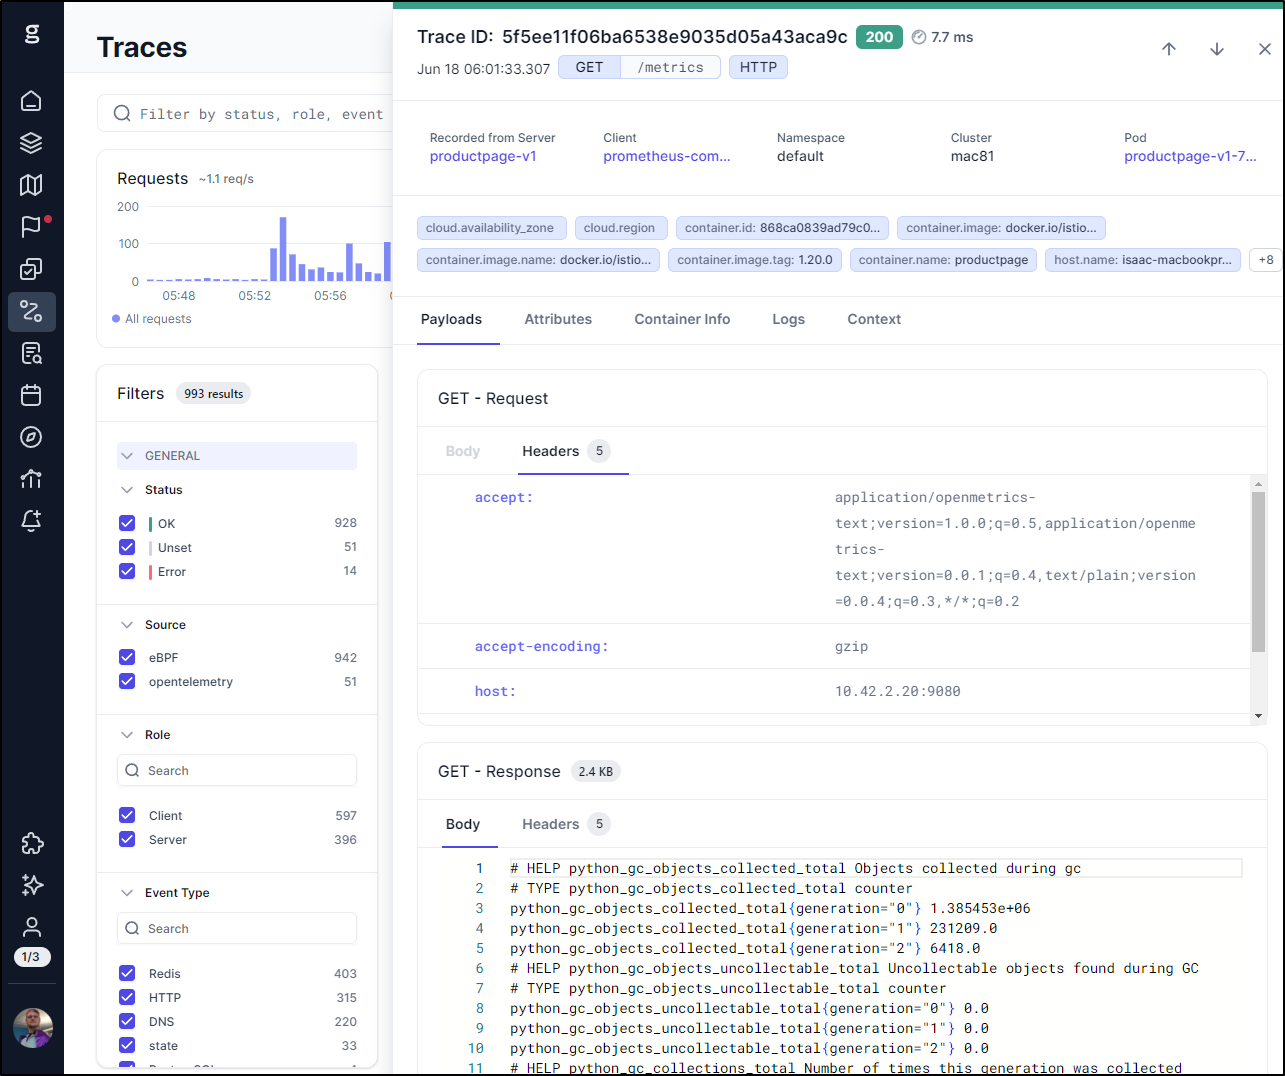
I can see the payload
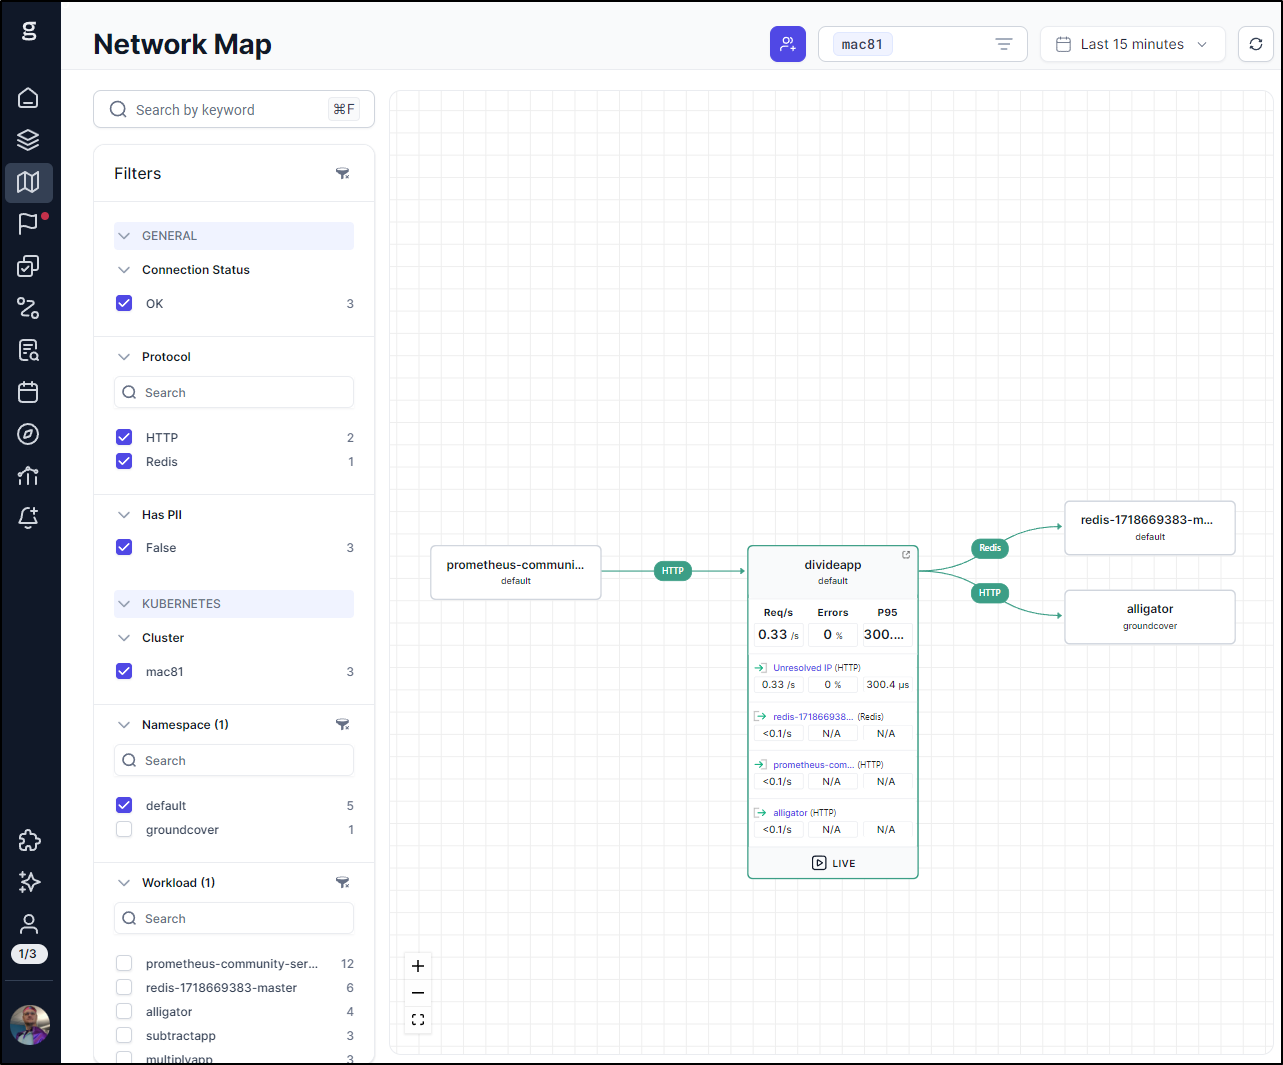
In fairness, some stuff comes via the eBPF sensor such as the network map
However, if I turn off eBPF in the Traces pane, we can see traces just from OTel
Let’s take a moment here and discuss what we’ve teased out.
First, I can send trace data with curl to Alloy and it seems to take it, but I see nothing on the New Relic side:
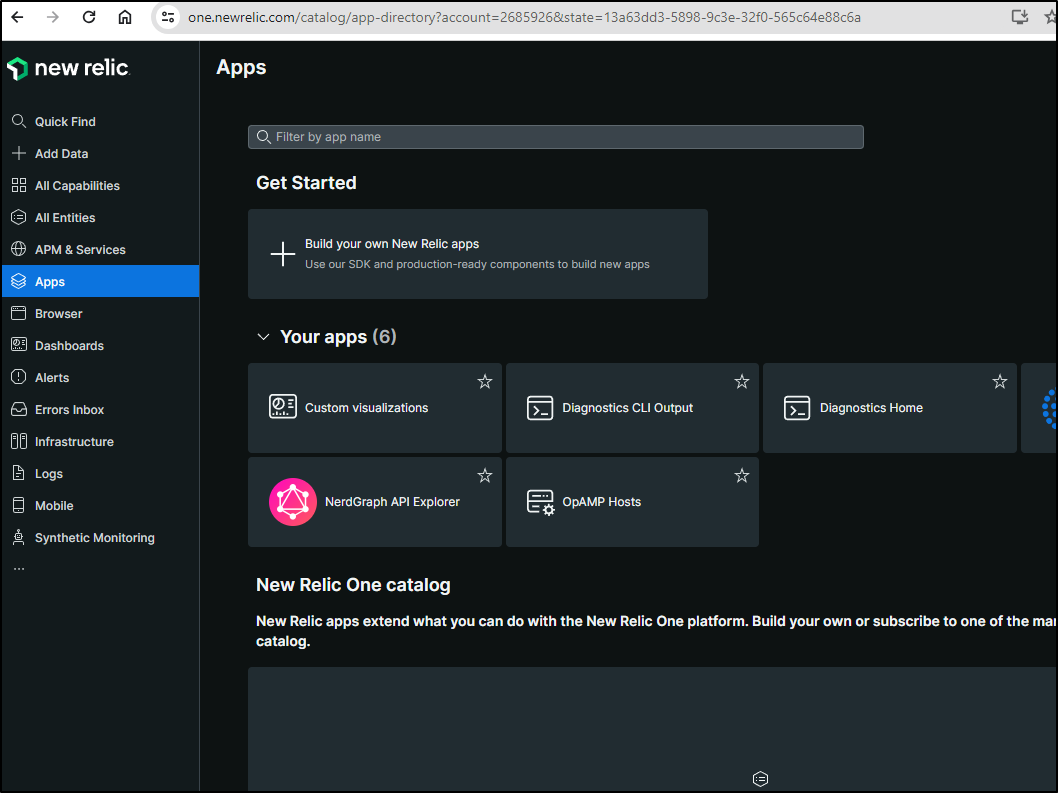
(I know from experience this page has results and a time selector if it gets any data)
I know Dapr seems to get rejected by alloy due to it just rejecting the connection. I really do think there is more than just the “additionalPorts” at play.
I know I can send traces from Dapr right to Groundcover via Alligator on 4318 (OTLP HTTP).
Let’s now try changing Allow to forward to Groundcover
Spoiler: You see I still haven’t figured out Protocol and IPs yet.
$ cat config.alloy
logging {
  level = "info"
  format = "logfmt"
}

otelcol.exporter.otlphttp "groundcover" {
  client {
    endpoint = "groundcover-alligator.groundcover.svc.cluster.local:4318"
  }
}

otelcol.receiver.otlp "httpreceiver" {
  grpc {
    endpoint = "127.0.0.1:4317"
  }

  http {
    endpoint = "127.0.0.1:4318"
  }

  output {
    metrics = [otelcol.exporter.otlphttp.groundcover.input]
    logs    = [otelcol.exporter.otlphttp.groundcover.input]
    traces  = [otelcol.exporter.otlphttp.groundcover.input]
  }
}

// Process and send
otelcol.processor.batch "default" {

  output {
    metrics = [otelcol.exporter.otlphttp.groundcover.input]
    logs    = [otelcol.exporter.otlphttp.groundcover.input]
    traces  = [otelcol.exporter.otlphttp.groundcover.input]
  }
}

discovery.kubernetes "podmetrics" {
  role = "pod"
}

discovery.kubernetes "nodes" {
  role = "node"
}

discovery.kubernetes "services" {
  role = "service"
}

discovery.kubernetes "endpoints" {
  role = "endpoints"
}
I’m now going to test against the Grafana Alloy in my default namespace by rotating the CM
$ kubectl delete cm alloy-config && kubectl create configmap alloy-config "--from-file=config.alloy=./config.alloy"
configmap "alloy-config" deleted
configmap/alloy-config created
Then rotate the Alloy pods
$ kubectl delete pods -l app.kubernetes.io/instance=alloy
pod "alloy-g99td" deleted
pod "alloy-sbkdw" deleted
pod "alloy-nbtl4" deleted

$ kubectl get pods | tail -n3
alloy-xn5zj                                                    2/2     Running             0             43s
alloy-vrjtz                                                    2/2     Running             0             41s
alloy-mxx6s                                                    2/2     Running             0             36s
I’ll update the appconfig for Dapr
$ cat appconfig.yaml.new8
apiVersion: dapr.io/v1alpha1
kind: Configuration
metadata:
  annotations:
    kubectl.kubernetes.io/last-applied-configuration: |
      {"apiVersion":"dapr.io/v1alpha1","kind":"Configuration","metadata":{"annotations":{},"creationTimestamp":"2024-06-18T00:05:40Z","generation":8,"name":"appconfig","namespace":"default","resourceVersion":"3249954","uid":"d612c9c1-46a9-4142-ac79-8d57fc836212"},"spec":{"metric":{"enabled":true},"metrics":{"enabled":true},"tracing":{"otel":{"endpointAddress":"groundcover-alligator.groundcover.svc.cluster.local:4318","isSecure":false,"protocol":"http"},"samplingRate":"1","stdout":true}}}
  creationTimestamp: "2024-06-18T00:05:40Z"
  generation: 9
  name: appconfig
  namespace: default
  resourceVersion: "3282581"
  uid: d612c9c1-46a9-4142-ac79-8d57fc836212
spec:
  metric:
    enabled: true
  metrics:
    enabled: true
  tracing:
    otel:
      endpointAddress: alloy.default.svc.cluster.local:4318
      isSecure: false
      protocol: http
    samplingRate: "1"
    stdout: true
Then push it and rotate the Dapr app pods
$ kubectl apply -f appconfig.yaml.new8 && !2195
kubectl apply -f appconfig.yaml.new8 && kubectl delete pods -l app=subtract & kubectl delete pods -l app=multiply & kubectl delete pods -l app=add & kubectl delete pods -l app=divide & kubectl delete pod -l app=calculator-front-end &
[1] 1125
[2] 1126
[3] 1128
[4] 1129
[5] 1130
After they rotate, do some math
$ !2198
kubectl port-forward `kubectl get pod -l app=calculator-front-end -o go-template='{{range .items}}{{.metadata.name}}{{end}}'` 8080:8080
Forwarding from 127.0.0.1:8080 -> 8080
Forwarding from [::1]:8080 -> 8080
Handling connection for 8080
Handling connection for 8080
Handling connection for 8080
Handling connection for 8080
And… I’m still rejected
$ kubectl logs multiplyapp-64ff57bb6d-p94vz -c daprd | tail -n5
time="2024-06-18T11:18:17.07721086Z" level=info msg="[CallLocal/multiplyapp/multiply] Trace: 53f77df48b41e12a1a1a232d271903a8 Span: 14686d76143d8680/e7dafc67f4eeffde Time: [2024-06-18 11:18:12.393694112 +0000 UTC m=+106.995820539 ->  2024-06-18 11:18:13.402001729 +0000 UTC m=+108.004128156] Annotations: []" instance=multiplyapp-64ff57bb6d-p94vz scope=dapr.runtime.trace type=log ver=1.13.4
time="2024-06-18T11:18:17.077269497Z" level=info msg="[CallLocal/multiplyapp/multiply] Trace: 65a3511a0c411d287f55a150a356f586 Span: 79de2e0d1e85ef92/8423cb449afa500f Time: [2024-06-18 11:18:12.950099409 +0000 UTC m=+107.552225848 ->  2024-06-18 11:18:13.956351579 +0000 UTC m=+108.558478018] Annotations: []" instance=multiplyapp-64ff57bb6d-p94vz scope=dapr.runtime.trace type=log ver=1.13.4
2024/06/18 11:18:17 traces export: Post "http://alloy.default.svc.cluster.local:4318/v1/traces": dial tcp 10.43.238.186:4318: connect: connection refused
time="2024-06-18T11:18:22.077990997Z" level=info msg="[CallLocal/multiplyapp/multiply] Trace: d4aa01d941051cd6c32a5946af9e1166 Span: 4ad83bc66477916d/0d97f3be0a75f2bc Time: [2024-06-18 11:18:20.287691485 +0000 UTC m=+114.889817883 ->  2024-06-18 11:18:21.292760766 +0000 UTC m=+115.894887164] Annotations: []" instance=multiplyapp-64ff57bb6d-p94vz scope=dapr.runtime.trace type=log ver=1.13.4
2024/06/18 11:18:22 traces export: Post "http://alloy.default.svc.cluster.local:4318/v1/traces": dial tcp 10.43.238.186:4318: connect: connection refused
I’ll pivot to a manual test
builder@DESKTOP-QADGF36:~/Workspaces/quickstarts/tutorials/distributed-calculator/deploy$ Forwarding from 127.0.0.1:4318 -> 4318
Forwarding from [::1]:4318 -> 4318

builder@DESKTOP-QADGF36:~/Workspaces/quickstarts/tutorials/distributed-calculator/deploy$ curl -i http://localhost:4318/v1/traces -X POST -H "Content-Type: application/json" -d @test_span.json
Handling connection for 4318
HTTP/1.1 200 OK
Content-Type: application/json
Date: Tue, 18 Jun 2024 11:19:42 GMT
Content-Length: 21

{"partialSuccess":{}}builder@DESKTOP-QADGF36:~/Workspaces/quickstarts/tutorials/distributed-calculator/deploy$ curl -i http://localhost:4318/v1/traces -X POST -H "Content-Type: application/json" -d @test_span.json
Handling connection for 4318
HTTP/1.1 200 OK
Content-Type: application/json
Date: Tue, 18 Jun 2024 11:19:44 GMT
Content-Length: 21

{"partialSuccess":{}}builder@DESKTOP-QADGF36:~/Workspaces/quickstarts/tutorials/distributed-calculator/deploy$ curl -i http://localhost:4318/v1/traces -X POST -H "Content-Type: application/json" -d @test_span.json
Handling connection for 4318
HTTP/1.1 200 OK
Content-Type: application/json
Date: Tue, 18 Jun 2024 11:19:45 GMT
Content-Length: 21

{"partialSuccess":{}}
And as before, that is rejected
$ kubectl logs alloy-xn5zj | tail -n 10
ts=2024-06-18T11:19:47.598833272Z level=info msg="Exporting failed. Will retry the request after interval." component_path=/ component_id=otelcol.exporter.otlphttp.groundcover error="failed to make an HTTP request: Post \"groundcover-alligator.groundcover.svc.cluster.local:4318/v1/traces\": unsupported protocol scheme \"groundcover-alligator.groundcover.svc.cluster.local\"" interval=5.713878508s
ts=2024-06-18T11:19:49.411758337Z level=info msg="Exporting failed. Will retry the request after interval." component_path=/ component_id=otelcol.exporter.otlphttp.groundcover error="failed to make an HTTP request: Post \"groundcover-alligator.groundcover.svc.cluster.local:4318/v1/traces\": unsupported protocol scheme \"groundcover-alligator.groundcover.svc.cluster.local\"" interval=8.569995123s
ts=2024-06-18T11:19:51.612965469Z level=info msg="Exporting failed. Will retry the request after interval." component_path=/ component_id=otelcol.exporter.otlphttp.groundcover error="failed to make an HTTP request: Post \"groundcover-alligator.groundcover.svc.cluster.local:4318/v1/traces\": unsupported protocol scheme \"groundcover-alligator.groundcover.svc.cluster.local\"" interval=8.329813192s
ts=2024-06-18T11:19:52.292504654Z level=info msg="Exporting failed. Will retry the request after interval." component_path=/ component_id=otelcol.exporter.otlphttp.groundcover error="failed to make an HTTP request: Post \"groundcover-alligator.groundcover.svc.cluster.local:4318/v1/traces\": unsupported protocol scheme \"groundcover-alligator.groundcover.svc.cluster.local\"" interval=10.199574227s
ts=2024-06-18T11:19:53.31499439Z level=info msg="Exporting failed. Will retry the request after interval." component_path=/ component_id=otelcol.exporter.otlphttp.groundcover error="failed to make an HTTP request: Post \"groundcover-alligator.groundcover.svc.cluster.local:4318/v1/traces\": unsupported protocol scheme \"groundcover-alligator.groundcover.svc.cluster.local\"" interval=14.291983831s
ts=2024-06-18T11:19:57.9834503Z level=info msg="Exporting failed. Will retry the request after interval." component_path=/ component_id=otelcol.exporter.otlphttp.groundcover error="failed to make an HTTP request: Post \"groundcover-alligator.groundcover.svc.cluster.local:4318/v1/traces\": unsupported protocol scheme \"groundcover-alligator.groundcover.svc.cluster.local\"" interval=16.417829196s
ts=2024-06-18T11:19:59.944931532Z level=info msg="Exporting failed. Will retry the request after interval." component_path=/ component_id=otelcol.exporter.otlphttp.groundcover error="failed to make an HTTP request: Post \"groundcover-alligator.groundcover.svc.cluster.local:4318/v1/traces\": unsupported protocol scheme \"groundcover-alligator.groundcover.svc.cluster.local\"" interval=15.875019328s
ts=2024-06-18T11:20:02.494060004Z level=info msg="Exporting failed. Will retry the request after interval." component_path=/ component_id=otelcol.exporter.otlphttp.groundcover error="failed to make an HTTP request: Post \"groundcover-alligator.groundcover.svc.cluster.local:4318/v1/traces\": unsupported protocol scheme \"groundcover-alligator.groundcover.svc.cluster.local\"" interval=13.205459785s
ts=2024-06-18T11:20:07.608539003Z level=info msg="Exporting failed. Will retry the request after interval." component_path=/ component_id=otelcol.exporter.otlphttp.groundcover error="failed to make an HTTP request: Post \"groundcover-alligator.groundcover.svc.cluster.local:4318/v1/traces\": unsupported protocol scheme \"groundcover-alligator.groundcover.svc.cluster.local\"" interval=19.486223513s
ts=2024-06-18T11:20:14.402291702Z level=info msg="Exporting failed. Will retry the request after interval." component_path=/ component_id=otelcol.exporter.otlphttp.groundcover error="failed to make an HTTP request: Post \"groundcover-alligator.groundcover.svc.cluster.local:4318/v1/traces\": unsupported protocol scheme \"groundcover-alligator.groundcover.svc.cluster.local\"" interval=24.099153357s
There must be something I’m missing
$ helm get values alloy
USER-SUPPLIED VALUES:
alloy:
  configMap:
    create: false
    key: config.alloy
    name: alloy-config
  extraPorts:
  - name: otelgrpc
    port: 4317
    protocol: TCP
    targetPort: 4317
  - name: otelhttp
    port: 4318
    protocol: TCP
    targetPort: 4318
  - name: zipkin
    port: 9411
    protocol: TCP
    targetPort: 9411
  listenPort: 12345

$ kubectl get cm alloy-config -o yaml
apiVersion: v1
data:
  config.alloy: |
    logging {
      level = "info"
      format = "logfmt"
    }

    otelcol.exporter.otlphttp "groundcover" {
      client {
        endpoint = "groundcover-alligator.groundcover.svc.cluster.local:4318"
      }
    }

    otelcol.receiver.otlp "httpreceiver" {
      grpc {
        endpoint = "127.0.0.1:4317"
      }

      http {
        endpoint = "127.0.0.1:4318"
      }

      output {
        metrics = [otelcol.exporter.otlphttp.groundcover.input]
        logs    = [otelcol.exporter.otlphttp.groundcover.input]
        traces  = [otelcol.exporter.otlphttp.groundcover.input]
      }
    }

    // Process and send
    otelcol.processor.batch "default" {

      output {
        metrics = [otelcol.exporter.otlphttp.groundcover.input]
        logs    = [otelcol.exporter.otlphttp.groundcover.input]
        traces  = [otelcol.exporter.otlphttp.groundcover.input]
      }
    }

    discovery.kubernetes "podmetrics" {
      role = "pod"
    }

    discovery.kubernetes "nodes" {
      role = "node"
    }

    discovery.kubernetes "services" {
      role = "service"
    }

    discovery.kubernetes "endpoints" {
      role = "endpoints"
    }
kind: ConfigMap
metadata:
  creationTimestamp: "2024-06-18T11:12:55Z"
  name: alloy-config
  namespace: default
  resourceVersion: "3283858"
  uid: 5db452ca-a2ed-432a-ae8a-234cc8081d90
Pivot to Docker and Linux
Clearly something is not working with Kubernetes. Whether it is a helm value or a cluster issue, I wanted to take my “test” cluster out of the mix and start fresh.
We can install Alloy on to Linux or even Docker
Docker install
The standard run looks like
docker run \
  -v <CONFIG_FILE_PATH>:/etc/alloy/config.alloy \
  -p 12345:12345 \
  grafana/alloy:latest \
    run --server.http.listen-addr=0.0.0.0:12345 --storage.path=/var/lib/alloy/data \
    /etc/alloy/config.alloy
However, that assumes we have a config.alloy all set up.
I’ll use the one I used with Kubernetes to start, but remove the Kubernetes discovery blocks. I’m adding a docker block, but at this point, it is not used
builder@builder-T100:~/grafanaalloy$ pwd
/home/builder/grafanaalloy
builder@builder-T100:~/grafanaalloy$ cat config.alloy
logging {
  level = "info"
  format = "logfmt"
}

// Send to New Relic
otelcol.exporter.otlphttp "newrelic" {
  client {
    endpoint = "otlp.nr-data.net:4318"
    auth     = otelcol.auth.headers.nr.handler
  }
}

otelcol.auth.headers "nr" {
  header {
    key   = "api-key"
    value = "c87asdfasdfasdfasdfasdfasdf9dNRAL"
  }
}

// Collect OTLP
otelcol.receiver.otlp "httpreceiver" {
  grpc {
    endpoint = "127.0.0.1:4317"
  }

  http {
    endpoint = "127.0.0.1:4318"
  }

  output {
    metrics = [otelcol.processor.batch.default.input]
    logs    = [otelcol.processor.batch.default.input]
    traces  = [otelcol.processor.batch.default.input]
  }
}

// Process and send
otelcol.processor.batch "default" {

  output {
    metrics = [otelcol.exporter.otlphttp.newrelic.input]
    logs    = [otelcol.exporter.otlphttp.newrelic.input]
    traces  = [otelcol.exporter.otlphttp.newrelic.input]
  }
}

// Collect
discovery.docker "containers" {
  host = "unix:///var/run/docker.sock"
}
I’ll now try and launch it and forwrad the ports for OTLP using 6417 and 6418
builder@builder-T100:~/grafanaalloy$ docker run -v /home/builder/grafanaalloy/config.alloy:/etc/alloy/config.alloy -p 12345:12345 -p 64317:4317 -p 64318:4318 grafana/alloy:latest  run --server.http.listen-addr=0.0.0.0:12345 --storage.path=/var/lib/alloy/data /etc/alloy/config.alloy
Unable to find image 'grafana/alloy:latest' locally
latest: Pulling from grafana/alloy
cd0bff360add: Pull complete
788f0a6dc65c: Pull complete
43ba962bdbab: Pull complete
ba1af2e69e74: Pull complete
d30a816c2790: Pull complete
1b408b7e8c10: Pull complete
8763e0e32f38: Pull complete
1785eab405ac: Pull complete
6bdf6795d598: Pull complete
7da8708838d9: Pull complete
4500806aa969: Pull complete
Digest: sha256:c3dac4e26471472a3a7167ff9ce1a05190866fc9ac1cdb7dca9cf4181bf526e3
Status: Downloaded newer image for grafana/alloy:latest
ts=2024-06-19T12:10:19.287607804Z level=info "boringcrypto enabled"=false
ts=2024-06-19T12:10:19.287741718Z level=info msg="running usage stats reporter"
ts=2024-06-19T12:10:19.287751617Z level=info msg="starting complete graph evaluation" controller_path=/ controller_id="" trace_id=e62b2cc42d331c3633d41e2416799bed
ts=2024-06-19T12:10:19.28776917Z level=info msg="finished node evaluation" controller_path=/ controller_id="" trace_id=e62b2cc42d331c3633d41e2416799bed node_id=otelcol.auth.headers.nr duration=74.715437ms
ts=2024-06-19T12:10:19.287780756Z level=info msg="finished node evaluation" controller_path=/ controller_id="" trace_id=e62b2cc42d331c3633d41e2416799bed node_id=otelcol.exporter.otlphttp.newrelic duration=64.320508ms
ts=2024-06-19T12:10:19.287795444Z level=info msg="finished node evaluation" controller_path=/ controller_id="" trace_id=e62b2cc42d331c3633d41e2416799bed node_id=otelcol.processor.batch.default duration=28.698604ms
ts=2024-06-19T12:10:19.287804218Z level=info msg="finished node evaluation" controller_path=/ controller_id="" trace_id=e62b2cc42d331c3633d41e2416799bed node_id=otelcol.receiver.otlp.httpreceiver duration=3.666969ms
ts=2024-06-19T12:10:19.287811714Z level=info msg="finished node evaluation" controller_path=/ controller_id="" trace_id=e62b2cc42d331c3633d41e2416799bed node_id=tracing duration=17.941µs
ts=2024-06-19T12:10:19.287819029Z level=info msg="finished node evaluation" controller_path=/ controller_id="" trace_id=e62b2cc42d331c3633d41e2416799bed node_id=labelstore duration=12.287µs
ts=2024-06-19T12:10:19.287826444Z level=info msg="finished node evaluation" controller_path=/ controller_id="" trace_id=e62b2cc42d331c3633d41e2416799bed node_id=otel duration=4.849µs
ts=2024-06-19T12:10:19.287833831Z level=info msg="finished node evaluation" controller_path=/ controller_id="" trace_id=e62b2cc42d331c3633d41e2416799bed node_id=discovery.docker.containers duration=14.464458ms
ts=2024-06-19T12:10:19.287845027Z level=info msg="finished node evaluation" controller_path=/ controller_id="" trace_id=e62b2cc42d331c3633d41e2416799bed node_id=logging duration=716.504µs
ts=2024-06-19T12:10:19.288952379Z level=info msg="finished node evaluation" controller_path=/ controller_id="" trace_id=e62b2cc42d331c3633d41e2416799bed node_id=remotecfg duration=1.090131ms
ts=2024-06-19T12:10:19.289037754Z level=info msg="applying non-TLS config to HTTP server" service=http
ts=2024-06-19T12:10:19.289054653Z level=info msg="finished node evaluation" controller_path=/ controller_id="" trace_id=e62b2cc42d331c3633d41e2416799bed node_id=http duration=63.821µs
ts=2024-06-19T12:10:19.289081001Z level=info msg="finished node evaluation" controller_path=/ controller_id="" trace_id=e62b2cc42d331c3633d41e2416799bed node_id=ui duration=9.522µs
ts=2024-06-19T12:10:19.289111613Z level=info msg="finished node evaluation" controller_path=/ controller_id="" trace_id=e62b2cc42d331c3633d41e2416799bed node_id=cluster duration=16.504µs
ts=2024-06-19T12:10:19.289126614Z level=info msg="finished complete graph evaluation" controller_path=/ controller_id="" trace_id=e62b2cc42d331c3633d41e2416799bed duration=192.66261ms
ts=2024-06-19T12:10:19.291512549Z level=info msg="scheduling loaded components and services"
ts=2024-06-19T12:10:19.308439839Z level=info msg="starting cluster node" peers="" advertise_addr=127.0.0.1:12345
ts=2024-06-19T12:10:19.319911207Z level=info msg="peers changed" new_peers=a471303c8093
ts=2024-06-19T12:10:19.354123708Z level=info msg="Starting GRPC server" component_path=/ component_id=otelcol.receiver.otlp.httpreceiver endpoint=127.0.0.1:4317
ts=2024-06-19T12:10:19.364902131Z level=info msg="Starting HTTP server" component_path=/ component_id=otelcol.receiver.otlp.httpreceiver endpoint=127.0.0.1:4318
ts=2024-06-19T12:10:19.368361694Z level=info msg="now listening for http traffic" service=http addr=0.0.0.0:12345
ts=2024-06-19T12:10:19.394213174Z level=error msg="Unable to refresh target groups" component_path=/ component_id=discovery.docker.containers err="error while listing containers: Cannot connect to the Docker daemon at unix:///var/run/docker.sock. Is the docker daemon running?"
That last line error Cannot connect to the Docker daemon is because we neglected to add --priveledged. Let’s fix that and also run this as a daemon (background)
$ docker run -d --privileged -v /home/builder/grafanaalloy/config.alloy:/etc/alloy/config.alloy -p 12345:12345 -p 64317:4317 -p 64318:4318 grafana/alloy:latest  run --server.http.listen-a
ddr=0.0.0.0:12345 --storage.path=/var/lib/alloy/data /etc/alloy/config.alloy
d99cc2dab7689a9e5516a20c78c4eacc6e48ca2fd03f39c072747fc5354afcc6
I can now see it running and fowarding ports

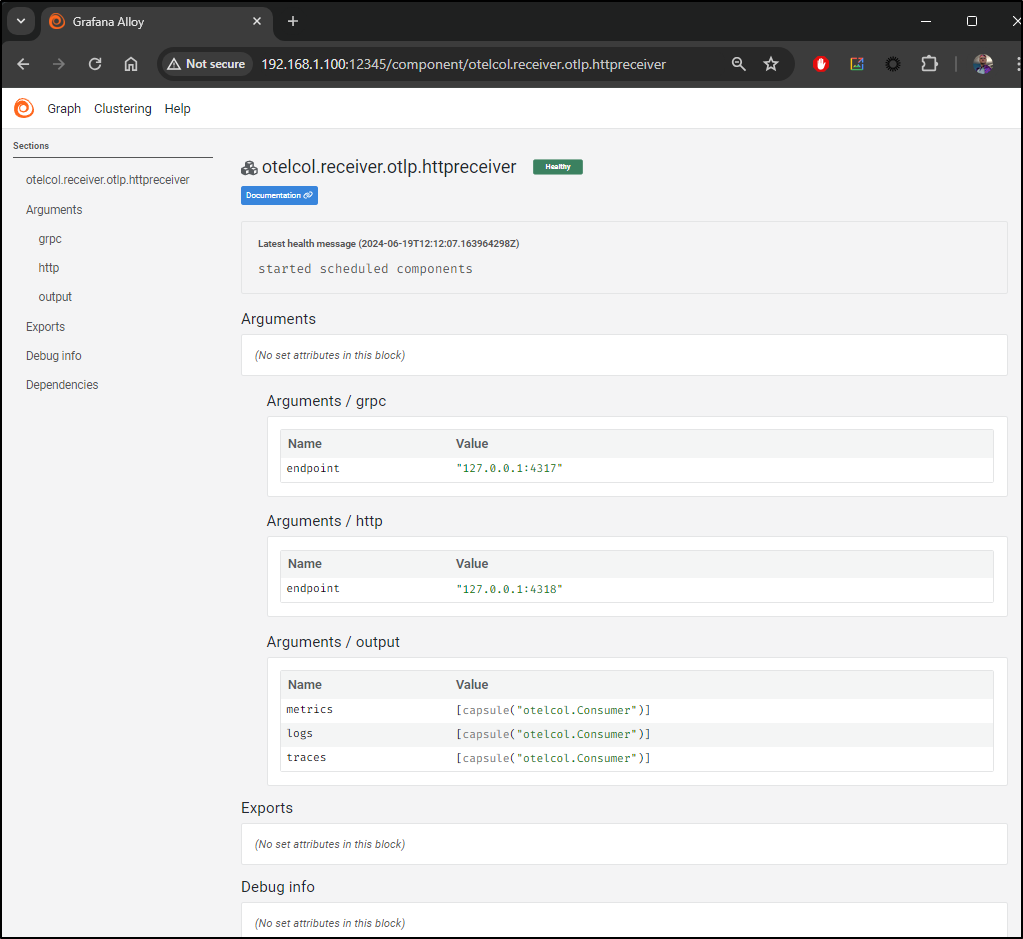
The UI shows it’s running

I can verify the httpreceiver
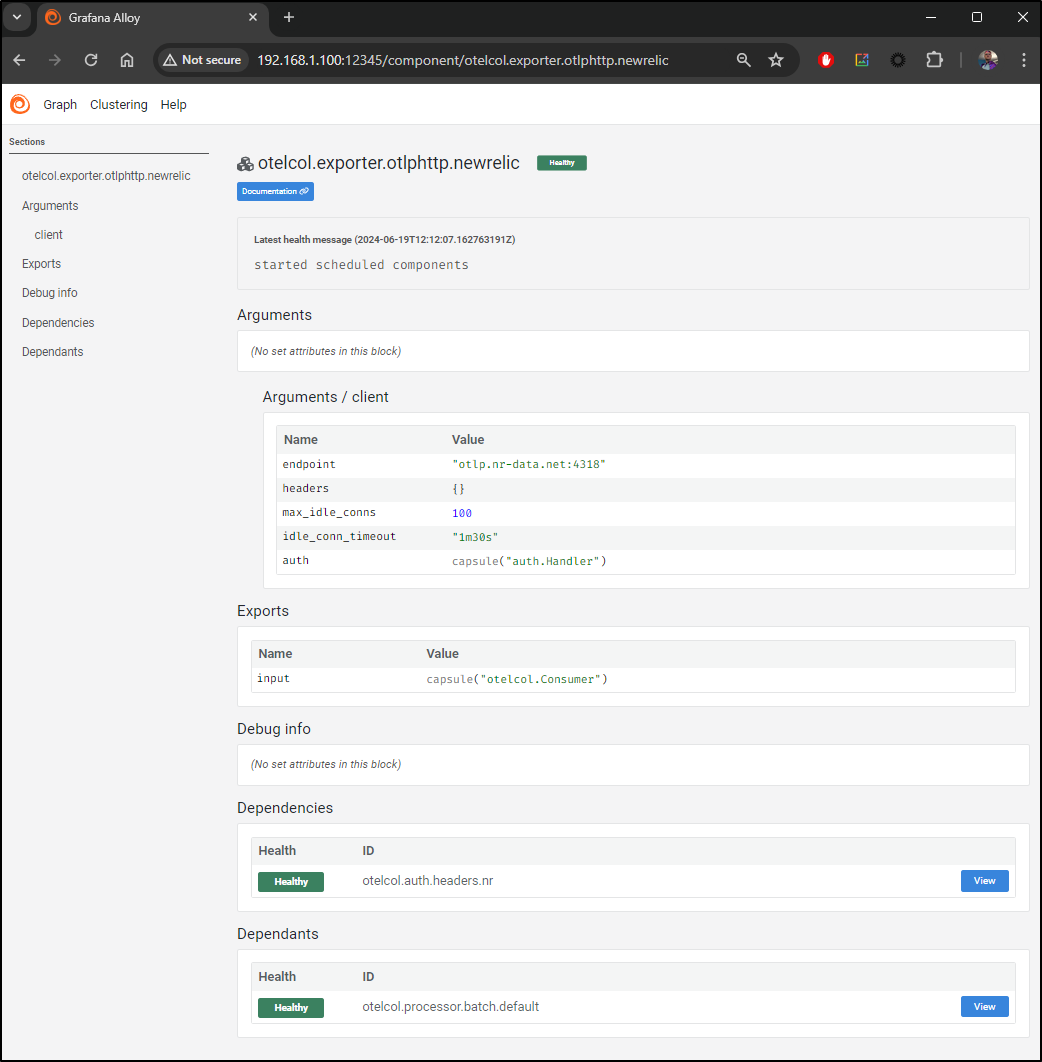
Lastly, I can verify my New Relic export block is there (by way of the batch processor)
I’ll then update my Dapr config and rotate pods
$ cat appconfig.yaml.new9
apiVersion: dapr.io/v1alpha1
kind: Configuration
metadata:
  annotations:
    kubectl.kubernetes.io/last-applied-configuration: |
      {"apiVersion":"dapr.io/v1alpha1","kind":"Configuration","metadata":{"annotations":{},"creationTimestamp":"2024-06-18T00:05:40Z","generation":9,"name":"appconfig","namespace":"default","resourceVersion":"3282581","uid":"d612c9c1-46a9-4142-ac79-8d57fc836212"},"spec":{"metric":{"enabled":true},"metrics":{"enabled":true},"tracing":{"otel":{"endpointAddress":"alloy.default.svc.cluster.local:4318","isSecure":false,"protocol":"http"},"samplingRate":"1","stdout":true}}}
  creationTimestamp: "2024-06-18T00:05:40Z"
  generation: 10
  name: appconfig
  namespace: default
  resourceVersion: "3284155"
  uid: d612c9c1-46a9-4142-ac79-8d57fc836212
spec:
  metric:
    enabled: true
  metrics:
    enabled: true
  tracing:
    otel:
      endpointAddress: 192.168.1.100:64318
      isSecure: false
      protocol: http
    samplingRate: "1"
    stdout: true
$ kubectl apply -f ./appconfig.yaml.new9
configuration.dapr.io/appconfig configured


$ kubectl delete pods -l app=subtract & kubectl delete pods -l app=multiply & kubectl delete pods -l app=add & kubectl delete pods -l app=divide & kubectl delete pod -l app=calculator-front-end &
[1] 6750
[2] 6751
[3] 6753
[4] 6754
[5] 6755
Like before, I forward to the calculator and do some math
$ kubectl port-forward `kubectl get pod -l app=calculator-front-end -o go-template='{{range .items}}{{.metadata.name}}{{end}}'` 8080:8080
Forwarding from 127.0.0.1:8080 -> 8080
Forwarding from [::1]:8080 -> 8080
And unsuprisingly, it too is rejecting traffic!
$ kubectl logs divideapp-85888845-nlxkv -c daprd | tail -n3
2024/06/19 12:19:48 traces export: Post "http://192.168.1.100:64318/v1/traces": dial tcp 192.168.1.100:64318: connect: connection refused
time="2024-06-19T12:19:58.508990382Z" level=info msg="[CallLocal/divideapp/divide] Trace: 0ba51f7e024663210368d2699392ee92 Span: 6729a6df61d4e85d/9d30a83b709437d6 Time: [2024-06-19 12:19:55.345038681 +0000 UTC m=+137.031441778 ->  2024-06-19 12:19:55.348750224 +0000 UTC m=+137.035153321] Annotations: []" instance=divideapp-85888845-nlxkv scope=dapr.runtime.trace type=log ver=1.13.4
2024/06/19 12:19:58 traces export: Post "http://192.168.1.100:64318/v1/traces": dial tcp 192.168.1.100:64318: connect: connection refused
I’m questioning the listen ports
otelcol.receiver.otlp "httpreceiver" {
  grpc {
    endpoint = "127.0.0.1:4317"
  }

  http {
    endpoint = "127.0.0.1:4318"
  }
I’m wondering if they should be 0.0.0.0 as I review the docs
I updated the file
builder@builder-T100:~/grafanaalloy$ cat config.alloy
logging {
  level = "info"
  format = "logfmt"
}

// Send to New Relic
otelcol.exporter.otlphttp "newrelic" {
  client {
    endpoint = "otlp.nr-data.net:4318"
    auth     = otelcol.auth.headers.nr.handler
  }
}

otelcol.auth.headers "nr" {
  header {
    key   = "api-key"
    value = "c87asdfasdfasdfasdfasdfasdf9dNRAL"
  }
}

// Collect OTLP
otelcol.receiver.otlp "httpreceiver" {
  grpc {
    endpoint = "0.0.0.0:4317"
  }

  http {
    endpoint = "0.0.0.0:4318"
  }

  output {
    metrics = [otelcol.processor.batch.default.input]
    logs    = [otelcol.processor.batch.default.input]
    traces  = [otelcol.processor.batch.default.input]
  }
}

// Process and send
otelcol.processor.batch "default" {

  output {
    metrics = [otelcol.exporter.otlphttp.newrelic.input]
    logs    = [otelcol.exporter.otlphttp.newrelic.input]
    traces  = [otelcol.exporter.otlphttp.newrelic.input]
  }
}

// Collect
discovery.docker "containers" {
  host = "unix:///var/run/docker.sock"
}
Killed and removed the running Alloy instance
builder@builder-T100:~/grafanaalloy$ docker stop nice_zhukovsky
nice_zhukovsky
builder@builder-T100:~/grafanaalloy$ docker rm nice_zhukovsky
nice_zhukovsky
builder@builder-T100:~/grafanaalloy$ docker rm nice_zhukovsky
Error response from daemon: No such container: nice_zhukovsky
Then launched again
$ docker run -d --privileged -v /home/builder/grafanaalloy/config.alloy:/etc/alloy/config.alloy -p 12345:12345 -p 64317:4317 -p 64318:4318 grafana/alloy:latest  run --server.http.listen-addr=0.0.0.0:12345 --storage.path=/var/lib/alloy/data /etc/alloy/config.alloy
609ca663275325be7b0496c436c363694f3ca2f8b2dfe0b969a68f4ecfac3681
I’ll (just for good mearsure) rotate the pods and do some calculations again
$ kubectl delete pods -l app=subtract & kubectl delete pods -l app=multiply & kubectl delete pods -l app=add & kubectl delete pods -l app=divide & kubectl delete pod -l app=calculator-front-end & sleep 10 && kubectl port-forward `kubectl get pod -l app=calculator-front-end -o go-template='{{range .items}}{{.metadata.name}}{{end}}'` 8080:8080
[1] 8622
[2] 8623
[3] 8624
[4] 8625
[5] 8626
pod "divideapp-85888845-nlxkv" deleted
pod "multiplyapp-64ff57bb6d-5vn6h" deleted
pod "calculator-front-end-6967fc9454-zlfrn" deleted
pod "addapp-5b74bb667-966k4" deleted
pod "subtractapp-59459c5c96-p6lk5" deleted
[5]+  Done                    kubectl delete pod -l app=calculator-front-end
Forwarding from 127.0.0.1:8080 -> 8080
Forwarding from [::1]:8080 -> 8080
This time it seemed to send data
$ kubectl logs divideapp-85888845-q44tj -c daprd | tail -n10
time="2024-06-19T12:28:10.885613447Z" level=info msg="Configuring actors placement provider 'placement'. Configuration: 'placement:dapr-placement-server.dapr-system.svc.cluster.local:50005'" app_id=divideapp instance=divideapp-85888845-q44tj scope=dapr.runtime.actor type=log ver=1.13.4
time="2024-06-19T12:28:10.885664913Z" level=info msg="Configuring actor reminders provider 'default'. Configuration: ''" app_id=divideapp instance=divideapp-85888845-q44tj scope=dapr.runtime.actor type=log ver=1.13.4
time="2024-06-19T12:28:10.885730582Z" level=info msg="Actor runtime started. Actor idle timeout: 1h0m0s. Actor scan interval: 30s" app_id=divideapp instance=divideapp-85888845-q44tj scope=dapr.runtime.actor type=log ver=1.13.4
time="2024-06-19T12:28:10.885765771Z" level=info msg="Configuring workflow engine with actors backend" app_id=divideapp instance=divideapp-85888845-q44tj scope=dapr.runtime type=log ver=1.13.4
time="2024-06-19T12:28:10.885788665Z" level=info msg="Registering component for dapr workflow engine..." app_id=divideapp instance=divideapp-85888845-q44tj scope=dapr.runtime type=log ver=1.13.4
time="2024-06-19T12:28:10.885819617Z" level=info msg="Initializing Dapr workflow component" app_id=divideapp component="dapr (workflow.dapr/v1)" instance=divideapp-85888845-q44tj scope=dapr.contrib type=log ver=1.13.4
time="2024-06-19T12:28:10.88585377Z" level=info msg="Workflow engine initialized." app_id=divideapp instance=divideapp-85888845-q44tj scope=dapr.runtime type=log ver=1.13.4
time="2024-06-19T12:28:10.88591329Z" level=info msg="dapr initialized. Status: Running. Init Elapsed 30ms" app_id=divideapp instance=divideapp-85888845-q44tj scope=dapr.runtime type=log ver=1.13.4
time="2024-06-19T12:28:10.906202271Z" level=info msg="Placement tables updated, version: 0" app_id=divideapp instance=divideapp-85888845-q44tj scope=dapr.runtime.actors.placement type=log ver=1.13.4
time="2024-06-19T12:28:55.861455505Z" level=info msg="[CallLocal/divideapp/divide] Trace: 37f1fcf9754e02334e7788fb9a718d46 Span: d4f6d5eba86ec104/88af93c04925c084 Time: [2024-06-19 12:28:54.826532439 +0000 UTC m=+44.095551029 ->  2024-06-19 12:28:54.858668475 +0000 UTC m=+44.127687065] Annotations: []" instance=divideapp-85888845-q44tj scope=dapr.runtime.trace type=log ver=1.13.4
I can go back to Docker and see Alloy is trying to export to New Relic but it is getting “unsupported protocol scheme”
c error="failed to make an HTTP request: Post \"otlp.nr-data.net:4318/v1/traces\": unsupported protocol scheme \"otlp.nr-data.net\"" interval=19.584340268s
ts=2024-06-19T12:31:23.846899248Z level=info msg="Exporting failed. Will retry the request after interval." component_path=/ component_id=otelcol.exporter.otlphttp.newrelic error="failed to make an HTTP request: Post \"otlp.nr-data.net:4318/v1/traces\": unsupported protocol scheme \"otlp.nr-data.net\"" interval=19.644350384s
ts=2024-06-19T12:31:27.566820642Z level=info msg="Exporting failed. Will retry the request after interval." component_path=/ component_id=otelcol.exporter.otlphttp.newrelic error="failed to make an HTTP request: Post \"otlp.nr-data.net:4318/v1/traces\": unsupported protocol scheme \"otlp.nr-data.net\"" interval=26.545868812s
ts=2024-06-19T12:31:31.432220816Z level=info msg="Exporting failed. Will retry the request after interval." component_path=/ component_id=otelcol.exporter.otlphttp.newrelic error="failed to make an HTTP request: Post \"otlp.nr-data.net:4318/v1/traces\": unsupported protocol scheme \"otlp.nr-data.net\"" interval=28.985290362s
I’m going to try and pack in the protocol and ditch the port. That protocol message might be a clue…

Again, searching I found this example that showed just using the URL. I also saw an older forum post that showed adding the port as well. But we can try one then the other
$ diff config.alloy config.alloy.old1
9c9
<     endpoint = "https://otlp.nr-data.net"
---
>     endpoint = "otlp.nr-data.net:4318"
I’ll rotate the Alloy container
builder@builder-T100:~/grafanaalloy$ docker ps | grep alloy
609ca6632753   grafana/alloy:latest                                             "/bin/alloy run --se…"   11 minutes ago   Up 11 minutes           0.0.0.0:12345->12345/tcp, :::12345->12345/tcp, 0.0.0.0:64317->4317/tcp, :::64317->4317/tcp, 0.0.0.0:64318->4318/tcp, :::64318->4318/tcp   hopeful_shaw
builder@builder-T100:~/grafanaalloy$ docker stop hopeful_shaw
hopeful_shaw
builder@builder-T100:~/grafanaalloy$ docker rm hopeful_shaw
hopeful_shaw
builder@builder-T100:~/grafanaalloy$ docker run -d --privileged -v /home/builder/grafanaalloy/config.alloy:/etc/alloy/config.alloy -p 12345:12345 -p 64317:4317 -p 64318:4318 grafana/alloy:latest  run --server.http.listen-addr=0.0.0.0:12345 --storage.path=/var/lib/alloy/data /etc/alloy/config.alloy
c48638b81ff2d726bbefa5944d612c11081c6eb4f9d6dd69344914f33366b074
Then verify it is running
builder@builder-T100:~/grafanaalloy$ docker ps | grep alloy
c48638b81ff2   grafana/alloy:latest                                             "/bin/alloy run --se…"   29 seconds ago   Up 27 seconds           0.0.0.0:12345->12345/tcp, :::12345->12345/tcp, 0.0.0.0:64317->4317/tcp, :::64317->4317/tcp, 0.0.0.0:64318->4318/tcp, :::64318->4318/tcp   condescending_dirac
builder@builder-T100:~/grafanaalloy$ docker logs condescending_dirac
ts=2024-06-19T12:37:58.791071468Z level=info "boringcrypto enabled"=false
ts=2024-06-19T12:37:58.791104751Z level=info msg="starting complete graph evaluation" controller_path=/ controller_id="" trace_id=c060f880c7acfca7c4852ddfa7705380
ts=2024-06-19T12:37:58.791115996Z level=info msg="applying non-TLS config to HTTP server" service=http
ts=2024-06-19T12:37:58.791120189Z level=info msg="finished node evaluation" controller_path=/ controller_id="" trace_id=c060f880c7acfca7c4852ddfa7705380 node_id=http duration=22.106µs
ts=2024-06-19T12:37:58.791126989Z level=info msg="finished node evaluation" controller_path=/ controller_id="" trace_id=c060f880c7acfca7c4852ddfa7705380 node_id=ui duration=724ns
ts=2024-06-19T12:37:58.791131711Z level=info msg="finished node evaluation" controller_path=/ controller_id="" trace_id=c060f880c7acfca7c4852ddfa7705380 node_id=cluster duration=341ns
ts=2024-06-19T12:37:58.791136271Z level=info msg="running usage stats reporter"
ts=2024-06-19T12:37:58.791138864Z level=info msg="finished node evaluation" controller_path=/ controller_id="" trace_id=c060f880c7acfca7c4852ddfa7705380 node_id=discovery.docker.containers duration=655.441µs
ts=2024-06-19T12:37:58.791143355Z level=info msg="finished node evaluation" controller_path=/ controller_id="" trace_id=c060f880c7acfca7c4852ddfa7705380 node_id=otelcol.auth.headers.nr duration=3.680683ms
ts=2024-06-19T12:37:58.791147479Z level=info msg="finished node evaluation" controller_path=/ controller_id="" trace_id=c060f880c7acfca7c4852ddfa7705380 node_id=otelcol.exporter.otlphttp.newrelic duration=12.868693ms
ts=2024-06-19T12:37:58.791151601Z level=info msg="finished node evaluation" controller_path=/ controller_id="" trace_id=c060f880c7acfca7c4852ddfa7705380 node_id=otelcol.processor.batch.default duration=2.554899ms
ts=2024-06-19T12:37:58.791155349Z level=info msg="finished node evaluation" controller_path=/ controller_id="" trace_id=c060f880c7acfca7c4852ddfa7705380 node_id=otelcol.receiver.otlp.httpreceiver duration=139.288µs
ts=2024-06-19T12:37:58.791159289Z level=info msg="finished node evaluation" controller_path=/ controller_id="" trace_id=c060f880c7acfca7c4852ddfa7705380 node_id=remotecfg duration=38.65µs
ts=2024-06-19T12:37:58.791163287Z level=info msg="finished node evaluation" controller_path=/ controller_id="" trace_id=c060f880c7acfca7c4852ddfa7705380 node_id=otel duration=5.297µs
ts=2024-06-19T12:37:58.791167194Z level=info msg="finished node evaluation" controller_path=/ controller_id="" trace_id=c060f880c7acfca7c4852ddfa7705380 node_id=labelstore duration=7.093µs
ts=2024-06-19T12:37:58.791171098Z level=info msg="finished node evaluation" controller_path=/ controller_id="" trace_id=c060f880c7acfca7c4852ddfa7705380 node_id=tracing duration=14.275µs
ts=2024-06-19T12:37:58.791176256Z level=info msg="finished node evaluation" controller_path=/ controller_id="" trace_id=c060f880c7acfca7c4852ddfa7705380 node_id=logging duration=122.384µs
ts=2024-06-19T12:37:58.791183757Z level=info msg="finished complete graph evaluation" controller_path=/ controller_id="" trace_id=c060f880c7acfca7c4852ddfa7705380 duration=22.114053ms
ts=2024-06-19T12:37:58.792173084Z level=info msg="scheduling loaded components and services"
ts=2024-06-19T12:37:58.797451528Z level=info msg="starting cluster node" peers="" advertise_addr=127.0.0.1:12345
ts=2024-06-19T12:37:58.80008193Z level=info msg="peers changed" new_peers=c48638b81ff2
ts=2024-06-19T12:37:58.799590719Z level=warn msg="Using the 0.0.0.0 address exposes this server to every network interface, which may facilitate Denial of Service attacks. Enable the feature gate to change the default and remove this warning." component_path=/ component_id=otelcol.receiver.otlp.httpreceiver documentation=https://github.com/open-telemetry/opentelemetry-collector/blob/main/docs/security-best-practices.md#safeguards-against-denial-of-service-attacks "feature gate ID"=component.UseLocalHostAsDefaultHost
ts=2024-06-19T12:37:58.801924901Z level=info msg="Starting GRPC server" component_path=/ component_id=otelcol.receiver.otlp.httpreceiver endpoint=0.0.0.0:4317
ts=2024-06-19T12:37:58.802437912Z level=info msg="now listening for http traffic" service=http addr=0.0.0.0:12345
ts=2024-06-19T12:37:58.805351589Z level=error msg="Unable to refresh target groups" component_path=/ component_id=discovery.docker.containers err="error while listing containers: Cannot connect to the Docker daemon at unix:///var/run/docker.sock. Is the docker daemon running?"
ts=2024-06-19T12:37:58.806048238Z level=warn msg="Using the 0.0.0.0 address exposes this server to every network interface, which may facilitate Denial of Service attacks. Enable the feature gate to change the default and remove this warning." component_path=/ component_id=otelcol.receiver.otlp.httpreceiver documentation=https://github.com/open-telemetry/opentelemetry-collector/blob/main/docs/security-best-practices.md#safeguards-against-denial-of-service-attacks "feature gate ID"=component.UseLocalHostAsDefaultHost
ts=2024-06-19T12:37:58.806148809Z level=info msg="Starting HTTP server" component_path=/ component_id=otelcol.receiver.otlp.httpreceiver endpoint=0.0.0.0:4318
Back again I rotate the pods (not really needed but it keeps my logs clean) and do some calculations.
I can then see some traces going out
$ kubectl logs divideapp-85888845-ftpxq -c daprd | tail -n 5
time="2024-06-19T12:39:59.057589681Z" level=info msg="Workflow engine initialized." app_id=divideapp instance=divideapp-85888845-ftpxq scope=dapr.runtime type=log ver=1.13.4
time="2024-06-19T12:39:59.057614109Z" level=info msg="dapr initialized. Status: Running. Init Elapsed 1063ms" app_id=divideapp instance=divideapp-85888845-ftpxq scope=dapr.runtime type=log ver=1.13.4
time="2024-06-19T12:39:59.072521924Z" level=info msg="Placement tables updated, version: 0" app_id=divideapp instance=divideapp-85888845-ftpxq scope=dapr.runtime.actors.placement type=log ver=1.13.4
time="2024-06-19T12:40:22.997481667Z" level=info msg="[CallLocal/divideapp/divide] Trace: fce6fbff39fa07f4c4a8d24c2f416391 Span: 8bf8a0926baf5c8e/5c3189c144798af8 Time: [2024-06-19 12:40:17.575870142 +0000 UTC m=+20.831807151 ->  2024-06-19 12:40:20.341085307 +0000 UTC m=+23.597022316] Annotations: []" instance=divideapp-85888845-ftpxq scope=dapr.runtime.trace type=log ver=1.13.4
time="2024-06-19T12:40:32.999451163Z" level=info msg="[CallLocal/divideapp/divide] Trace: 068c6d7bfaa111dea80dcc4e1c26e841 Span: e01b081e3dc2088d/b6b0c32dd7a4c095 Time: [2024-06-19 12:40:31.587706385 +0000 UTC m=+34.843643400 ->  2024-06-19 12:40:31.590999968 +0000 UTC m=+34.846936983] Annotations: []" instance=divideapp-85888845-ftpxq scope=dapr.runtime.trace type=log ver=1.13.4
I see no errors in the logs (but no output that suggests it sent to NR either)
$ docker logs condescending_dirac
ts=2024-06-19T12:37:58.791071468Z level=info "boringcrypto enabled"=false
ts=2024-06-19T12:37:58.791104751Z level=info msg="starting complete graph evaluation" controller_path=/ controller_id="" trace_id=c060f880c7acfca7c4852ddfa7705380
ts=2024-06-19T12:37:58.791115996Z level=info msg="applying non-TLS config to HTTP server" service=http
ts=2024-06-19T12:37:58.791120189Z level=info msg="finished node evaluation" controller_path=/ controller_id="" trace_id=c060f880c7acfca7c4852ddfa7705380 node_id=http duration=22.106µs
ts=2024-06-19T12:37:58.791126989Z level=info msg="finished node evaluation" controller_path=/ controller_id="" trace_id=c060f880c7acfca7c4852ddfa7705380 node_id=ui duration=724ns
ts=2024-06-19T12:37:58.791131711Z level=info msg="finished node evaluation" controller_path=/ controller_id="" trace_id=c060f880c7acfca7c4852ddfa7705380 node_id=cluster duration=341ns
ts=2024-06-19T12:37:58.791136271Z level=info msg="running usage stats reporter"
ts=2024-06-19T12:37:58.791138864Z level=info msg="finished node evaluation" controller_path=/ controller_id="" trace_id=c060f880c7acfca7c4852ddfa7705380 node_id=discovery.docker.containers duration=655.441µs
ts=2024-06-19T12:37:58.791143355Z level=info msg="finished node evaluation" controller_path=/ controller_id="" trace_id=c060f880c7acfca7c4852ddfa7705380 node_id=otelcol.auth.headers.nr duration=3.680683ms
ts=2024-06-19T12:37:58.791147479Z level=info msg="finished node evaluation" controller_path=/ controller_id="" trace_id=c060f880c7acfca7c4852ddfa7705380 node_id=otelcol.exporter.otlphttp.newrelic duration=12.868693ms
ts=2024-06-19T12:37:58.791151601Z level=info msg="finished node evaluation" controller_path=/ controller_id="" trace_id=c060f880c7acfca7c4852ddfa7705380 node_id=otelcol.processor.batch.default duration=2.554899ms
ts=2024-06-19T12:37:58.791155349Z level=info msg="finished node evaluation" controller_path=/ controller_id="" trace_id=c060f880c7acfca7c4852ddfa7705380 node_id=otelcol.receiver.otlp.httpreceiver duration=139.288µs
ts=2024-06-19T12:37:58.791159289Z level=info msg="finished node evaluation" controller_path=/ controller_id="" trace_id=c060f880c7acfca7c4852ddfa7705380 node_id=remotecfg duration=38.65µs
ts=2024-06-19T12:37:58.791163287Z level=info msg="finished node evaluation" controller_path=/ controller_id="" trace_id=c060f880c7acfca7c4852ddfa7705380 node_id=otel duration=5.297µs
ts=2024-06-19T12:37:58.791167194Z level=info msg="finished node evaluation" controller_path=/ controller_id="" trace_id=c060f880c7acfca7c4852ddfa7705380 node_id=labelstore duration=7.093µs
ts=2024-06-19T12:37:58.791171098Z level=info msg="finished node evaluation" controller_path=/ controller_id="" trace_id=c060f880c7acfca7c4852ddfa7705380 node_id=tracing duration=14.275µs
ts=2024-06-19T12:37:58.791176256Z level=info msg="finished node evaluation" controller_path=/ controller_id="" trace_id=c060f880c7acfca7c4852ddfa7705380 node_id=logging duration=122.384µs
ts=2024-06-19T12:37:58.791183757Z level=info msg="finished complete graph evaluation" controller_path=/ controller_id="" trace_id=c060f880c7acfca7c4852ddfa7705380 duration=22.114053ms
ts=2024-06-19T12:37:58.792173084Z level=info msg="scheduling loaded components and services"
ts=2024-06-19T12:37:58.797451528Z level=info msg="starting cluster node" peers="" advertise_addr=127.0.0.1:12345
ts=2024-06-19T12:37:58.80008193Z level=info msg="peers changed" new_peers=c48638b81ff2
ts=2024-06-19T12:37:58.799590719Z level=warn msg="Using the 0.0.0.0 address exposes this server to every network interface, which may facilitate Denial of Service attacks. Enable the feature gate to change the default and remove this warning." component_path=/ component_id=otelcol.receiver.otlp.httpreceiver documentation=https://github.com/open-telemetry/opentelemetry-collector/blob/main/docs/security-best-practices.md#safeguards-against-denial-of-service-attacks "feature gate ID"=component.UseLocalHostAsDefaultHost
ts=2024-06-19T12:37:58.801924901Z level=info msg="Starting GRPC server" component_path=/ component_id=otelcol.receiver.otlp.httpreceiver endpoint=0.0.0.0:4317
ts=2024-06-19T12:37:58.802437912Z level=info msg="now listening for http traffic" service=http addr=0.0.0.0:12345
ts=2024-06-19T12:37:58.805351589Z level=error msg="Unable to refresh target groups" component_path=/ component_id=discovery.docker.containers err="error while listing containers: Cannot connect to the Docker daemon at unix:///var/run/docker.sock. Is the docker daemon running?"
ts=2024-06-19T12:37:58.806048238Z level=warn msg="Using the 0.0.0.0 address exposes this server to every network interface, which may facilitate Denial of Service attacks. Enable the feature gate to change the default and remove this warning." component_path=/ component_id=otelcol.receiver.otlp.httpreceiver documentation=https://github.com/open-telemetry/opentelemetry-collector/blob/main/docs/security-best-practices.md#safeguards-against-denial-of-service-attacks "feature gate ID"=component.UseLocalHostAsDefaultHost
ts=2024-06-19T12:37:58.806148809Z level=info msg="Starting HTTP server" component_path=/ component_id=otelcol.receiver.otlp.httpreceiver endpoint=0.0.0.0:4318
ts=2024-06-19T12:38:58.893982527Z level=error msg="Unable to refresh target groups" component_path=/ component_id=discovery.docker.containers err="error while listing containers: Cannot connect to the Docker daemon at unix:///var/run/docker.sock. Is the docker daemon running?"
ts=2024-06-19T12:39:58.880858522Z level=error msg="Unable to refresh target groups" component_path=/ component_id=discovery.docker.containers err="error while listing containers: Cannot connect to the Docker daemon at unix:///var/run/docker.sock. Is the docker daemon running?"
ts=2024-06-19T12:40:58.8843017Z level=error msg="Unable to refresh target groups" component_path=/ component_id=discovery.docker.containers err="error while listing containers: Cannot connect to the Docker daemon at unix:///var/run/docker.sock. Is the docker daemon running?"
Finally!
For the first time, I can verify it worked sending to New Relic!
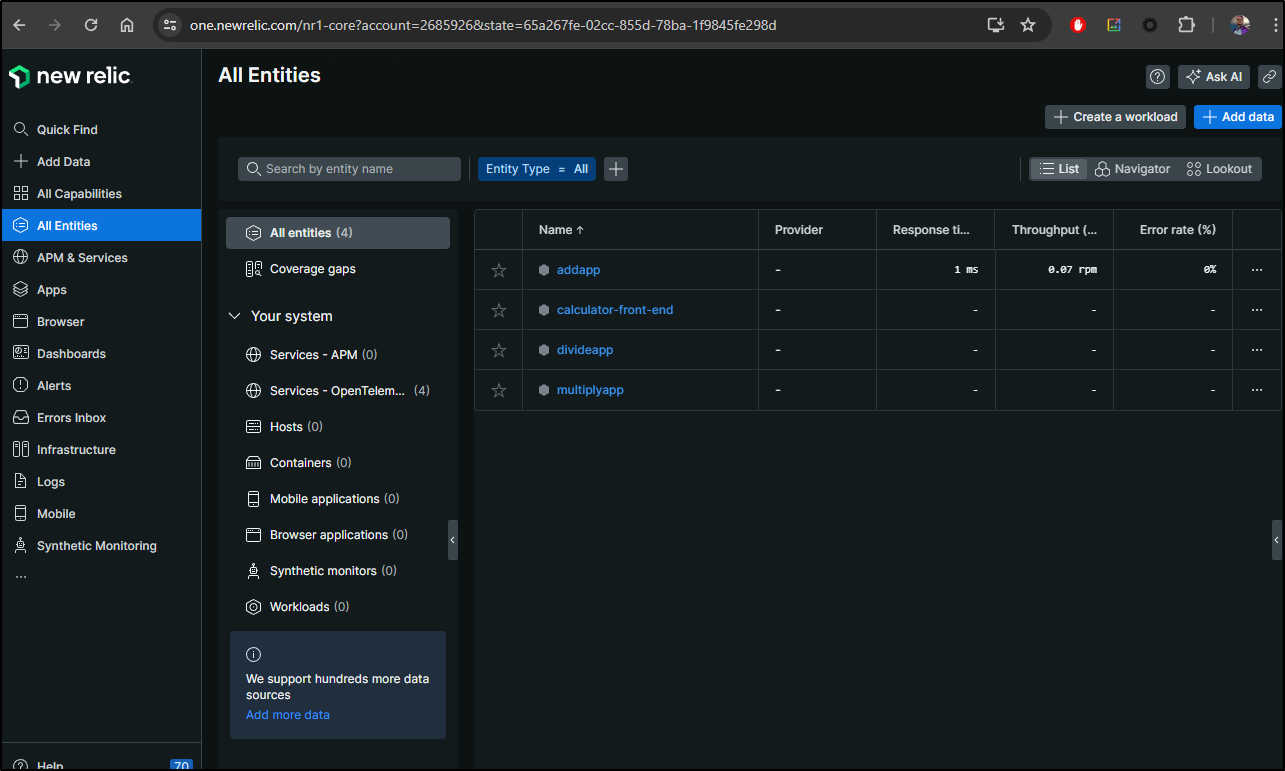
Kubernetes again
Let’s go back to Kubernetes now that we have realized the issues with ports and protocols.
First, I think I see the issue with Groundcover, so I’ll perform that test first.
The last CM I had:
logging {
  level = "info"
  format = "logfmt"
}

otelcol.exporter.otlphttp "groundcover" {
  client {
    endpoint = "groundcover-alligator.groundcover.svc.cluster.local:4318"
  }
}

otelcol.receiver.otlp "httpreceiver" {
  grpc {
    endpoint = "127.0.0.1:4317"
  }

  http {
    endpoint = "127.0.0.1:4318"
  }

  output {
    metrics = [otelcol.exporter.otlphttp.groundcover.input]
    logs    = [otelcol.exporter.otlphttp.groundcover.input]
    traces  = [otelcol.exporter.otlphttp.groundcover.input]
  }
}

// Process and send
otelcol.processor.batch "default" {

  output {
    metrics = [otelcol.exporter.otlphttp.groundcover.input]
    logs    = [otelcol.exporter.otlphttp.groundcover.input]
    traces  = [otelcol.exporter.otlphttp.groundcover.input]
  }
}

discovery.kubernetes "podmetrics" {
  role = "pod"
}

discovery.kubernetes "nodes" {
  role = "node"
}

discovery.kubernetes "services" {
  role = "service"
}

discovery.kubernetes "endpoints" {
  role = "endpoints"
}
We’ll fix the endpoint collector ports and add a protocol:
logging {
  level = "info"
  format = "logfmt"
}

otelcol.exporter.otlphttp "groundcover" {
  client {
    endpoint = "http://groundcover-alligator.groundcover.svc.cluster.local:4318"
  }
}

otelcol.receiver.otlp "httpreceiver" {
  grpc {
    endpoint = "0.0.0.0:4317"
  }

  http {
    endpoint = "0.0.0.0:4318"
  }

  output {
    metrics = [otelcol.exporter.otlphttp.groundcover.input]
    logs    = [otelcol.exporter.otlphttp.groundcover.input]
    traces  = [otelcol.exporter.otlphttp.groundcover.input]
  }
}

// Process and send
otelcol.processor.batch "default" {

  output {
    metrics = [otelcol.exporter.otlphttp.groundcover.input]
    logs    = [otelcol.exporter.otlphttp.groundcover.input]
    traces  = [otelcol.exporter.otlphttp.groundcover.input]
  }
}

discovery.kubernetes "podmetrics" {
  role = "pod"
}

discovery.kubernetes "nodes" {
  role = "node"
}

discovery.kubernetes "services" {
  role = "service"
}

discovery.kubernetes "endpoints" {
  role = "endpoints"
}
Then I’ll rotate it
$ !2291
kubectl delete cm alloy-config && kubectl create configmap alloy-config "--from-file=config.alloy=./config.alloy"
configmap "alloy-config" deleted
configmap/alloy-config created
To make it take effect, I’ll rotate the Alloy pods
$ kubectl delete pods -l app.kubernetes.io/instance=alloy
pod "alloy-xn5zj" deleted
pod "alloy-vrjtz" deleted
pod "alloy-mxx6s" deleted
Let’s update Dapr to use the alloy service instaead of Docker
$ kubectl get configuration appconfig -o yaml > appconfig.yaml.new10
$ vi appconfig.yaml.new10
$ diff appconfig.yaml.new10 appconfig.yaml.new9
6c6
<       {"apiVersion":"dapr.io/v1alpha1","kind":"Configuration","metadata":{"annotations":{},"creationTimestamp":"2024-06-18T00:05:40Z","generation":10,"name":"appconfig","namespace":"default","resourceVersion":"3284155","uid":"d612c9c1-46a9-4142-ac79-8d57fc836212"},"spec":{"metric":{"enabled":true},"metrics":{"enabled":true},"tracing":{"otel":{"endpointAddress":"192.168.1.100:64318","isSecure":false,"protocol":"http"},"samplingRate":"1","stdout":true}}}
---
>       {"apiVersion":"dapr.io/v1alpha1","kind":"Configuration","metadata":{"annotations":{},"creationTimestamp":"2024-06-18T00:05:40Z","generation":9,"name":"appconfig","namespace":"default","resourceVersion":"3282581","uid":"d612c9c1-46a9-4142-ac79-8d57fc836212"},"spec":{"metric":{"enabled":true},"metrics":{"enabled":true},"tracing":{"otel":{"endpointAddress":"alloy.default.svc.cluster.local:4318","isSecure":false,"protocol":"http"},"samplingRate":"1","stdout":true}}}
8c8
<   generation: 11
---
>   generation: 10
11c11
<   resourceVersion: "3374934"
---
>   resourceVersion: "3284155"
20c20
<       endpointAddress: alloy.default.svc.cluster.local:4318
---
>       endpointAddress: 192.168.1.100:64318
I’ll apply and rotate the Dapr app pods
$ kubectl apply -f appconfig.yaml.new10 && kubectl delete pods -l app=subtract & kubectl delete pods -l app=multiply & kubectl delete pods -l app=add & kubectl delete pods -l app=divide & kubectl delete pod -l app=calculator-front-end &
Before I forward and do calcs, I’ll ensure that right now (within the last 15m), Groundcover just sees eBPF traces
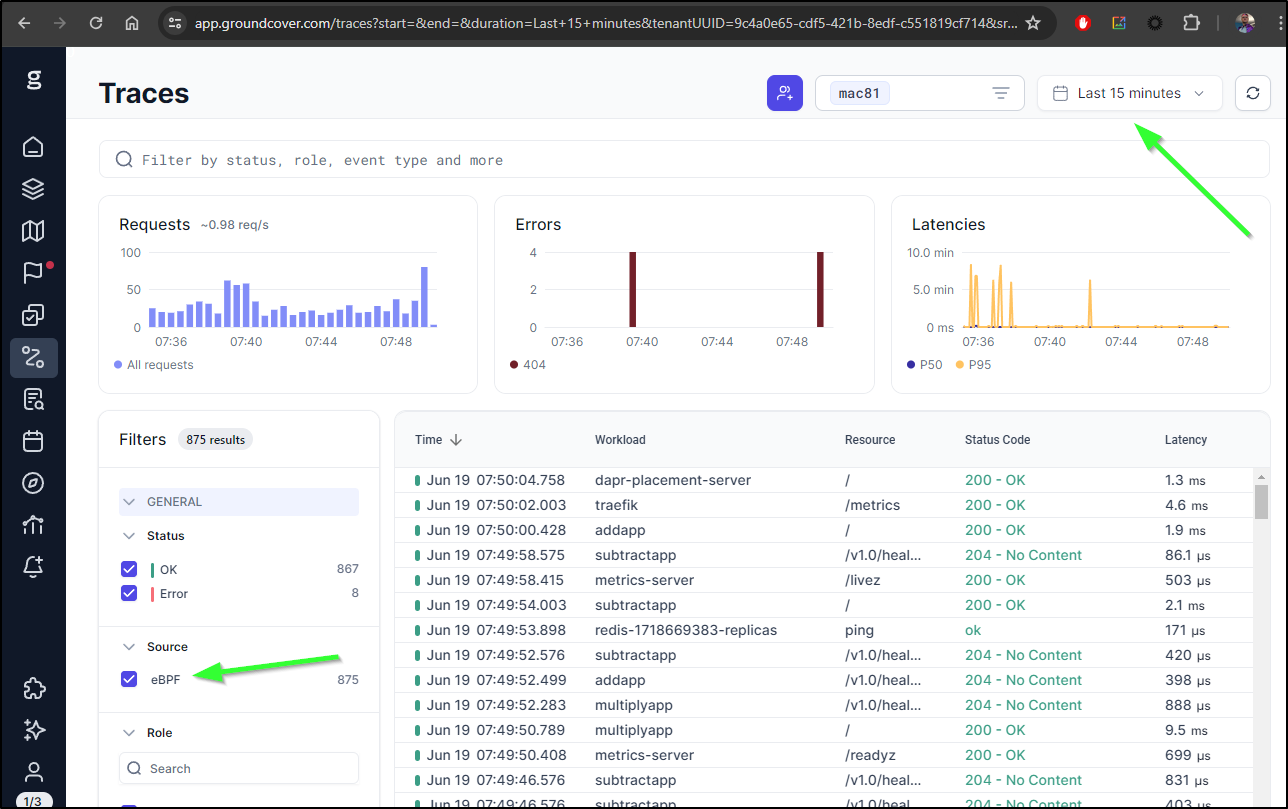
It’s a bit of a sanity check that we didn’t have anything sending OTel there presently.
Now I can port-forward and do some calculations
$ kubectl port-forward `kubectl get pod -l app=calculator-front-end -o go-template='{{range .items}}{{.metadata.name}}{{end}}'` 8080:8080
Forwarding from 127.0.0.1:8080 -> 8080
Forwarding from [::1]:8080 -> 8080
Handling connection for 8080
Handling connection for 8080
Handling connection for 8080
Handling connection for 8080
Handling connection for 8080
I can see traces are going out
$ kubectl logs divideapp-85888845-8g6dp -c daprd | tail -n2
time="2024-06-19T12:52:06.843901366Z" level=info msg="[CallLocal/divideapp/divide] Trace: d6d68f83c4b2d2d063480c624f03ba84 Span: b19e6533e9059811/fcd0bd2c74230bc1 Time: [2024-06-19 12:52:02.267490084 +0000 UTC m=+91.284757007 ->  2024-06-19 12:52:02.287417053 +0000 UTC m=+91.304683976] Annotations: []" instance=divideapp-85888845-8g6dp scope=dapr.runtime.trace type=log ver=1.13.4
time="2024-06-19T12:52:26.846408245Z" level=info msg="[CallLocal/divideapp/divide] Trace: 9035ff57bfe9743a9a4652625bdbc20b Span: ff98274ba98bde81/49513cf2b16b2df4 Time: [2024-06-19 12:52:23.047278051 +0000 UTC m=+112.064544981 ->  2024-06-19 12:52:23.051481212 +0000 UTC m=+112.068748142] Annotations: []" instance=divideapp-85888845-8g6dp scope=dapr.runtime.trace type=log ver=1.13.4
Checking the Alloy pods, I see a mistake; Alloy is sending HTTPS to an HTTP endpoint;
ts=2024-06-19T12:53:31.090116097Z level=info msg="Exporting failed. Will retry the request after interval." component_path=/ component_id=otelcol.exporter.otlphttp.groundcover error="failed to make an HTTP request: Post \"https://groundcover-alligator.groundcover.svc.cluster.local:4318/v1/traces\": http: server gave HTTP response to HTTPS client" interval=34.582499473s
ts=2024-06-19T12:53:31.991504615Z level=info msg="Exporting failed. Will retry the request after interval." component_path=/ component_id=otelcol.exporter.otlphttp.groundcover error="failed to make an HTTP request: Post \"https://groundcover-alligator.groundcover.svc.cluster.local:4318/v1/traces\": http: server gave HTTP response to HTTPS client" interval=37.551104485s
I changed https to http
otelcol.exporter.otlphttp "groundcover" {
  client {
    endpoint = "http://groundcover-alligator.groundcover.svc.cluster.local:4318"
  }
}
Then applied and rotated the alloy pods
$ kubectl delete cm alloy-config && kubectl create configmap alloy-config "--from-file=config.alloy=./config.alloy" && sleep 5 && kubectl delete pods -l app.kubernetes.io/instance=alloy
configmap "alloy-config" deleted
configmap/alloy-config created
I’ll do some calcs
$ !2347
kubectl port-forward `kubectl get pod -l app=calculator-front-end -o go-template='{{range .items}}{{.metadata.name}}{{end}}'` 8080:8080
Forwarding from 127.0.0.1:8080 -> 8080
Forwarding from [::1]:8080 -> 8080
Handling connection for 8080
And I can see traces in Groundcover!
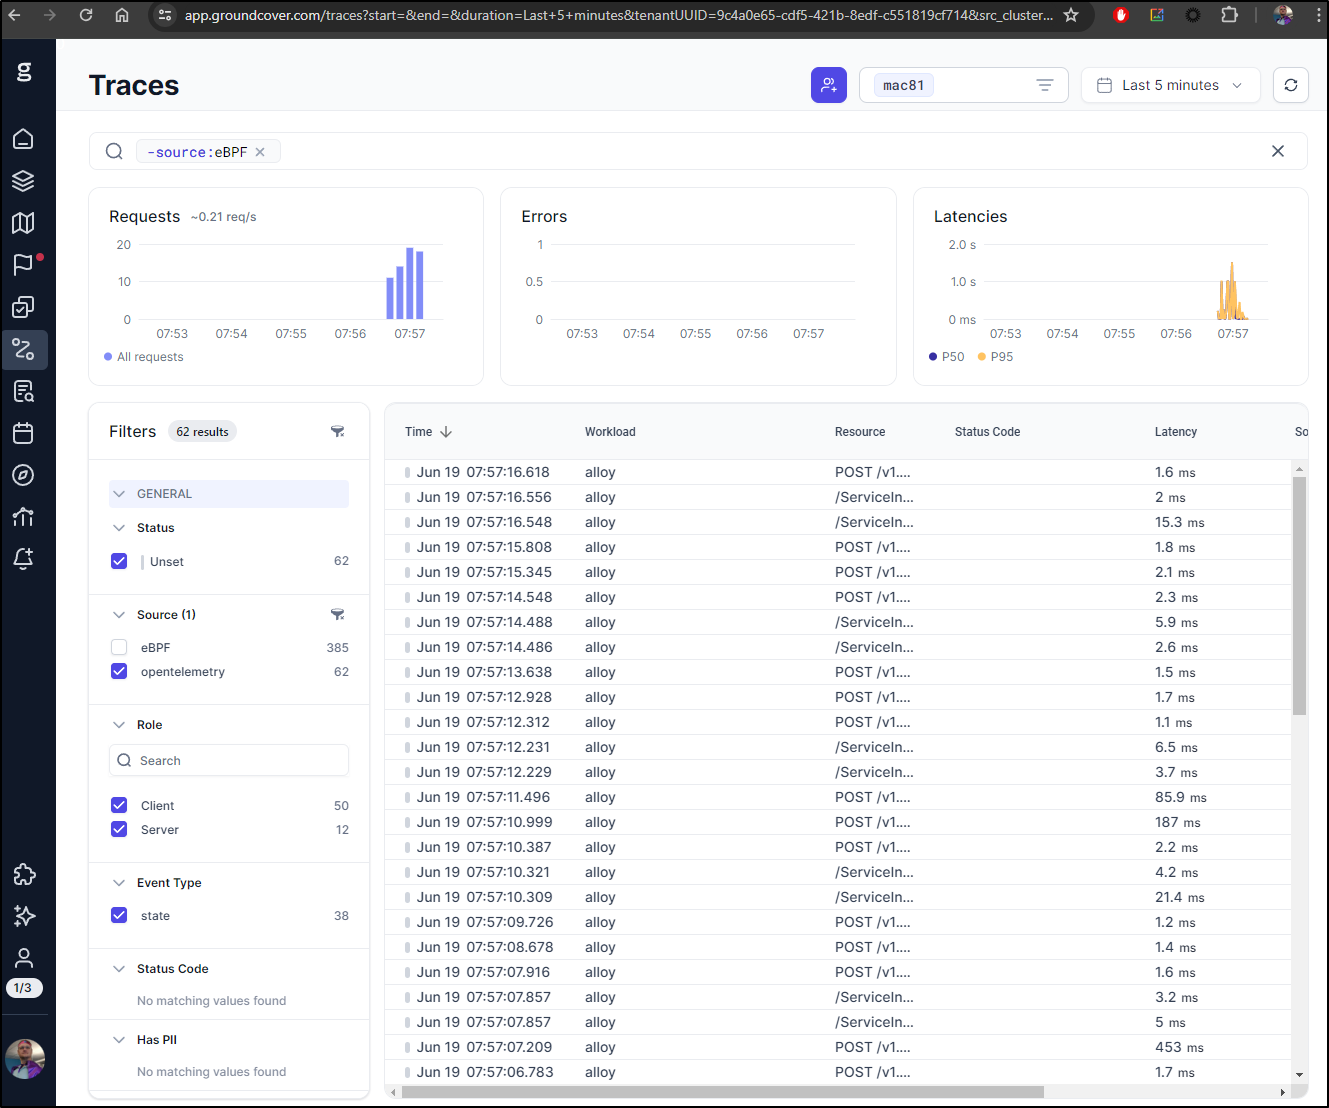
Working New Relic in Kubernetes
Let’s now take what we learned and do the same for New Relic
Here we can see the https in the endpoint and the right listen 0.0.0.0 blocks
$ cat config.alloy
logging {
  level = "info"
  format = "logfmt"
}

// Send to New Relic
otelcol.exporter.otlphttp "newrelic" {
  client {
    endpoint = "https://otlp.nr-data.net"
    auth     = otelcol.auth.headers.nr.handler
  }
}

otelcol.auth.headers "nr" {
  header {
    key   = "api-key"
    value = "c87asdfasdfasdfasdfasdfasdf9dNRAL"
  }
}

// Collect OTLP
otelcol.receiver.otlp "httpreceiver" {
  grpc {
    endpoint = "0.0.0.0:4317"
  }

  http {
    endpoint = "0.0.0.0:4318"
  }

  output {
    metrics = [otelcol.processor.batch.default.input]
    logs    = [otelcol.processor.batch.default.input]
    traces  = [otelcol.processor.batch.default.input]
  }
}

// Process and send
otelcol.processor.batch "default" {

  output {
    metrics = [otelcol.exporter.otlphttp.newrelic.input]
    logs    = [otelcol.exporter.otlphttp.newrelic.input]
    traces  = [otelcol.exporter.otlphttp.newrelic.input]
  }
}
discovery.kubernetes "podmetrics" {
  role = "pod"
}

discovery.kubernetes "nodes" {
  role = "node"
}

discovery.kubernetes "services" {
  role = "service"
}

discovery.kubernetes "endpoints" {
  role = "endpoints"
}
I’ll apply and rotate the Alloy pods
$ kubectl delete cm alloy-config && kubectl create configmap alloy-config "--from-file=config.alloy=./config.alloy" && sleep 5 && kubectl delete pods -l app.kubernetes.io/instance=alloy
configmap "alloy-config" deleted
configmap/alloy-config created
pod "alloy-dndmn" deleted
pod "alloy-rz42c" deleted
pod "alloy-dxxkt" deleted
Before I send more data, I’ll look at a service and see it had a spike (from our Docker test) but none recently
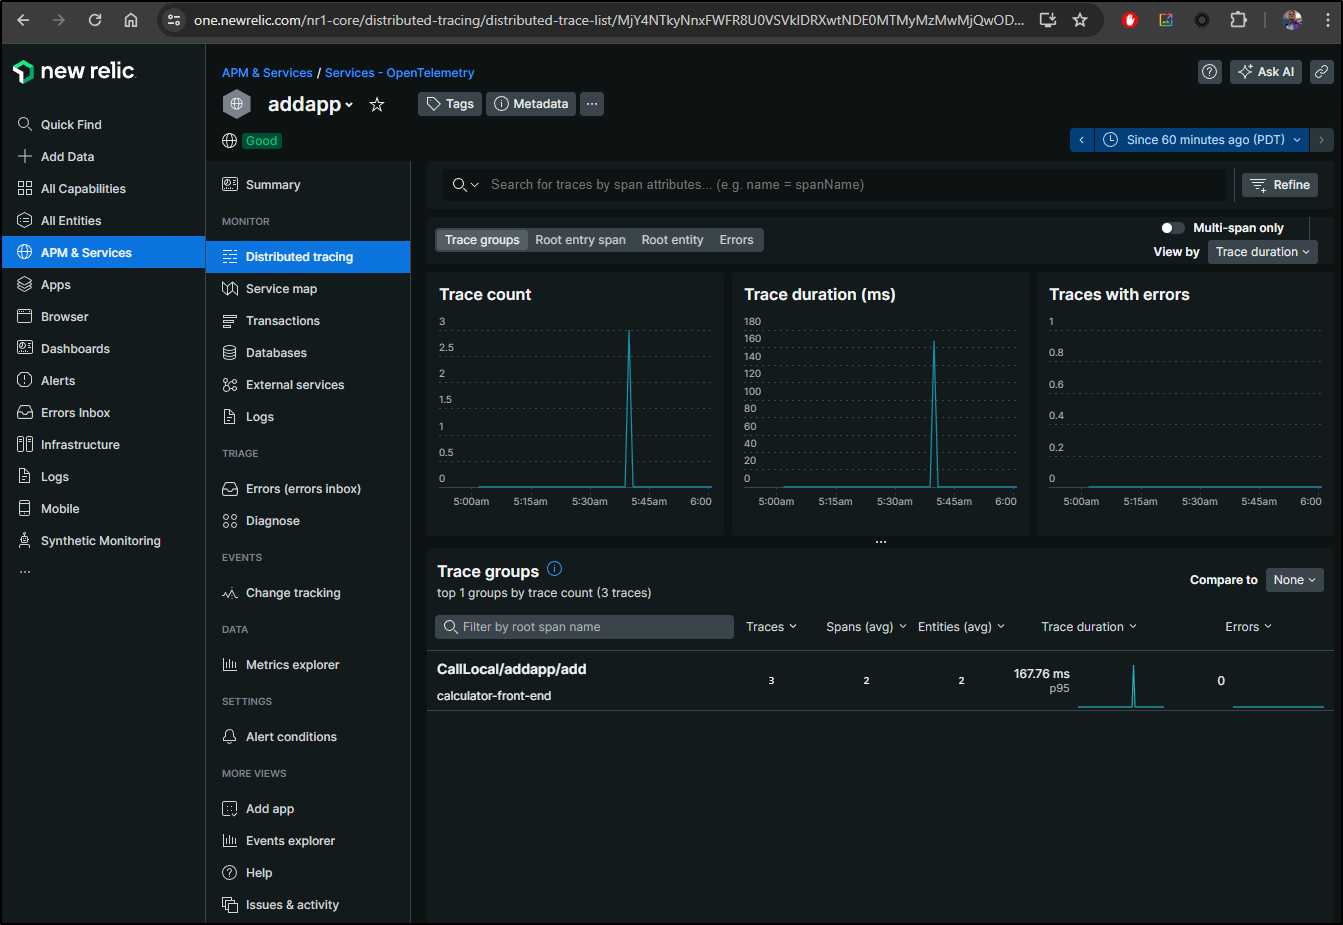
I don’t need to rotate Dapr, but I do need to do some calculations to send some more traces to Alloy
$ kubectl port-forward `kubectl get pod -l app=calculator-front-end -o go-template='{{range .items}}{{.metadata.name}}{{end}}'` 8080:8080
Forwarding from 127.0.0.1:8080 -> 8080
Forwarding from [::1]:8080 -> 8080
Handling connection for 8080
Handling connection for 8080
Handling connection for 8080
Handling connection for 8080
And I can see new trace data coming in!
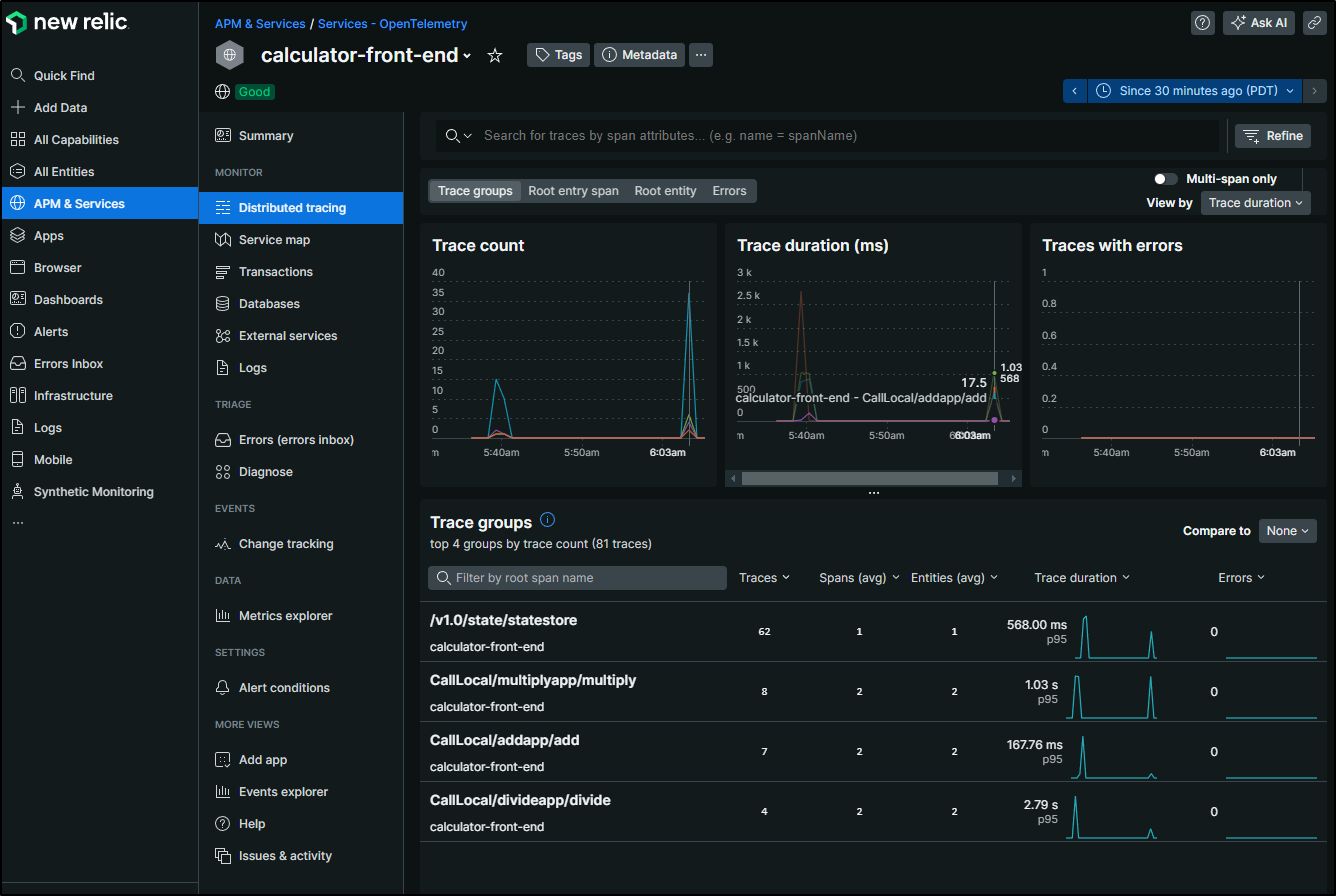
Summary
As I said at the start, I wanted to use the up-and-comer Groundcover because their Alligator is an agent that runs in-cluster much like Datadog, Sumo or Instana might do it. I used NewRelic because of the APMs in my arsenal, that one has a Public endpoint that takes OTLP with a header to identify the tenant. I think this covers the vast majority of what my readership might be looking to do.
I hope you enjoyed my struggles with collectors. I even harassed my Grafana friends at Open Source North trying to fix the ports. I had no idea that damn 127.0.0.1 instead of 0.0.0.0 was really the thing stopping me. I swear I saw procol-less endpoints in early docs, but once i started adding http and https to the endpoint in the alloy.config, we were golden.
I should point out that Grafana does offer a SaaS offering. The pricing page points out a free-tier as well as a pay as you go and Advanced. SaaS is always a good option if you don’t want to self-manage
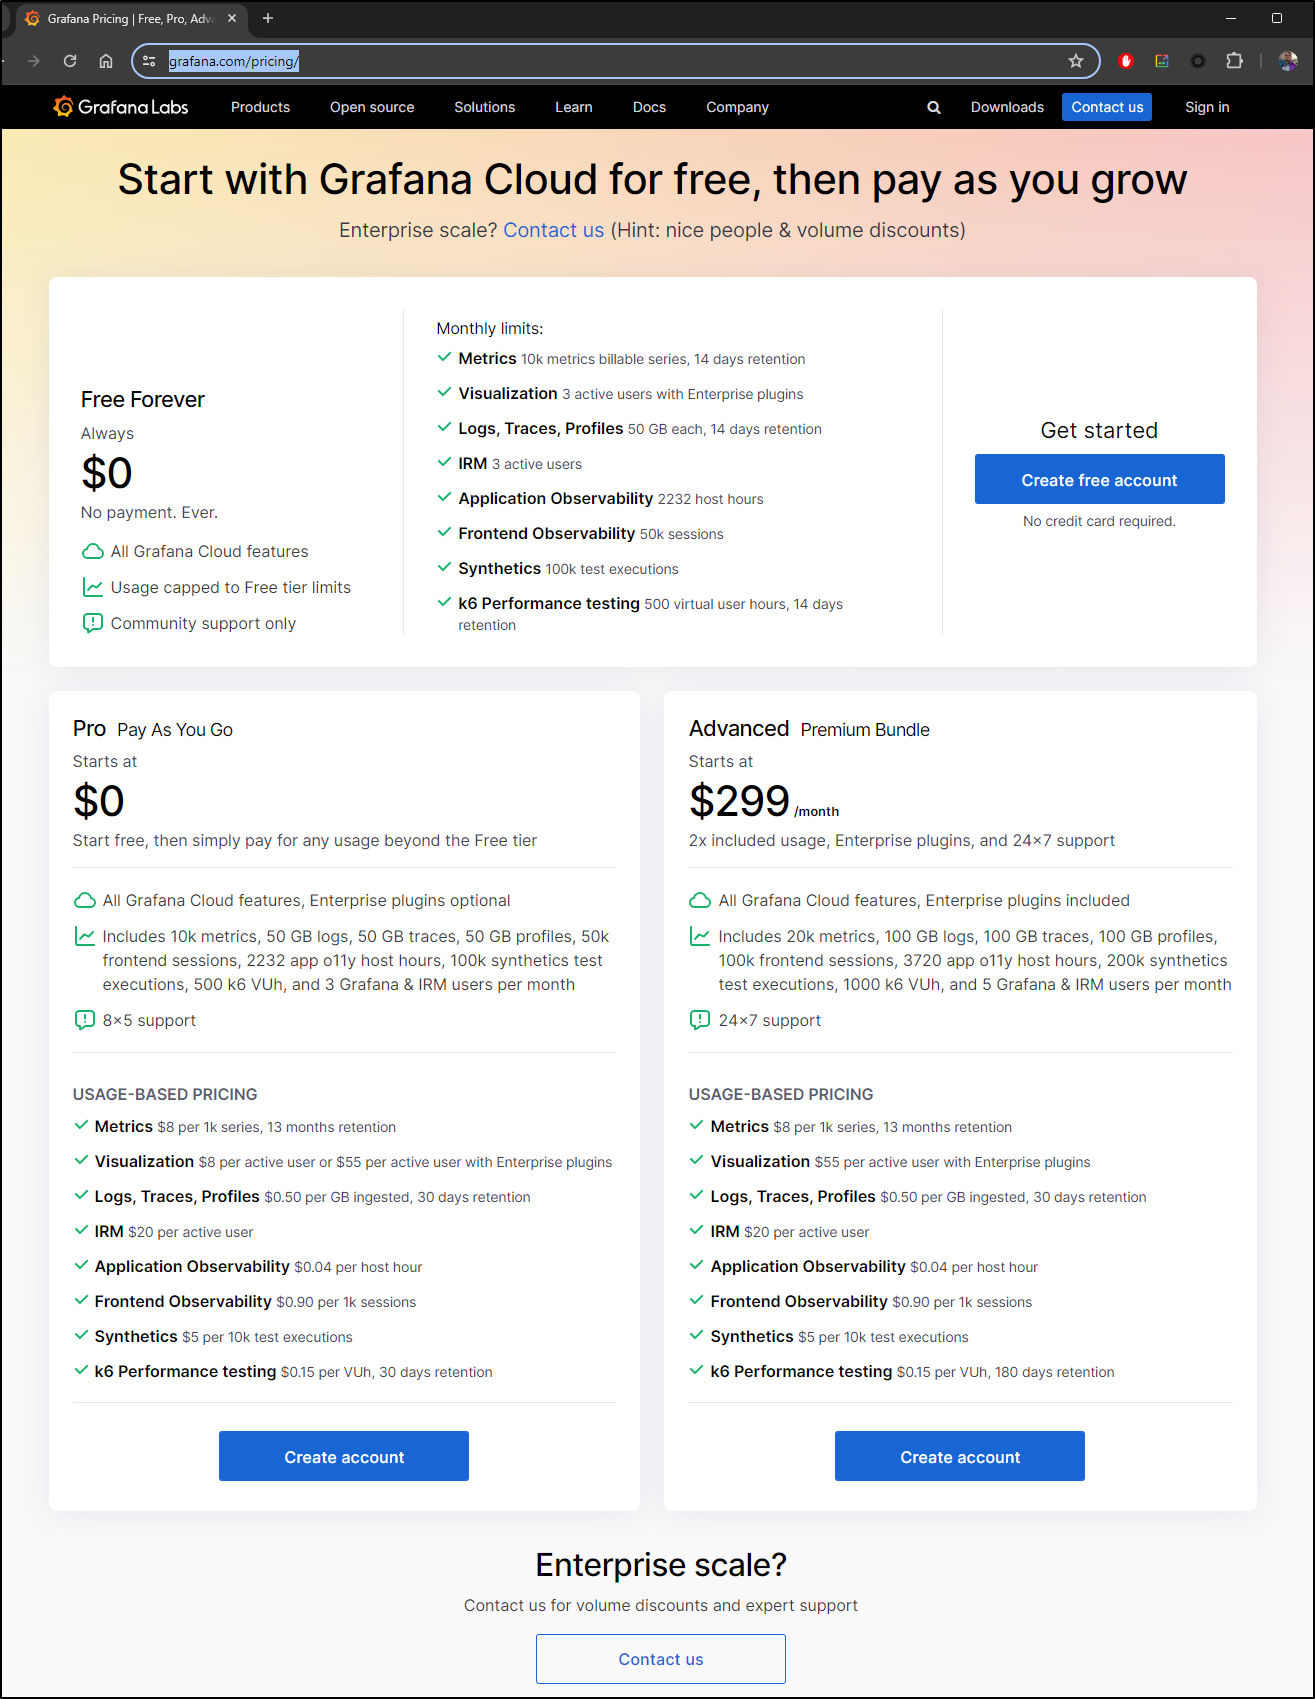
I have more to do with Alloy and Grafana and expect to see more on Loki, Grafana Cloud and of course, integrations with Datadog and other APMs.
I don’t say it enough, but I do appreciate those of you who read these. I do it as much for my own learning, of course, but every now and then I get a note from someone that says how one of my writeups really helped them and it makes my day. You can email me from contact or always find me on LI or Mastodon.