Published: Jun 11, 2024 by Isaac Johnson
Groundcover is a new player in the observability space with a somewhat unique approach; rather than build all new systems one infra they host, we install instead on our own cluster and they only manage the control plane.
They heavily use common OS tooling like Clickhouse for logs and Prometheus for metrics, Grafana for Dashboards and Alerting.
Today we’ll try out the free tier and see how well it works.
Getting started
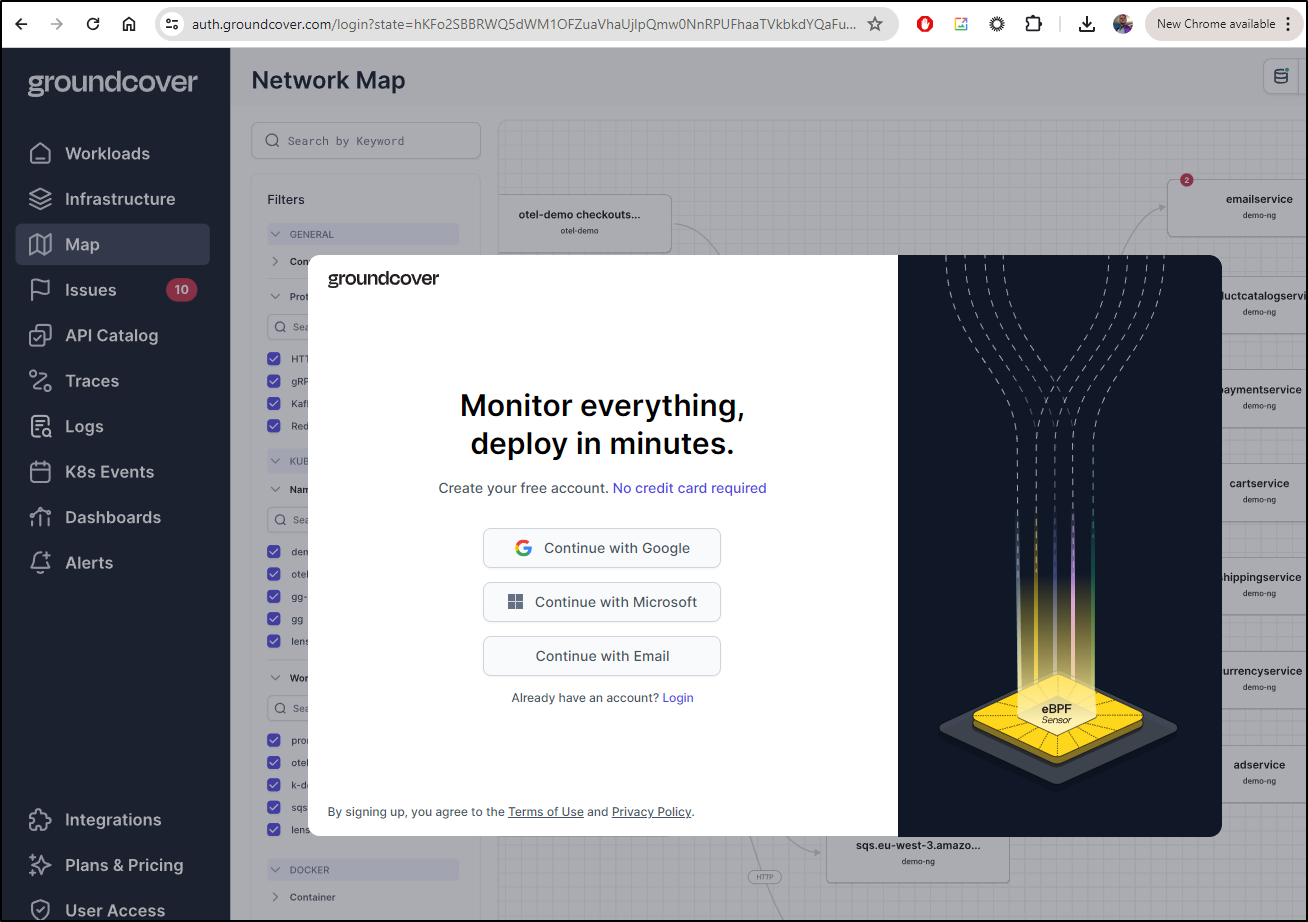
We can signup for a free account at Groundcover.com
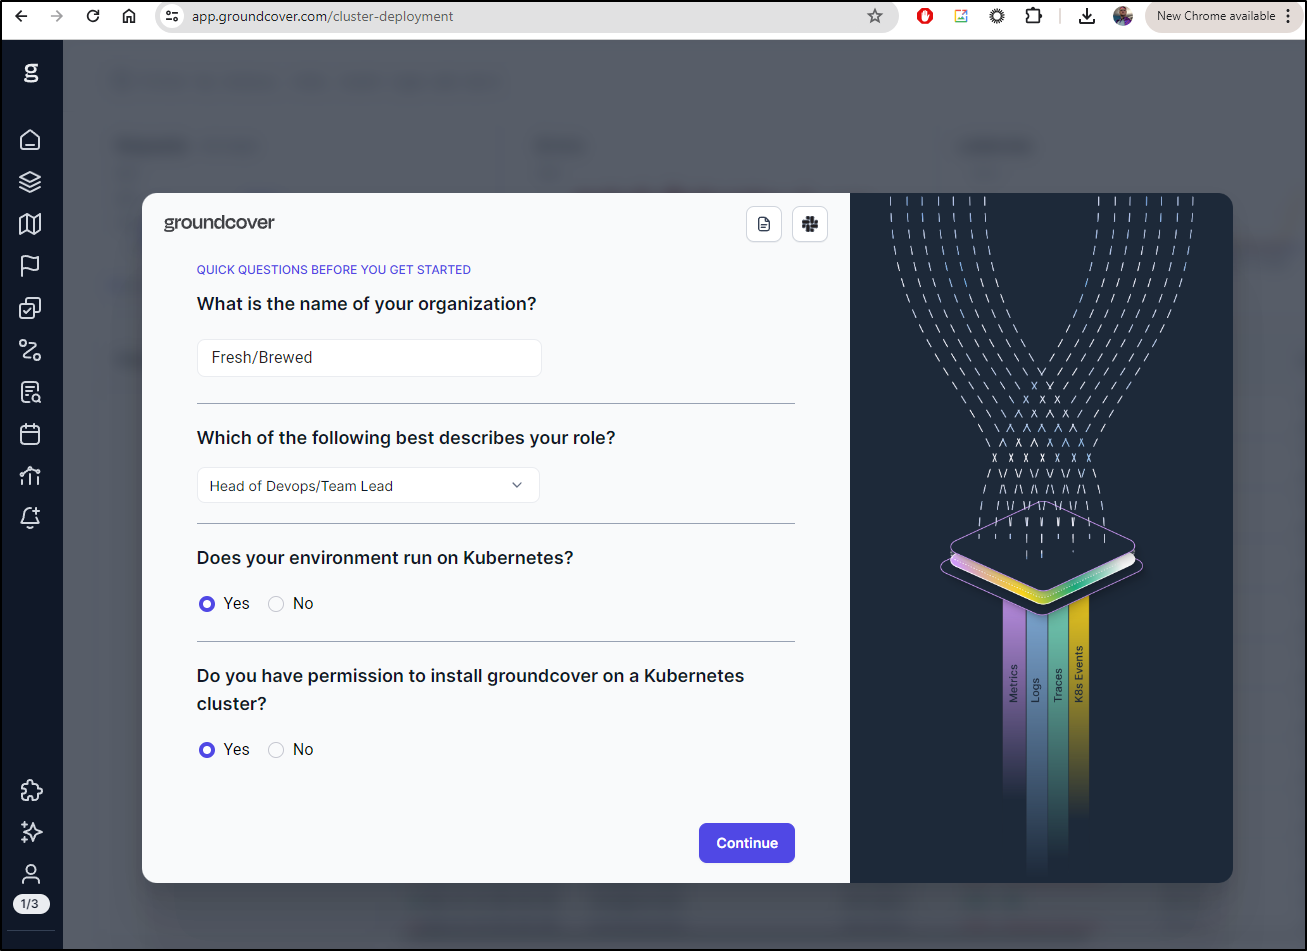
I’ll then create an org and confirm some settings.
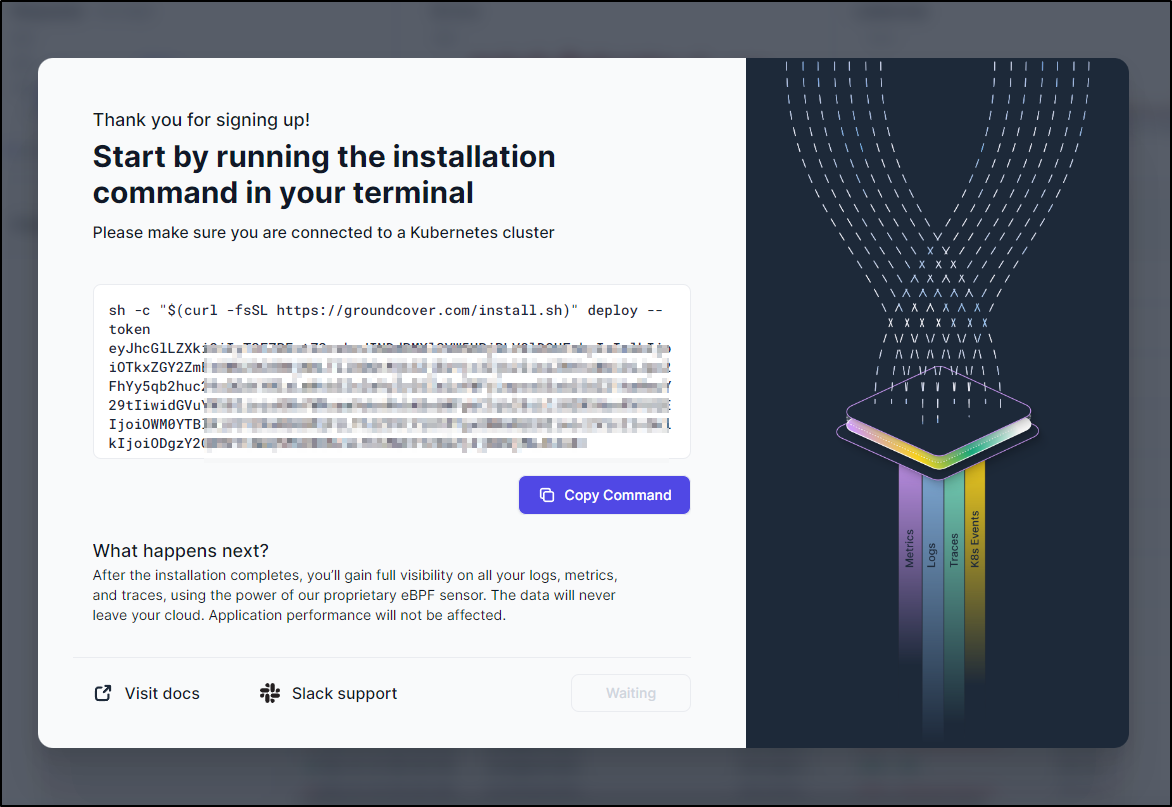
I’m then presented with a command to install it into my cluster
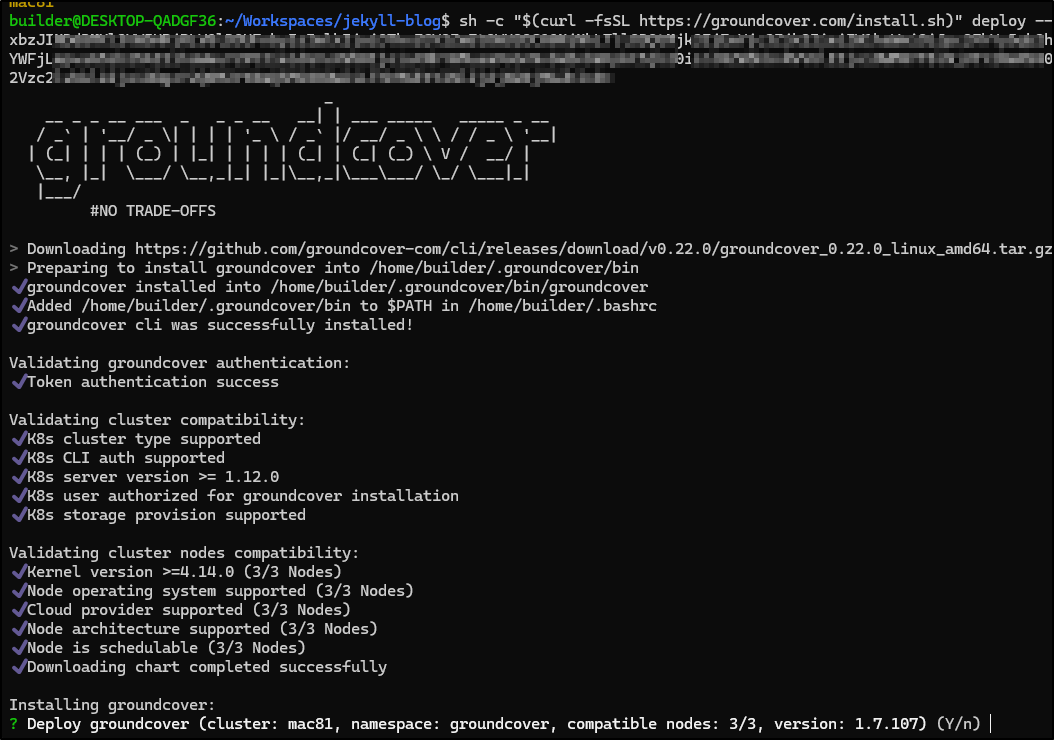
I appreciated the installer asking me about this cluster, confirming the kube context
While it was still adding nodes
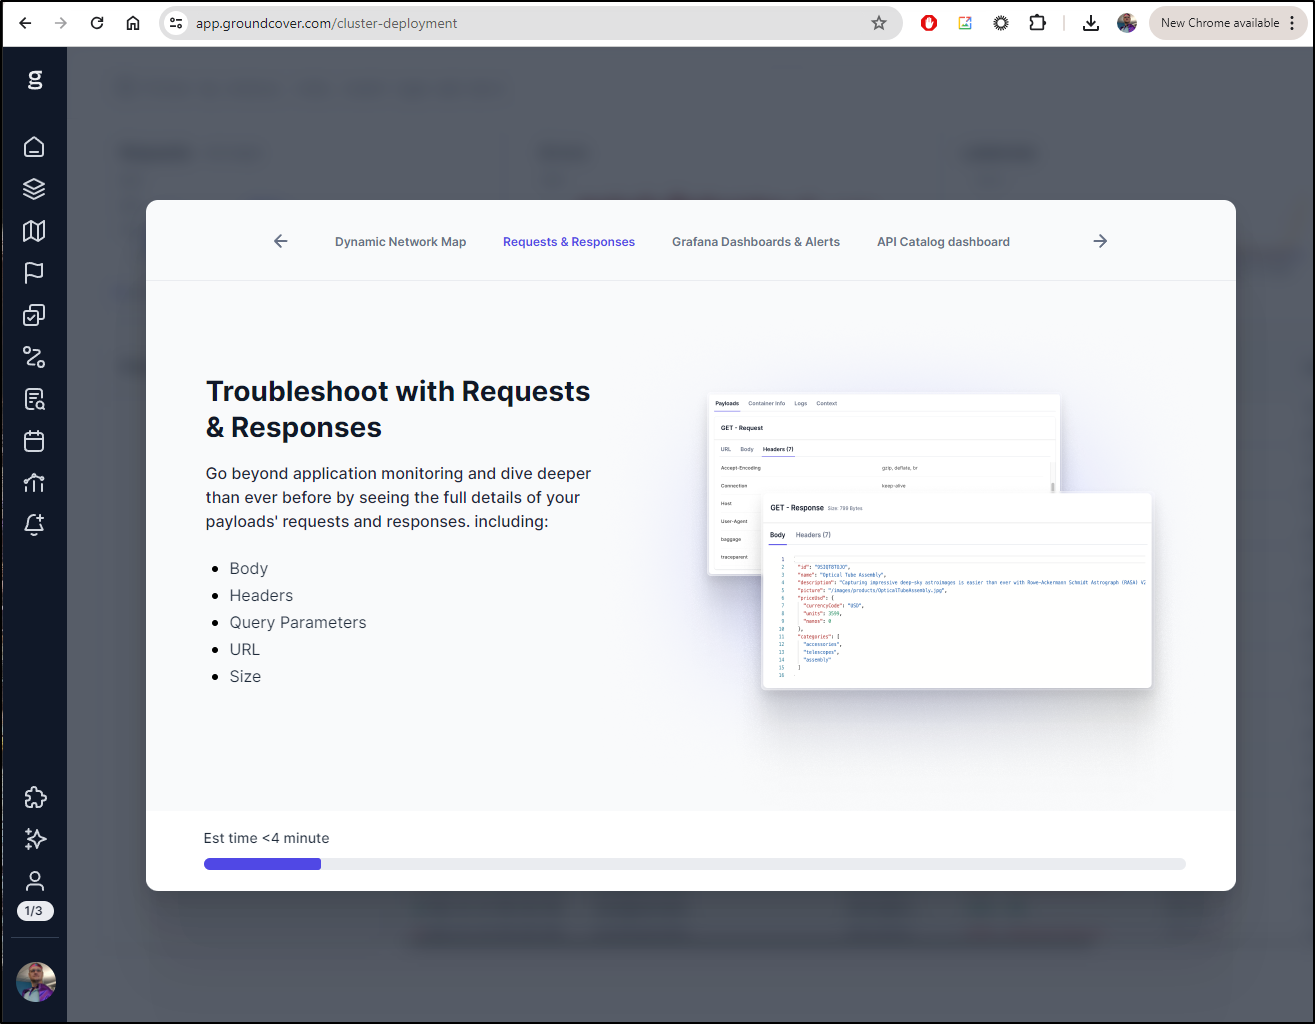
I saw the page change on Groundcover
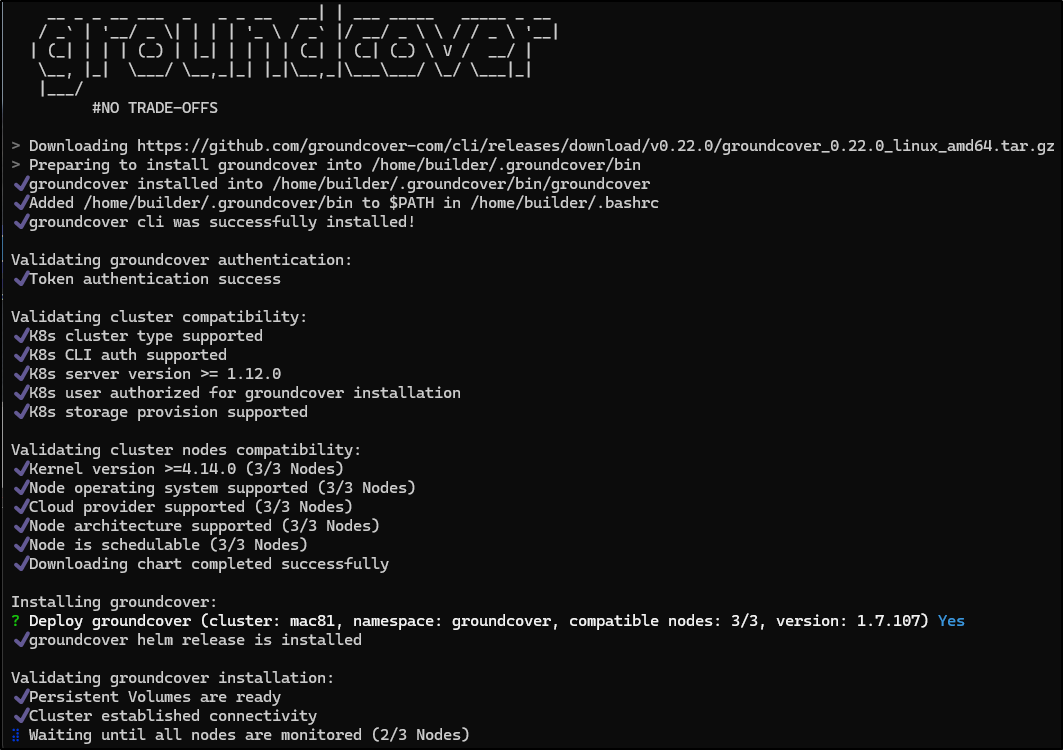
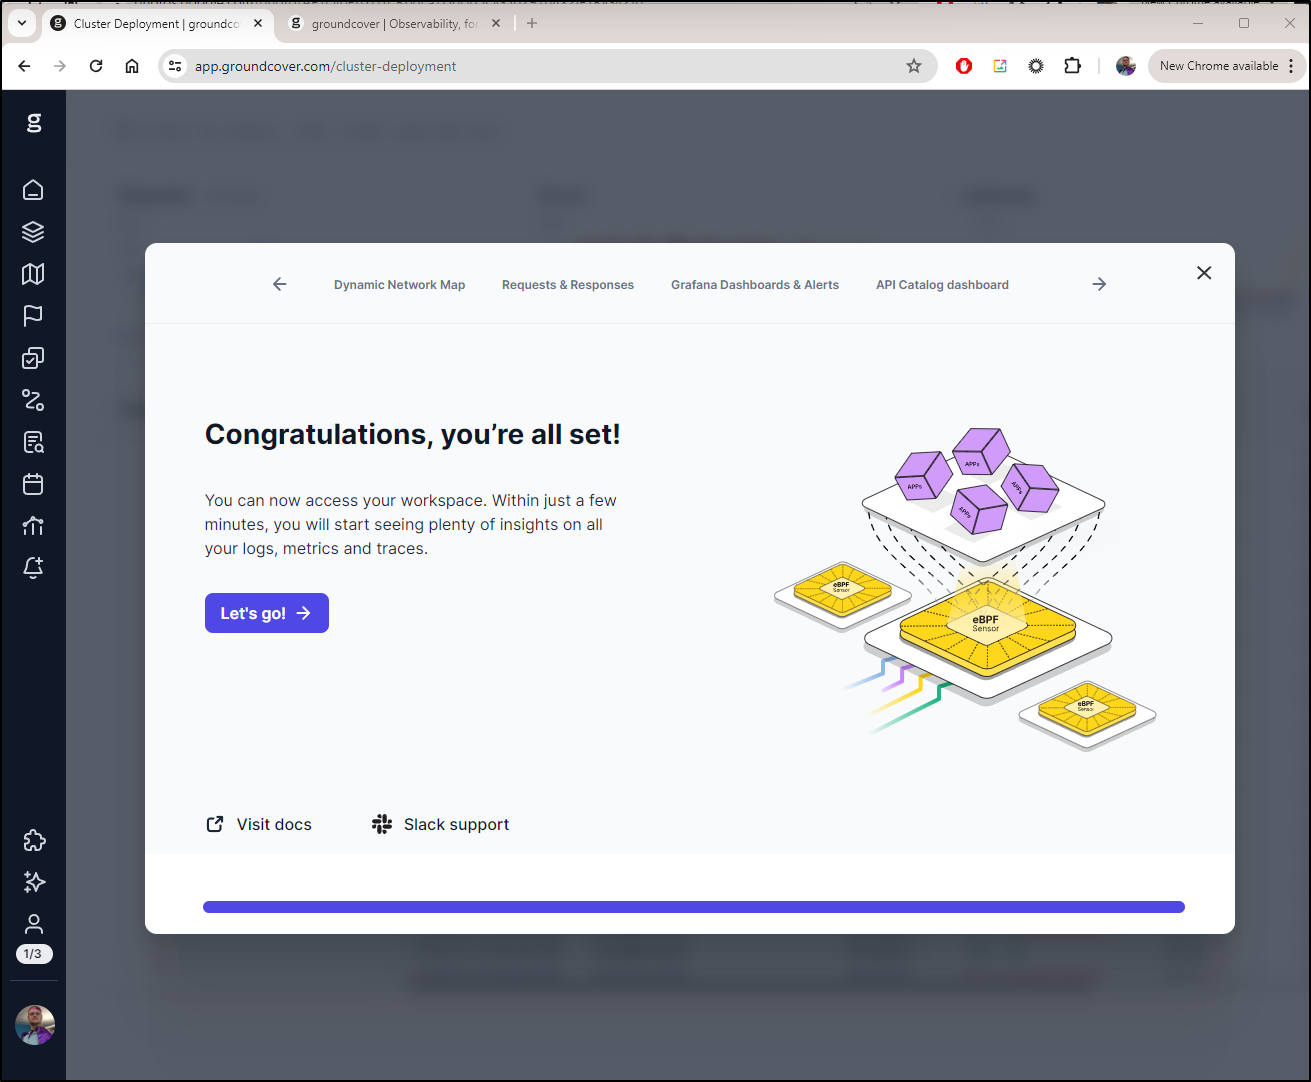
Soon the installer was completed
                                   _
    __ _ _ __ ___  _   _ _ __   __| | ___ _____   _____ _ __
   / _` | '__/ _ \| | | | '_ \ / _` |/ __/ _ \ \ / / _ \ '__|
  | (_| | | | (_) | |_| | | | | (_| | (_| (_) \ V /  __/ |
   \__, |_|  \___/ \__,_|_| |_|\__,_|\___\___/ \_/ \___|_|
   |___/
         #NO TRADE-OFFS

> Downloading https://github.com/groundcover-com/cli/releases/download/v0.22.0/groundcover_0.22.0_linux_amd64.tar.gz
> Preparing to install groundcover into /home/builder/.groundcover/bin
✔ groundcover installed into /home/builder/.groundcover/bin/groundcover
✔ Added /home/builder/.groundcover/bin to $PATH in /home/builder/.bashrc
✔ groundcover cli was successfully installed!

Validating groundcover authentication:
✔ Token authentication success

Validating cluster compatibility:
✔ K8s cluster type supported
✔ K8s CLI auth supported
✔ K8s server version >= 1.12.0
✔ K8s user authorized for groundcover installation
✔ K8s storage provision supported

Validating cluster nodes compatibility:
✔ Kernel version >=4.14.0 (3/3 Nodes)
✔ Node operating system supported (3/3 Nodes)
✔ Cloud provider supported (3/3 Nodes)
✔ Node architecture supported (3/3 Nodes)
✔ Node is schedulable (3/3 Nodes)
✔ Downloading chart completed successfully

Installing groundcover:
? Deploy groundcover (cluster: mac81, namespace: groundcover, compatible nodes: 3/3, version: 1.7.107) Yes
✔ groundcover helm release is installed

Validating groundcover installation:
✔ Persistent Volumes are ready
✔ Cluster established connectivity
✔ All nodes are monitored (3/3 Nodes)

That was easy. groundcover installed!
Return to browser tab or visit https://app.groundcover.com/?clusterId=mac81&viewType=Overview if you closed tab

join us on slack, we promise to keep things interesting https://groundcover.com/join-slack
I want a sample app to use so I’ll go with the Istio bookinfo one
builder@DESKTOP-QADGF36:~/Workspaces$ git clone https://github.com/istio/istio.git
Cloning into 'istio'...
remote: Enumerating objects: 410319, done.
remote: Counting objects: 100% (178/178), done.
remote: Compressing objects: 100% (131/131), done.
remote: Total 410319 (delta 68), reused 142 (delta 43), pack-reused 410141
Receiving objects: 100% (410319/410319), 257.70 MiB | 27.17 MiB/s, done.
Resolving deltas: 100% (271776/271776), done.
builder@DESKTOP-QADGF36:~/Workspaces$ cd istio/
builder@DESKTOP-QADGF36:~/Workspaces/istio$
Then apply
builder@DESKTOP-QADGF36:~/Workspaces/istio$ kubectl apply -f samples/bookinfo/platform/kube/bookinfo.yaml
service/details created
serviceaccount/bookinfo-details created
deployment.apps/details-v1 created
service/ratings created
serviceaccount/bookinfo-ratings created
deployment.apps/ratings-v1 created
service/reviews created
serviceaccount/bookinfo-reviews created
deployment.apps/reviews-v1 created
deployment.apps/reviews-v2 created
deployment.apps/reviews-v3 created
service/productpage created
serviceaccount/bookinfo-productpage created
deployment.apps/productpage-v1 created
Which we can verify is running
$ kubectl exec "$(kubectl get pod -l app=ratings -o jsonpath='{.items[0].metadata.name}')" -c ratings -- curl -sS productpage:9080/productpage | grep -o "<title>.*</title>"
<title>Simple Bookstore App</title>
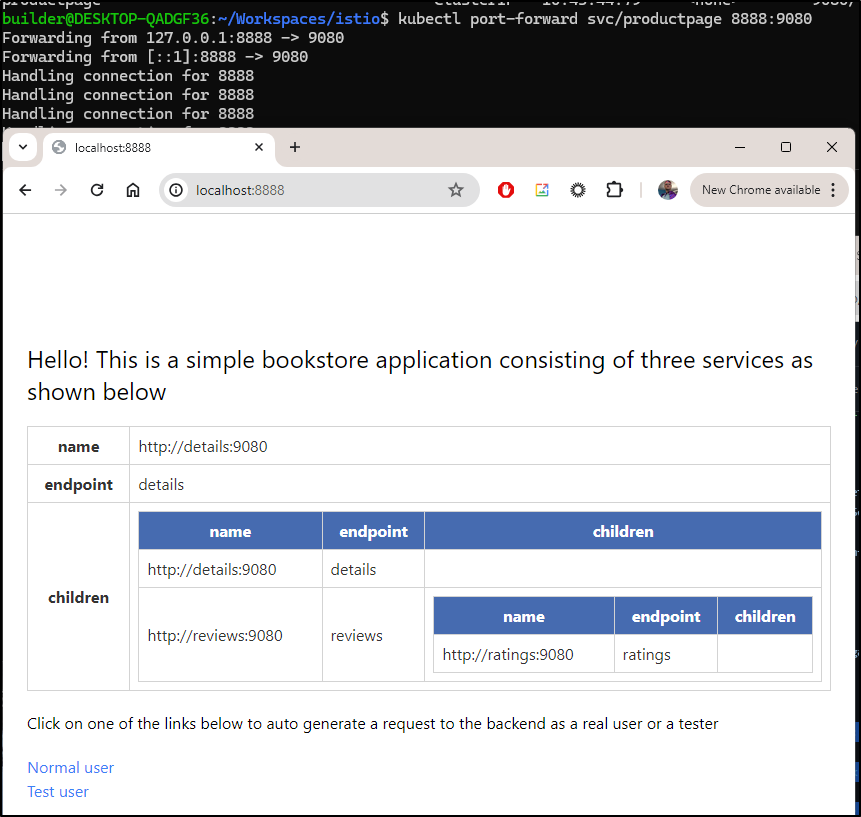
or looking at the product page service
By this time, Groundcover was all set up
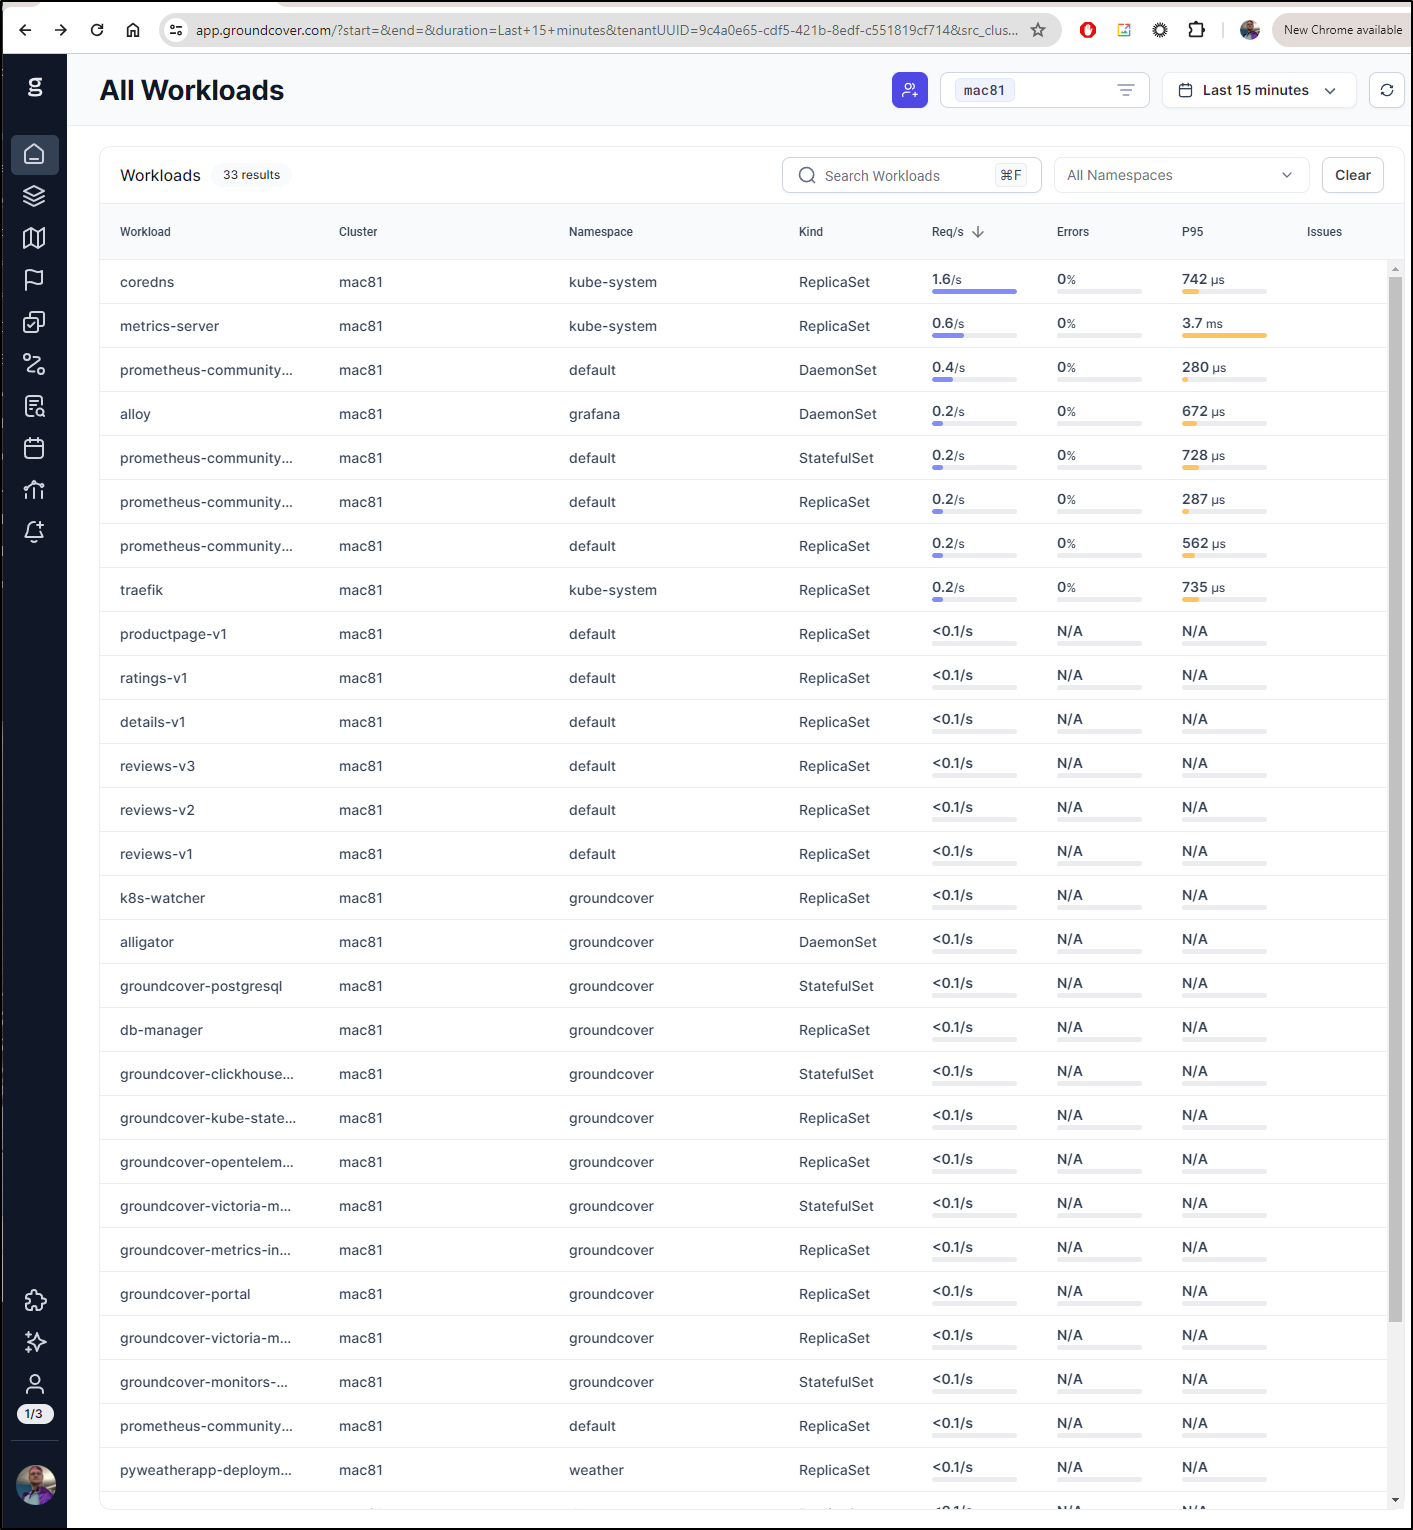
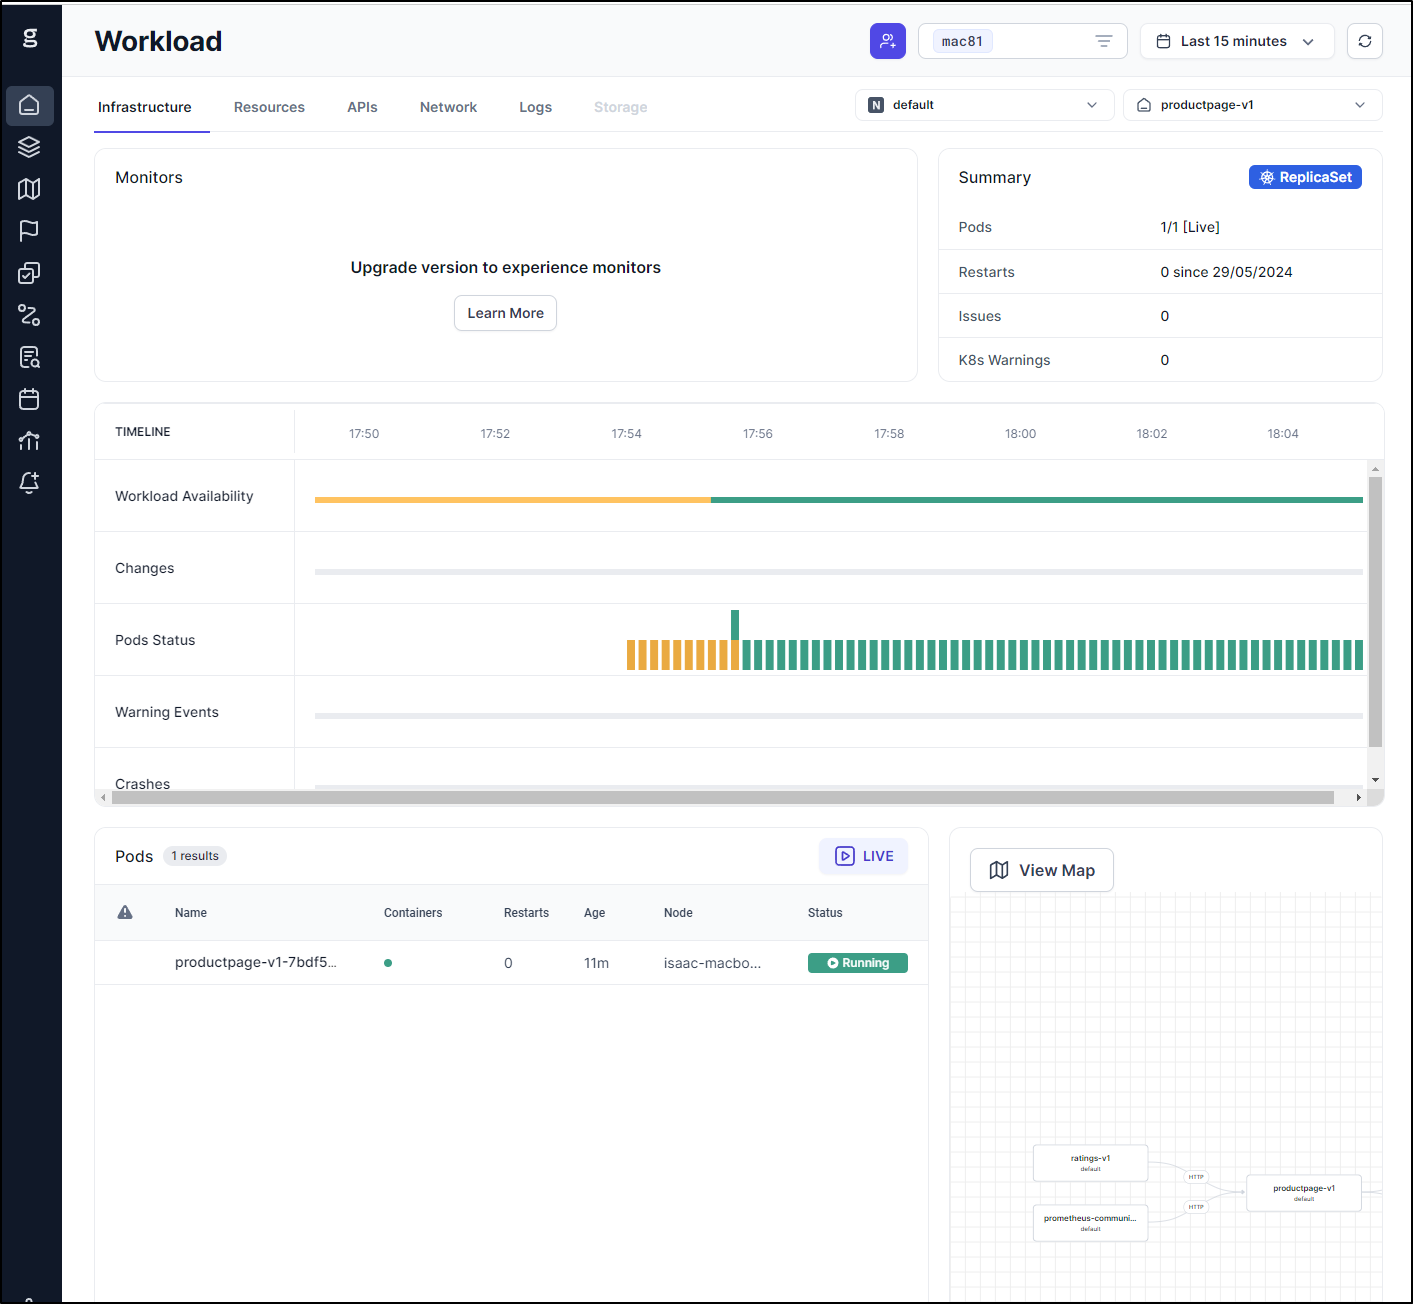
There I can see details of the cluster
including the product page
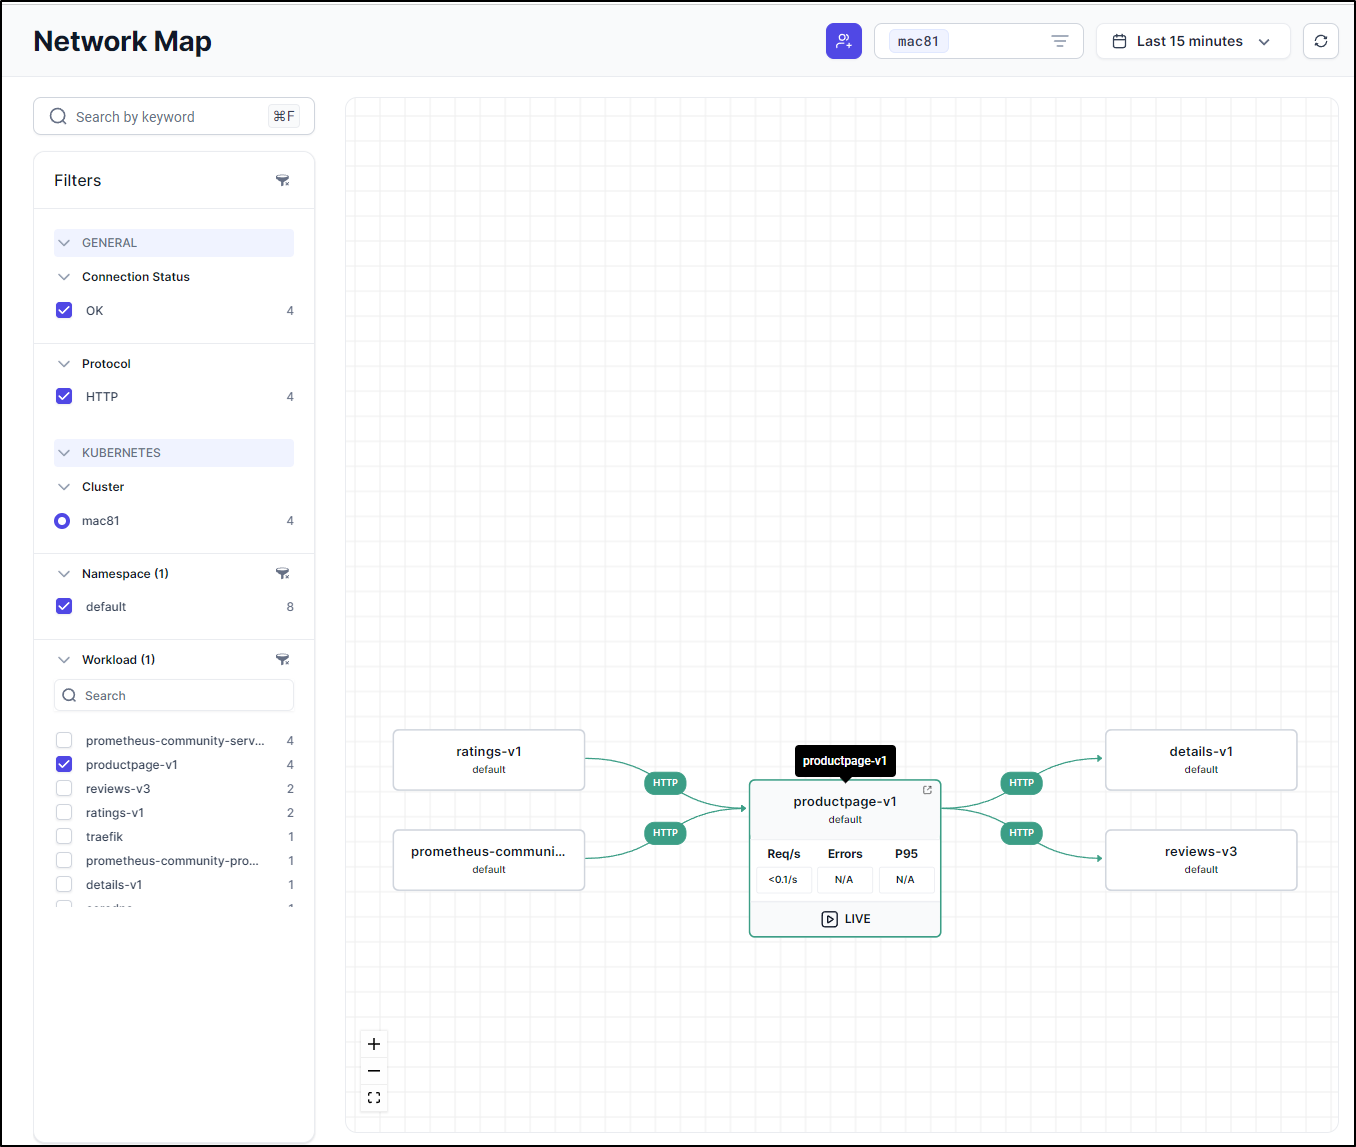
Only using its own eBPF sensors, it built the diagram of our Bookinfo app from the one visit
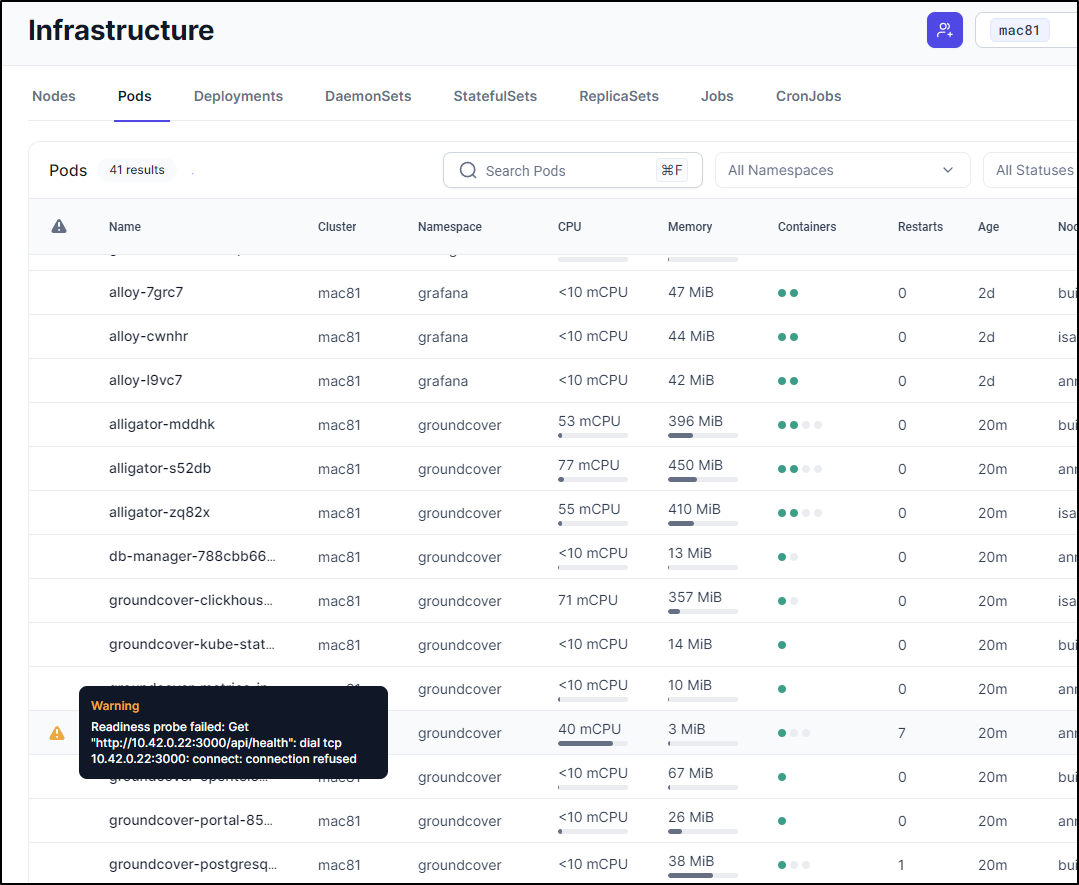
Pods
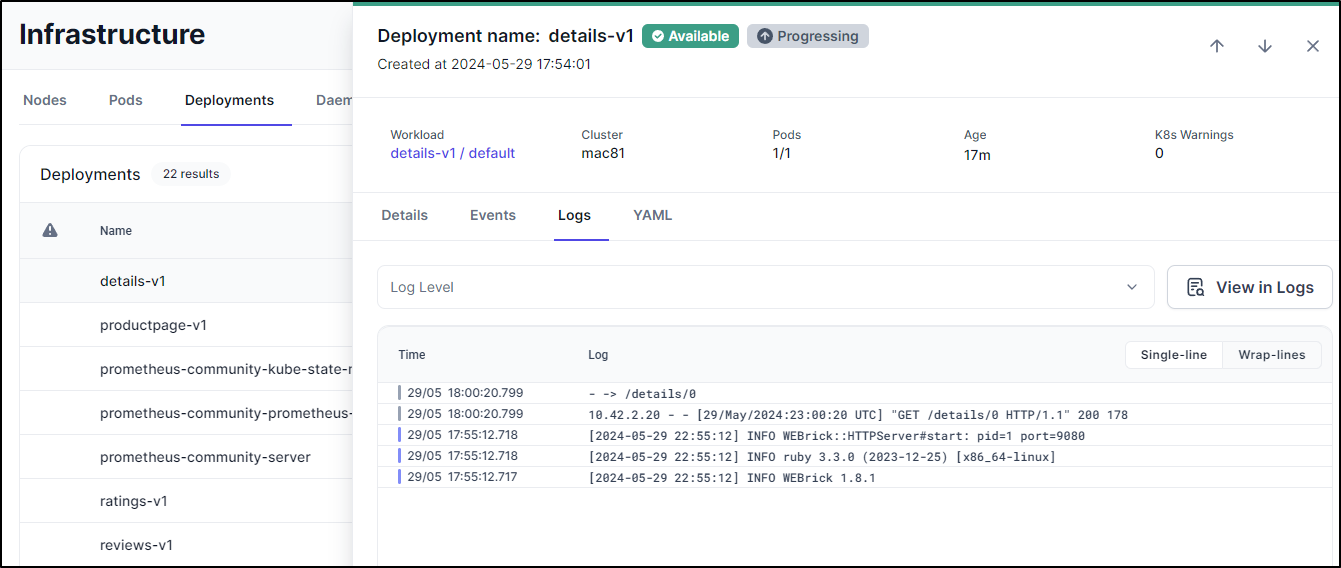
We can view all pods and any issues found will be highlighted
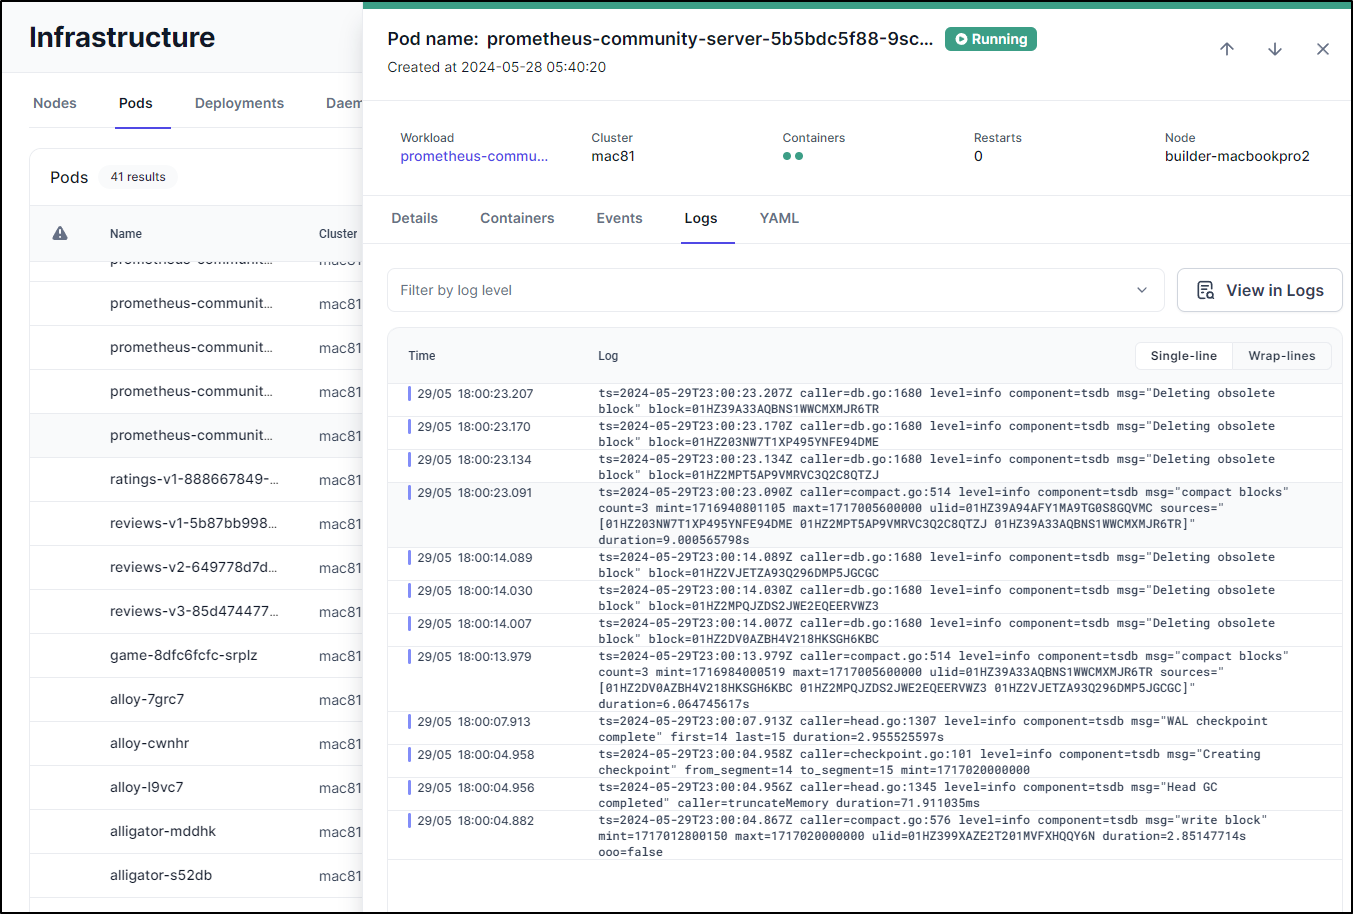
If a pod has logs, we can see it in the pod details
Infrastructure
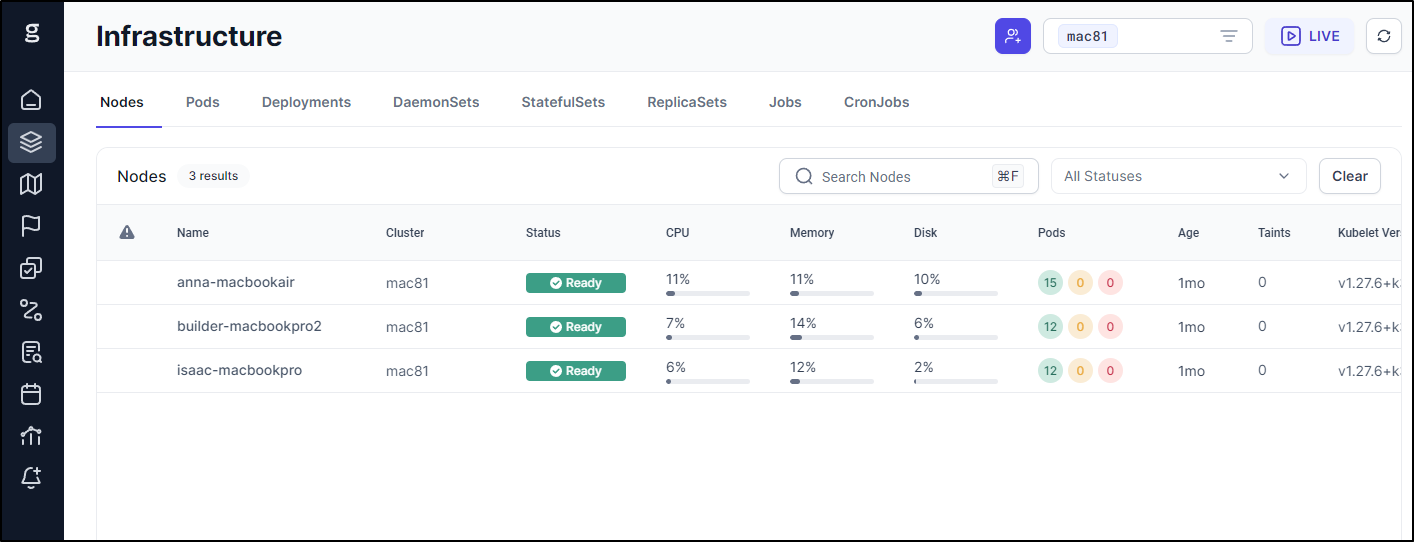
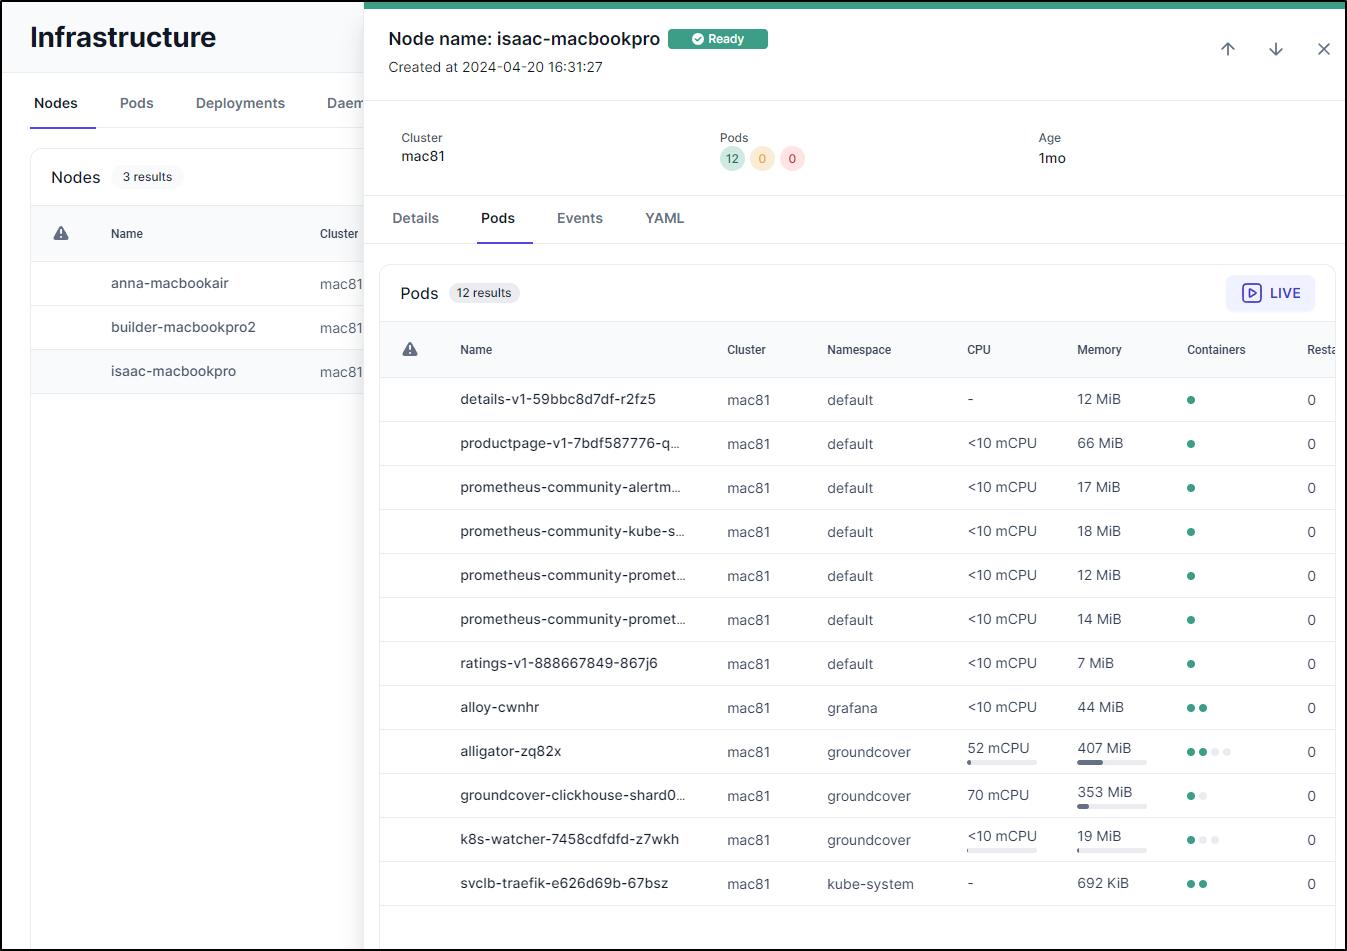
I can also view the nodes, as one might expect
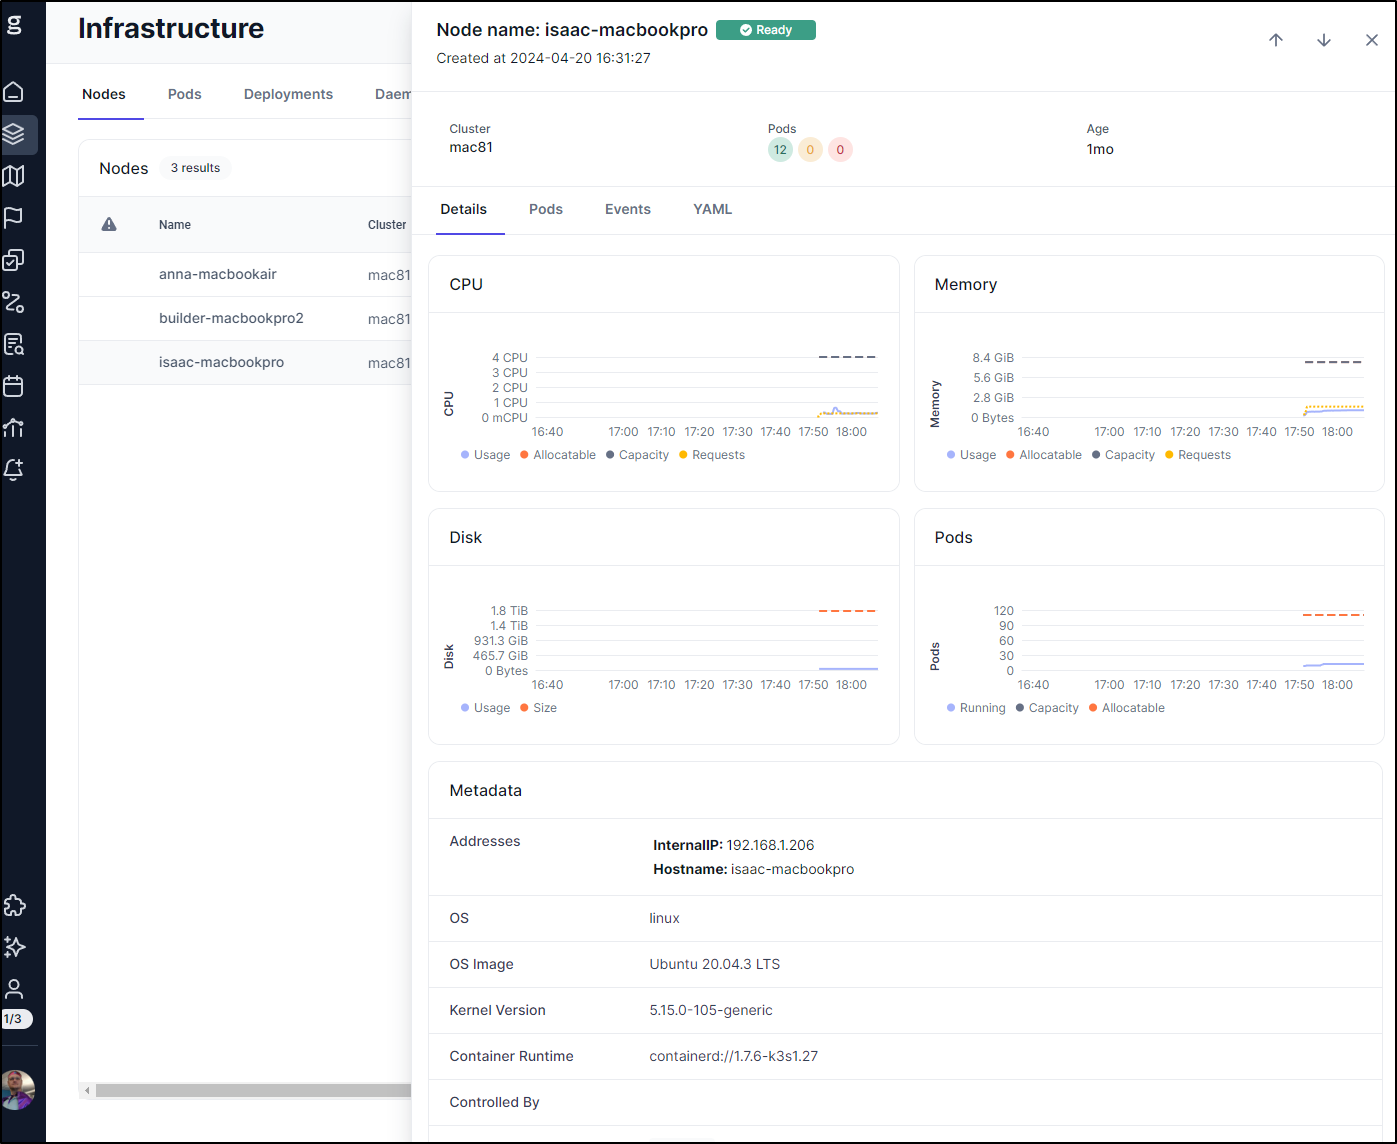
Including Node details
This can be useful when trying to find the large consumers of resources. Here we can see bulk of the isaac-macbookpro node’s memory is being used by clickhouse and alligator
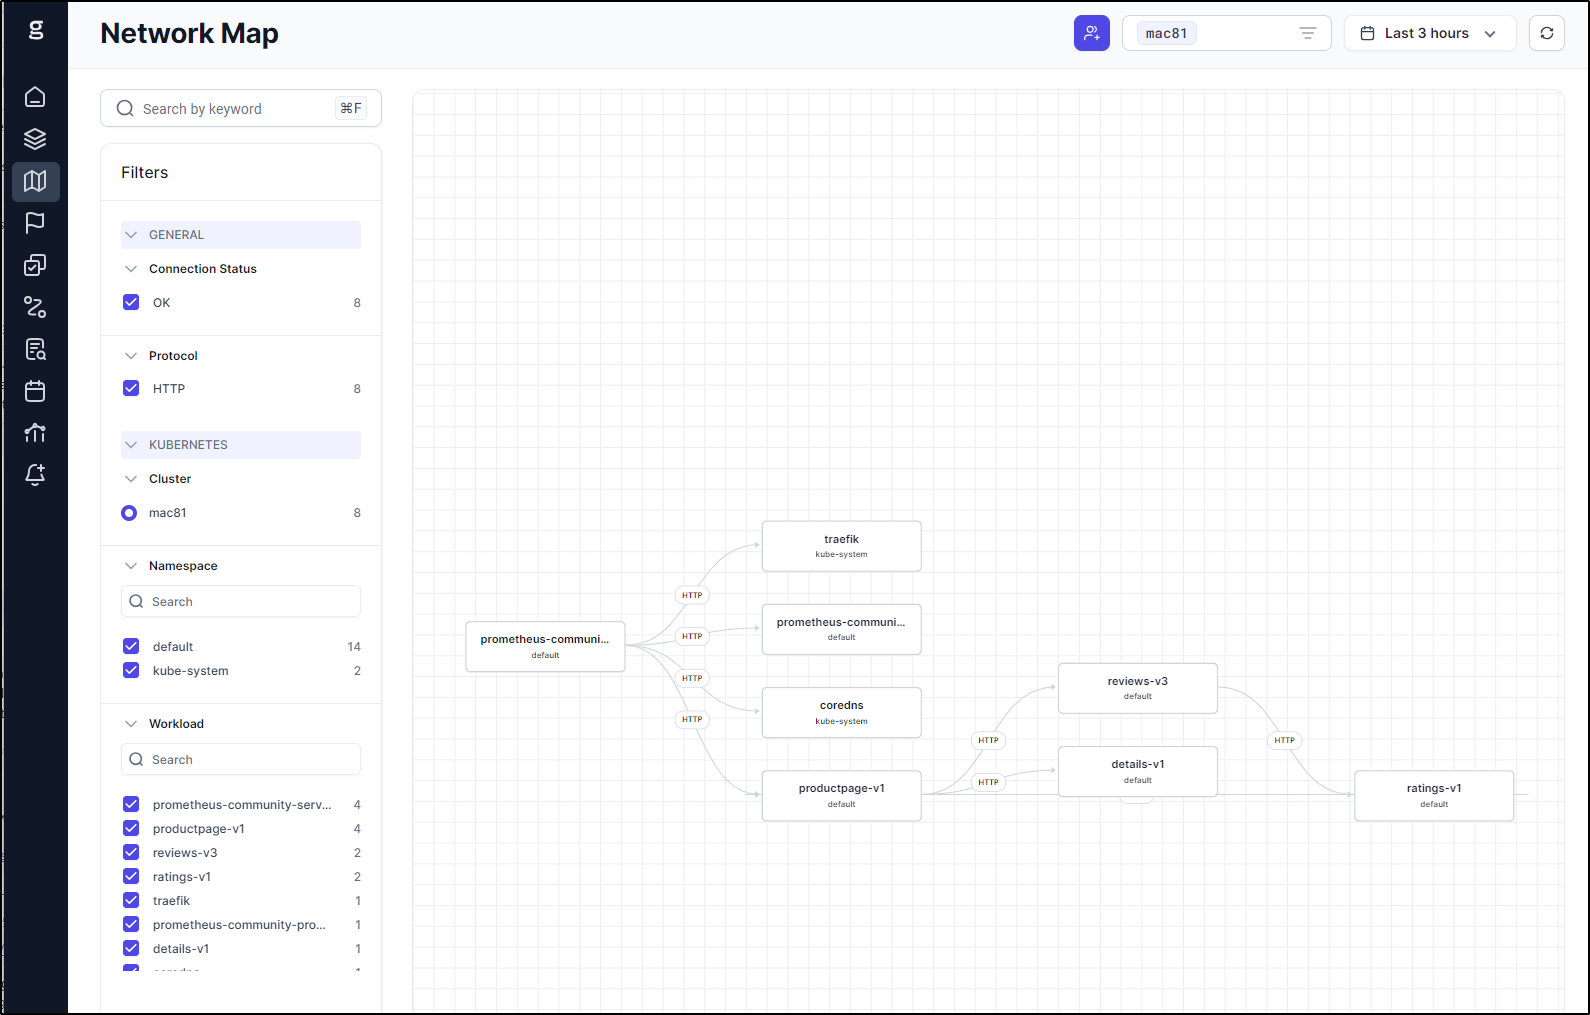
Network map
I can view the whole cluster from a network map view
I found some of the UI had some challenges with my chrome (or this University Guest wifi I am on at the moment)
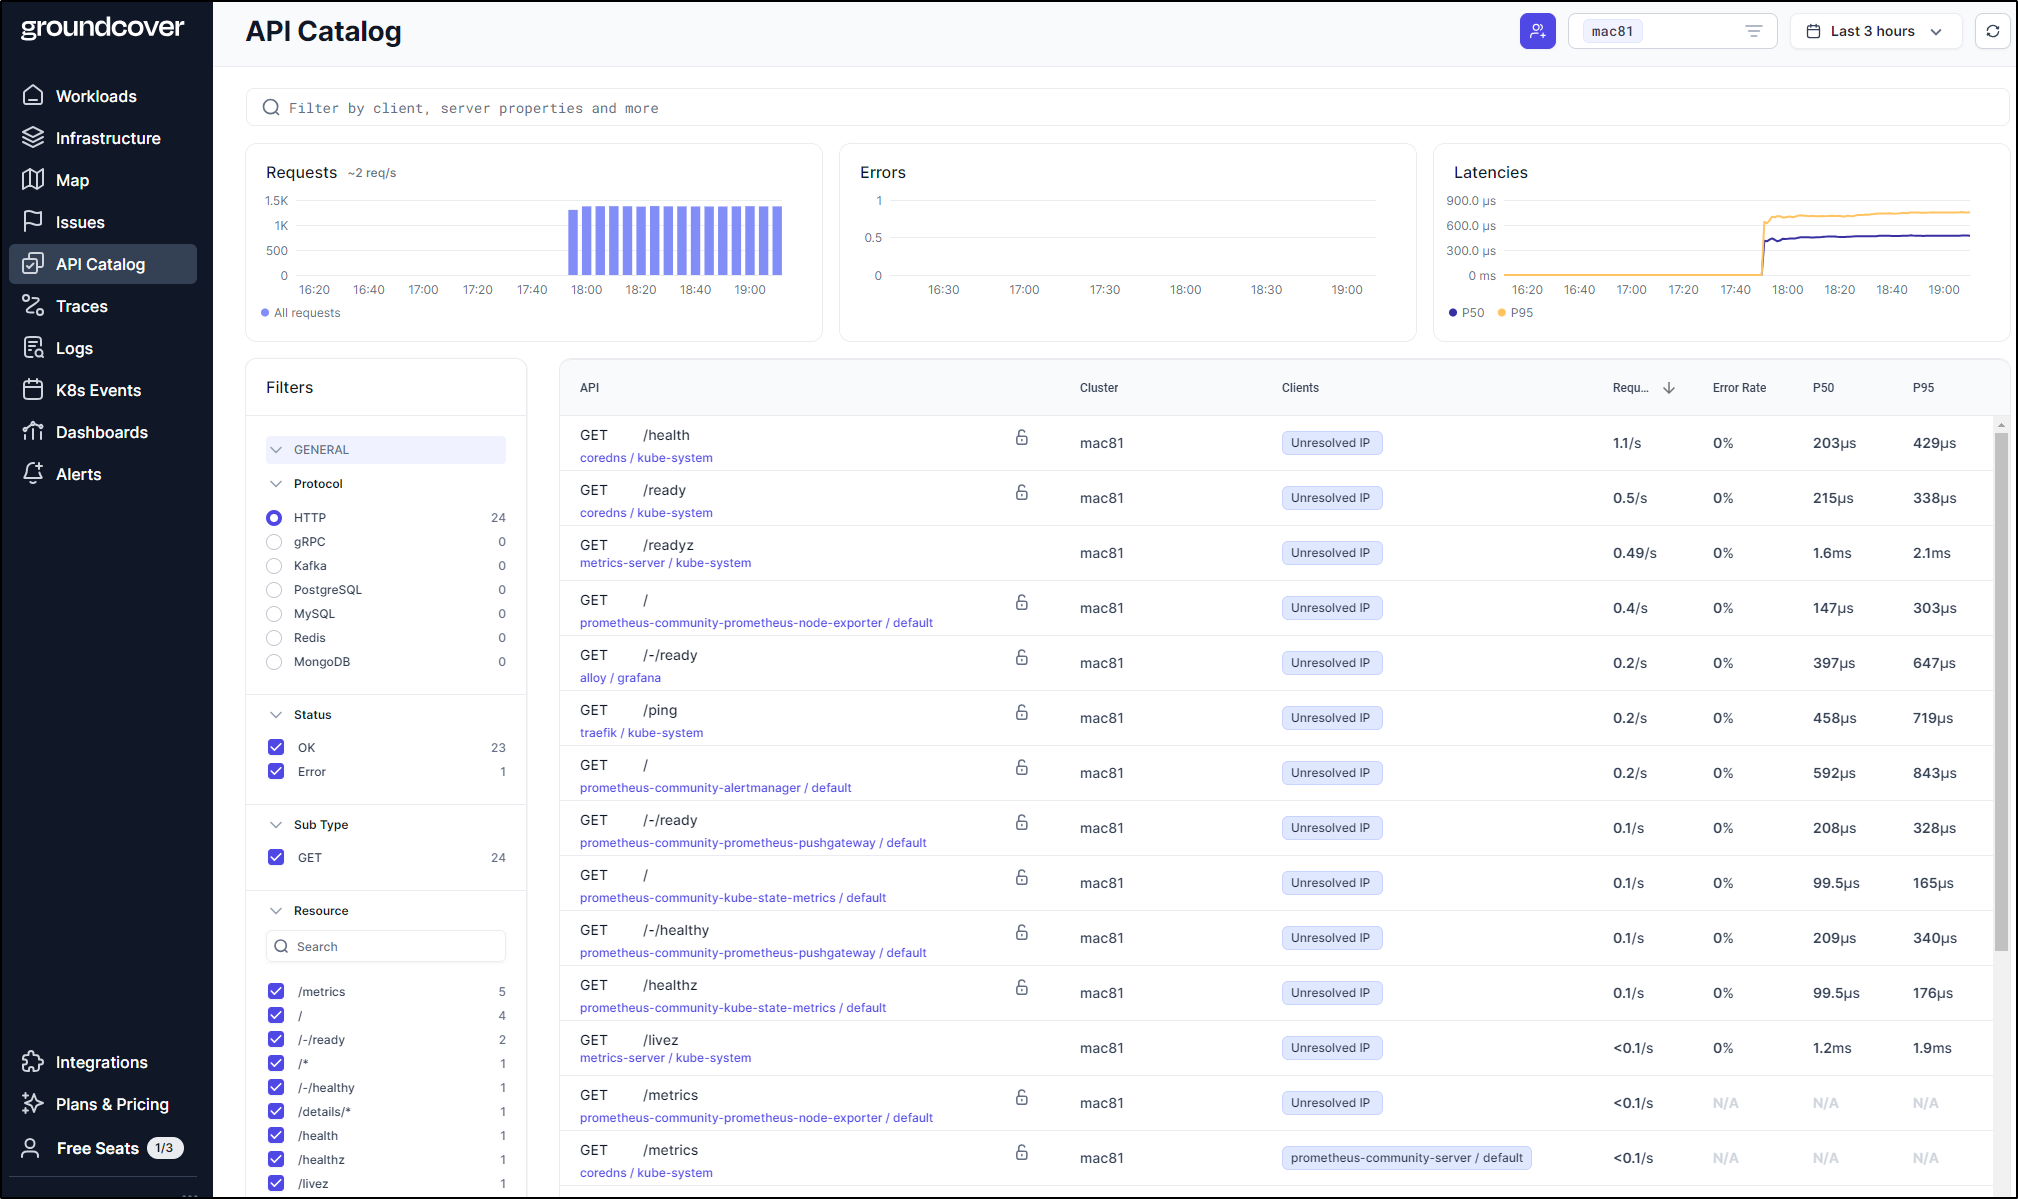
API Catalogue
I believe this comes from discovery
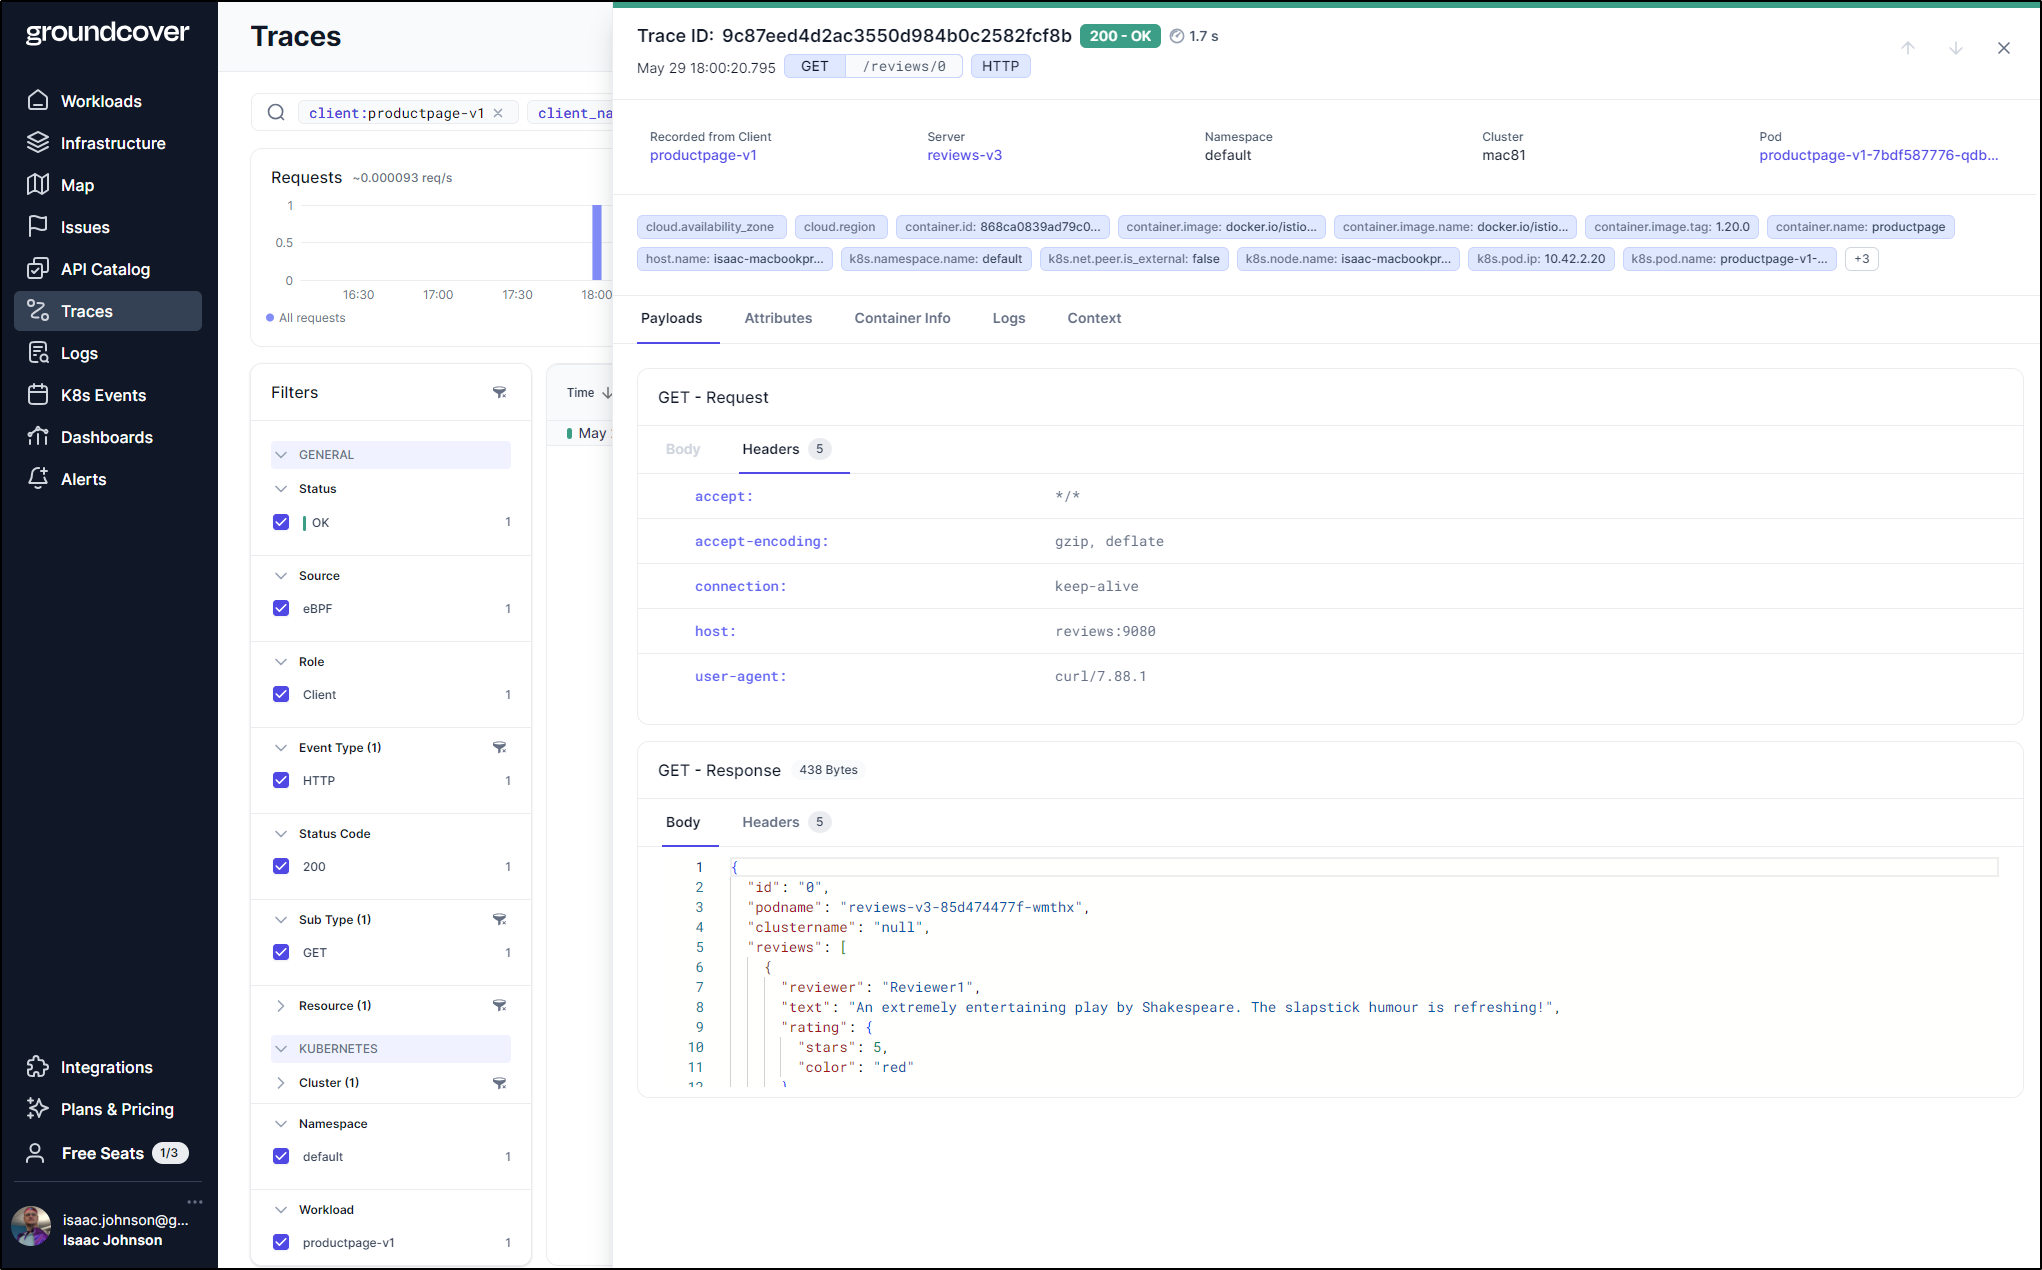
For instance, from the BookInfo app, it found the API call to reviews
Including the body
{
  "id": "0",
  "podname": "reviews-v3-85d474477f-wmthx",
  "clustername": "null",
  "reviews": [
    {
      "reviewer": "Reviewer1",
      "text": "An extremely entertaining play by Shakespeare. The slapstick humour is refreshing!",
      "rating": {
        "stars": 5,
        "color": "red"
      }
    },
    {
      "reviewer": "Reviewer2",
      "text": "Absolutely fun and entertaining. The play lacks thematic depth when compared to other plays by Shakespeare.",
      "rating": {
        "stars": 4,
        "color": "red"
      }
    }
  ]
}
Logs
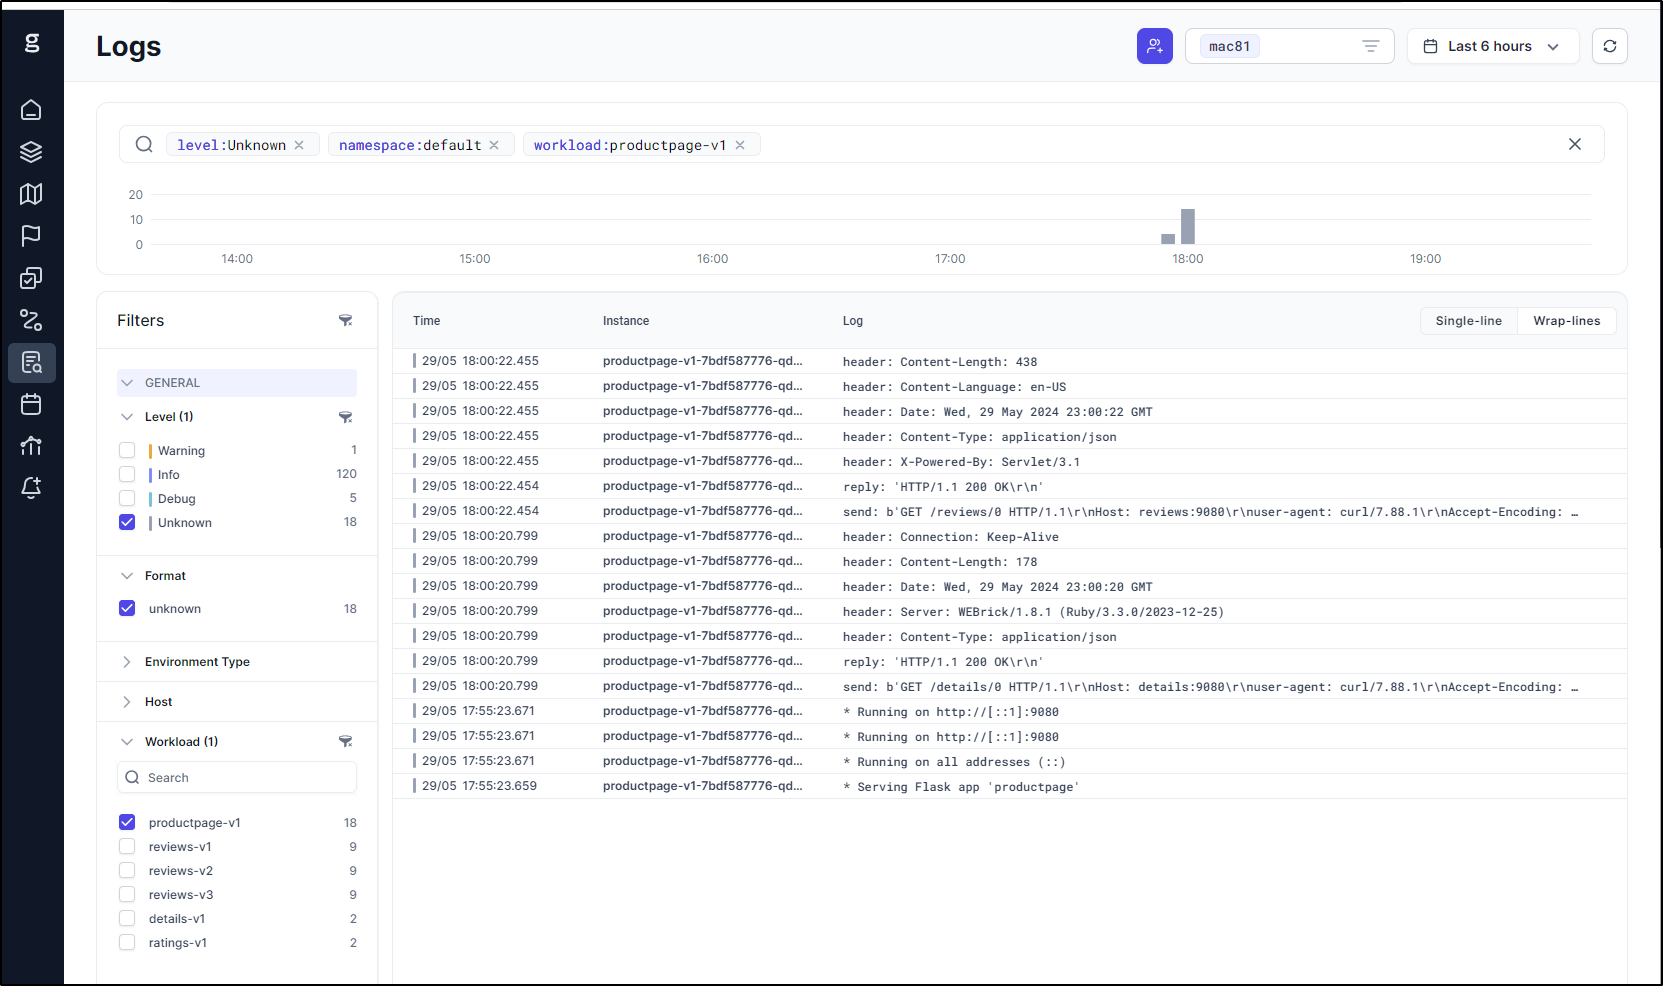
Let’s look at logs.
We can search on filters, including detected workloads
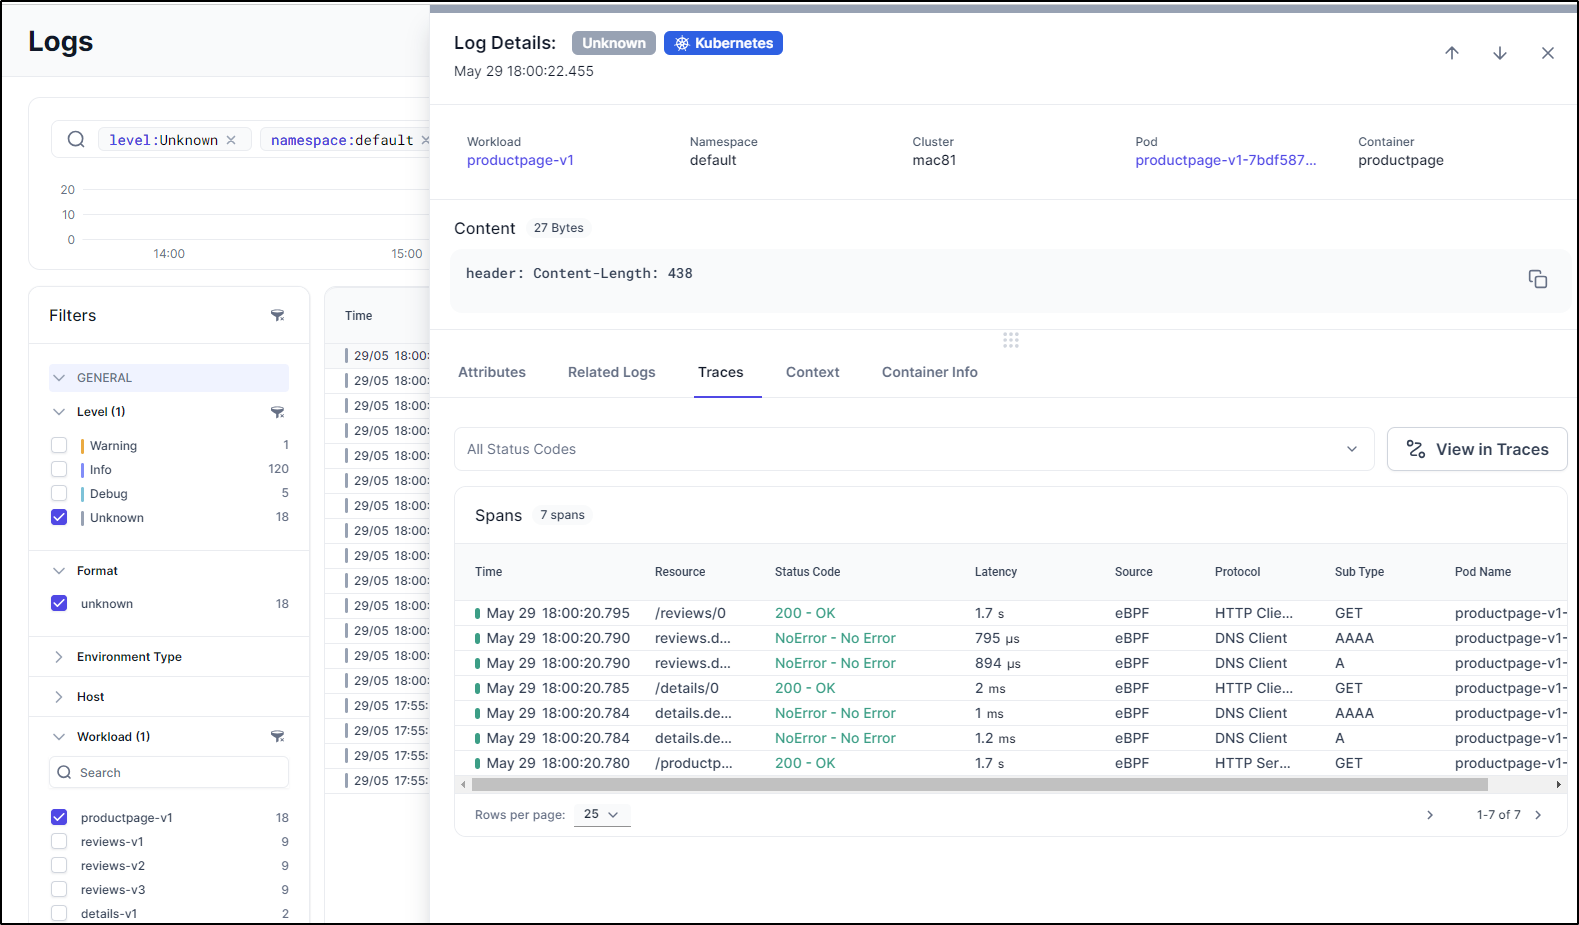
I can then tie that back to traces
What I cannot do, when thinking on tools like Datadog, is create an alert or log based dashboard right from Logs
Dashboards
Dashboards are really just fronting Grafana.
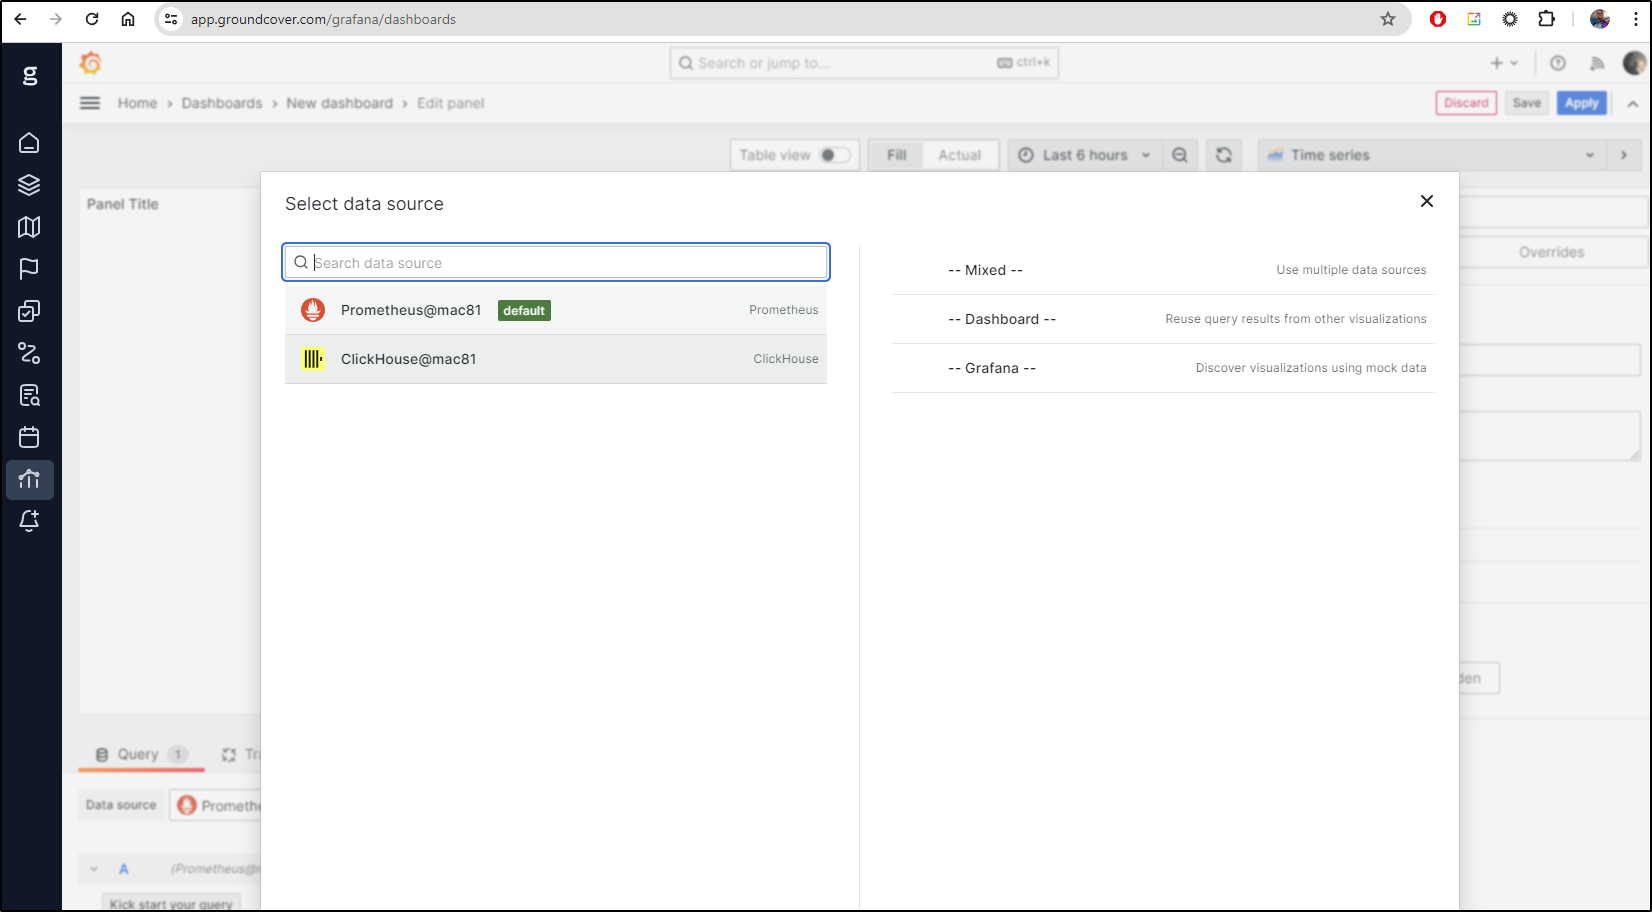
We can create a new Dashboard from Prometheus metrics for Clickhouse
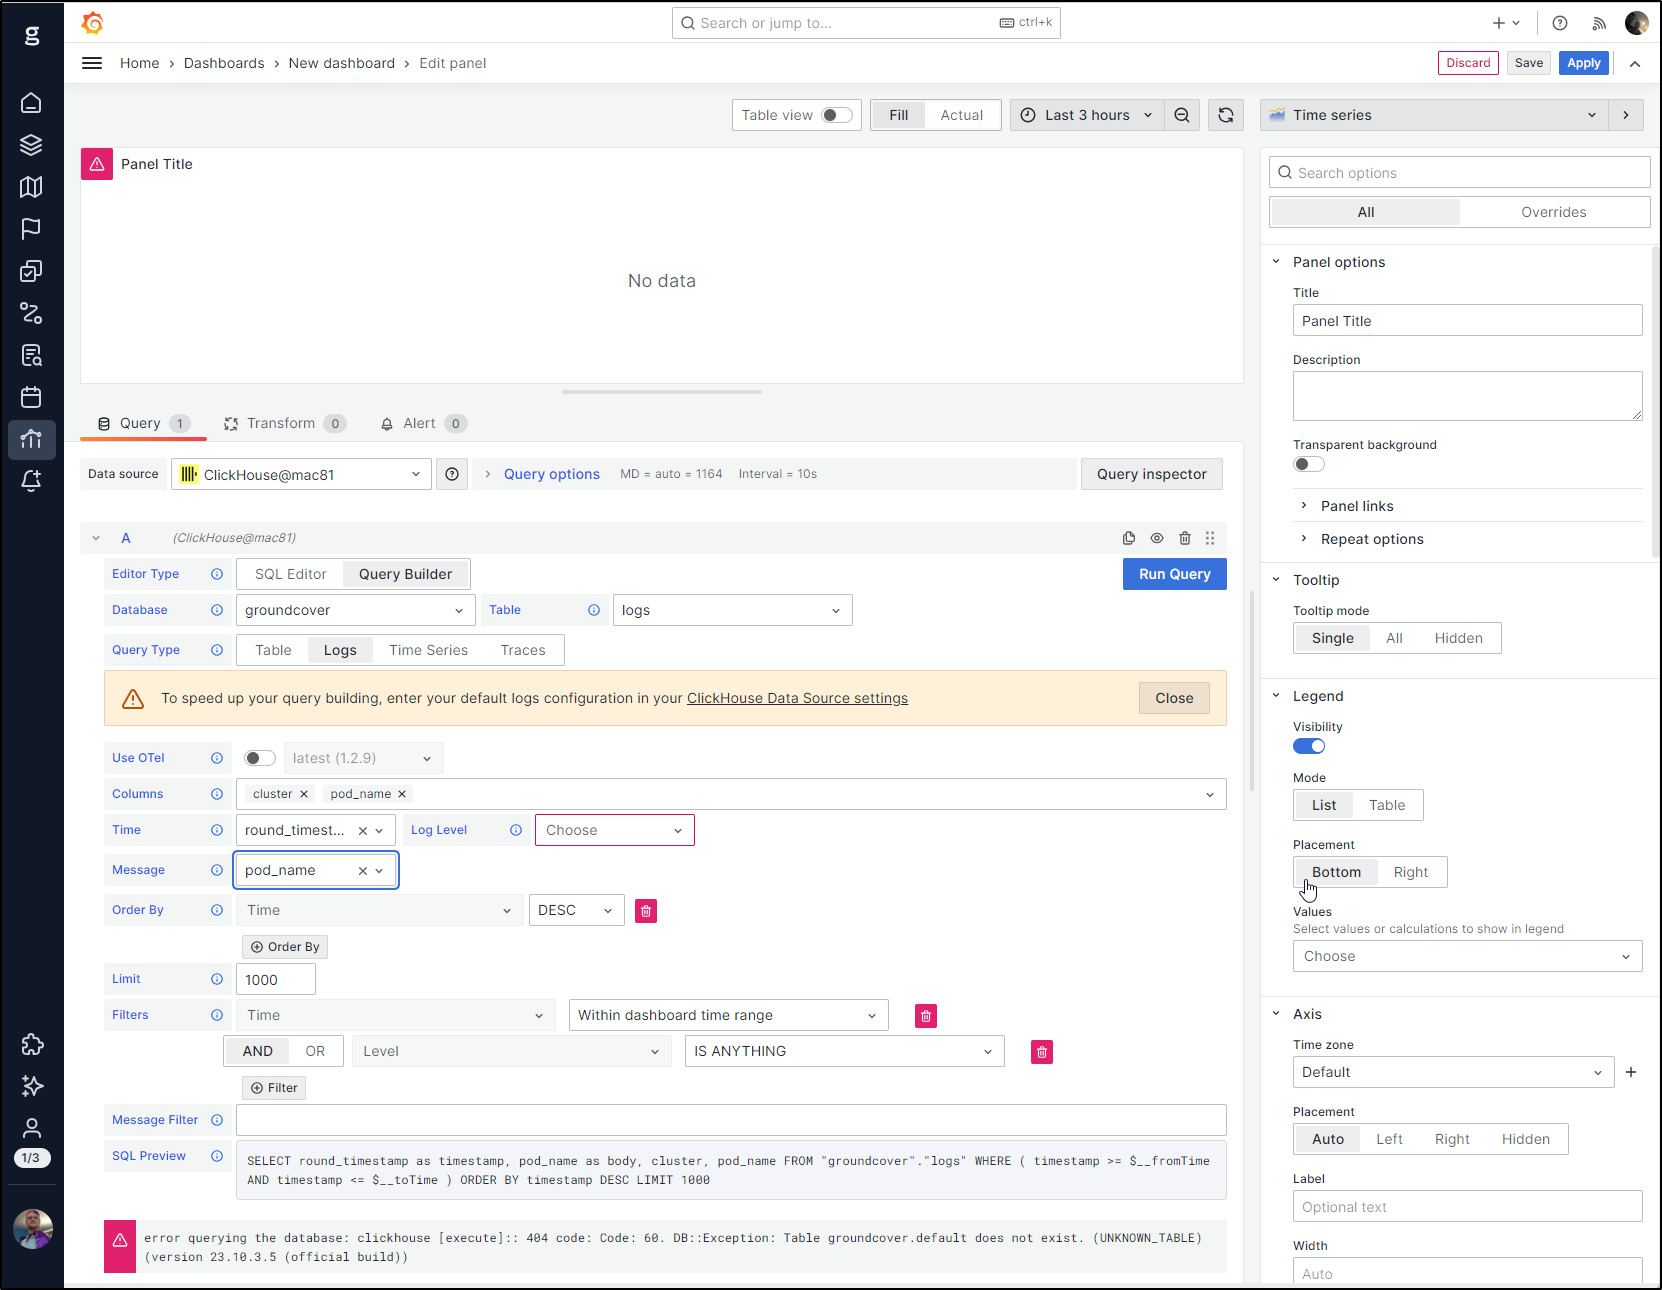
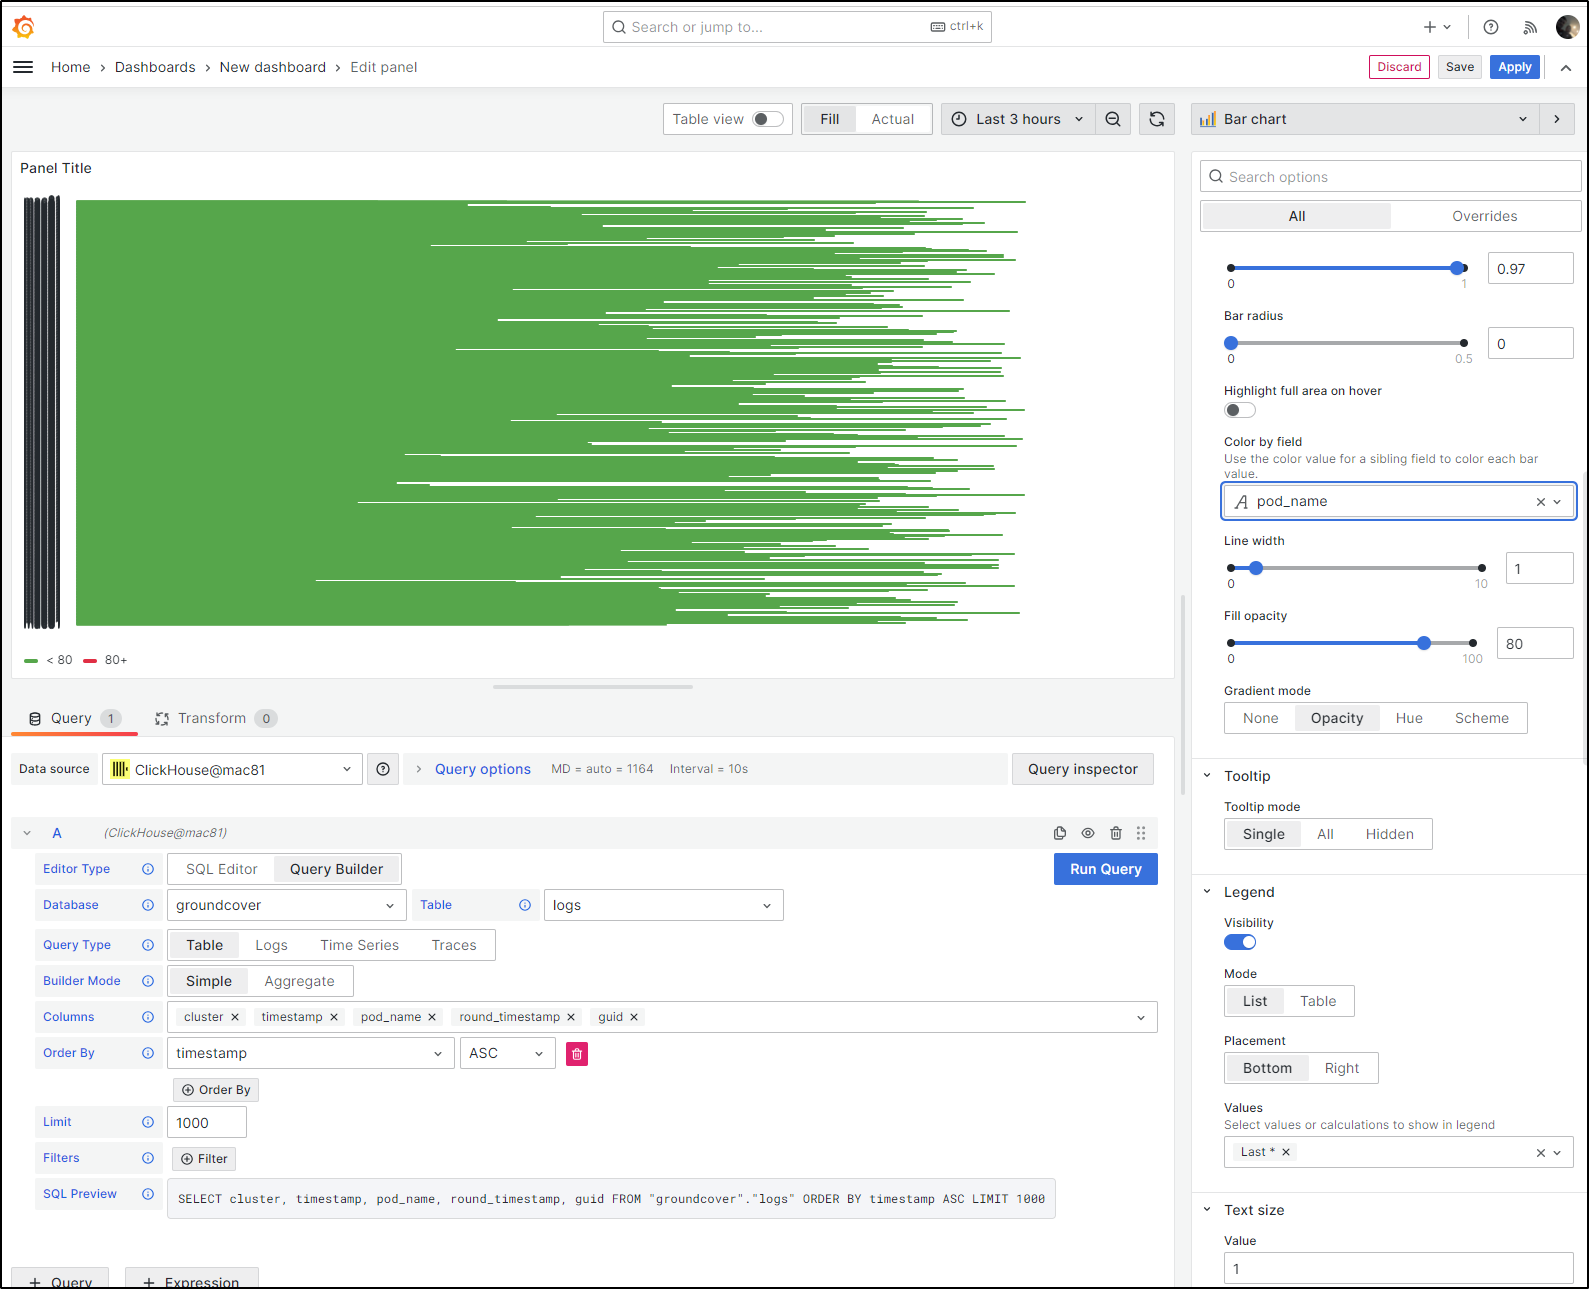
Let’s pull some visualizations on logs from Clickhouse for this cluster
SELECT round_timestamp as timestamp, pod_name as body, cluster, pod_name FROM "groundcover"."logs" WHERE ( timestamp >= $__fromTime AND timestamp <= $__toTime ) ORDER BY timestamp DESC LIMIT 1000
One can make a mess in dashboards without much effort
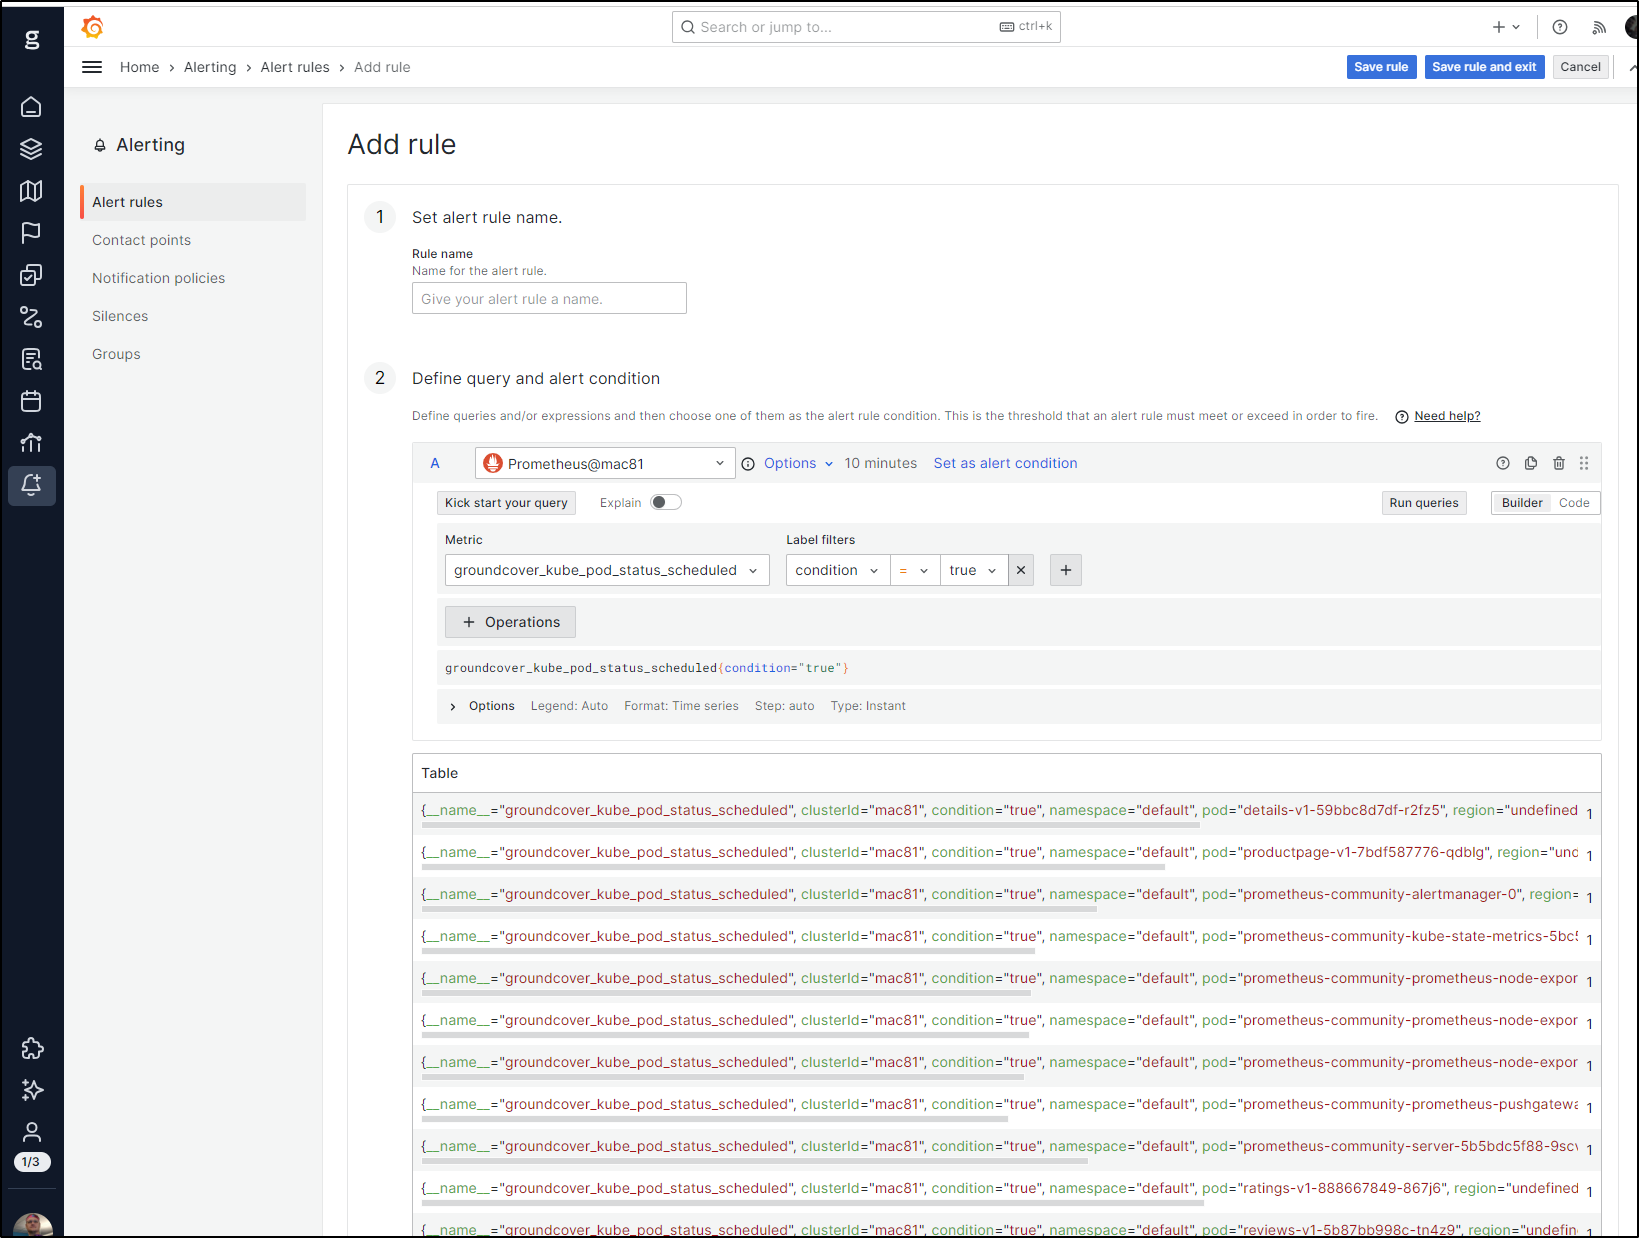
Alerts, I might add, also go through Grafana.
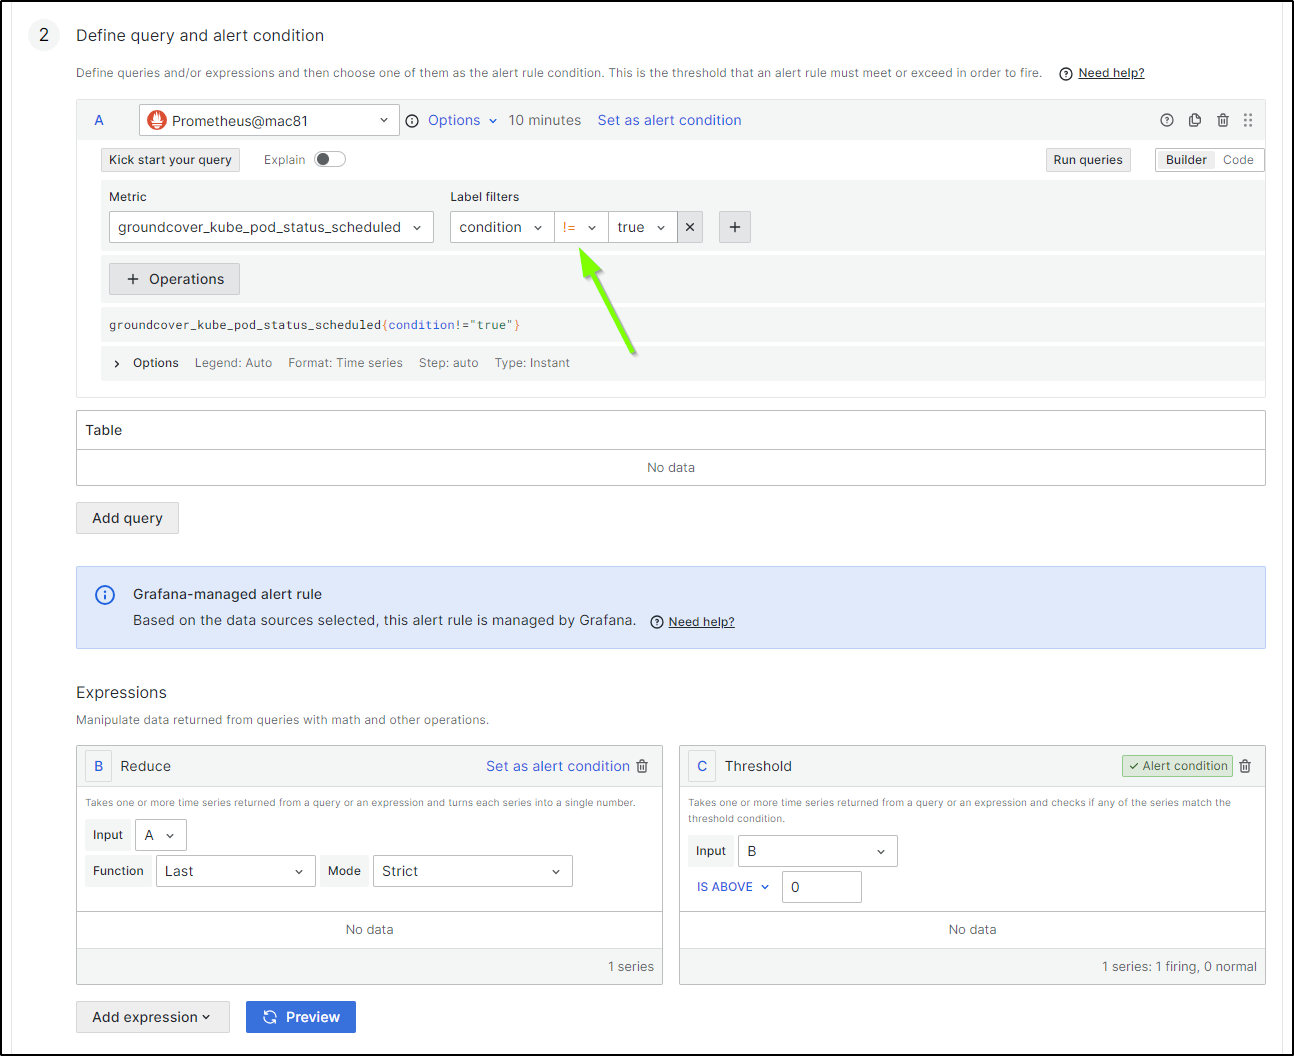
For instance, I can create an alert on Prom metrics
I usually do as above - create an alert on the negative (good) condition then switch the operator
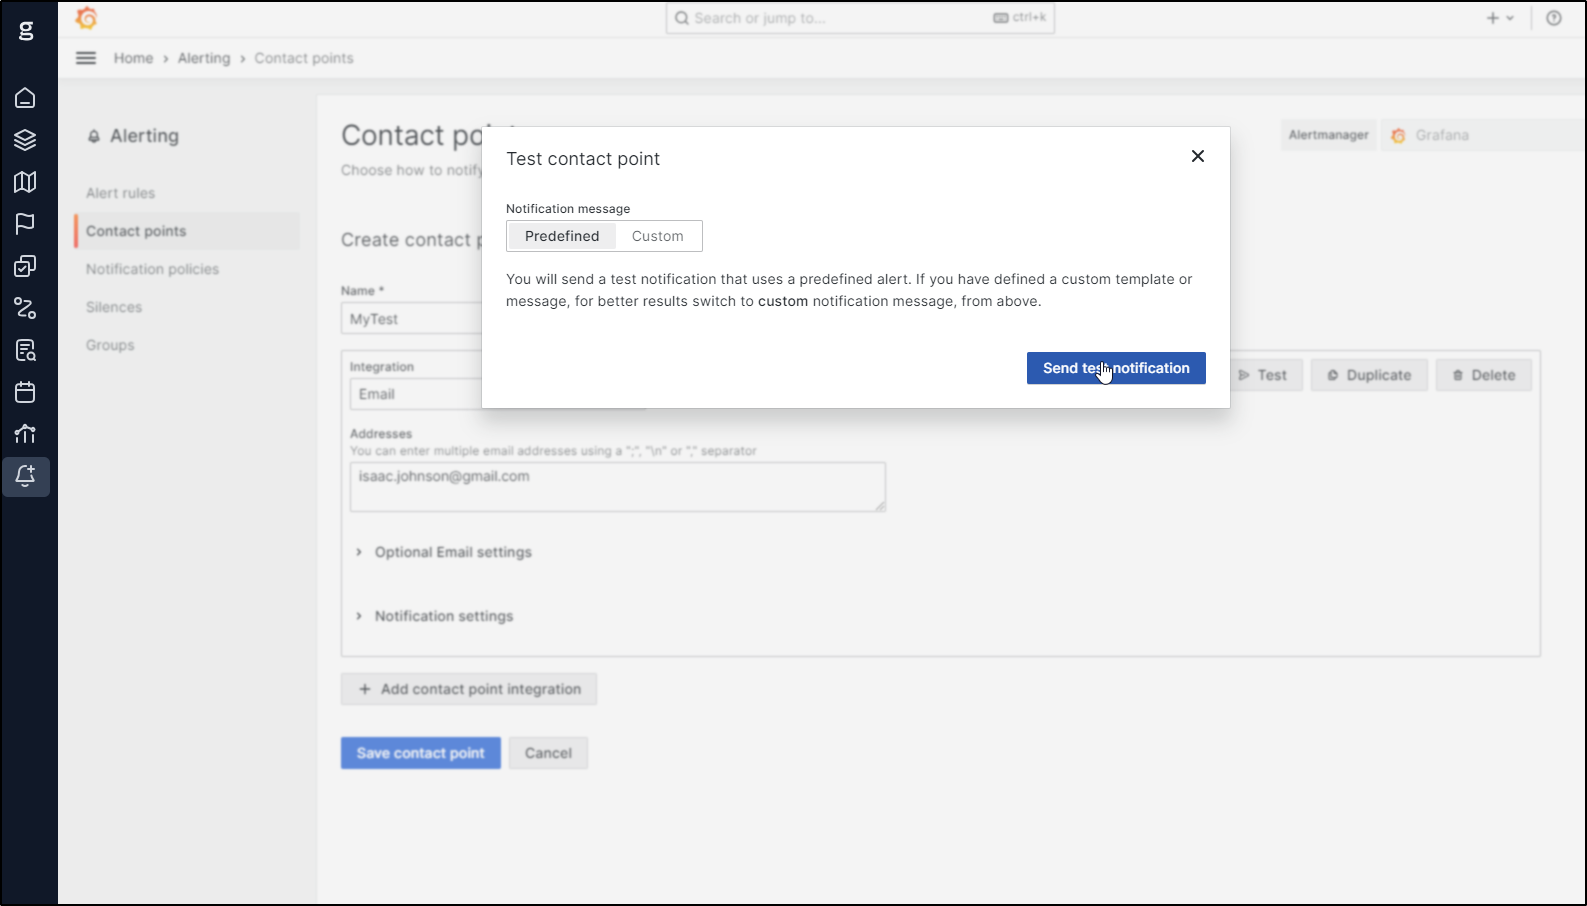
I wanted to at least test notification points and see if email was properly setup.
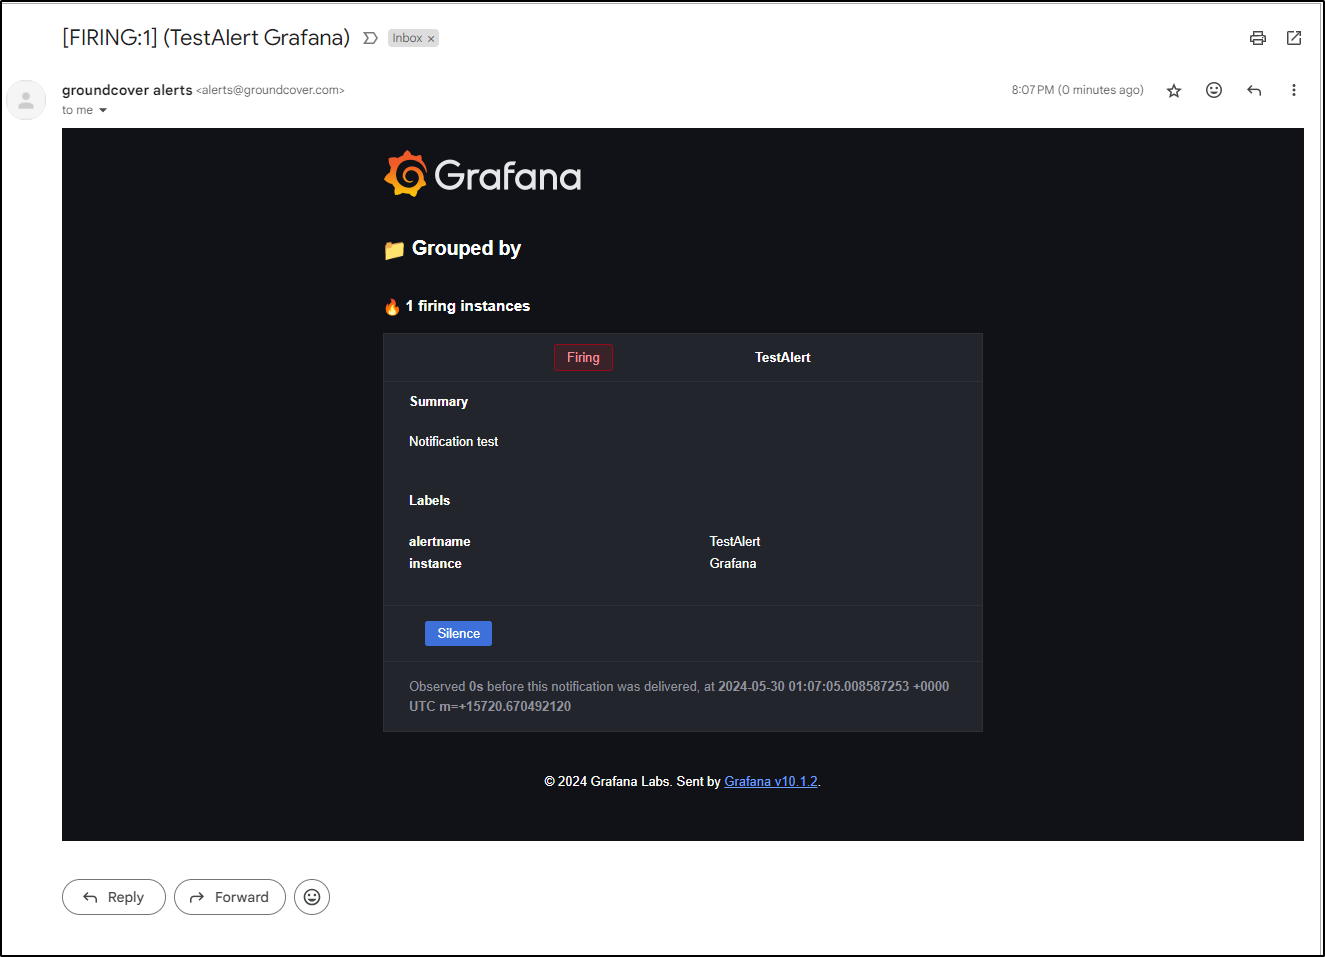
I created a test email to myself
Which I could see came from alerts@groundcover.com
Pricing
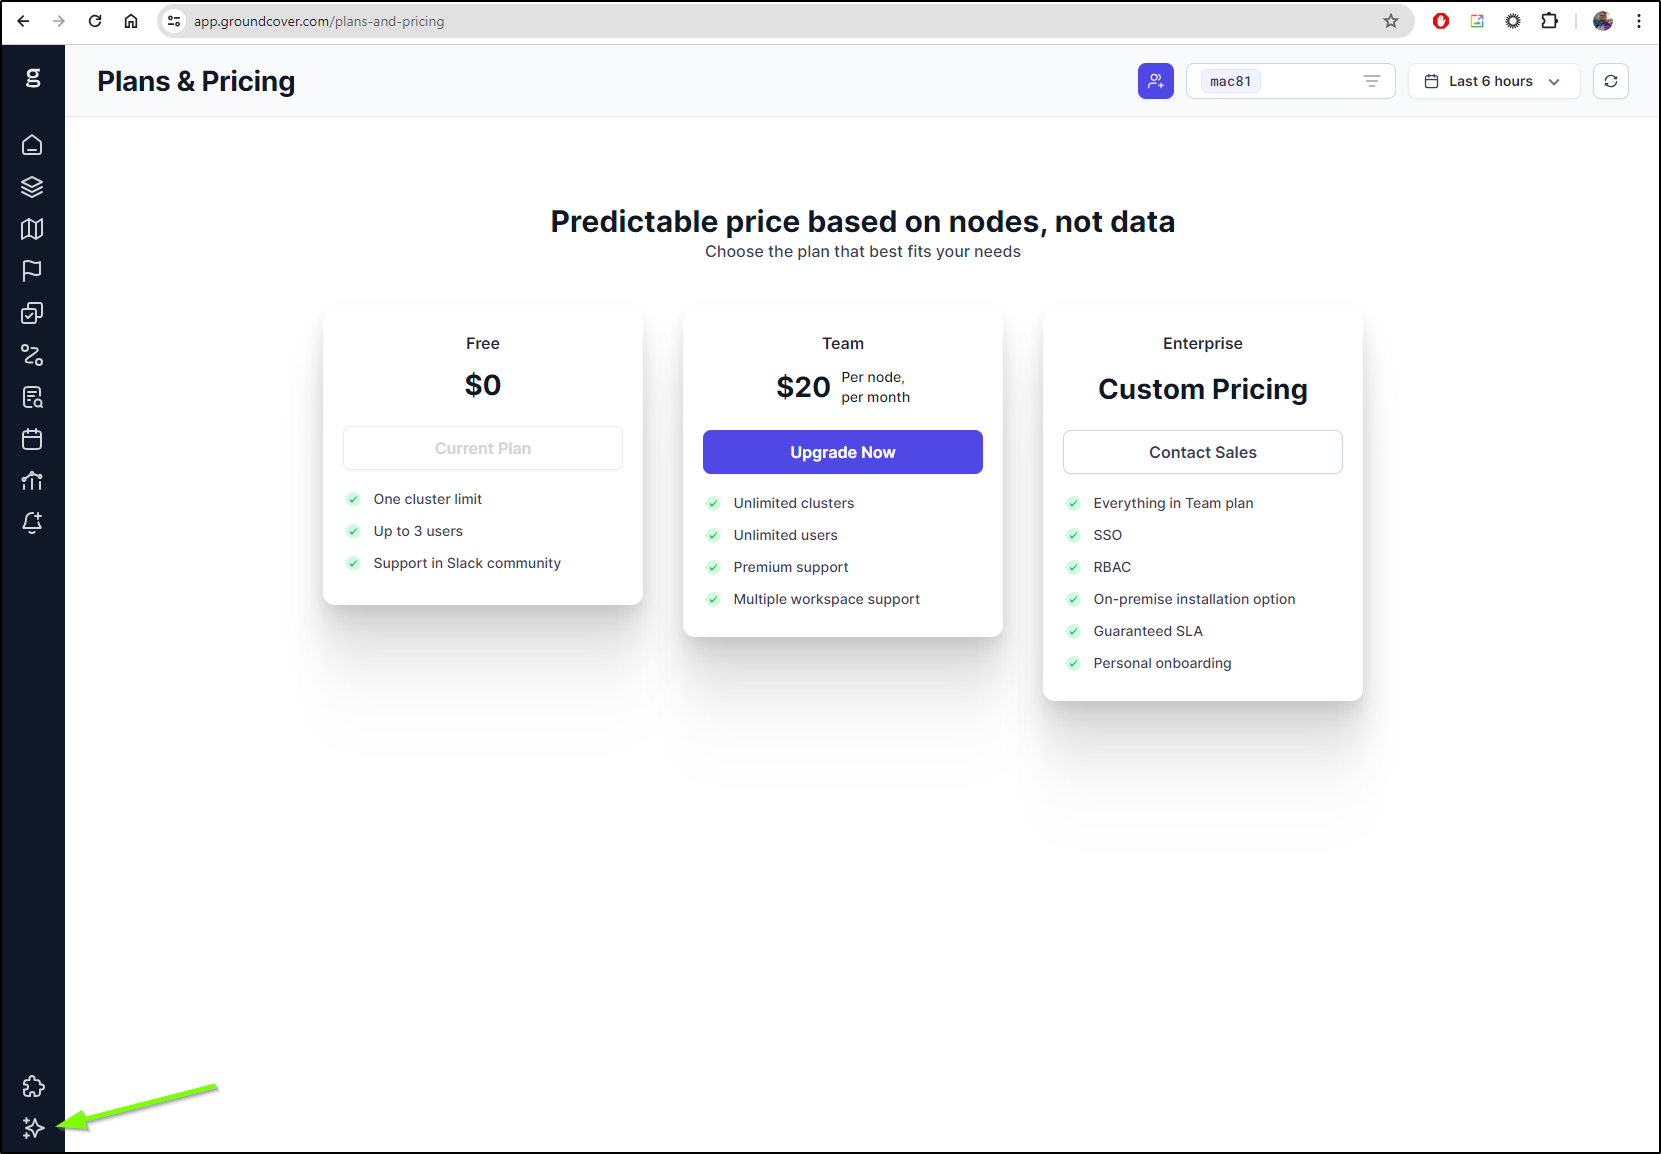
We can click the Pricing/Subscription icon to see pricing
This is where it is a bit of a problem for me. I have two clusters I would love to monitor, however as it stands, to move from the free “1 cluster” to one person with two clusters (with a total of 7 nodes) moves me to $140/month. That is just a bit beyond where I, as a hobbyist, is willing to tread.
I might suggest they think of gifting at least two clusters to the free tier, just so i can monitor a “main” and have one cluster free for a “test”. That said, I could use an alternate email, but that would be cheating.
At the enterprise level, $20/node is very reasonable. I can recall Instana pricing several years ago (before IBM bought them) and it was around $80/node/month.
To be fair, most of the compute and data lives in my cluster so they are really just handling their software and configuration of some intertwined opensource tools
History
Groundcover was founded by Shahar Azulay (CEO) and Yechezkel Rabinovich (CTO) in August 2021. The former was at Apple prior as a Machine Learning Manager and the latter at a medical software security company (CyberMDX) which was later acquired by Forescout.
Summary
This brings us to the real question - is it better to have a single pane of glass and managed control plane or just link these OS tools myself? I could just as easily install and configure Prometheus, Grafana and Clickhouse myself. I would have an operational cost of maintaining them and setting up things like email servers, but that might be a one-time cost.
However, the other side of me compares this with to some leading APM providers like Datadog, Dynatrace and New Relic. I would pay 10c, 20c and 30c, respectively for 1Gb of log ingest for each of those. Here i could store TB of logs (if i have that much space to grant the PVCs) for no extra charge. I have known places to use ELK for just such reasons.
Overall, I really find this to be a fascinating play.


