Published: Aug 16, 2023 by Isaac Johnson
Two distinct things happened:
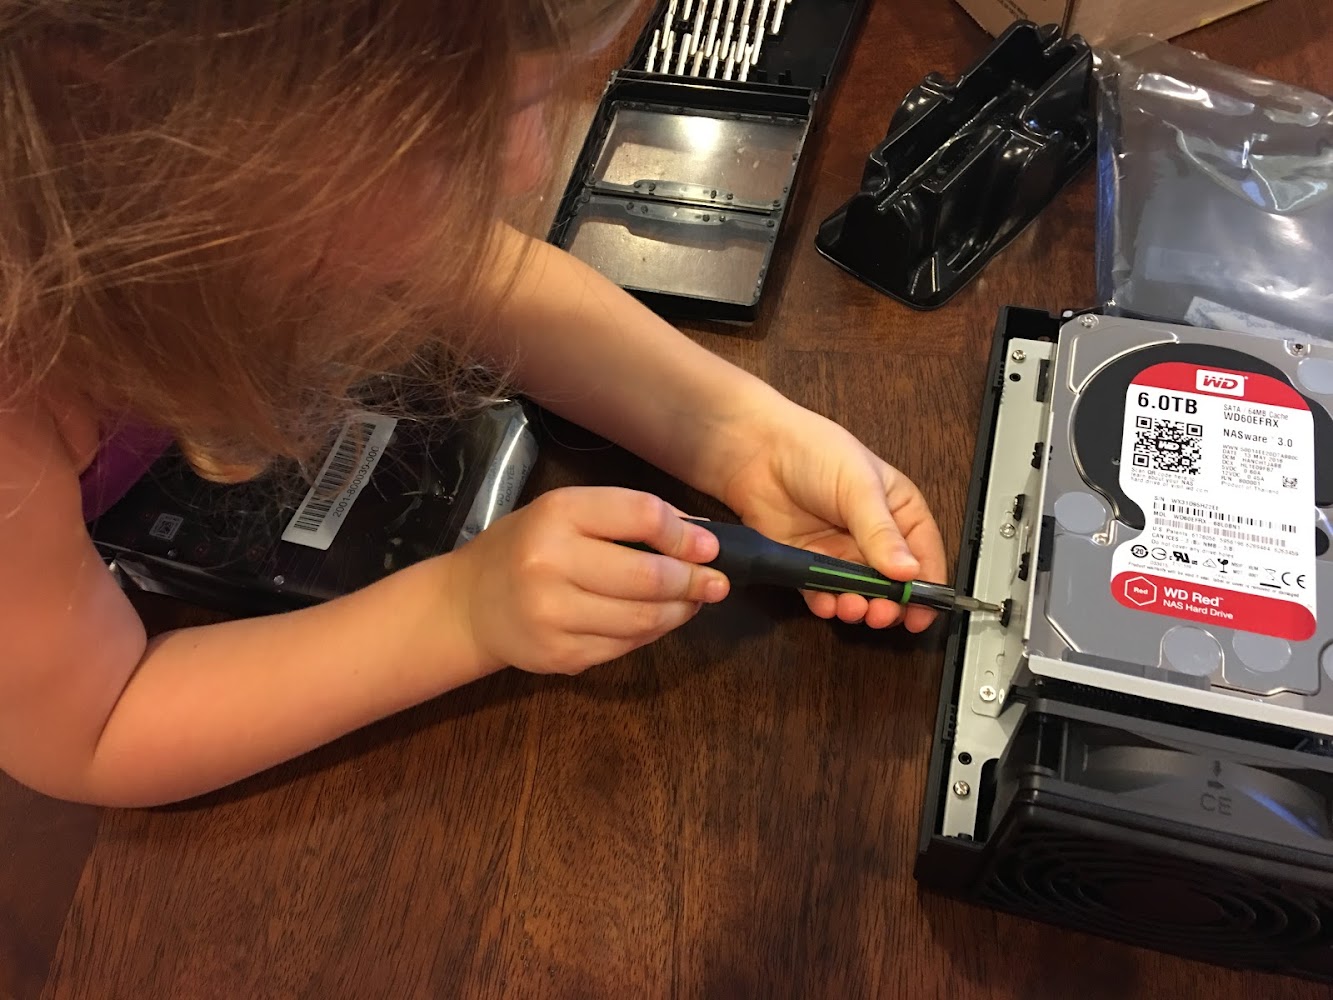
First, this NAS below, SassyNassy, for which my 4-yo daughter was installing one of the two 6TB drives back in Aug 2016 below, finally died.
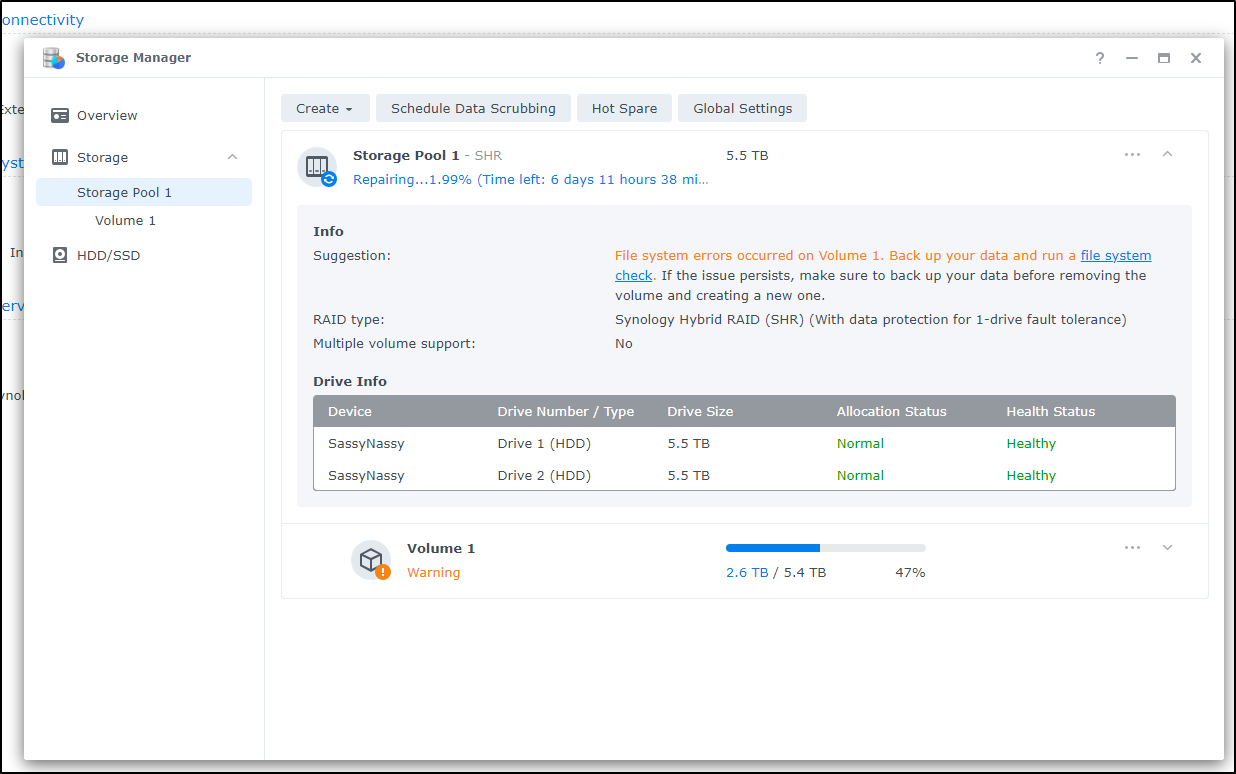
It died after another power outtage. One of the two NAS drives was already showing SMART errors and needed replacement, regardless.
I did fix it, running down to Microcenter to get a new one and archiving all photos to my new NAS (SirNasilot).
Second, within days of our power outtage, the A/C in our house died. It was not fun. I have no right to complain about hot. There are many places of the world in triple digit temps. But it was into the high 80s (F) in the basement and my laptop (MacBook air) was screaming hot and dying.
I had every feeling it would not survive and could only revive the primary cluster by force killing power and booting. At one point I even grabbed the laptop and put in my beer fridge for half an hour.
Let’s dig into the real root causes and some remediations. We will also setup MySQL (MariaDB) on the NAS in preparation for a new cluster as well as setup an NFS volume for testing before moving our primary cluster over.
Sonarqube
Say your sonarqube pod just keeps dying. Maybe it’s because you had a power outtage and or no proper cooling, or the PostgreSQL pod’s PVC is on a NAS that just went AWOL; regardless of the why, let’s focus on how your test result aggregation and code metrics app is endlessly taking a dump in your cluster…
builder@DESKTOP-QADGF36:~/Workspaces/AzureDevOpsAgent/deploy$ kubectl get pod sonarqube-ce-7f4d8997cb-kzk5n
NAME                            READY   STATUS             RESTARTS     AGE
sonarqube-ce-7f4d8997cb-kzk5n   0/1     CrashLoopBackOff   3 (6s ago)   85s
Basically it continues to die because of a stuck lock. something that it cannot unfoo on its own
builder@DESKTOP-QADGF36:~/Workspaces/AzureDevOpsAgent/deploy$ kubectl logs sonarqube-ce-7f4d8997cb-kzk5n sonarqube
sonarqube 11:21:16.54
sonarqube 11:21:16.55 Welcome to the Bitnami sonarqube container
sonarqube 11:21:16.55 Subscribe to project updates by watching https://github.com/bitnami/containers
sonarqube 11:21:16.56 Submit issues and feature requests at https://github.com/bitnami/containers/issues
sonarqube 11:21:16.56
sonarqube 11:21:16.57 INFO  ==> Validating settings in POSTGRESQL_CLIENT_* env vars
sonarqube 11:21:16.63 INFO  ==> Creating SonarQube configuration
sonarqube 11:21:16.72 INFO  ==> Trying to connect to the database server
sonarqube 11:21:16.77 INFO  ==> Restoring persisted SonarQube installation
sonarqube 11:21:16.87 INFO  ==> Setting heap size to -Xmx2048m -Xms1024m
sonarqube 11:21:16.91 INFO  ==> ** SonarQube setup finished! **

sonarqube 11:21:16.95 INFO  ==> ** Starting SonarQube **
/opt/bitnami/java/bin/java
Running SonarQube...
2023.08.01 11:21:17 INFO  app[][o.s.a.AppFileSystem] Cleaning or creating temp directory /opt/bitnami/sonarqube/temp
2023.08.01 11:21:17 INFO  app[][o.s.a.es.EsSettings] Elasticsearch listening on [HTTP: 127.0.0.1:9001, TCP: 127.0.0.1:44519]
2023.08.01 11:21:17 INFO  app[][o.s.a.ProcessLauncherImpl] Launch process[ELASTICSEARCH] from [/opt/bitnami/sonarqube/elasticsearch]: /opt/bitnami/sonarqube/elasticsearch/bin/elasticsearch
2023.08.01 11:21:17 INFO  app[][o.s.a.SchedulerImpl] Waiting for Elasticsearch to be up and running
2023.08.01 11:21:21 INFO  es[][o.e.n.Node] version[7.17.4], pid[145], build[default/tar/79878662c54c886ae89206c685d9f1051a9d6411/2022-05-18T18:04:20.964345128Z], OS[Linux/5.15.0-72-generic/amd64], JVM[BellSoft/OpenJDK 64-Bit Server VM/11.0.15.1/11.0.15.1+2-LTS]
2023.08.01 11:21:21 INFO  es[][o.e.n.Node] JVM home [/opt/bitnami/java]
2023.08.01 11:21:21 INFO  es[][o.e.n.Node] JVM arguments [-XX:+UseG1GC, -Djava.io.tmpdir=/opt/bitnami/sonarqube/temp, -XX:ErrorFile=../logs/es_hs_err_pid%p.log, -Des.networkaddress.cache.ttl=60, -Des.networkaddress.cache.negative.ttl=10, -XX:+AlwaysPreTouch, -Xss1m, -Djava.awt.headless=true, -Dfile.encoding=UTF-8, -Djna.nosys=true, -Djna.tmpdir=/opt/bitnami/sonarqube/temp, -XX:-OmitStackTraceInFastThrow, -Dio.netty.noUnsafe=true, -Dio.netty.noKeySetOptimization=true, -Dio.netty.recycler.maxCapacityPerThread=0, -Dio.netty.allocator.numDirectArenas=0, -Dlog4j.shutdownHookEnabled=false, -Dlog4j2.disable.jmx=true, -Dlog4j2.formatMsgNoLookups=true, -Djava.locale.providers=COMPAT, -Dcom.redhat.fips=false, -Des.enforce.bootstrap.checks=true, -Xmx2048m, -Xms2048m, -XX:+HeapDumpOnOutOfMemoryError, -Des.path.home=/opt/bitnami/sonarqube/elasticsearch, -Des.path.conf=/opt/bitnami/sonarqube/temp/conf/es, -Des.distribution.flavor=default, -Des.distribution.type=tar, -Des.bundled_jdk=false]
2023.08.01 11:21:21 INFO  es[][o.e.p.PluginsService] loaded module [analysis-common]
2023.08.01 11:21:21 INFO  es[][o.e.p.PluginsService] loaded module [lang-painless]
2023.08.01 11:21:21 INFO  es[][o.e.p.PluginsService] loaded module [parent-join]
2023.08.01 11:21:21 INFO  es[][o.e.p.PluginsService] loaded module [reindex]
2023.08.01 11:21:21 INFO  es[][o.e.p.PluginsService] loaded module [transport-netty4]
2023.08.01 11:21:21 INFO  es[][o.e.p.PluginsService] no plugins loaded
2023.08.01 11:21:21 ERROR es[][o.e.b.ElasticsearchUncaughtExceptionHandler] uncaught exception in thread [main]
org.elasticsearch.bootstrap.StartupException: java.lang.IllegalStateException: failed to obtain node locks, tried [[/opt/bitnami/sonarqube/data/es7]] with lock id [0]; maybe these locations are not writable or multiple nodes were started without increasing [node.max_local_storage_nodes] (was [1])?
        at org.elasticsearch.bootstrap.Elasticsearch.init(Elasticsearch.java:170) ~[elasticsearch-7.17.4.jar:7.17.4]
        at org.elasticsearch.bootstrap.Elasticsearch.execute(Elasticsearch.java:157) ~[elasticsearch-7.17.4.jar:7.17.4]
        at org.elasticsearch.cli.EnvironmentAwareCommand.execute(EnvironmentAwareCommand.java:77) ~[elasticsearch-7.17.4.jar:7.17.4]
        at org.elasticsearch.cli.Command.mainWithoutErrorHandling(Command.java:112) ~[elasticsearch-cli-7.17.4.jar:7.17.4]
        at org.elasticsearch.cli.Command.main(Command.java:77) ~[elasticsearch-cli-7.17.4.jar:7.17.4]
        at org.elasticsearch.bootstrap.Elasticsearch.main(Elasticsearch.java:122) ~[elasticsearch-7.17.4.jar:7.17.4]
        at org.elasticsearch.bootstrap.Elasticsearch.main(Elasticsearch.java:80) ~[elasticsearch-7.17.4.jar:7.17.4]
Caused by: java.lang.IllegalStateException: failed to obtain node locks, tried [[/opt/bitnami/sonarqube/data/es7]] with lock id [0]; maybe these locations are not writable or multiple nodes were started without increasing [node.max_local_storage_nodes] (was [1])?
        at org.elasticsearch.env.NodeEnvironment.<init>(NodeEnvironment.java:328) ~[elasticsearch-7.17.4.jar:7.17.4]
        at org.elasticsearch.node.Node.<init>(Node.java:429) ~[elasticsearch-7.17.4.jar:7.17.4]
        at org.elasticsearch.node.Node.<init>(Node.java:309) ~[elasticsearch-7.17.4.jar:7.17.4]
        at org.elasticsearch.bootstrap.Bootstrap$5.<init>(Bootstrap.java:234) ~[elasticsearch-7.17.4.jar:7.17.4]
        at org.elasticsearch.bootstrap.Bootstrap.setup(Bootstrap.java:234) ~[elasticsearch-7.17.4.jar:7.17.4]
        at org.elasticsearch.bootstrap.Bootstrap.init(Bootstrap.java:434) ~[elasticsearch-7.17.4.jar:7.17.4]
        at org.elasticsearch.bootstrap.Elasticsearch.init(Elasticsearch.java:166) ~[elasticsearch-7.17.4.jar:7.17.4]
        ... 6 more
uncaught exception in thread [main]
java.lang.IllegalStateException: failed to obtain node locks, tried [[/opt/bitnami/sonarqube/data/es7]] with lock id [0]; maybe these locations are not writable or multiple nodes were started without increasing [node.max_local_storage_nodes] (was [1])?
        at org.elasticsearch.env.NodeEnvironment.<init>(NodeEnvironment.java:328)
        at org.elasticsearch.node.Node.<init>(Node.java:429)
        at org.elasticsearch.node.Node.<init>(Node.java:309)
        at org.elasticsearch.bootstrap.Bootstrap$5.<init>(Bootstrap.java:234)
        at org.elasticsearch.bootstrap.Bootstrap.setup(Bootstrap.java:234)
        at org.elasticsearch.bootstrap.Bootstrap.init(Bootstrap.java:434)
        at org.elasticsearch.bootstrap.Elasticsearch.init(Elasticsearch.java:166)
        at org.elasticsearch.bootstrap.Elasticsearch.execute(Elasticsearch.java:157)
        at org.elasticsearch.cli.EnvironmentAwareCommand.execute(EnvironmentAwareCommand.java:77)
        at org.elasticsearch.cli.Command.mainWithoutErrorHandling(Command.java:112)
        at org.elasticsearch.cli.Command.main(Command.java:77)
        at org.elasticsearch.bootstrap.Elasticsearch.main(Elasticsearch.java:122)
        at org.elasticsearch.bootstrap.Elasticsearch.main(Elasticsearch.java:80)
For complete error details, refer to the log at /opt/bitnami/sonarqube/logs/sonarqube.log
2023.08.01 11:21:22 WARN  app[][o.s.a.p.AbstractManagedProcess] Process exited with exit value [ElasticSearch]: 1
2023.08.01 11:21:22 INFO  app[][o.s.a.SchedulerImpl] Process[ElasticSearch] is stopped
2023.08.01 11:21:22 INFO  app[][o.s.a.SchedulerImpl] SonarQube is stopped
The only way out of this bus to nowhere is to scrub the messed up es7 directory.
To do that, I needed to add a “fix-elastic-error-lock-issue”
In the init containers block for the pod, I added a quick step to scrub the busted es7 (ElasticSearch) data that had gotten corrupted on a crash.
  initContainers:
  - command:
    - rm
    - -rf
    - /opt/bitnami/sonarqube/data/es7
    image: busybox
    imagePullPolicy: IfNotPresent
    name: fix-elastic-error-lock-issue
    resources: {}
    terminationMessagePath: /dev/termination-log
    terminationMessagePolicy: File
    volumeMounts:
    - mountPath: /opt/bitnami/sonarqube/data
      name: data
      subPath: es7
    - mountPath: /var/run/secrets/kubernetes.io/serviceaccount
      name: kube-api-access-4lsnm
      readOnly: true
  - command:
(note: you’ll find the volume mounts in your deploy of Sonar - they have changed over time so just lookup the data mount on the app and use those values)
Since it was in the PVC, no amount of restarts of pods would have cleared it naturally.
However, it continued to crash, but only because the Kubernetes main node kept crashing.
We will revist this later in the post…
NAS and Power
The biggest reason I had to drive cross town in the middle of a day and fetch a new 6tb SATA drive was power outtages finally killing my NAS.
I have saved the NAS, i might add. It’s (at the time of writing) between 6 and 12 days from fully syncing the second replacement drive
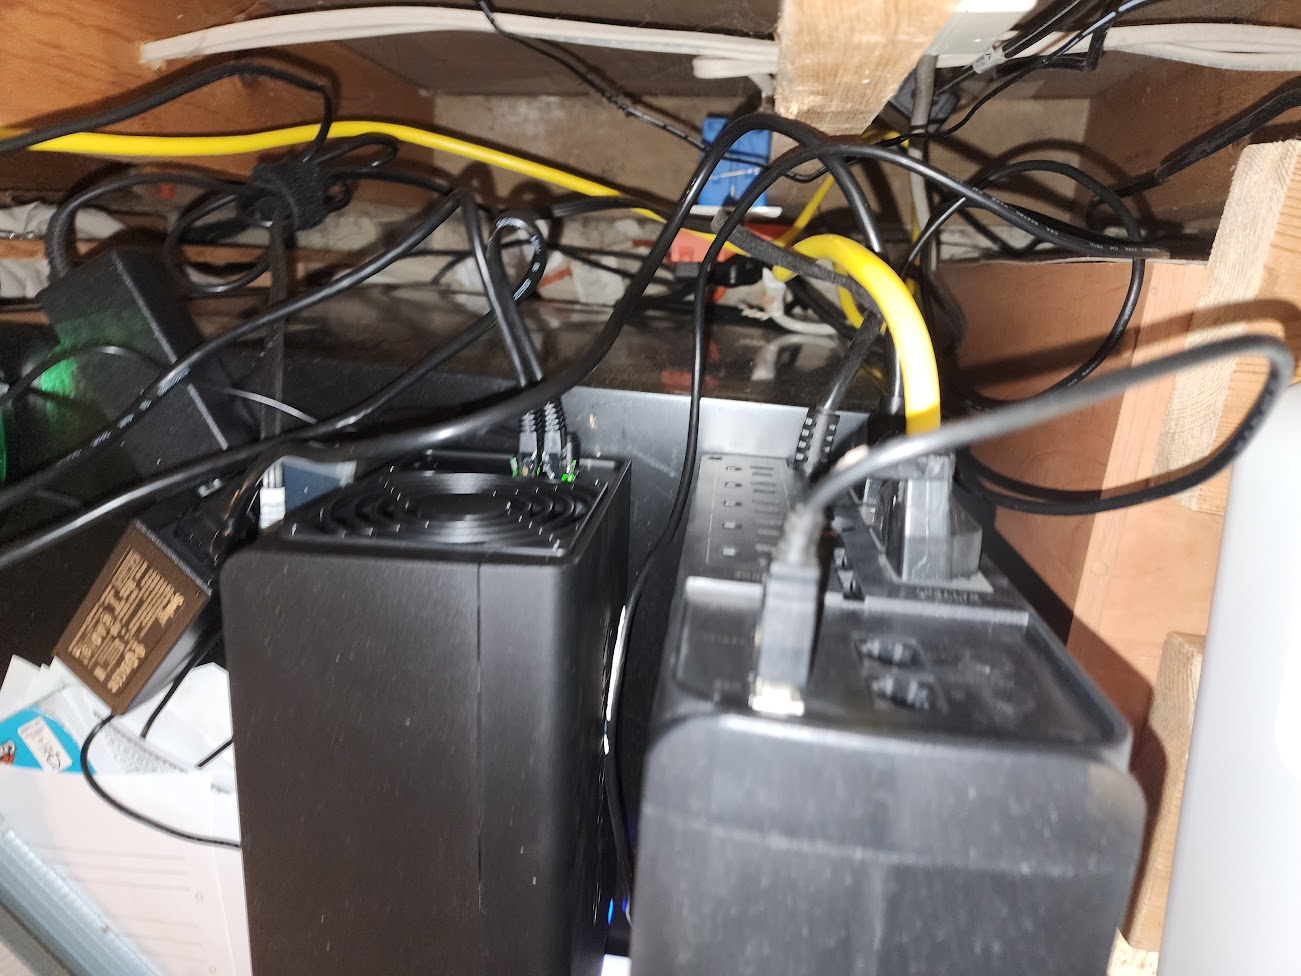
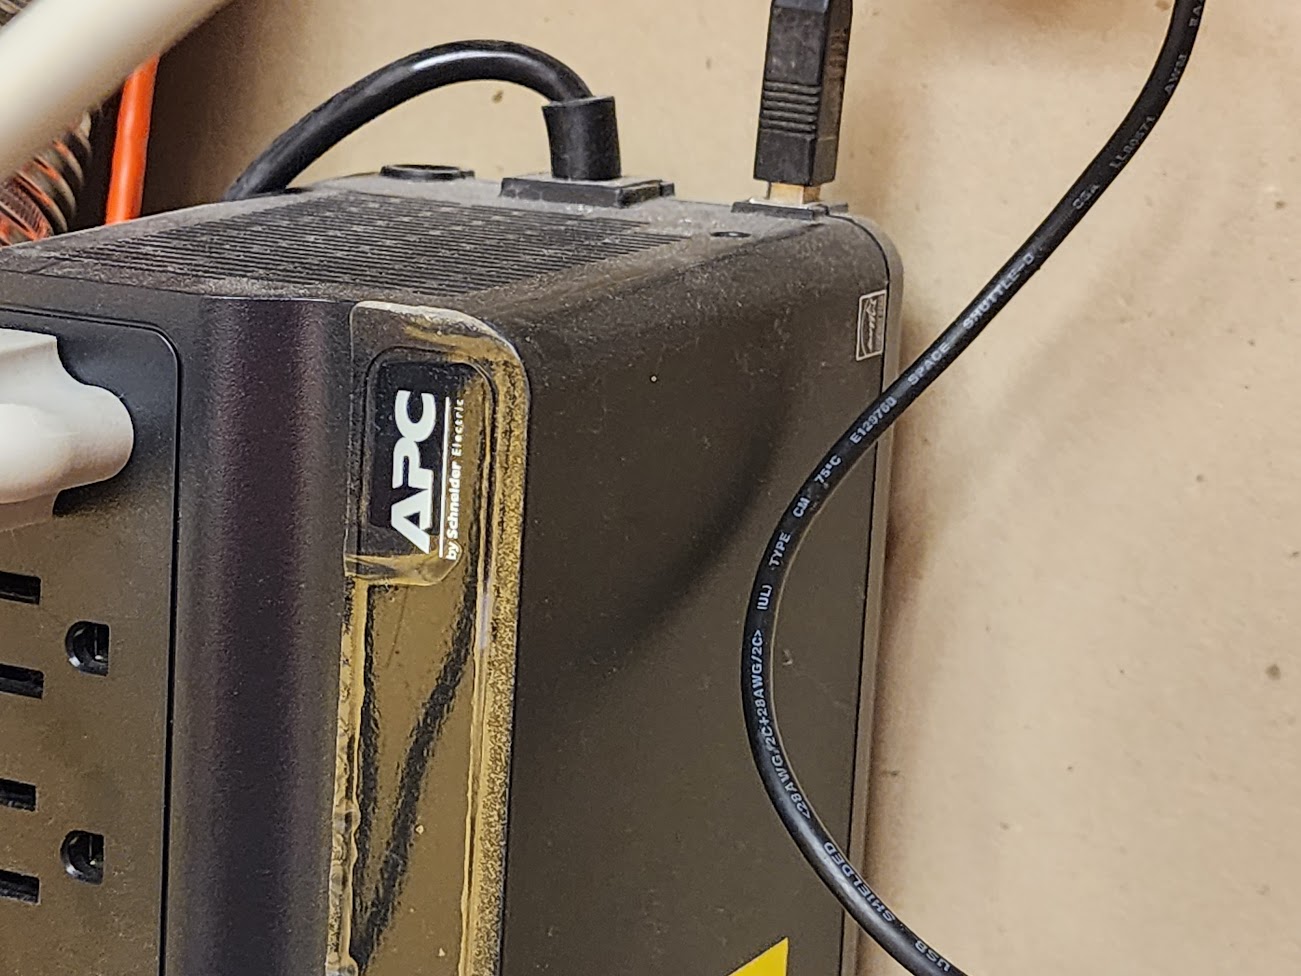
However, this is something I very well could have avoided by simply using the USB power feature all UPSes include
I added it to the larger UPS backing my cluster compute
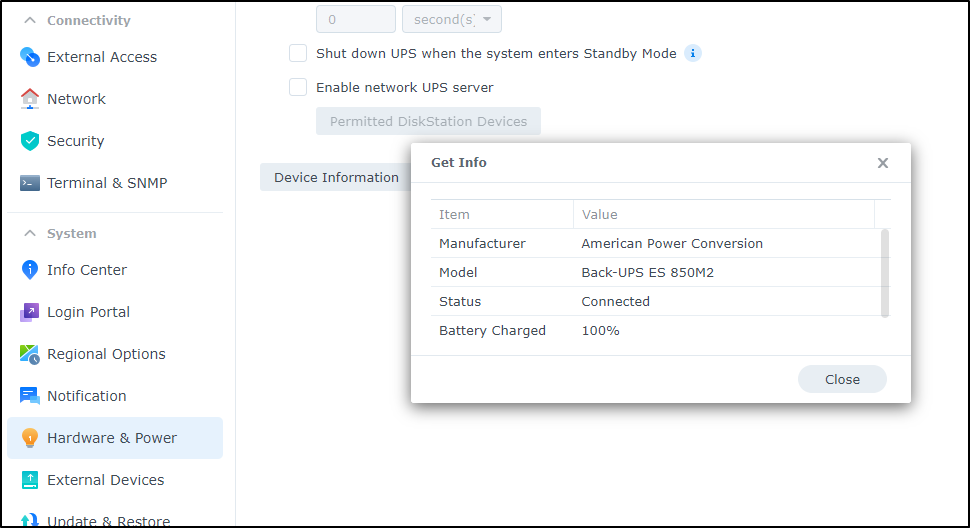
And the smaller one dedicated to my older NAS and Wifi
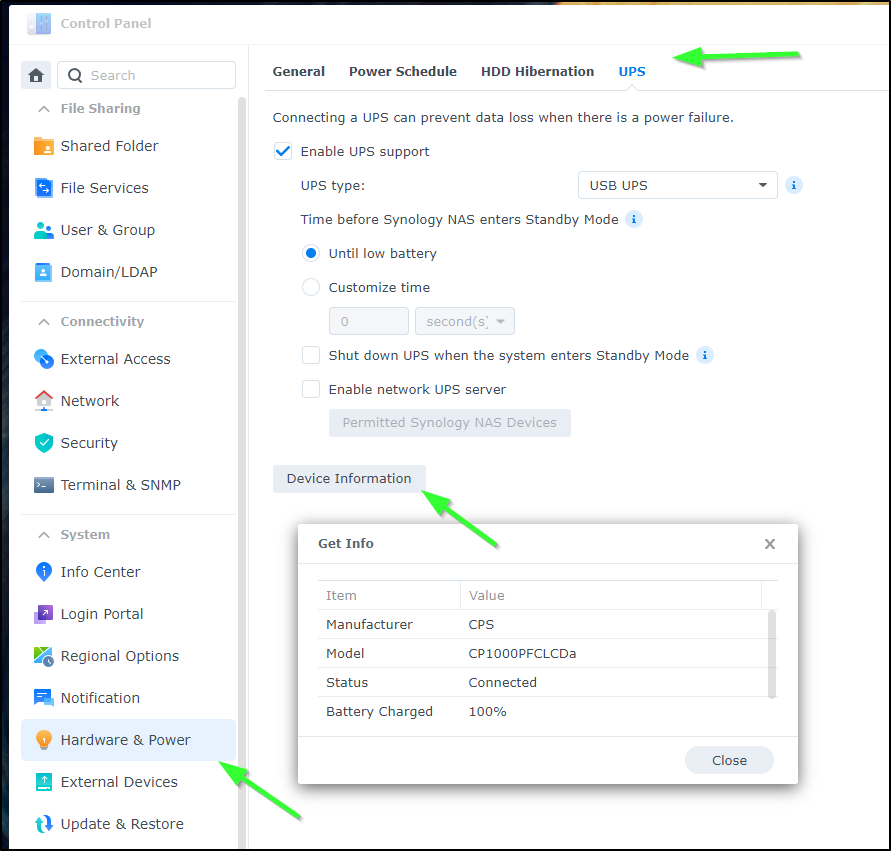
We can then go to “Hardware & Power” in the control panel, choose “UPS” and select “USB UPS” from the UPS Type.
Clicking “Information” will show you the reported power levels
What should now happen is that in the event of a sustained outtage, the low power signal (which will arrive between 5 and 15 minutes depending on which UPS) will trigger the NAS to power down.
However, for those mid-summer blips - where my power just cuts for a second, nothing will be affected.
AWX Backup
Another concern, when faced with the idea that my primary K8s cluster was FUBAR, was losing some of my AWX configurations. I really do use AWX alot now and some stuff is hardcoded or teased out (like some complicated variable blocks).
To back things up, we first we determine the namespace and deployment
builder@DESKTOP-QADGF36:~/Workspaces/jekyll-blog$ kubectl get deployment -n adwerx
NAME        READY   UP-TO-DATE   AVAILABLE   AGE
adwerxawx   1/1     1            1           376d
Then I can create a backup job
$ cat backup-awx.yaml
---
apiVersion: awx.ansible.com/v1beta1
kind: AWXBackup
metadata:
  name: awxbackup-2023-08-06
  namespace: adwerx
spec:
  deployment_name: adwerxawx
Since, in my case, I used the AWX Helm chart and not CRDs, I can’t use the CRD based backups.
$ kubectl apply -f backup-awx.yaml
error: resource mapping not found for name: "awxbackup-2023-08-06" namespace: "adwerx" from "backup-awx.yaml": no matches for kind "AWXBackup" in version "awx.ansible.com/v1beta1"
ensure CRDs are installed first
However, I can create a Job that would install the AWX CLI and use that to dump all the objects to files.
I could use a PVC, but to keep it simple, I’ll save them to a /tmp folder on the local host
$ cat backup2.yaml
apiVersion: batch/v1
kind: Job
metadata:
  name: awxbackup4
  namespace: adwerx
spec:
  backoffLimit: 4
  template:
    spec:
      containers:
      - name: test
        image: alpine
        envFrom:
        - secretRef:
            name: adwerxawx
        volumeMounts:
        - mountPath: /backup
          name: tmpvolume
        command:
        - bin/sh
        - -c
        - |
          apk --no-cache add curl
          apk --no-cache add jq
          apk --no-cache add python
          apk --no-cache add py3-pip

          pip3 install awxkit

          export DSTR=`date +"%m-%d-%Y"`
          mkdir -p /backup/$DSTR
          cd /backup/$DSTR

          awx --conf.username $AWX_ADMIN_USER --conf.password $AWX_ADMIN_PASSWORD --conf.host http://$ADWERXAWX_SERVICE_HOST:$ADWERXAWX_SERVICE_PORT_HTTP export --conf.insecure --users -f json > awxusers.json
          awx --conf.username $AWX_ADMIN_USER --conf.password $AWX_ADMIN_PASSWORD --conf.host http://$ADWERXAWX_SERVICE_HOST:$ADWERXAWX_SERVICE_PORT_HTTP export --conf.insecure --organizations -f json > awxorganizations.json
          awx --conf.username $AWX_ADMIN_USER --conf.password $AWX_ADMIN_PASSWORD --conf.host http://$ADWERXAWX_SERVICE_HOST:$ADWERXAWX_SERVICE_PORT_HTTP export --conf.insecure --teams -f json > awxteams.json
          awx --conf.username $AWX_ADMIN_USER --conf.password $AWX_ADMIN_PASSWORD --conf.host http://$ADWERXAWX_SERVICE_HOST:$ADWERXAWX_SERVICE_PORT_HTTP export --conf.insecure --credential_types -f json > awxcredentialtypes.json
          awx --conf.username $AWX_ADMIN_USER --conf.password $AWX_ADMIN_PASSWORD --conf.host http://$ADWERXAWX_SERVICE_HOST:$ADWERXAWX_SERVICE_PORT_HTTP export --conf.insecure --credentials -f json > awxcredentials.json
          awx --conf.username $AWX_ADMIN_USER --conf.password $AWX_ADMIN_PASSWORD --conf.host http://$ADWERXAWX_SERVICE_HOST:$ADWERXAWX_SERVICE_PORT_HTTP export --conf.insecure --notification_templates -f json > awxnotificationtemplates.json
          awx --conf.username $AWX_ADMIN_USER --conf.password $AWX_ADMIN_PASSWORD --conf.host http://$ADWERXAWX_SERVICE_HOST:$ADWERXAWX_SERVICE_PORT_HTTP export --conf.insecure --projects -f json > awxprojects.json
          awx --conf.username $AWX_ADMIN_USER --conf.password $AWX_ADMIN_PASSWORD --conf.host http://$ADWERXAWX_SERVICE_HOST:$ADWERXAWX_SERVICE_PORT_HTTP export --conf.insecure --inventory -f json > awxinventory.json
          awx --conf.username $AWX_ADMIN_USER --conf.password $AWX_ADMIN_PASSWORD --conf.host http://$ADWERXAWX_SERVICE_HOST:$ADWERXAWX_SERVICE_PORT_HTTP export --conf.insecure --inventory_sources -f json > awxinventorysources.json
          awx --conf.username $AWX_ADMIN_USER --conf.password $AWX_ADMIN_PASSWORD --conf.host http://$ADWERXAWX_SERVICE_HOST:$ADWERXAWX_SERVICE_PORT_HTTP export --conf.insecure --job_templates -f json  > awxjobtemplates.json
          awx --conf.username $AWX_ADMIN_USER --conf.password $AWX_ADMIN_PASSWORD --conf.host http://$ADWERXAWX_SERVICE_HOST:$ADWERXAWX_SERVICE_PORT_HTTP export --conf.insecure --workflow_job_templates -f json > awxwfjobtemplates.json
          awx --conf.username $AWX_ADMIN_USER --conf.password $AWX_ADMIN_PASSWORD --conf.host http://$ADWERXAWX_SERVICE_HOST:$ADWERXAWX_SERVICE_PORT_HTTP export --conf.insecure --execution_environments -f json > awsexecutionenvironments.json
          awx --conf.username $AWX_ADMIN_USER --conf.password $AWX_ADMIN_PASSWORD --conf.host http://$ADWERXAWX_SERVICE_HOST:$ADWERXAWX_SERVICE_PORT_HTTP export --conf.insecure --applications -f json > awsapplications.json
          awx --conf.username $AWX_ADMIN_USER --conf.password $AWX_ADMIN_PASSWORD --conf.host http://$ADWERXAWX_SERVICE_HOST:$ADWERXAWX_SERVICE_PORT_HTTP export --conf.insecure --schedules -f json > awxschedules.json
      volumes:
      - name: tmpvolume
        hostPath:
          path: /tmp
      restartPolicy: Never
I can then launch it:
$ kubectl apply -f backup2.yaml
job.batch/awxbackup4 created
I’ll want to hop to that Node to view /tmp
$ kubectl describe pod awxbackup4-cnnth -n adwerx | grep Node
Node:             hp-hp-elitebook-850-g2/192.168.1.57
Node-Selectors:              <none>

hp@hp-HP-EliteBook-850-G2:~$ ls -l /tmp/08-06-2023/
total 192
-rw-r--r-- 1 root root    28 Aug  6 17:17 awsapplications.json
-rw-r--r-- 1 root root     0 Aug  6 17:17 awsexecutionenvironments.json
-rw-r--r-- 1 root root 13265 Aug  6 17:17 awxcredentials.json
-rw-r--r-- 1 root root 48824 Aug  6 17:17 awxcredentialtypes.json
-rw-r--r-- 1 root root 15515 Aug  6 17:17 awxinventory.json
-rw-r--r-- 1 root root    33 Aug  6 17:17 awxinventorysources.json
-rw-r--r-- 1 root root 53032 Aug  6 17:17 awxjobtemplates.json
-rw-r--r-- 1 root root    38 Aug  6 17:17 awxnotificationtemplates.json
-rw-r--r-- 1 root root   673 Aug  6 17:17 awxorganizations.json
-rw-r--r-- 1 root root  4828 Aug  6 17:17 awxprojects.json
-rw-r--r-- 1 root root  9681 Aug  6 17:18 awxschedules.json
-rw-r--r-- 1 root root  2297 Aug  6 17:17 awxteams.json
-rw-r--r-- 1 root root 15188 Aug  6 17:16 awxusers.json
-rw-r--r-- 1 root root    38 Aug  6 17:17 awxwfjobtemplates.json
I can now view the objects such as teams
$ cat /tmp/08-06-2023/awxteams.json
{
     "teams": [
          {
               "name": "MyTeam",
               "description": "",
               "organization": {
                    "name": "onprem",
                    "type": "organization"
               },
               "related": {
                    "roles": [],
                    "object_roles": [
                         {
                              "name": "Admin",
                              "type": "role",
                              "content_object": {
                                   "organization": {
                                        "name": "onprem",
                                        "type": "organization"
                                   },
                                   "name": "MyTeam",
                                   "type": "team"
                              }
                         },
                         {
                              "name": "Member",
                              "type": "role",
                              "content_object": {
                                   "organization": {
                                        "name": "onprem",
                                        "type": "organization"
                                   },
                                   "name": "MyTeam",
                                   "type": "team"
                              }
                         },
                         {
                              "name": "Read",
                              "type": "role",
                              "content_object": {
                                   "organization": {
                                        "name": "onprem",
                                        "type": "organization"
                                   },
                                   "name": "MyTeam",
                                   "type": "team"
                              }
                         }
                    ]
               },
               "natural_key": {
                    "organization": {
                         "name": "onprem",
                         "type": "organization"
                    },
                    "name": "MyTeam",
                    "type": "team"
               }
          }
     ]
}
If I wanted to import, I could that as well with a job
/ # awx --conf.username xxxxxx --conf.password xxxxxxx --conf.host https://awx.freshbrewed.science/ import -h
usage: awx import < exportfile

import resources from stdin

options:
  -h, --help            show this help message and exit

input/output formatting:
  -f {json,yaml}, --conf.format {json,yaml}
                        specify a format for the input and output
  -v, --verbose         print debug-level logs, including requests made
NFS
As we have moved to a new NFS, it’s time to create a NFS provisioner setup.
I’ll set this up first on the test cluster
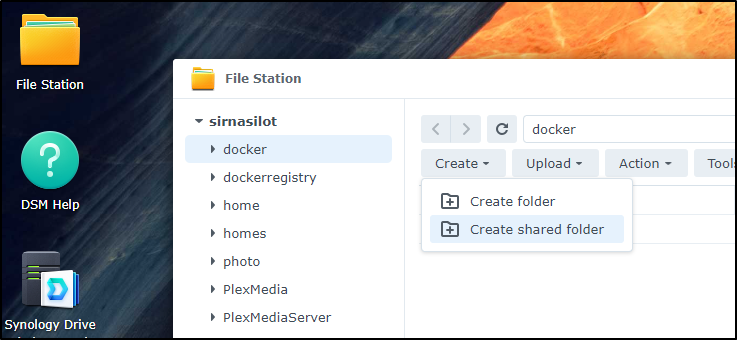
On my new nas (SirNasilot), I go to File Status and “Create shared folder”
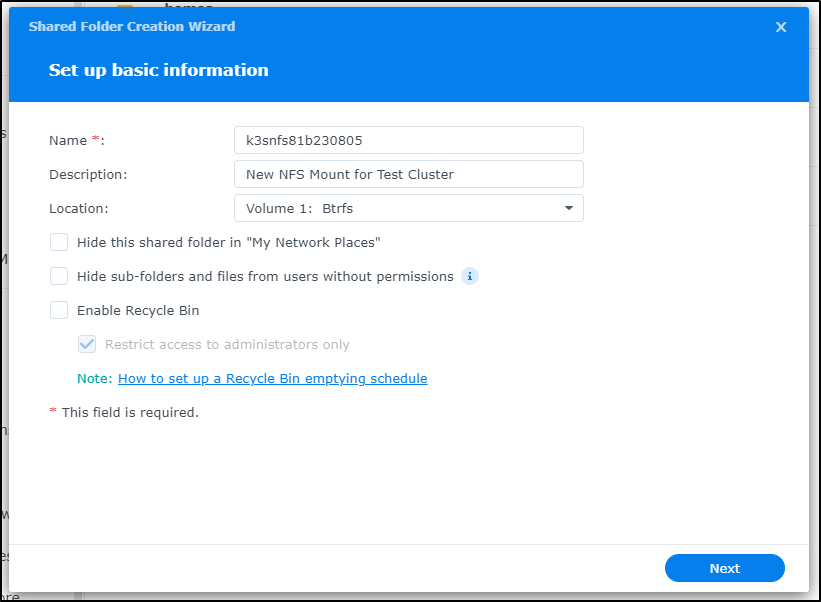
I use the main Volume and give a description
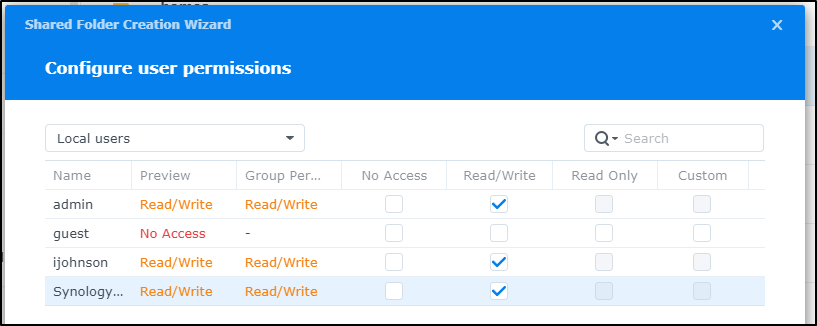
I’ll set no guest access but read-write for others
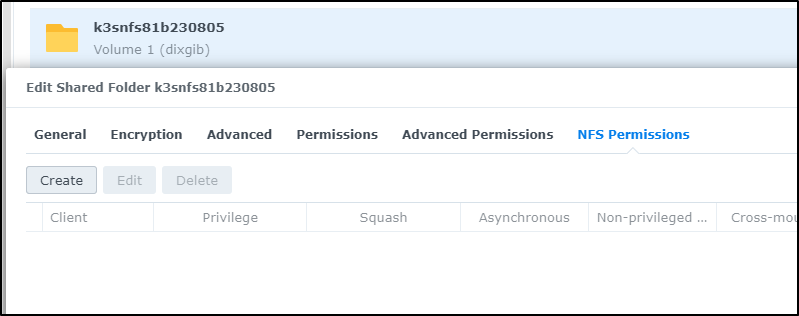
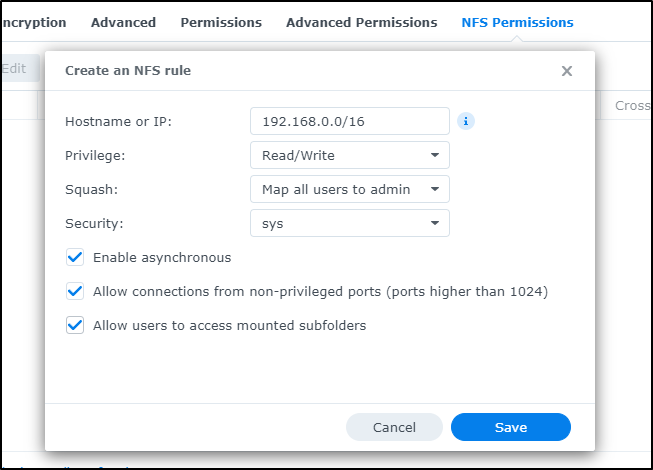
I’ll now edit the share and go to NFS Permissions. Here I can click create
I’ll enable my wider on-prem network with 192.168.0.0/16. I could have narrowed it to 192.168.1.* using 192.168.1.0/24
I can now use it.
We can use a HelmChart object to pull and install a helm chart using YAML
builder@anna-MacBookAir:~$ cat enable_nfs.yaml
apiVersion: helm.cattle.io/v1
kind: HelmChart
metadata:
  name: nfs
  namespace: default
spec:
  chart: nfs-subdir-external-provisioner
  repo: https://kubernetes-sigs.github.io/nfs-subdir-external-provisioner
  targetNamespace: default
  set:
    nfs.server: 192.168.1.117
    nfs.path: /volume1/k3snfs81b230805
    storageClass.name: nfs
builder@anna-MacBookAir:~$ kubectl apply -f enable_nfs.yaml
helmchart.helm.cattle.io/nfs created
For some reason, the job hung on me to install that way:
builder@DESKTOP-QADGF36:~$ kubectl logs helm-install-nfs-np9x8 | tail -n10
+ [[ ! -f /chart/nfs.tgz.base64 ]]
+ return
+ [[ install != \d\e\l\e\t\e ]]
+ helm_repo_init
+ grep -q -e 'https\?://'
+ [[ helm_v3 == \h\e\l\m\_\v\3 ]]
+ [[ nfs-subdir-external-provisioner == stable/* ]]
+ [[ -n https://kubernetes-sigs.github.io/nfs-subdir-external-provisioner ]]
+ helm_v3 repo add nfs https://kubernetes-sigs.github.io/nfs-subdir-external-provisioner
Error: looks like "https://kubernetes-sigs.github.io/nfs-subdir-external-provisioner" is not a valid chart repository or cannot be reached: Get "https://kubernetes-sigs.github.io/nfs-subdir-external-provisioner/index.yaml": dial tcp: lookup kubernetes-sigs.github.io on 10.43.0.10:53: read udp 10.42.2.24:40311->10.43.0.10:53: i/o timeout
So i just did the traditional
$ helm repo add nfs https://kubernetes-sigs.github.io/nfs-subdir-external-provisioner
"nfs" has been added to your repositories

$ helm repo update
Hang tight while we grab the latest from your chart repositories...
...Successfully got an update from the "kube-state-metrics" chart repository
...Successfully got an update from the "nfs" chart repository
...Successfully got an update from the "longhorn" chart repository
...Successfully got an update from the "adwerx" chart repository
...Successfully got an update from the "kuma" chart repository
...Successfully got an update from the "confluentinc" chart repository
...Successfully got an update from the "zabbix-community" chart repository
...Successfully got an update from the "novum-rgi-helm" chart repository
...Successfully got an update from the "azure-samples" chart repository
...Successfully got an update from the "opencost" chart repository
...Successfully got an update from the "akomljen-charts" chart repository
...Successfully got an update from the "btungut" chart repository
...Successfully got an update from the "dapr" chart repository
...Successfully got an update from the "rhcharts" chart repository
...Successfully got an update from the "myharbor" chart repository
...Successfully got an update from the "freshbrewed" chart repository
...Successfully got an update from the "portainer" chart repository
...Successfully got an update from the "jfelten" chart repository
...Successfully got an update from the "actions-runner-controller" chart repository
...Successfully got an update from the "open-telemetry" chart repository
...Successfully got an update from the "epsagon" chart repository
...Successfully got an update from the "kubecost" chart repository
...Successfully got an update from the "lifen-charts" chart repository
...Successfully got an update from the "castai-helm" chart repository
...Successfully got an update from the "sonarqube" chart repository
...Successfully got an update from the "elastic" chart repository
...Successfully got an update from the "nginx-stable" chart repository
...Successfully got an update from the "datadog" chart repository
...Successfully got an update from the "argo-cd" chart repository
...Successfully got an update from the "signoz" chart repository
...Successfully got an update from the "rook-release" chart repository
...Successfully got an update from the "harbor" chart repository
...Successfully got an update from the "kiwigrid" chart repository
...Successfully got an update from the "grafana" chart repository
...Successfully got an update from the "crossplane-stable" chart repository
...Successfully got an update from the "prometheus-community" chart repository
...Successfully got an update from the "rancher-latest" chart repository
...Successfully got an update from the "sumologic" chart repository
...Successfully got an update from the "ngrok" chart repository
...Successfully got an update from the "hashicorp" chart repository
...Successfully got an update from the "gitea-charts" chart repository
...Successfully got an update from the "uptime-kuma" chart repository
...Successfully got an update from the "newrelic" chart repository
...Successfully got an update from the "openzipkin" chart repository
...Successfully got an update from the "bitnami" chart repository
...Successfully got an update from the "incubator" chart repository
...Successfully got an update from the "gitlab" chart repository
Update Complete. ⎈Happy Helming!⎈


$ helm install nfs-subdir-external-provisioner --set nfs.server=192.168.1.117 --set nfs.path=/volume1/k3nfs81b230805 --set storageClass.name=nfs nfs/nfs-subdir-external-provisioner
NAME: nfs-subdir-external-provisioner
LAST DEPLOYED: Sat Aug  5 18:12:54 2023
NAMESPACE: default
STATUS: deployed
REVISION: 1
TEST SUITE: None
I can now see the SC
builder@DESKTOP-QADGF36:~$ kubectl get sc
NAME                   PROVISIONER                                     RECLAIMPOLICY   VOLUMEBINDINGMODE      ALLOWVOLUMEEXPANSION   AGE
local-path (default)   rancher.io/local-path                           Delete          WaitForFirstConsumer   false                  26d
nfs                    cluster.local/nfs-subdir-external-provisioner   Delete          Immediate              true                   49s
I realized a bit later I had a typo in the nfs.path (forgot the s)
$ helm upgrade --install nfs-subdir-external-provisioner --set nfs.server=192.168.1.117 --set nfs.path=/volume1/k3snfs81b230805 --set storageClass.name=nfs
nfs/nfs-subdir-external-provisioner
Release "nfs-subdir-external-provisioner" has been upgraded. Happy Helming!
NAME: nfs-subdir-external-provisioner
LAST DEPLOYED: Sat Aug  5 18:32:56 2023
NAMESPACE: default
STATUS: deployed
REVISION: 3
TEST SUITE: None
builder@DESKTOP-QADGF36:~$
I can now test
$ cat testNFS.yaml
apiVersion: v1
kind: PersistentVolumeClaim
metadata:
  name: nfsclaim
spec:
  accessModes:
    - ReadWriteOnce
  storageClassName: nfs
  resources:
    requests:
      storage: 110Mi
And see it binds
$ kubectl get pvc
NAME                      STATUS   VOLUME                                     CAPACITY   ACCESS MODES   STORAGECLASS   AGE
data-gitea-0              Bound    pvc-bffada16-6a38-4968-be79-604ede967b13   10Gi       RWO            local-path     19d
data-gitea-postgresql-0   Bound    pvc-1c317391-7d2c-405d-a505-d8fe42c44f03   10Gi       RWO            local-path     19d
act-runner-vol            Bound    pvc-b15a377c-8d9f-427f-9e52-d9b6cf457dc0   1Gi        RWO            local-path     19d
configs-pvc               Bound    pvc-63a24130-ae57-41d6-a158-3f96fa2df2d0   1Gi        RWO            local-path     12d
icons-pvc                 Bound    pvc-4fd445e3-0fc3-42a5-a604-d3f9855d8736   1Gi        RWO            local-path     12d
nfsclaim                  Bound    pvc-a5b7daa8-03e2-40b5-b626-79f8b4b0652c   110Mi      RWO            nfs            19m
One can also test locally
builder@builder-MacBookPro2:~$ sudo mkdir /tmptest
builder@builder-MacBookPro2:~$ sudo mount -t nfs 192.168.1.117:/volume1/k3snfs81b230805 /tmptest
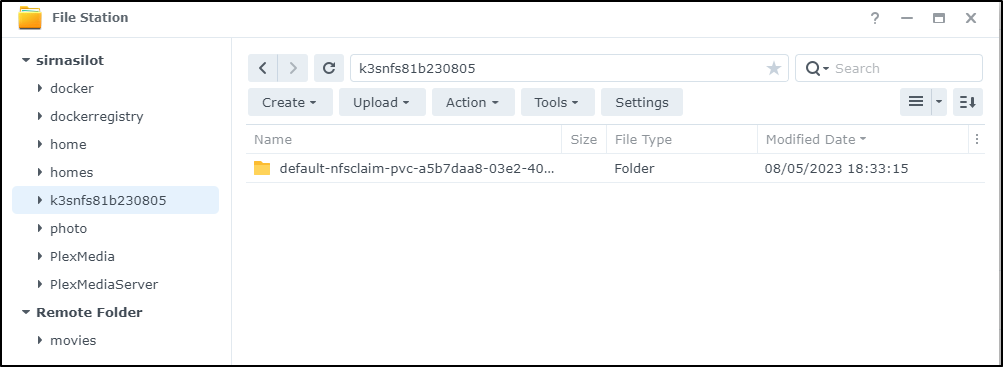
Lastly, I can see the test PVC in the NAS
I can also make this storageclass the default
builder@DESKTOP-QADGF36:~$ kubectl get sc
NAME                   PROVISIONER                                     RECLAIMPOLICY   VOLUMEBINDINGMODE      ALLOWVOLUMEEXPANSION   AGE
local-path (default)   rancher.io/local-path                           Delete          WaitForFirstConsumer   false                  26d
nfs                    cluster.local/nfs-subdir-external-provisioner   Delete          Immediate              true                   23m
builder@DESKTOP-QADGF36:~$ kubectl patch storageclass local-path -p '{"metadata": {"annotations":{"storageclass.kubernetes.io/is-default-class":"false"}}}'
storageclass.storage.k8s.io/local-path patched
builder@DESKTOP-QADGF36:~$ kubectl patch storageclass nfs -p '{"metadata": {"annotations":{"storageclass.kubernetes.io/is-default-class":"true"}}}'
storageclass.storage.k8s.io/nfs patched
builder@DESKTOP-QADGF36:~$ kubectl get sc
NAME            PROVISIONER                                     RECLAIMPOLICY   VOLUMEBINDINGMODE      ALLOWVOLUMEEXPANSION   AGE
local-path      rancher.io/local-path                           Delete          WaitForFirstConsumer   false                  26d
nfs (default)   cluster.local/nfs-subdir-external-provisioner   Delete          Immediate              true                   24m
Mysql (MariaDB) HA mode for K3s
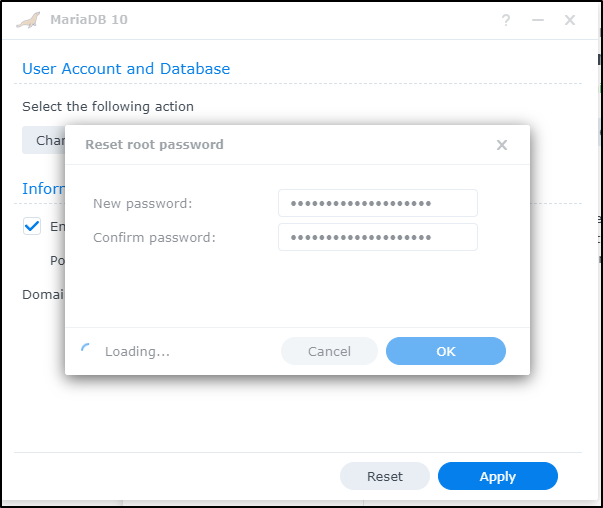
We need to create a database. I’ll want to set the root password
I can check the active users that can login today
ijohnson@sirnasilot:~$ /usr/local/mariadb10/bin/mysql -u root -p
Enter password:
Welcome to the MariaDB monitor.  Commands end with ; or \g.
Your MariaDB connection id is 122
Server version: 10.3.37-MariaDB Source distribution

Copyright (c) 2000, 2018, Oracle, MariaDB Corporation Ab and others.

Type 'help;' or '\h' for help. Type '\c' to clear the current input statement.

MariaDB [(none)]> SELECT User, Host FROM mysql.user WHERE Host <> 'localhost';
+-------+-----------+
| User  | Host      |
+-------+-----------+
| gitea | %         |
| root  | 127.0.0.1 |
| root  | ::1       |
+-------+-----------+
3 rows in set (0.001 sec)
I now want a K3s user/password and database to use
MariaDB [(none)]> CREATE USER 'k3s77'@'%' IDENTIFIED BY 'Kubeapi-77';
Query OK, 0 rows affected (0.028 sec)

MariaDB [(none)]> GRANT ALL PRIVILEGES ON *.* TO 'k3s77'@'%' IDENTIFIED BY 'Kubeapi-77' WITH GRANT OPTION;
Query OK, 0 rows affected (0.027 sec)

MariaDB [(none)]> FLUSH PRIVILEGES;
Query OK, 0 rows affected (0.002 sec)
I’ll want to test this as I can see grants from “%” but not a specific host:
MariaDB [(none)]> SHOW GRANTS FOR 'k3s77'@'192.168.1.78';
ERROR 1141 (42000): There is no such grant defined for user 'k3s77' on host '192.168.1.78'
MariaDB [(none)]> SHOW GRANTS FOR 'k3s77'@'%';
+---------------------------------------------------------------------------------------------------------------------------------+
| Grants for k3s77@%                                                                                                              |
+---------------------------------------------------------------------------------------------------------------------------------+
| GRANT ALL PRIVILEGES ON *.* TO `k3s77`@`%` IDENTIFIED BY PASSWORD '*09E15244EF0FD0E02B85AC9EDA91E4810F6C15D6' WITH GRANT OPTION |
+---------------------------------------------------------------------------------------------------------------------------------+
1 row in set (0.000 sec)
Saving Configs and Secrets
If I’m going to wipe a server, I better stash some secrets. I already copied down some key containers
builder@DESKTOP-QADGF36:~$ kubectl get secrets -o yaml > ~/k3s-77-2023-08-05-secrets.yaml
builder@DESKTOP-QADGF36:~$ kubectl get cm -o yaml > ~/k3s-77-2023-08-05-cm.yaml
WTF
Convinced I had a host going to pot, I was planning on destroying and re-creating..
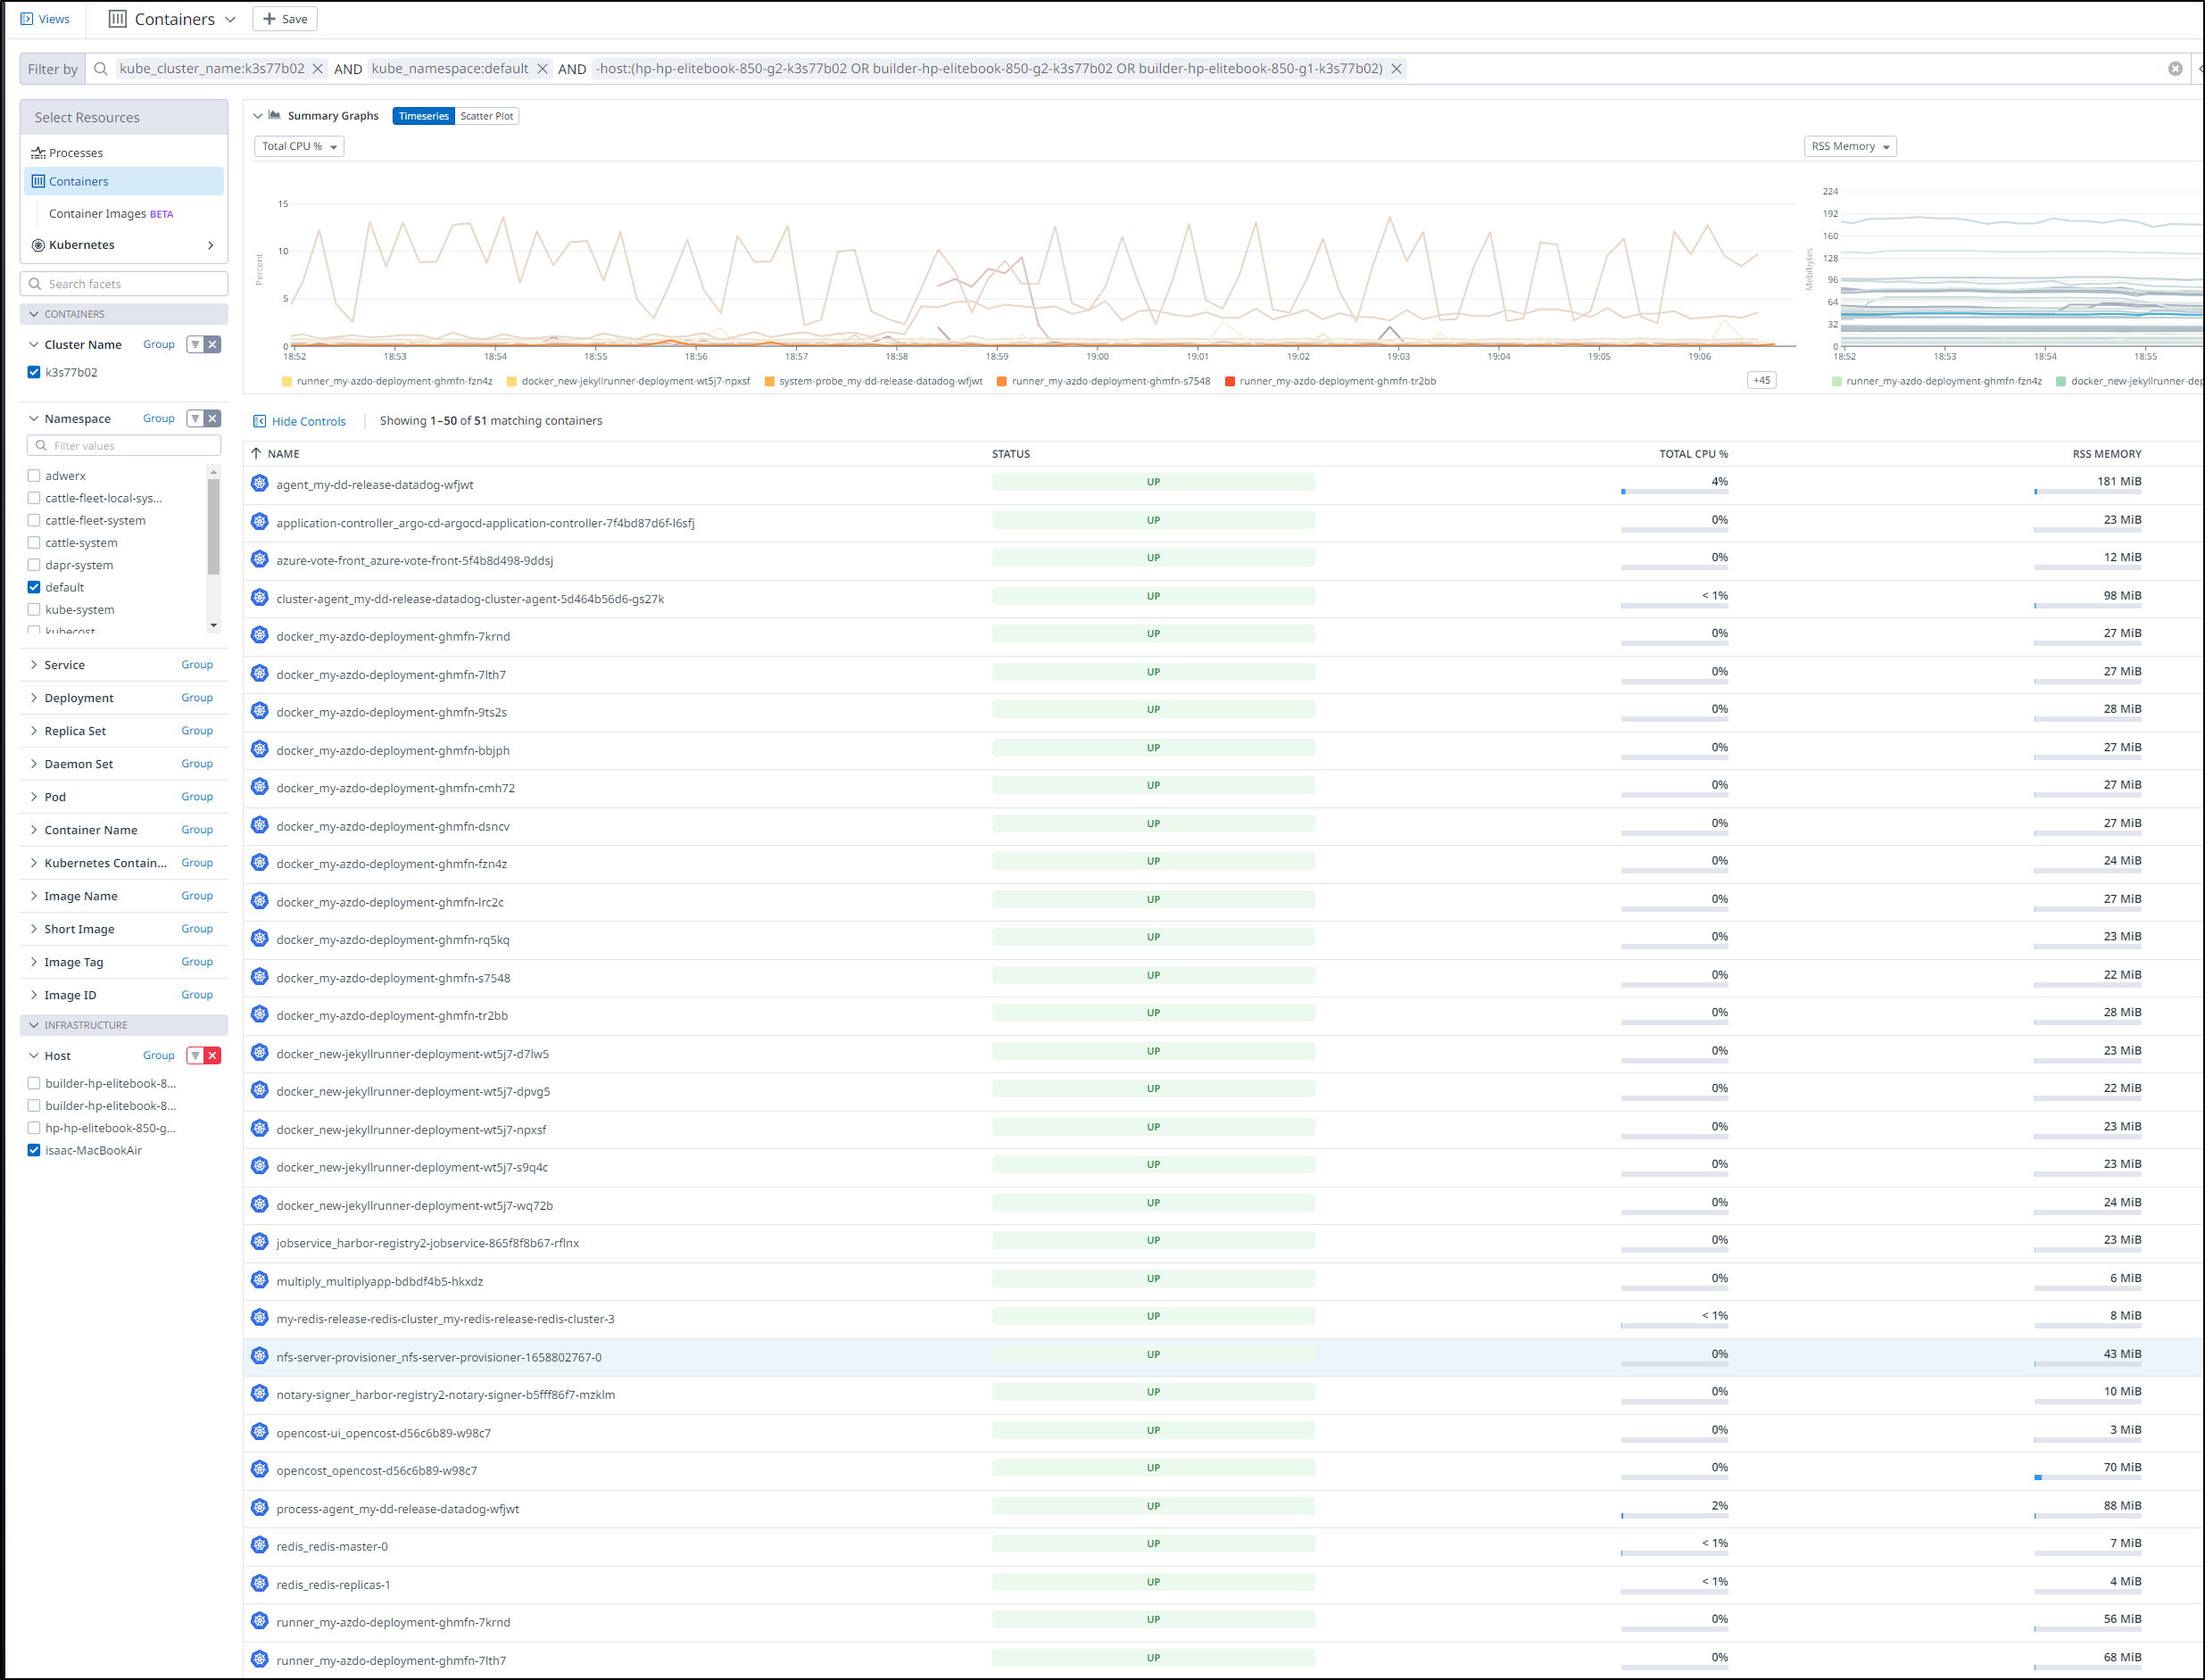
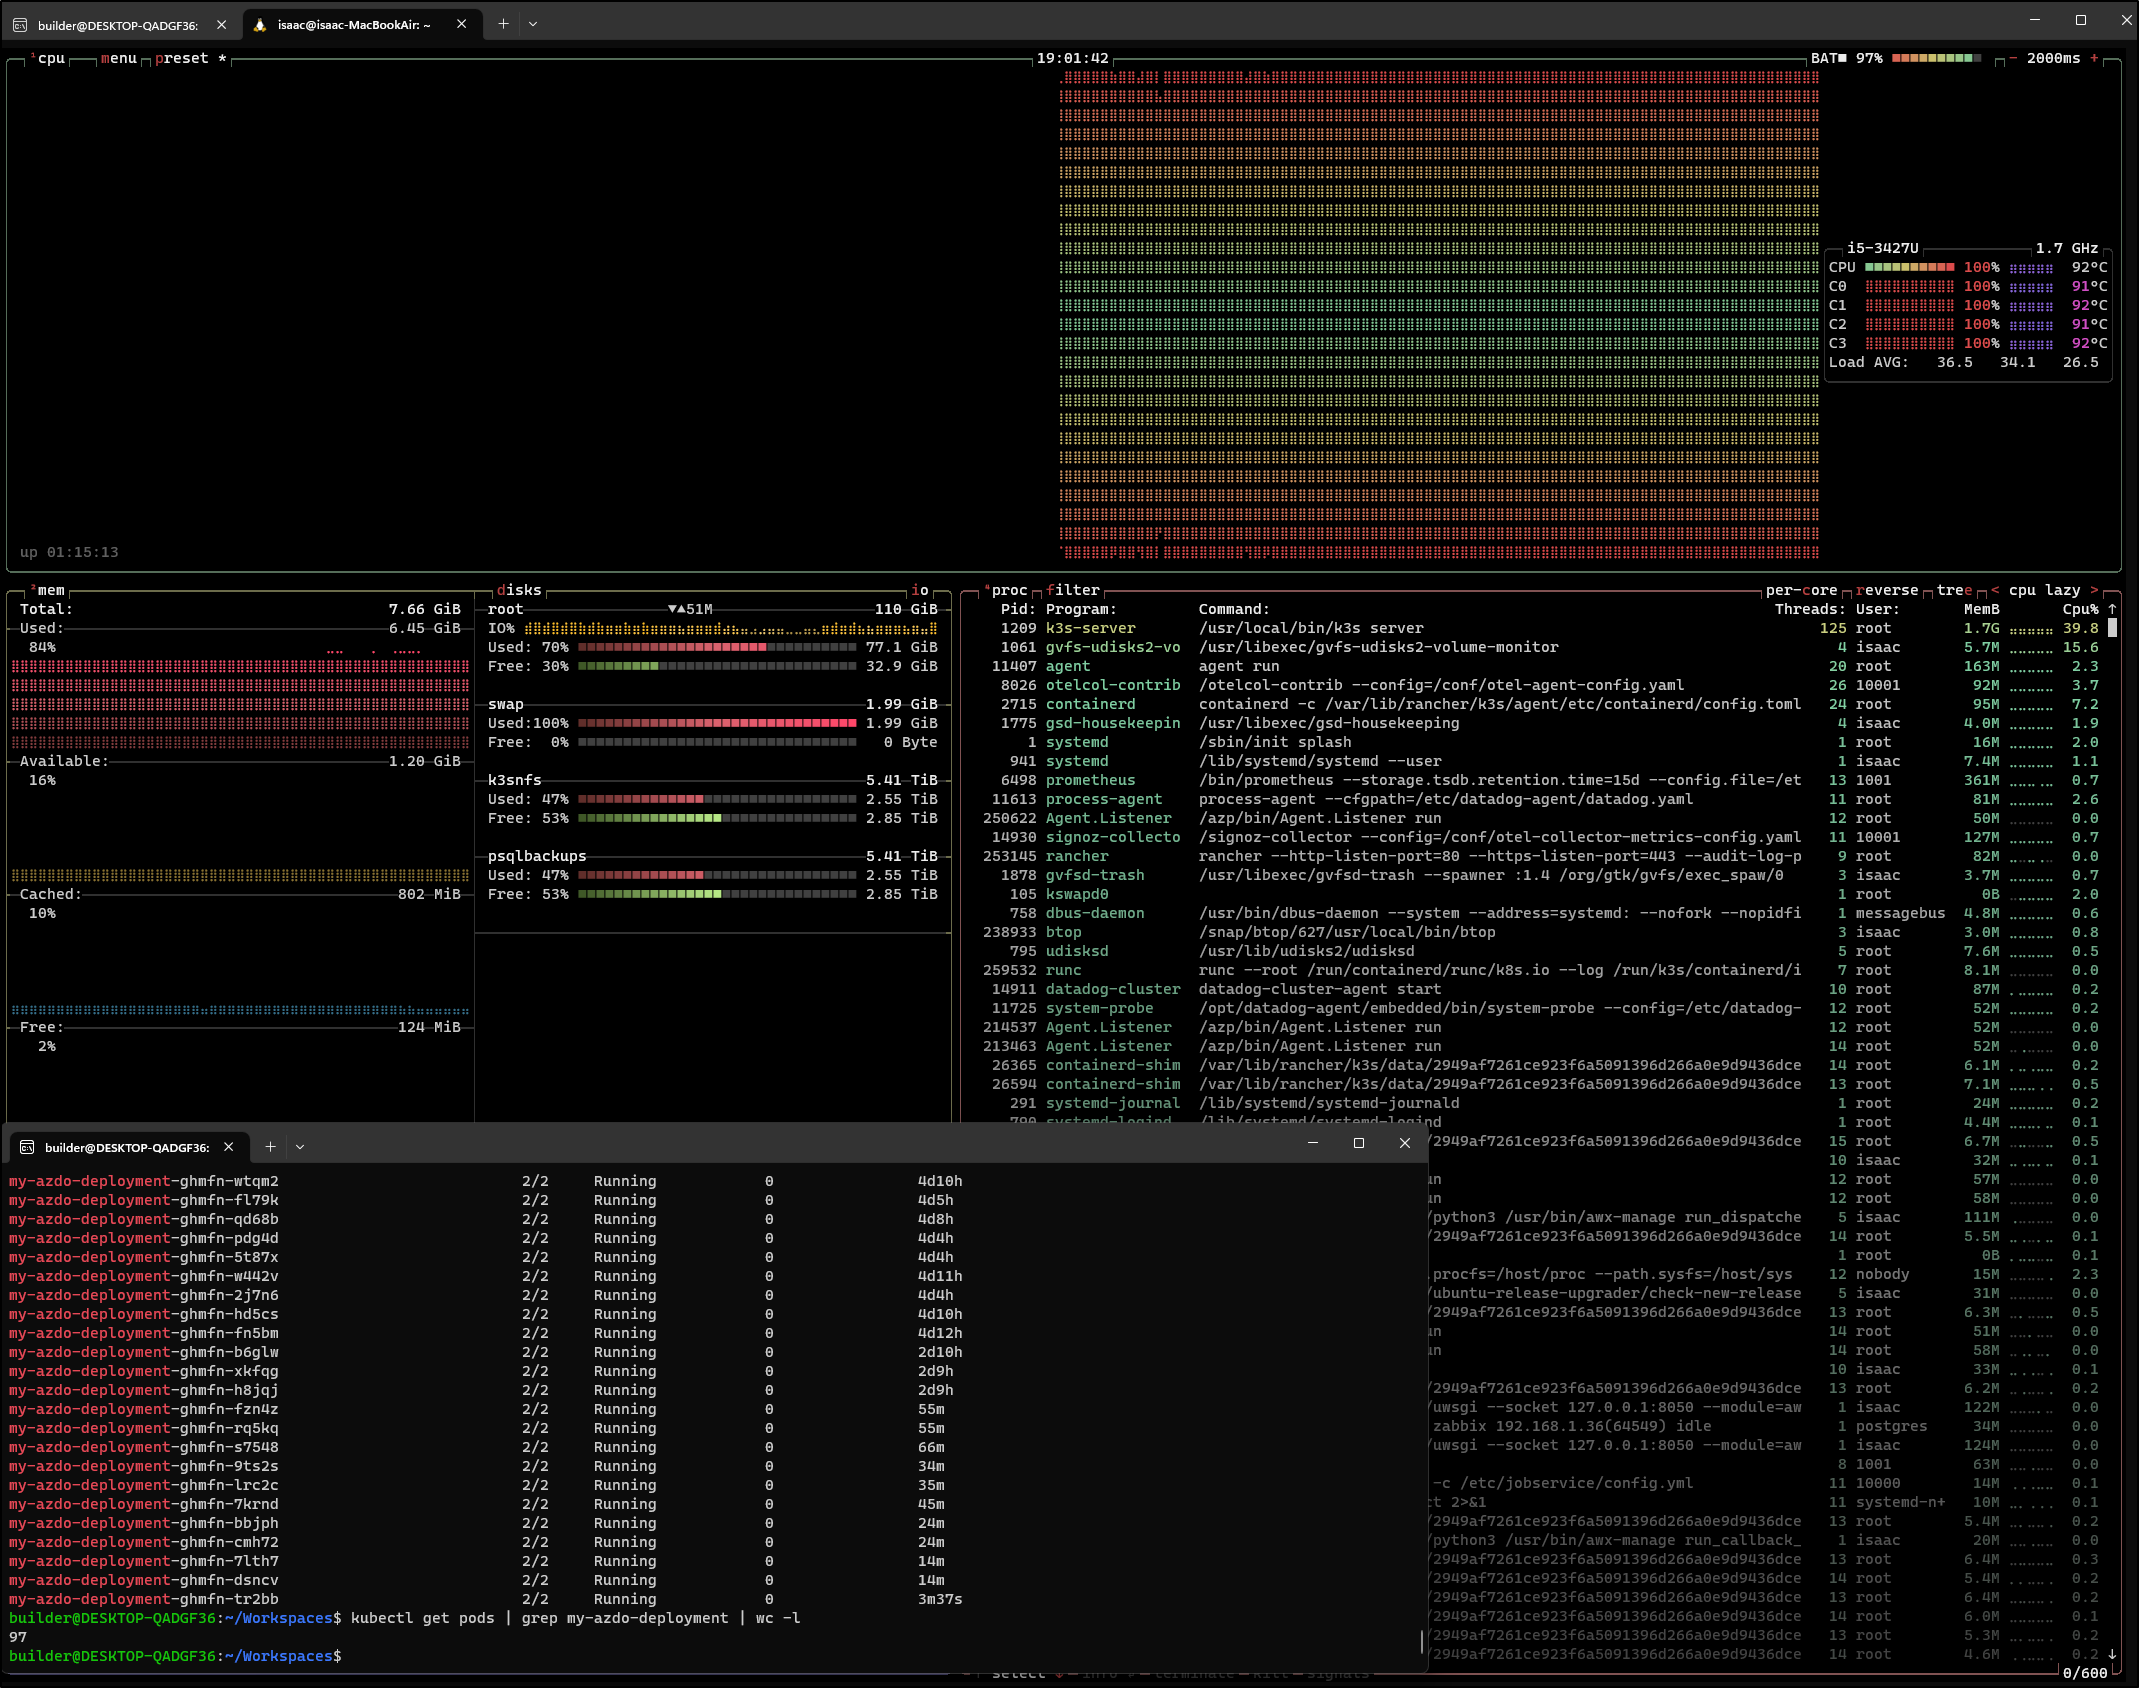
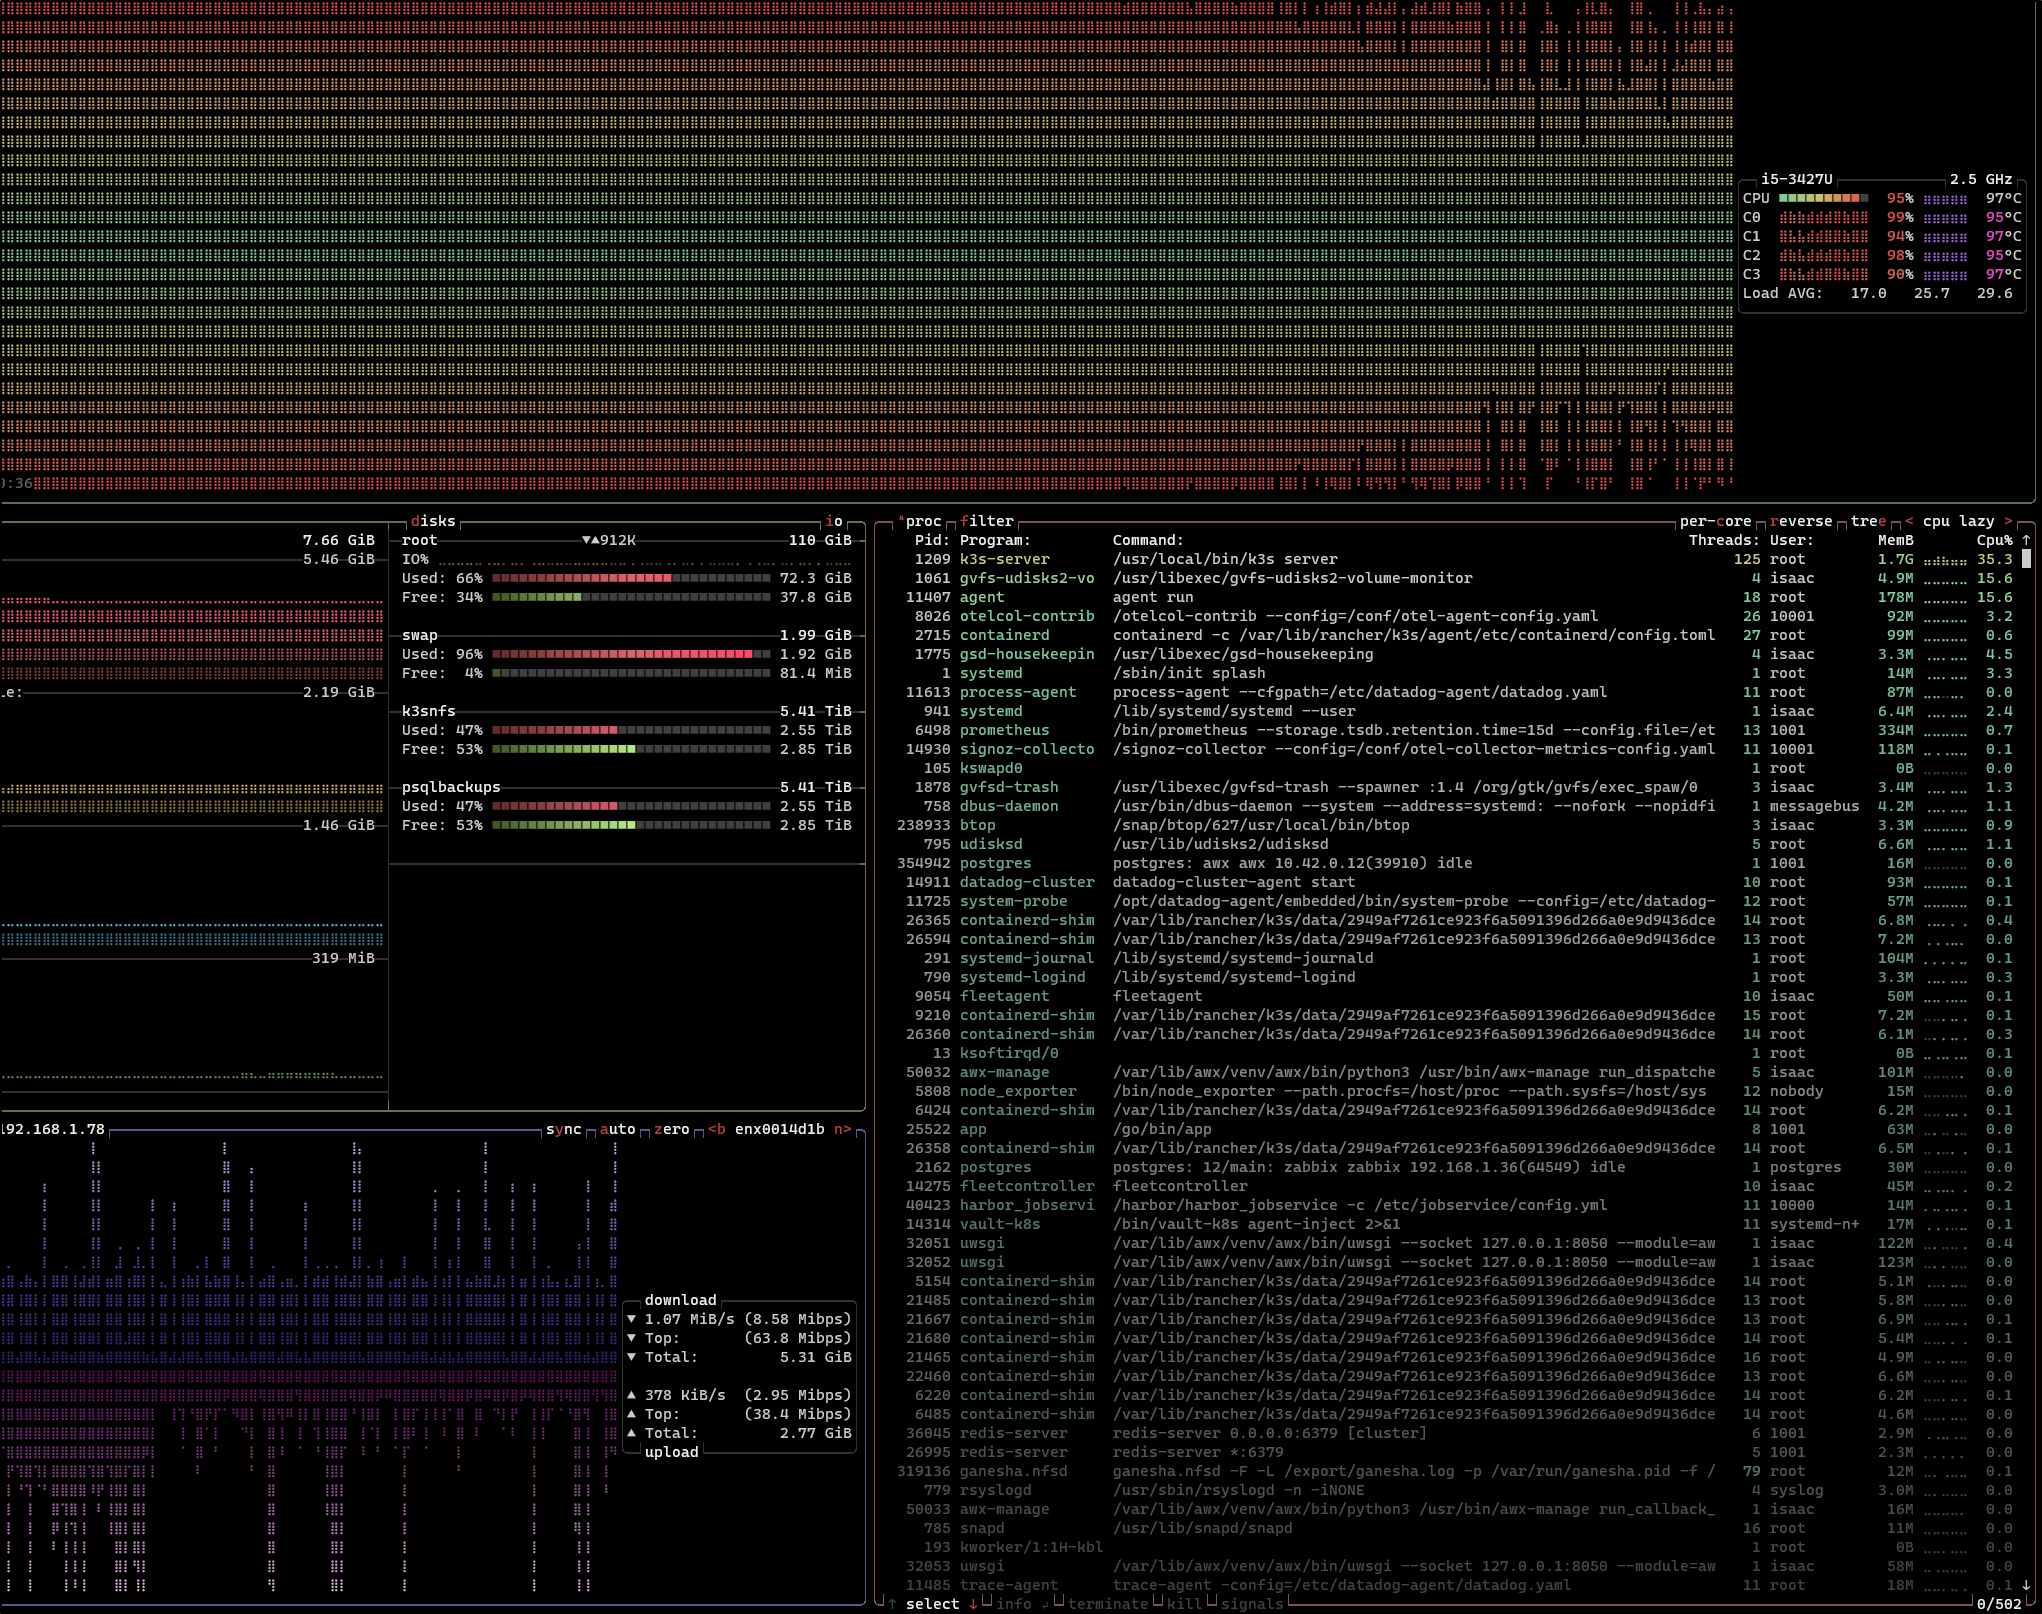
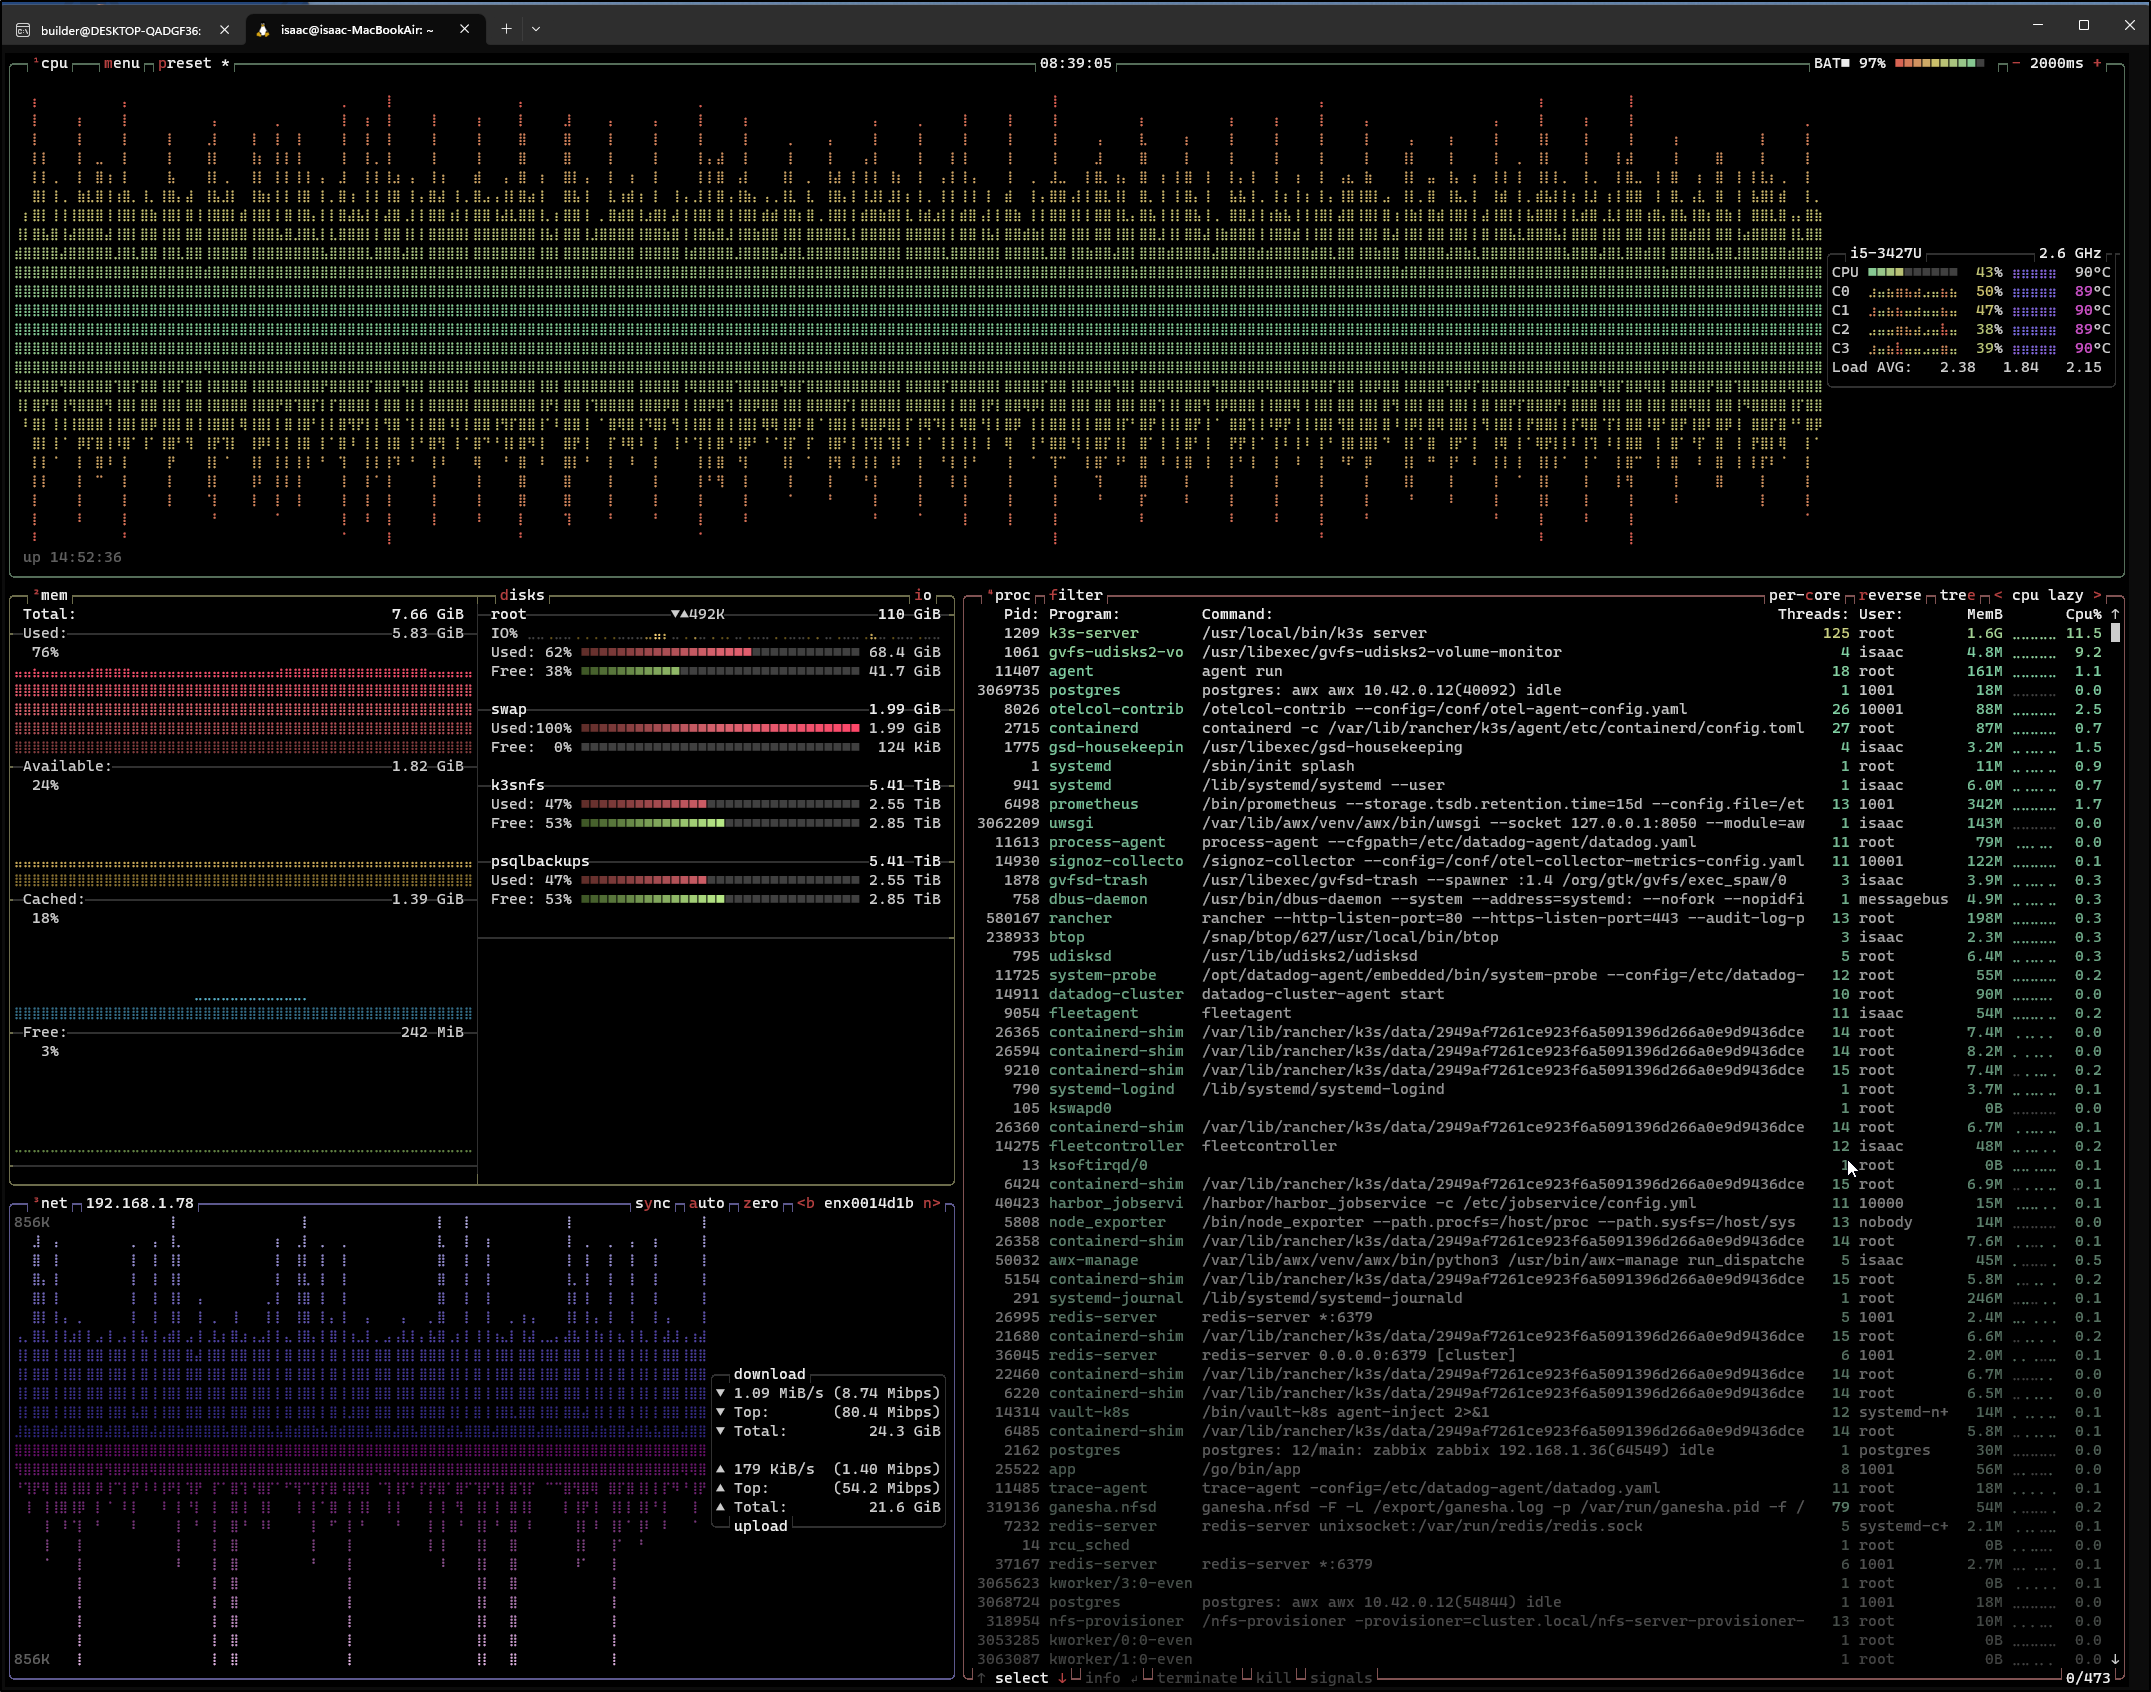
I looked at BTOP and indeed k3s was pegged, but then i noticed in Datadog the number of containers listed active on one host.. wait that does not make sense
That is WAY too many AzDO runners
I popped in and saw that it has scaled up to 97!
builder@DESKTOP-QADGF36:~/Workspaces$ kubectl describe runnerdeployment my-azdo-deployment
Name:         my-azdo-deployment
Namespace:    default
Labels:       <none>
Annotations:  <none>
API Version:  actions.summerwind.dev/v1alpha1
Kind:         RunnerDeployment
Metadata:
  Creation Timestamp:  2023-08-01T11:32:29Z
  Generation:          1
  Resource Version:    194448313
  UID:                 219d4f44-21a7-4c3c-b6bb-db5a54b8c521
Spec:
  Effective Time:  <nil>
  Selector:        <nil>
  Template:
    Metadata:
    Spec:
      Docker Enabled:  true
      Dockerd Container Resources:
      Env:
        Name:   AZP_POOL
        Value:  k3s77-self-hosted
        Name:   AZP_URL
        Value:  https://dev.azure.com/princessking
        Name:   AZP_TOKEN
        Value From:
          Secret Key Ref:
            Key:          azdopat
            Name:         azdopat
            Optional:     false
      Image:              idjohnson/azdoagent:0.1.0
      Image Pull Policy:  IfNotPresent
      Labels:
        my-azdo-deployment
      Repository:  idjohnson/ansible-playbooks
      Resources:
Status:
  Available Replicas:  1
  Desired Replicas:    1
  Ready Replicas:      1
  Replicas:            97
  Updated Replicas:    97
Events:                <none>
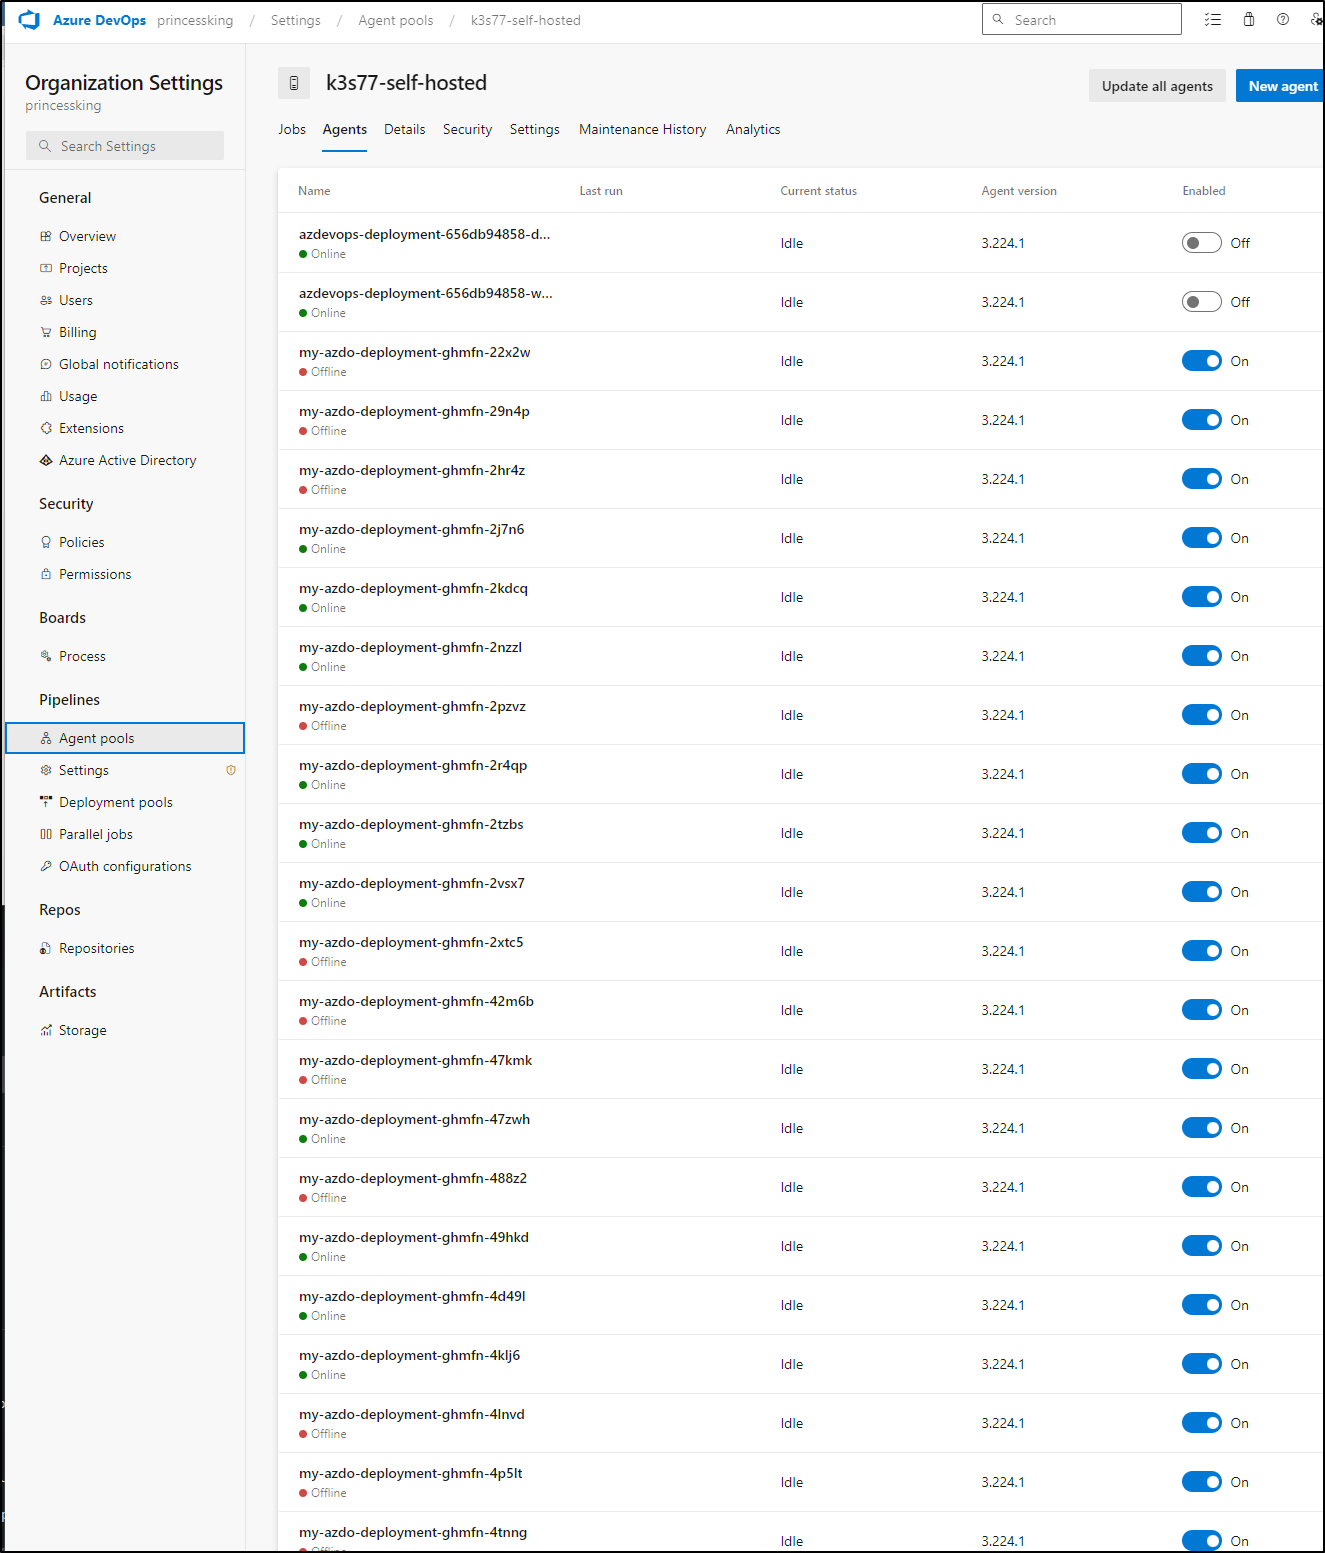
My agent count was super high
And btop was showing a pegged host
I clearly did something really stoopid
builder@DESKTOP-QADGF36:~/Workspaces$ kubectl get runnerdeployment
NAME                          DESIRED   CURRENT   UP-TO-DATE   AVAILABLE   AGE
new-jekyllrunner-deployment   5         5         5            5           192d
my-azdo-deployment                      97        97           1           4d12h
I tried to force set replicas to 2 and it still kept scaling up!
$ kubectl describe runnerdeployment my-azdo-deployment
Name:         my-azdo-deployment
Namespace:    default
Labels:       <none>
Annotations:  <none>
API Version:  actions.summerwind.dev/v1alpha1
Kind:         RunnerDeployment
Metadata:
  Creation Timestamp:  2023-08-01T11:32:29Z
  Generation:          2
  Resource Version:    194452014
  UID:                 219d4f44-21a7-4c3c-b6bb-db5a54b8c521
Spec:
  Effective Time:  <nil>
  Replicas:        2
  Selector:        <nil>
  Template:
    Metadata:
    Spec:
      Docker Enabled:  true
      Dockerd Container Resources:
      Env:
        Name:   AZP_POOL
        Value:  k3s77-self-hosted
        Name:   AZP_URL
        Value:  https://dev.azure.com/princessking
        Name:   AZP_TOKEN
        Value From:
          Secret Key Ref:
            Key:          azdopat
            Name:         azdopat
            Optional:     false
      Image:              idjohnson/azdoagent:0.1.0
      Image Pull Policy:  IfNotPresent
      Labels:
        my-azdo-deployment
      Repository:  idjohnson/ansible-playbooks
      Resources:
Status:
  Available Replicas:  2
  Desired Replicas:    2
  Ready Replicas:      2
  Replicas:            99
  Updated Replicas:    99
Events:                <none>
It was going to scale until the host fell over (again).
I saved aside this mistake and deleted the deployment
builder@DESKTOP-QADGF36:~/Workspaces$ kubectl get runnerdeployment my-azdo-deployment -o yaml > runnerdeployment.azdo.bigissue.yaml
builder@DESKTOP-QADGF36:~/Workspaces$ kubectl delete runnerdeployment my-azdo-deployment
runnerdeployment.actions.summerwind.dev "my-azdo-deployment" deleted
There were still WAY too many
builder@DESKTOP-QADGF36:~/Workspaces$ kubectl get pods -l runner-deployment-name=my-azdo-deployment
NAME                             READY   STATUS        RESTARTS   AGE
my-azdo-deployment-ghmfn-hfrlg   2/2     Running       0          4d11h
my-azdo-deployment-ghmfn-fddh7   2/2     Running       0          4d6h
my-azdo-deployment-ghmfn-7f2mq   2/2     Running       0          4d4h
my-azdo-deployment-ghmfn-qdtnn   2/2     Running       0          4d10h
my-azdo-deployment-ghmfn-qcbp9   2/2     Running       0          4d6h
my-azdo-deployment-ghmfn-pqdx8   2/2     Running       0          4d10h
my-azdo-deployment-ghmfn-l2xpw   2/2     Running       0          4d8h
my-azdo-deployment-ghmfn-7wclm   2/2     Running       0          4d7h
my-azdo-deployment-ghmfn-bhxhj   2/2     Running       0          4d12h
my-azdo-deployment-ghmfn-9xrm4   2/2     Running       0          4d5h
my-azdo-deployment-ghmfn-6k6h6   2/2     Running       0          4d10h
my-azdo-deployment-ghmfn-5cml2   2/2     Running       0          4d11h
my-azdo-deployment-ghmfn-xw654   2/2     Running       0          4d10h
my-azdo-deployment-ghmfn-7jb9r   2/2     Running       0          4d6h
my-azdo-deployment-ghmfn-r5xwg   2/2     Running       0          4d6h
my-azdo-deployment-ghmfn-nmsdf   2/2     Running       0          4d5h
my-azdo-deployment-ghmfn-f5vqr   2/2     Running       0          4d9h
my-azdo-deployment-ghmfn-n9j6v   2/2     Running       0          4d9h
my-azdo-deployment-ghmfn-xqqsd   2/2     Running       0          4d7h
my-azdo-deployment-ghmfn-7x6tj   2/2     Running       0          4d7h
my-azdo-deployment-ghmfn-nsvbj   2/2     Running       0          4d9h
my-azdo-deployment-ghmfn-7wbxv   2/2     Running       0          4d6h
my-azdo-deployment-ghmfn-rf84l   2/2     Running       0          4d5h
my-azdo-deployment-ghmfn-47zwh   2/2     Running       0          4d2h
my-azdo-deployment-ghmfn-vjqzl   2/2     Running       0          4d2h
my-azdo-deployment-ghmfn-v4l5b   2/2     Running       0          4d2h
my-azdo-deployment-ghmfn-jcfrc   2/2     Running       0          4d2h
my-azdo-deployment-ghmfn-8ddkd   2/2     Running       0          4d2h
my-azdo-deployment-ghmfn-8bjtz   2/2     Running       0          4d1h
my-azdo-deployment-ghmfn-zjs26   2/2     Running       0          4d1h
my-azdo-deployment-ghmfn-hwcmd   2/2     Running       0          4d1h
my-azdo-deployment-ghmfn-2tzbs   2/2     Running       0          4d1h
my-azdo-deployment-ghmfn-xrtbp   2/2     Running       0          4d1h
my-azdo-deployment-ghmfn-4klj6   2/2     Running       0          4d1h
my-azdo-deployment-ghmfn-fv2z2   2/2     Running       0          4d1h
my-azdo-deployment-ghmfn-2vsx7   2/2     Running       0          4d1h
my-azdo-deployment-ghmfn-jsgqb   2/2     Running       0          4d1h
my-azdo-deployment-ghmfn-qg7bp   2/2     Running       0          4d
my-azdo-deployment-ghmfn-bc2pz   2/2     Running       0          4d5h
my-azdo-deployment-ghmfn-7wntl   2/2     Running       0          4d10h
my-azdo-deployment-ghmfn-kdwcw   2/2     Running       0          4d11h
my-azdo-deployment-ghmfn-s5j2n   2/2     Running       0          4d11h
my-azdo-deployment-ghmfn-w4r87   2/2     Running       0          4d9h
my-azdo-deployment-ghmfn-5khs6   2/2     Running       0          4d9h
my-azdo-deployment-ghmfn-d9jhp   2/2     Running       0          4d12h
my-azdo-deployment-ghmfn-pmdg4   2/2     Running       0          4d8h
my-azdo-deployment-ghmfn-jmgpz   2/2     Running       0          4d
my-azdo-deployment-ghmfn-xtw9v   2/2     Running       0          4d8h
my-azdo-deployment-ghmfn-mdrj6   2/2     Running       0          4d4h
my-azdo-deployment-ghmfn-rpvbj   2/2     Running       0          4d10h
my-azdo-deployment-ghmfn-jbngp   2/2     Running       0          4d8h
my-azdo-deployment-ghmfn-mqx8x   2/2     Running       0          4d7h
my-azdo-deployment-ghmfn-rwkng   2/2     Running       0          4d8h
my-azdo-deployment-ghmfn-wtqm2   2/2     Running       0          4d11h
my-azdo-deployment-ghmfn-fl79k   2/2     Running       0          4d5h
my-azdo-deployment-ghmfn-qd68b   2/2     Running       0          4d8h
my-azdo-deployment-ghmfn-5t87x   2/2     Running       0          4d4h
my-azdo-deployment-ghmfn-2j7n6   2/2     Running       0          4d4h
my-azdo-deployment-ghmfn-hd5cs   2/2     Running       0          4d10h
my-azdo-deployment-ghmfn-b6glw   2/2     Running       0          2d10h
my-azdo-deployment-ghmfn-xkfqg   2/2     Running       0          2d10h
my-azdo-deployment-ghmfn-h8jqj   2/2     Running       0          2d9h
my-azdo-deployment-ghmfn-fzn4z   2/2     Running       0          70m
my-azdo-deployment-ghmfn-rq5kq   2/2     Running       0          70m
my-azdo-deployment-ghmfn-s7548   2/2     Running       0          81m
my-azdo-deployment-ghmfn-9ts2s   2/2     Running       0          49m
my-azdo-deployment-ghmfn-lrc2c   2/2     Running       0          49m
my-azdo-deployment-ghmfn-7krnd   2/2     Running       0          60m
my-azdo-deployment-ghmfn-bbjph   2/2     Running       0          39m
my-azdo-deployment-ghmfn-cmh72   2/2     Running       0          39m
my-azdo-deployment-ghmfn-7lth7   2/2     Running       0          29m
my-azdo-deployment-ghmfn-dsncv   2/2     Running       0          29m
my-azdo-deployment-ghmfn-thtn8   2/2     Running       0          8m5s
my-azdo-deployment-ghmfn-tr2bb   2/2     Running       0          18m
my-azdo-deployment-ghmfn-w442v   0/2     Terminating   0          4d12h
my-azdo-deployment-ghmfn-xswpf   0/2     Terminating   0          4d8h
my-azdo-deployment-ghmfn-49hkd   0/2     Terminating   0          4d7h
my-azdo-deployment-ghmfn-pdg4d   2/2     Terminating   0          4d5h
my-azdo-deployment-ghmfn-k74cm   2/2     Terminating   0          4d8h
my-azdo-deployment-ghmfn-jz9ls   0/2     Terminating   0          4d9h
my-azdo-deployment-ghmfn-6z9ff   2/2     Terminating   0          4d11h
my-azdo-deployment-ghmfn-h8wmt   2/2     Terminating   0          4d4h
my-azdo-deployment-ghmfn-z528t   0/2     Terminating   0          4d
my-azdo-deployment-ghmfn-78jhs   0/2     Terminating   0          4d8h
my-azdo-deployment-ghmfn-lmrfv   2/2     Terminating   0          4d5h
my-azdo-deployment-ghmfn-fn5bm   0/2     Terminating   0          4d12h
my-azdo-deployment-ghmfn-78zr4   0/2     Terminating   0          4d2h
my-azdo-deployment-ghmfn-q4kv8   2/2     Terminating   0          8m9s
my-azdo-deployment-ghmfn-2r4qp   2/2     Terminating   0          4d6h
my-azdo-deployment-ghmfn-2nzzl   2/2     Terminating   0          4d11h
my-azdo-deployment-ghmfn-q44ql   0/2     Terminating   0          4d12h
my-azdo-deployment-ghmfn-4d49l   2/2     Terminating   0          4d7h
my-azdo-deployment-ghmfn-vnc9j   2/2     Terminating   0          4d3h
my-azdo-deployment-ghmfn-zttxz   0/2     Terminating   0          4d9h
Time to go nuclear
builder@DESKTOP-QADGF36:~/Workspaces$ kubectl delete pods -l runner-deployment-name=my-azdo-deployment
pod "my-azdo-deployment-ghmfn-hfrlg" deleted
pod "my-azdo-deployment-ghmfn-fddh7" deleted
pod "my-azdo-deployment-ghmfn-7f2mq" deleted
When done, I finally started to see my laptop start to come down
By the next morning, all was well again
Sonarqube (part 2)
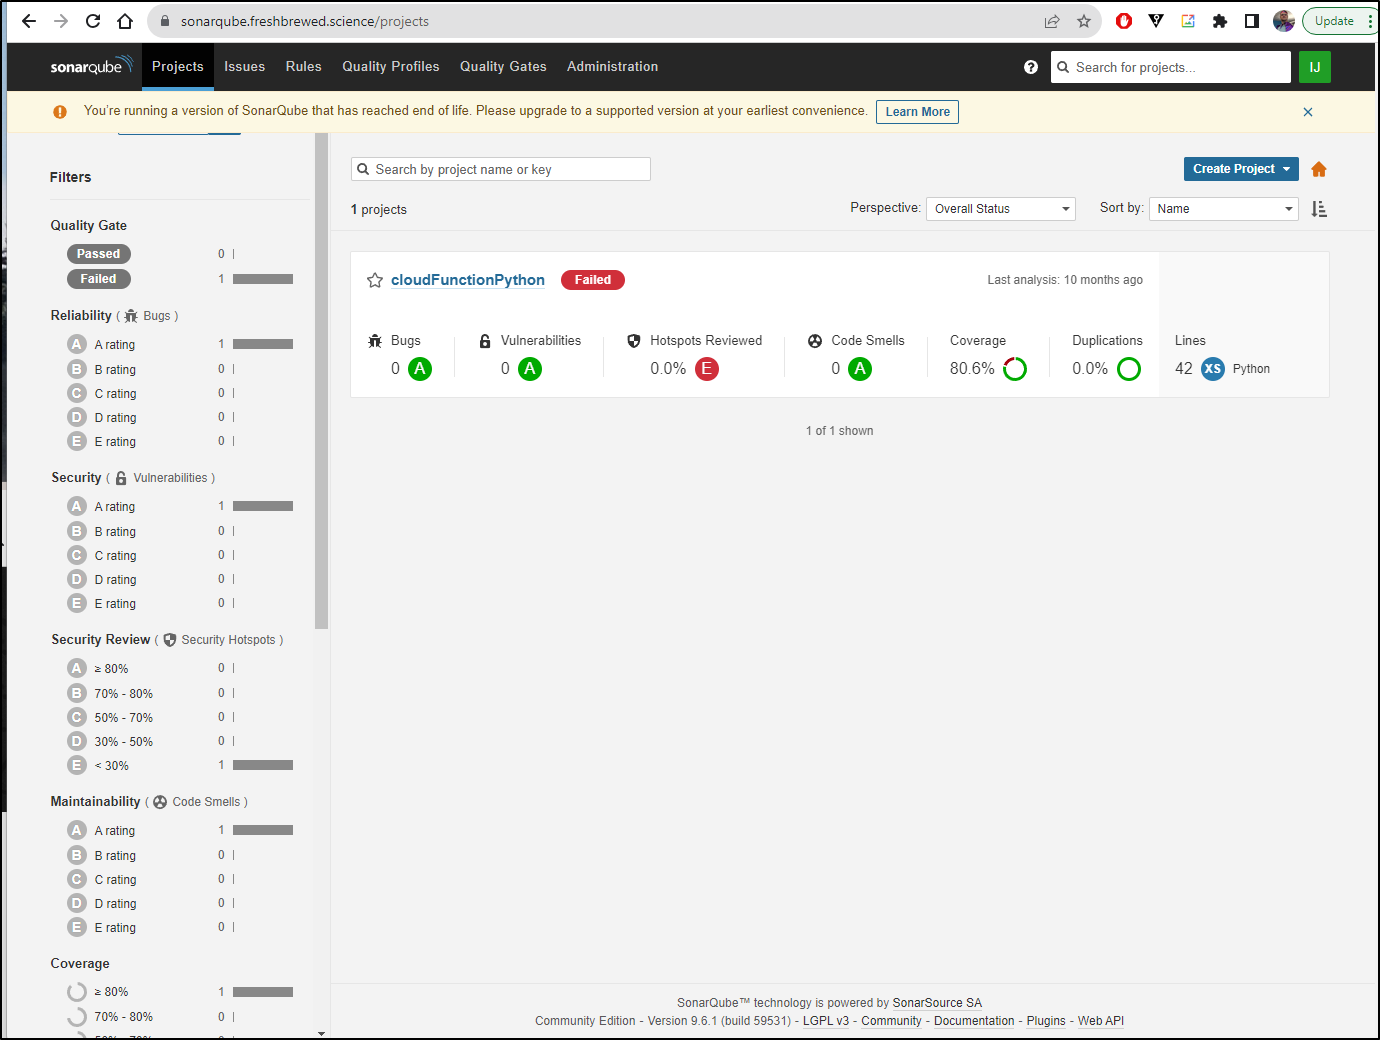
I promised earlier we would revisit sonar. After the insane crashing of the system was brought into order, Sonarqube came back
I could see the new pod held up
The logs also show the active pod is working
It took a bit, but on reboot it did clear and start to run again.
Summary
Today we learned some lessons, right friends? First - don’t yank the power out of a NAS that is already in trouble. You’ll have a bad day.
Second, if a host just keeps burning up, even if you are because of shotty A/C, check if you have a ridonculous number of pods running on it. If you have a replicaset that grows exponentially, you’re going to have a rough go.
We started prep work for a new cluster - namely setting up MariaDB and NFS. We showed how to backup AWX and lastly a quick fix for Sonarqube.


