Published: May 17, 2023 by Isaac Johnson
A while back we looked at Kubecost as a good Open-Source tool for monitoring costs in Kubernetes. In the last year the OS version has forked into OpenCost and has had plenty of changes.
Today we’ll set up OpenCost and check out a couple on-prem clusters.
Setup
Since I’ll start by using a demo cluster, I’ll add Prometheus for Metrics collection which is a requirement for OpenCost
$ helm install my-prometheus --repo https://prometheus-community.github.io/helm-charts prometheus --namespace prometheus --create-namespace --set pushgateway.enabled=false --set alertmanager.enabled=false -f https://raw.githubusercontent.com/opencost/opencost/develop/kubernetes/prometheus/extraScrapeConfigs.yaml
NAME: my-prometheus
LAST DEPLOYED: Wed May 17 08:27:51 2023
NAMESPACE: prometheus
STATUS: deployed
REVISION: 1
TEST SUITE: None
NOTES:
The Prometheus server can be accessed via port 80 on the following DNS name from within your cluster:
my-prometheus-server.prometheus.svc.cluster.local


Get the Prometheus server URL by running these commands in the same shell:
  export POD_NAME=$(kubectl get pods --namespace prometheus -l "app=prometheus,component=server" -o jsonpath="{.items[0].metadata.name}")
  kubectl --namespace prometheus port-forward $POD_NAME 9090


#################################################################################
######   WARNING: Pod Security Policy has been disabled by default since    #####
######            it deprecated after k8s 1.25+. use                        #####
######            (index .Values "prometheus-node-exporter" "rbac"          #####
###### .          "pspEnabled") with (index .Values                         #####
######            "prometheus-node-exporter" "rbac" "pspAnnotations")       #####
######            in case you still need it.                                #####
#################################################################################


The Prometheus PushGateway can be accessed via port 9091 on the following DNS name from within your cluster:
my-prometheus-prometheus-pushgateway.prometheus.svc.cluster.local


Get the PushGateway URL by running these commands in the same shell:
  export POD_NAME=$(kubectl get pods --namespace prometheus -l "app=prometheus-pushgateway,component=pushgateway" -o jsonpath="{.items[0].metadata.name}")
  kubectl --namespace prometheus port-forward $POD_NAME 9091

For more information on running Prometheus, visit:
https://prometheus.io/
Once I see it running
$ kubectl get pods -n prometheus
NAME                                                    READY   STATUS              RESTARTS   AGE
my-prometheus-server-597c87ccd6-bjsbl                   0/2     Pending             0          17s
my-prometheus-prometheus-pushgateway-65857c98fb-cl97x   0/1     ContainerCreating   0          17s
my-prometheus-prometheus-node-exporter-87kkr            0/1     ContainerCreating   0          17s
my-prometheus-prometheus-node-exporter-tbqjh            1/1     Running             0          17s
my-prometheus-prometheus-node-exporter-c2gk2            1/1     Running             0          17s
my-prometheus-kube-state-metrics-65dbf85f86-xgrtr       0/1     Running             0          17s
$ kubectl get pods -n prometheus
NAME                                                    READY   STATUS    RESTARTS   AGE
my-prometheus-prometheus-node-exporter-tbqjh            1/1     Running   0          2m5s
my-prometheus-prometheus-node-exporter-c2gk2            1/1     Running   0          2m5s
my-prometheus-kube-state-metrics-65dbf85f86-xgrtr       1/1     Running   0          2m5s
my-prometheus-prometheus-node-exporter-87kkr            1/1     Running   0          2m5s
my-prometheus-prometheus-pushgateway-65857c98fb-cl97x   1/1     Running   0          2m5s
my-prometheus-server-597c87ccd6-bjsbl                   2/2     Running   0          2m5s
I can now install OpenCost
$ kubectl apply --namespace opencost -f https://raw.githubusercontent.com/opencost/opencost/develop/kubernetes/op
encost.yaml
namespace/opencost created
serviceaccount/opencost created
clusterrole.rbac.authorization.k8s.io/opencost created
clusterrolebinding.rbac.authorization.k8s.io/opencost created
deployment.apps/opencost created
service/opencost created

$ kubectl get pods -n opencost
NAME                        READY   STATUS    RESTARTS   AGE
opencost-84c884b5f5-zwkvm   2/2     Running   0          24s
OpenCost will create a service we can use to access the UI
$ kubectl port-forward --namespace opencost service/opencost 9003 9090
Forwarding from 127.0.0.1:9003 -> 9003
Forwarding from [::1]:9003 -> 9003
Forwarding from 127.0.0.1:9090 -> 9090
Forwarding from [::1]:9090 -> 9090
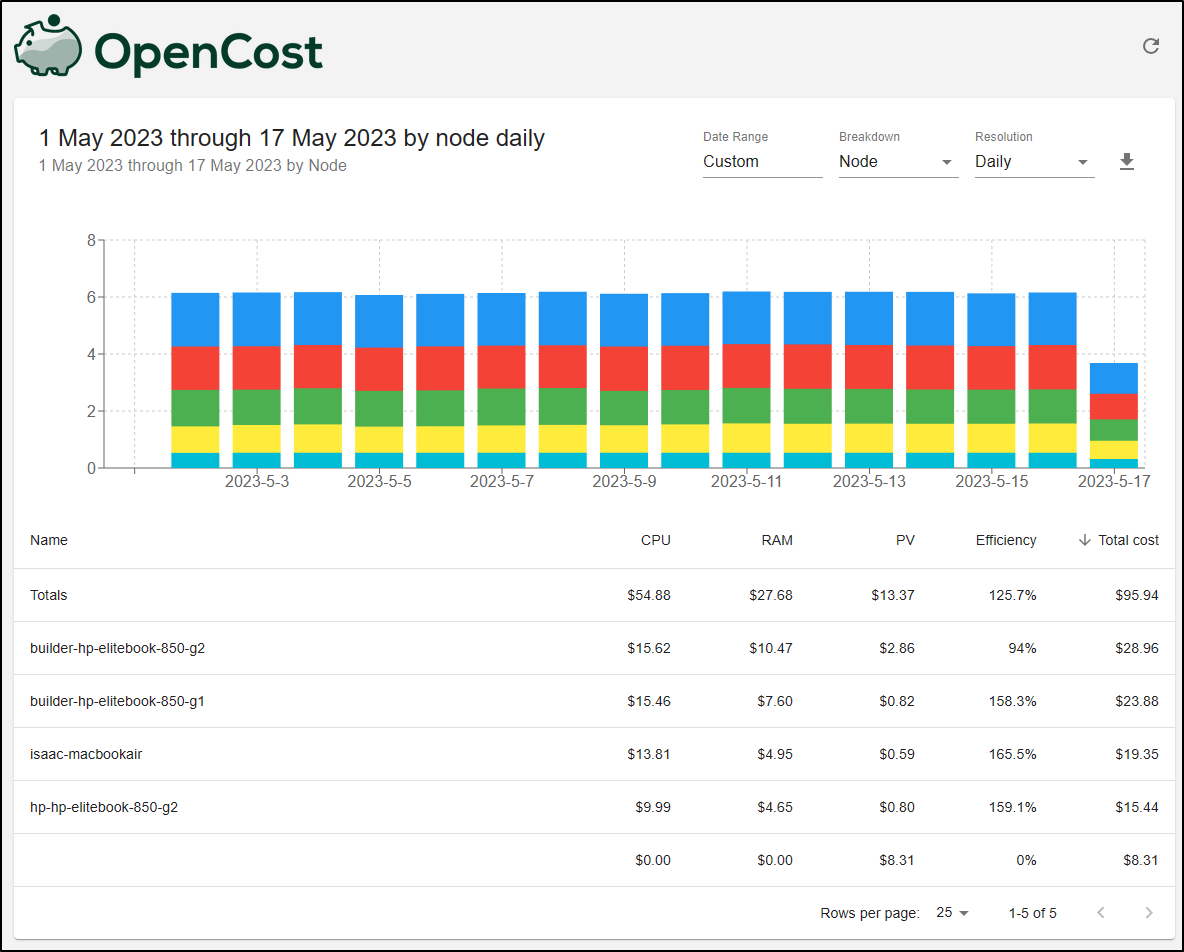
We can view things by Node
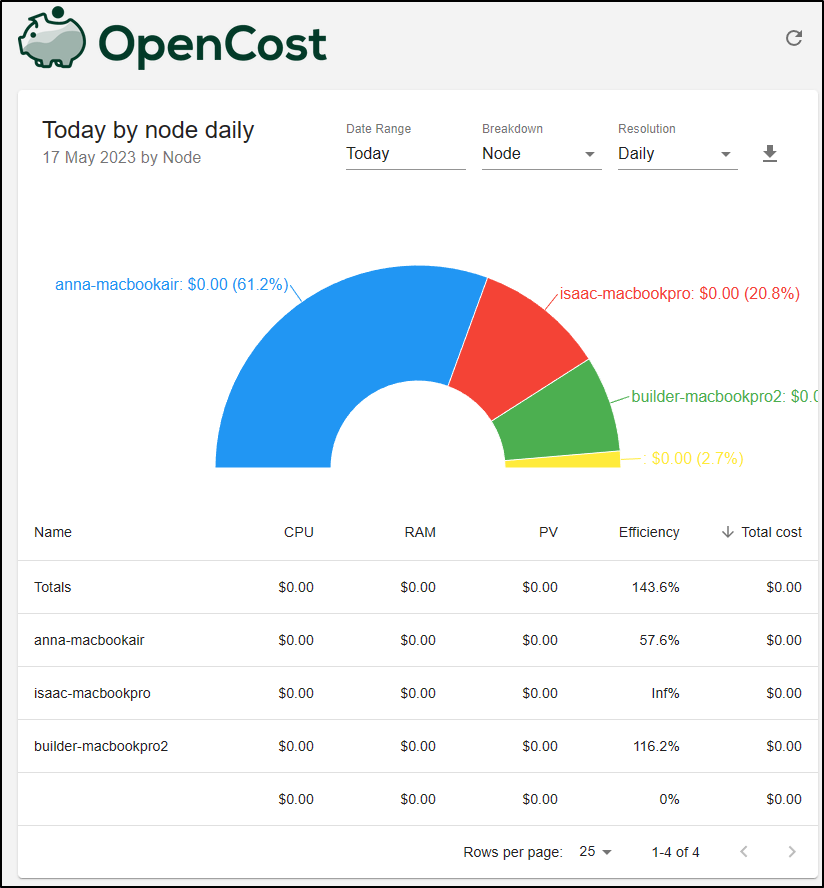
which shows the primary node (anna-macbook air) is doing most of the heavy lifting
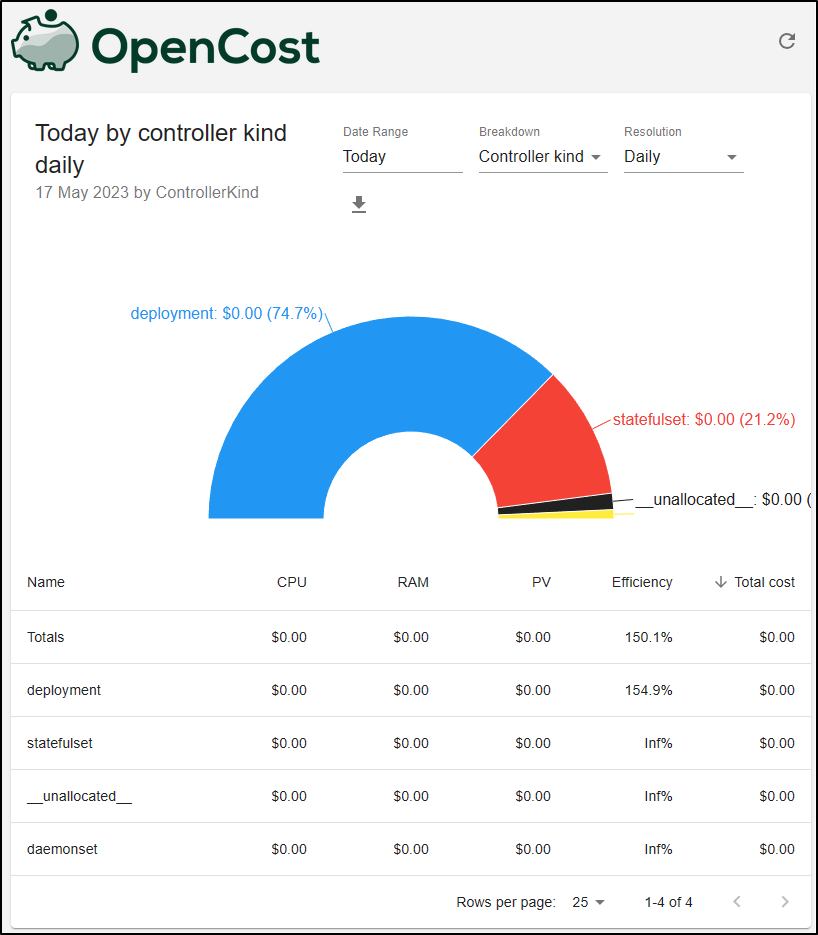
We can look at data by type of workload (Controller Kind).
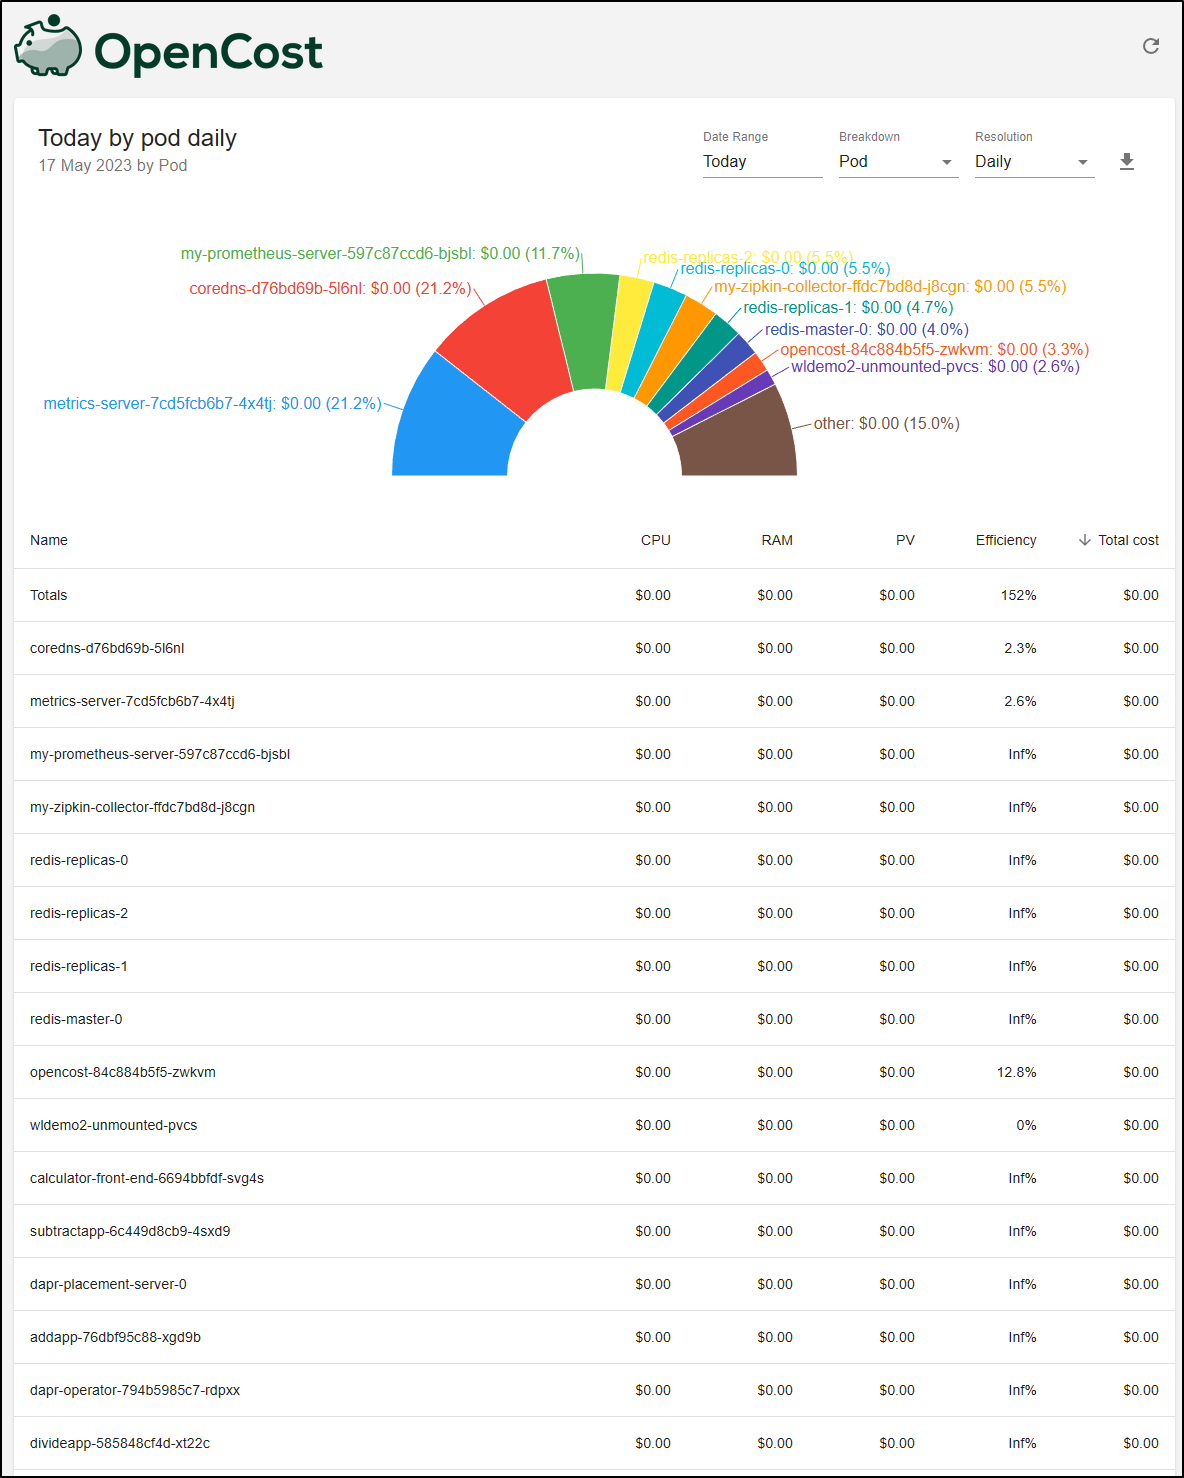
and Pod
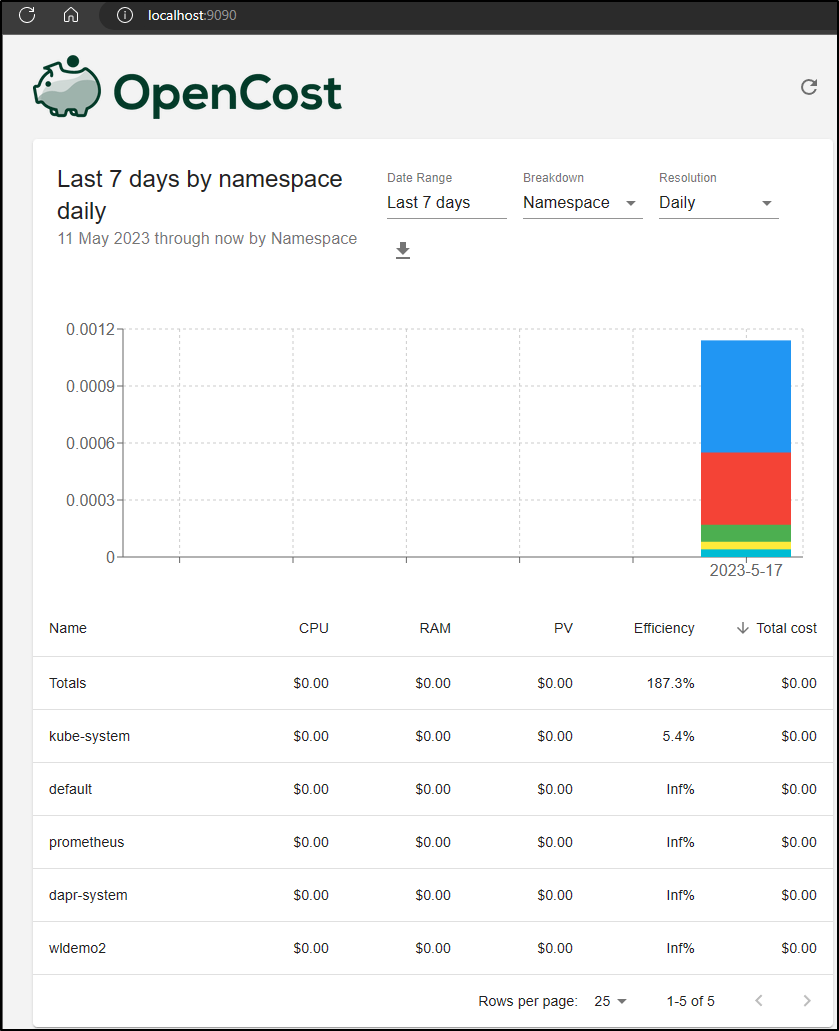
The other options are Namespace
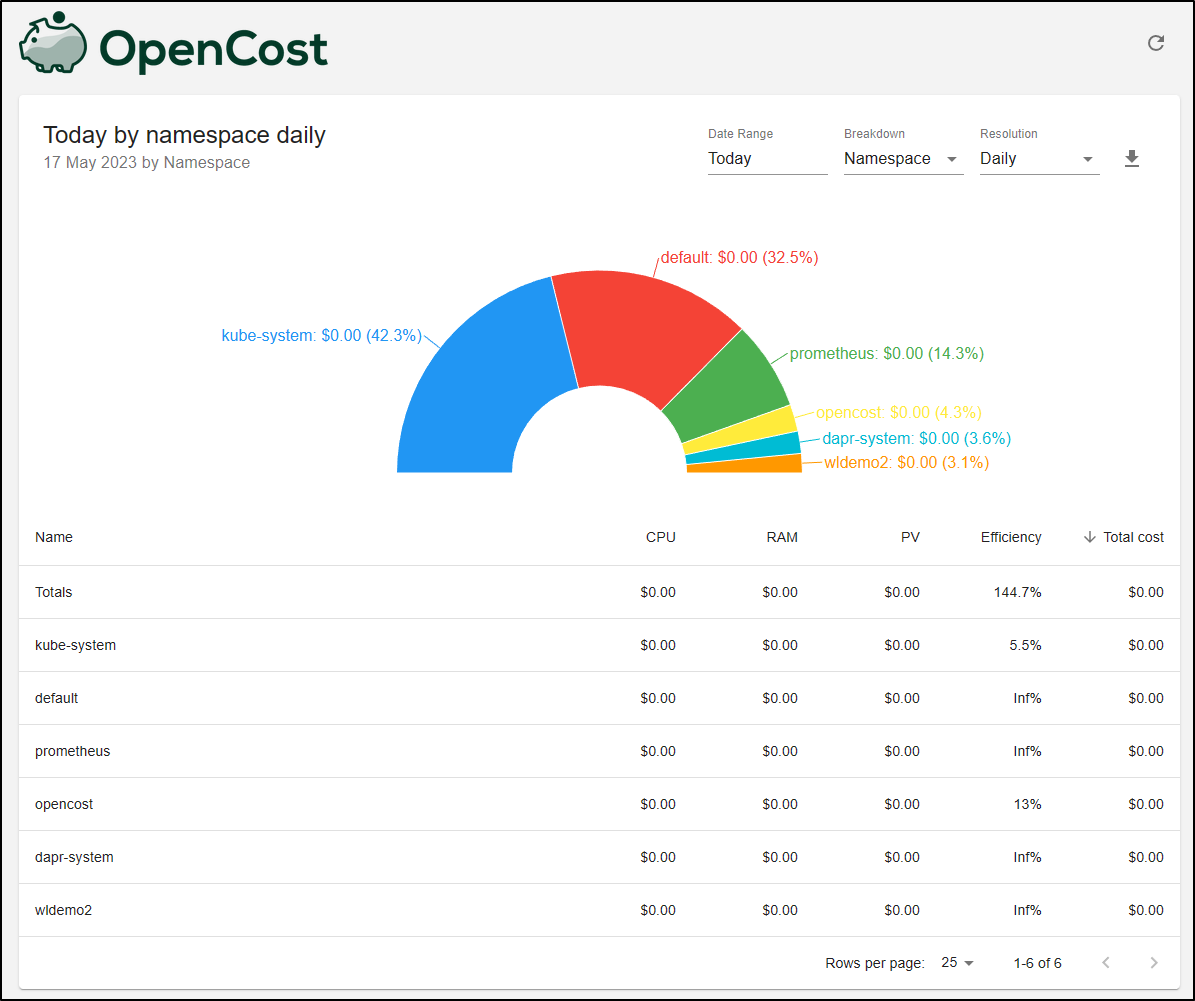
and service
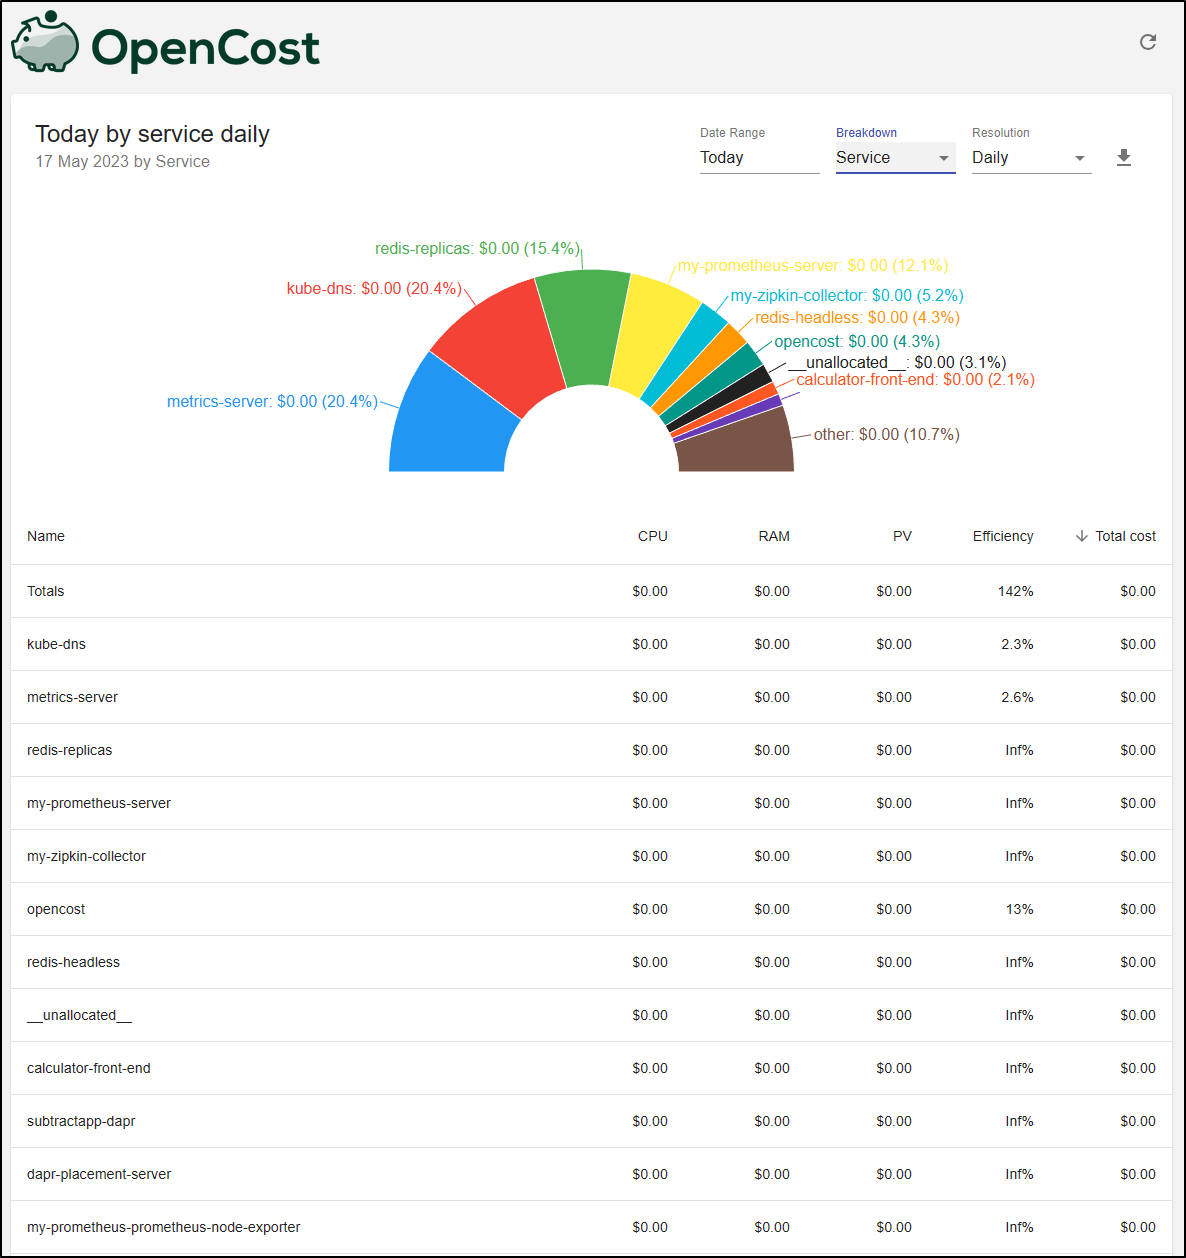
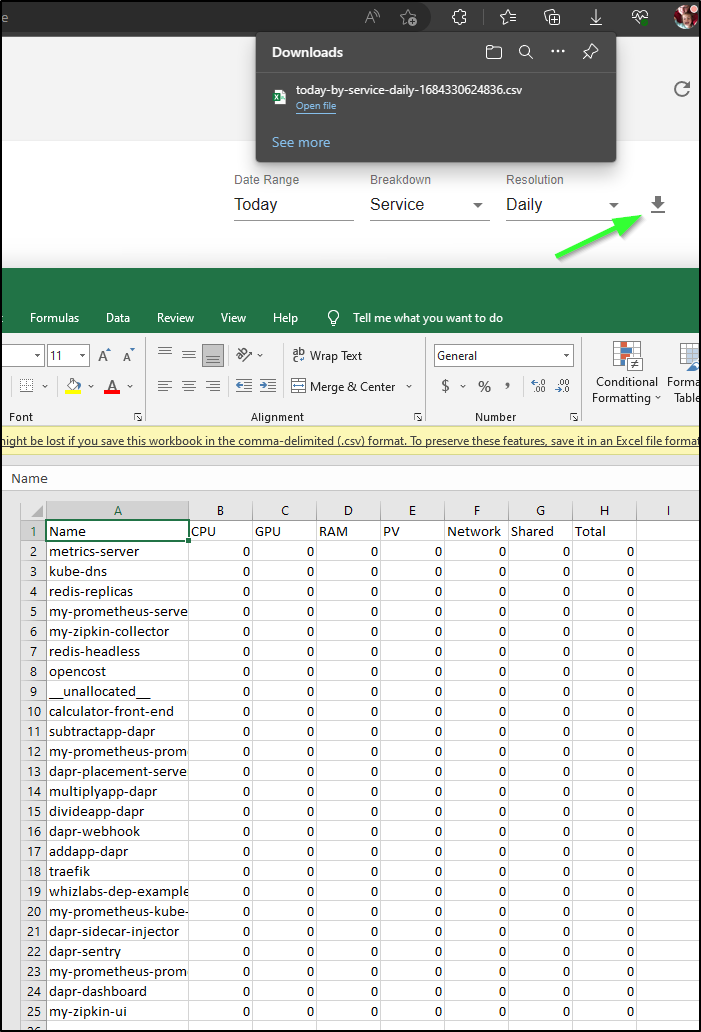
If I click the “Download CSV” icon, I can get a wholly uninteresting CSV of the data
Prod cluster
I’ll bring down the Github file locally and change to use the Prom server already running for Kubecost
            - name: PROMETHEUS_SERVER_ENDPOINT
              value: "http://kubecost-prometheus-server.kubecost.svc"
I’m not certain it will work as the Job in that Prom server does not have the identical extraconfigs that OpenCost desires
extraScrapeConfigs: |
  - job_name: opencost
    honor_labels: true
    scrape_interval: 1m
    scrape_timeout: 10s
    metrics_path: /metrics
    scheme: http
    dns_sd_configs:
    - names:
      - opencost.opencost
      type: 'A'
      port: 9003
though it does expose the /metrics endpoint with similar settings
$ kubectl get cm kubecost-prometheus-server -n kubecost -o yaml | grep -C 10 9003
    - job_name: kubecost
      honor_labels: true
      scrape_interval: 1m
      scrape_timeout: 60s
      metrics_path: /metrics
      scheme: http
      dns_sd_configs:
      - names:
        - kubecost-cost-analyzer
        type: 'A'
        port: 9003
    - job_name: kubecost-networking
      kubernetes_sd_configs:
        - role: pod
      relabel_configs:
      # Scrape only the the targets matching the following metadata
        - source_labels: [__meta_kubernetes_pod_label_app]
          action: keep
          regex:  kubecost-network-costs
  recording_rules.yml: |
    {}
Suprisingly, this worked just dandy!
I port-forwarded
$ kubectl port-forward --namespace opencost service/opencost 9003 9090
Forwarding from 127.0.0.1:9003 -> 9003
Forwarding from [::1]:9003 -> 9003
Forwarding from 127.0.0.1:9090 -> 9090
Forwarding from [::1]:9090 -> 9090
Handling connection for 9090
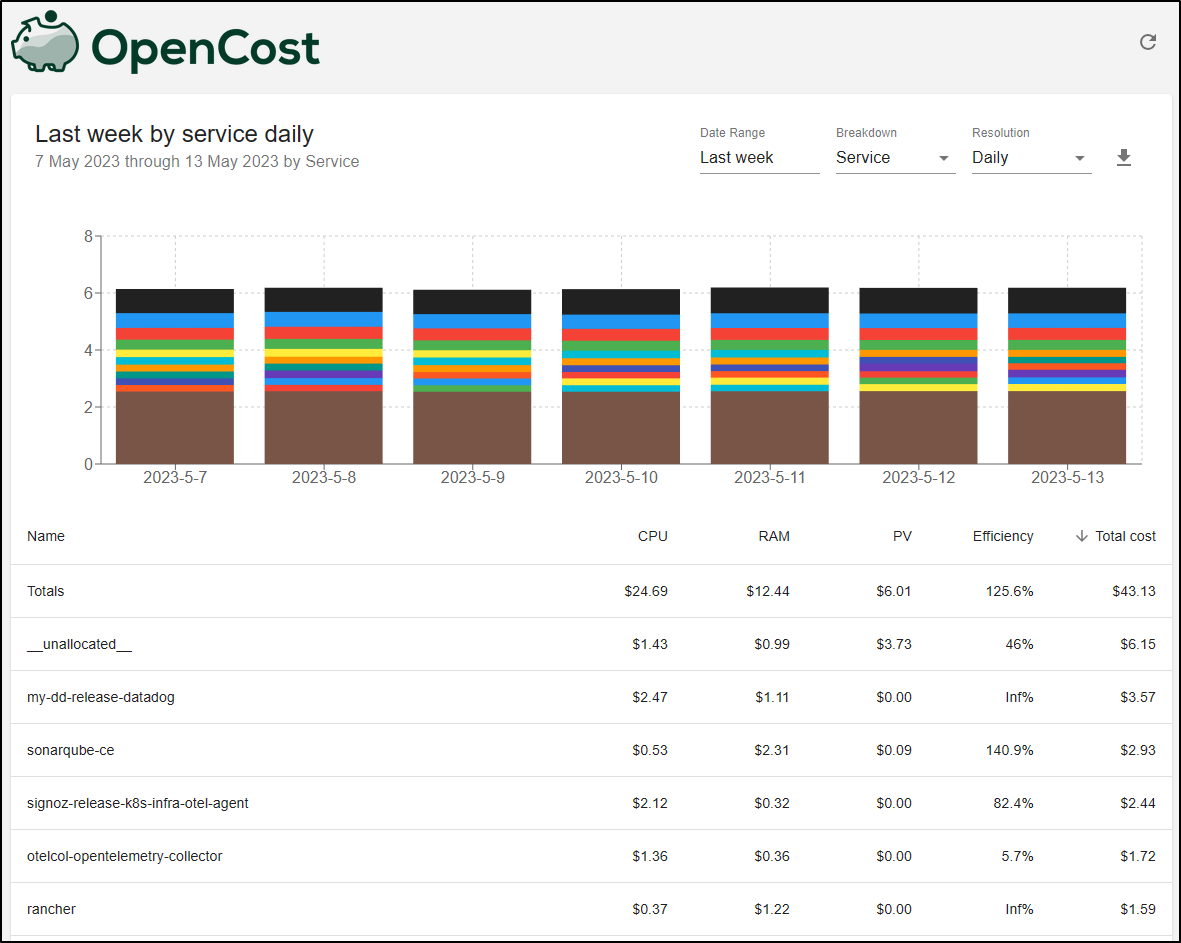
And could see multiple days
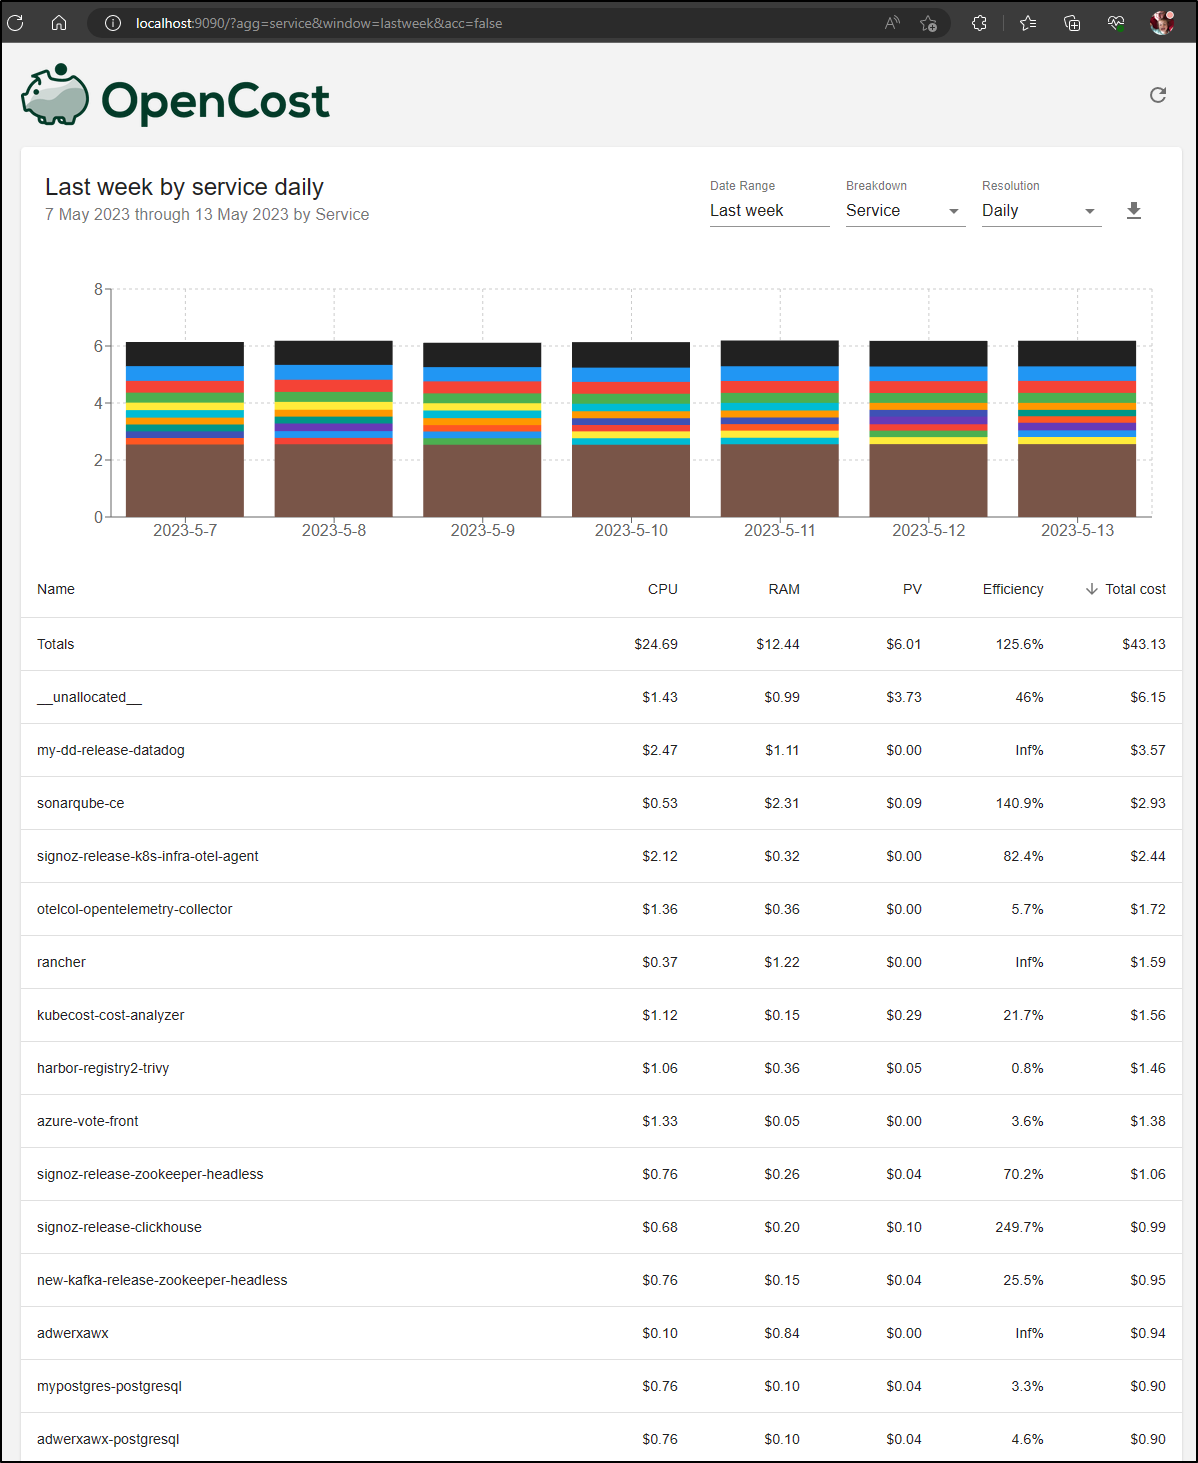
So on a weekly basis, if I looked at “Total Cost”, i could see the bigger workloads by service being Datadog and Sonarqube
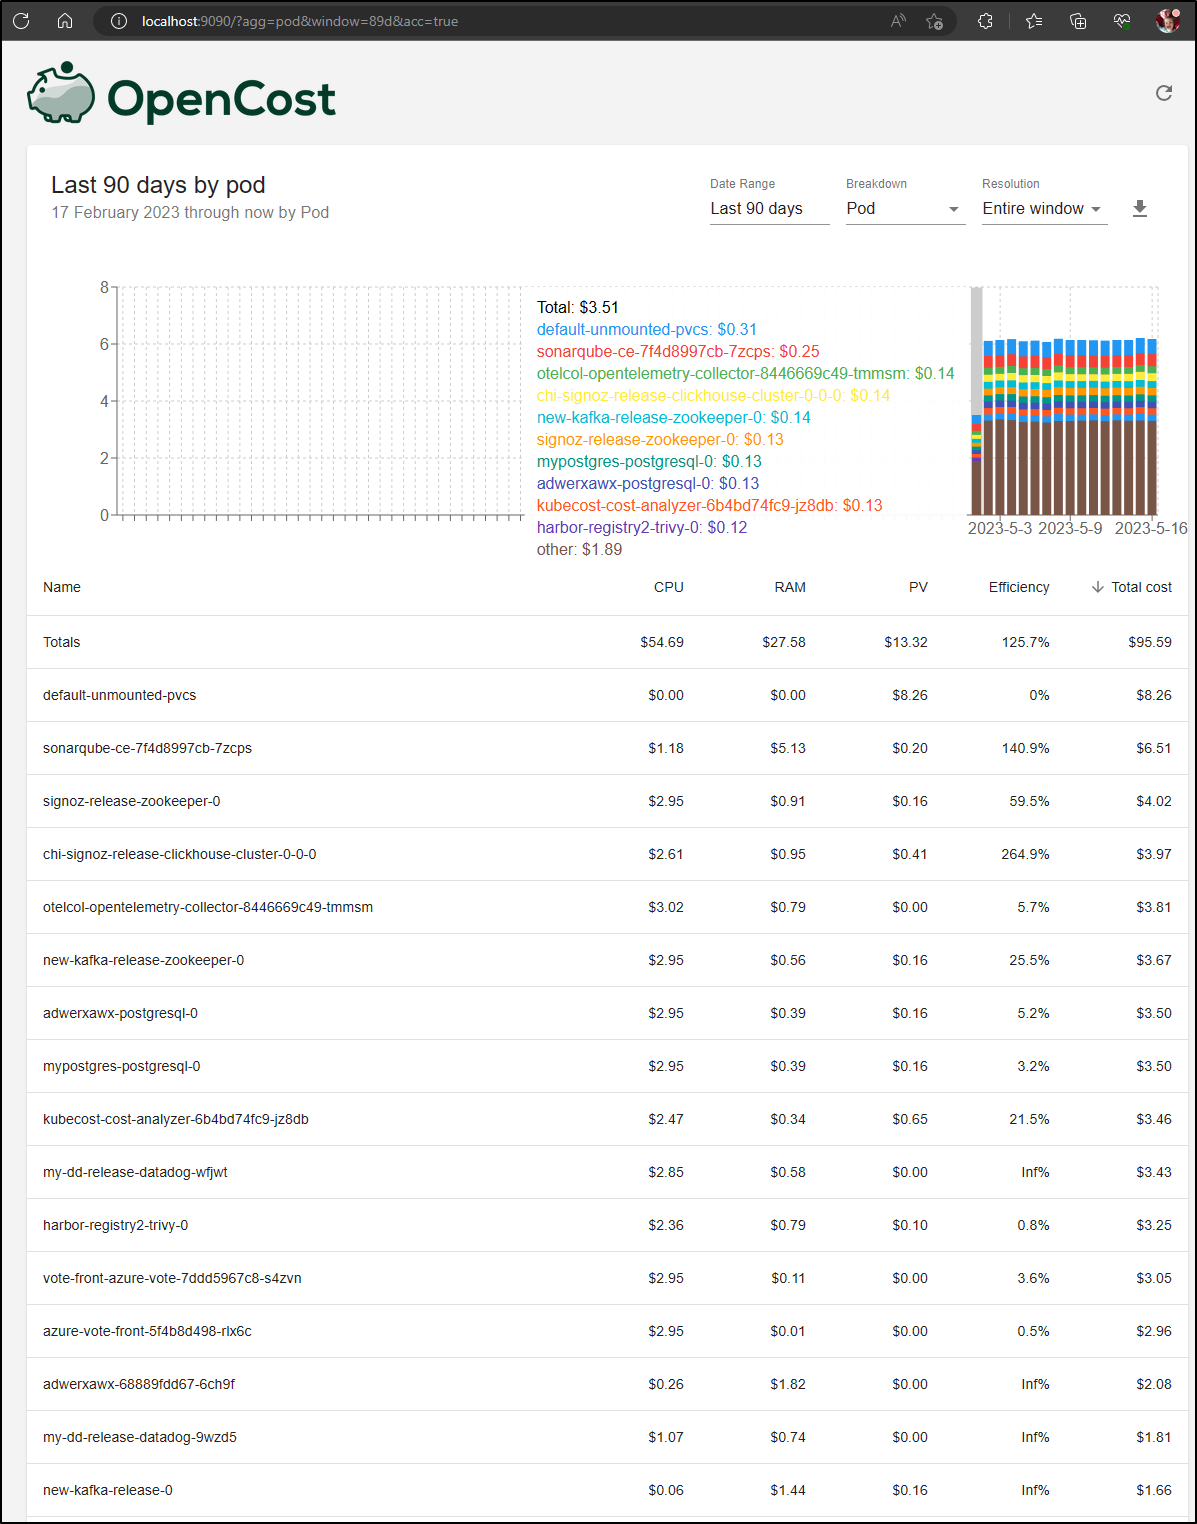
Let’s ask for a big report, the last 90 days by Pod.
This can only show as us far back as the Prometheus server was running (which was about 2 weeks)
If I dump that to Excel, I have the ability now to do some fun things like charts
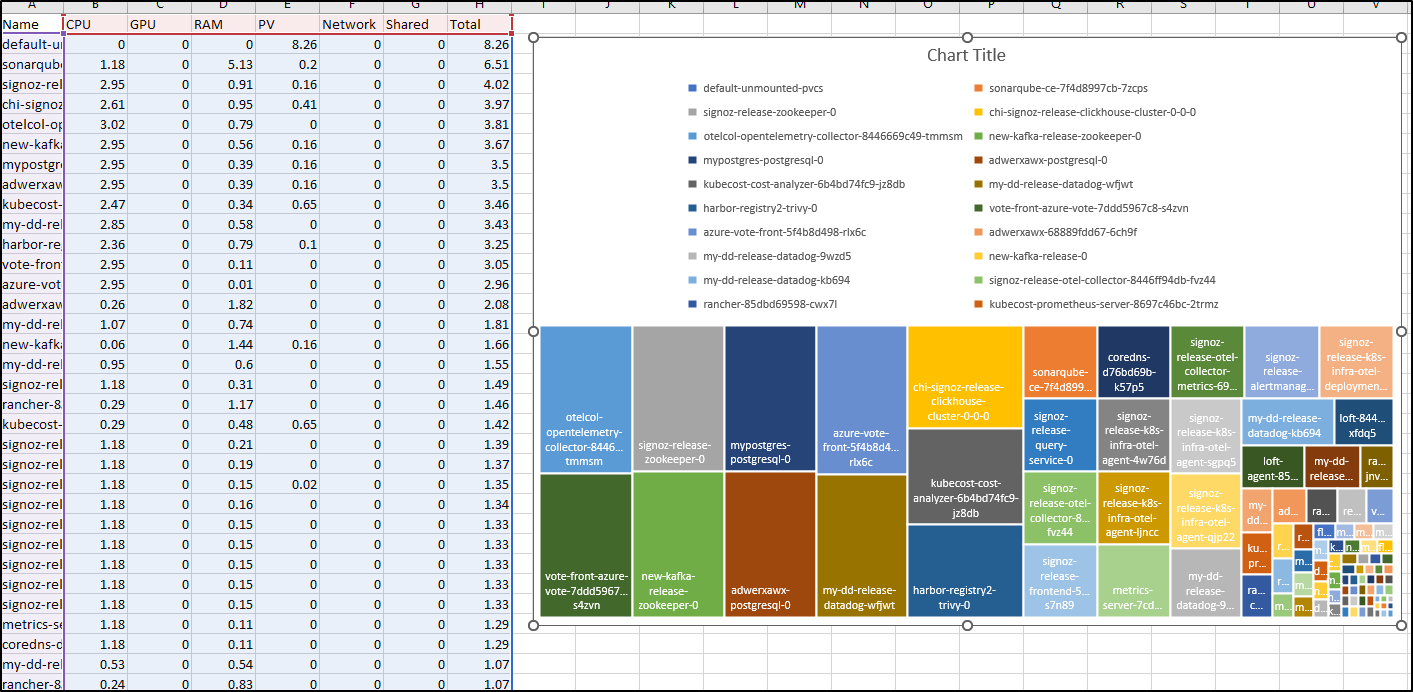
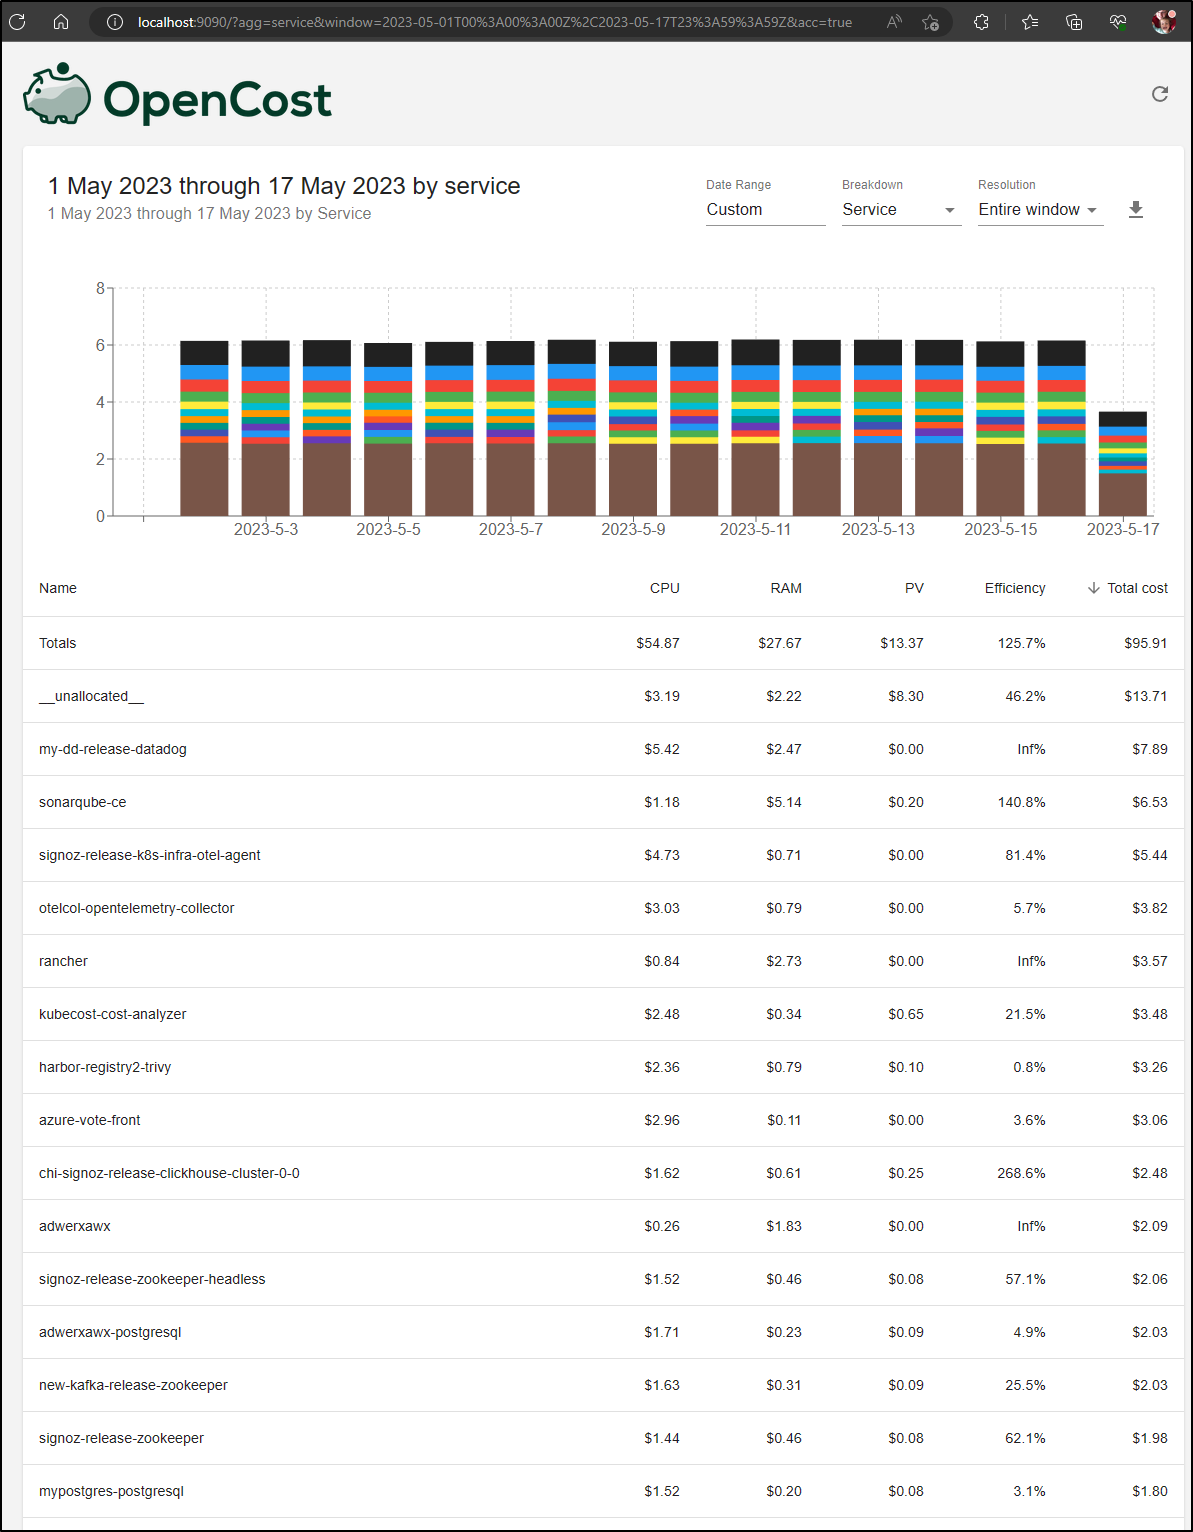
An example might be to create a 2 week report on service
which would let me create a chart on, say, CPU
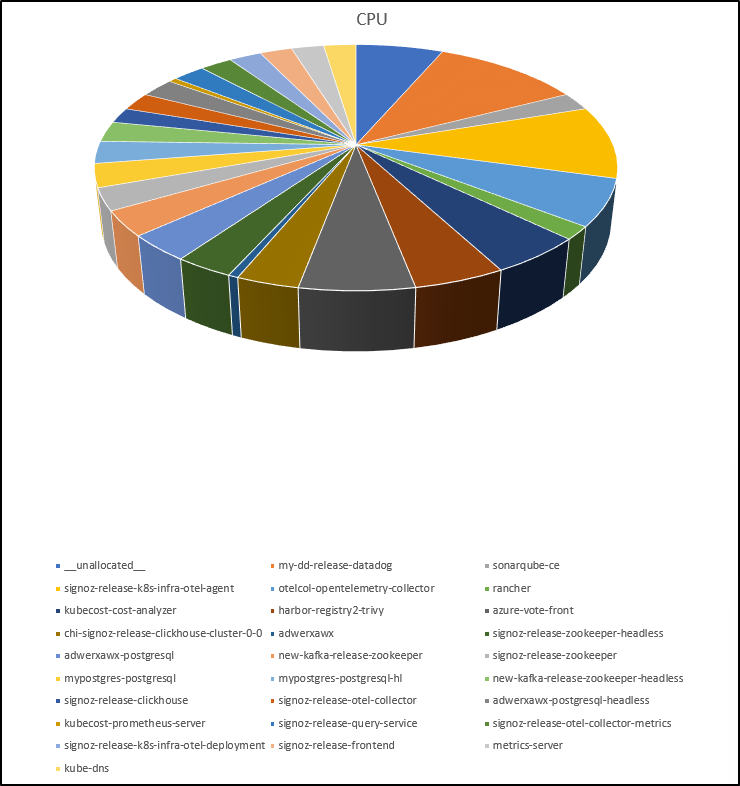
or total cost in a two week period
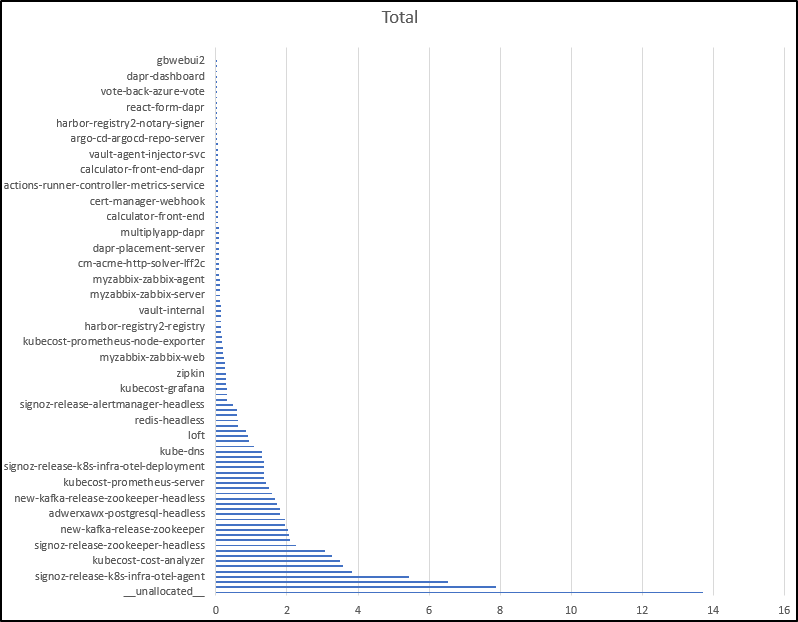
I was surprised to see when looking on that period that it was not my primary node doing most of the work, rather the derpy old EliteBook providing the most value
Helm
We can setup OpenCost with Helm as well.
Since I already launched with YAML, I’ll remove that instance
$ kubectl delete -n opencost -f  opencost.values.yaml
warning: deleting cluster-scoped resources, not scoped to the provided namespace
namespace "opencost" deleted
serviceaccount "opencost" deleted
clusterrole.rbac.authorization.k8s.io "opencost" deleted
clusterrolebinding.rbac.authorization.k8s.io "opencost" deleted
deployment.apps "opencost" deleted
service "opencost" deleted
Like before, I’ll have it use the Kubecost Prometheus metrics to save time
$ helm install opencost opencost/opencost  --set opencost.exporter.image.registry=gcr.io --set  opencost.exporter.image.repository=kubecost1/opencost --set opencost.exporter.image.tag=kc-eu-2023 --set opencost.prometheus.external.enabled=true --set opencost.prometheus.external.url=http://kubecost-prometheus-server.kubecost.svc --set opencost.prometheus.internal.enabled=false
E0517 09:12:38.429776     506 memcache.go:255] couldn't get resource list for external.metrics.k8s.io/v1beta1: Got empty response for: external.metrics.k8s.io/v1beta1
E0517 09:12:38.693345     506 memcache.go:255] couldn't get resource list for external.metrics.k8s.io/v1beta1: Got empty response for: external.metrics.k8s.io/v1beta1
E0517 09:12:38.761140     506 memcache.go:255] couldn't get resource list for external.metrics.k8s.io/v1beta1: Got empty response for: external.metrics.k8s.io/v1beta1
E0517 09:12:38.824133     506 memcache.go:255] couldn't get resource list for external.metrics.k8s.io/v1beta1: Got empty response for: external.metrics.k8s.io/v1beta1
E0517 09:12:38.916284     506 memcache.go:255] couldn't get resource list for external.metrics.k8s.io/v1beta1: Got empty response for: external.metrics.k8s.io/v1beta1
E0517 09:12:38.986901     506 memcache.go:255] couldn't get resource list for external.metrics.k8s.io/v1beta1: Got empty response for: external.metrics.k8s.io/v1beta1
NAME: opencost
LAST DEPLOYED: Wed May 17 09:12:38 2023
NAMESPACE: default
STATUS: deployed
REVISION: 1
TEST SUITE: None
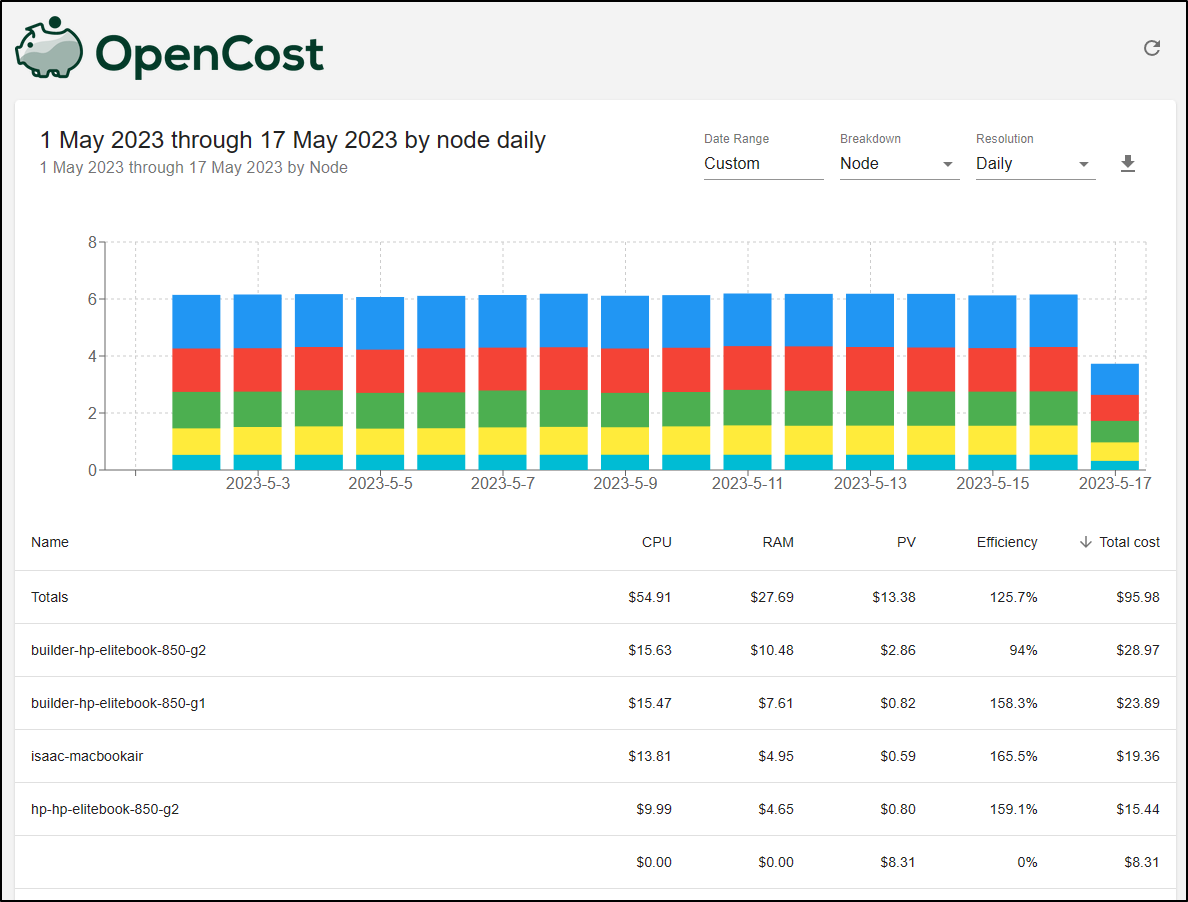
Now when I port-forward (this time in the default namespace)
$ kubectl port-forward service/opencost 9003 9090
Forwarding from 127.0.0.1:9003 -> 9003
Forwarding from [::1]:9003 -> 9003
Forwarding from 127.0.0.1:9090 -> 9090
Forwarding from [::1]:9090 -> 9090
Handling connection for 9090
Handling connection for 9090
I can see similar data
Comparing to older Kubecost
I went to checkout Kubecost, which was still supposidly running (for a year) but it seems to have gone AWOL
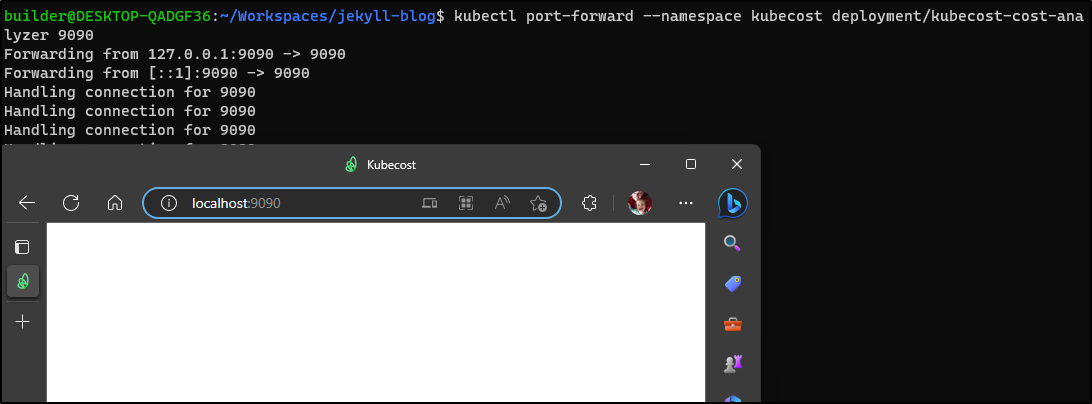
The body is just blank
<!doctype html><html lang="en"><head><meta charset="utf-8"/><link rel="icon" href="./favicon.ico"/><meta name="viewport" content="width=device-width,initial-scale=1"/><meta name="theme-color" content="#000000"/><meta name="description" content="Monitor and reduce Kubernetes spend"/><link rel="apple-touch-icon" href="./logo196.png"/><link rel="manifest" href="./manifest.json"/><script type="text/javascript" src="./jquery.min.3.6.0.js"></script><script type="text/javascript" src="./helper.js"></script><title>Kubecost</title><script defer="defer" src="./static/js/main.53a1d9a1.js"></script><link href="./static/css/main.61d98920.css" rel="stylesheet"></head><body><noscript>You need to enable JavaScript to run this app.</noscript><div id="root"></div><div id="portal-root"></div></body></html>
Summary
OpenCost is a very simple tool. There is no alerting, or automated reporting. It just shows calculations on usage from the cluster in a very easy to consume way. We can dump to a CSV if we want more nuanced data.