Published: Apr 25, 2023 by Isaac Johnson
At its core, SigNoz is an open-source application performance monitoring (APM) and observability tool. Built on open standards like Open Telemetry, Jaeger and Prometheus it makes it easy to collect logs, traces and metrics as well as other insights into the health, performance and behavior of one’s stack.
There is, of course, a commercial side to SigNoz which has a team plan starting at $200/mo and adds in SSO and SAML as well as “SigNoz Cloud” as a hosted PaS option.
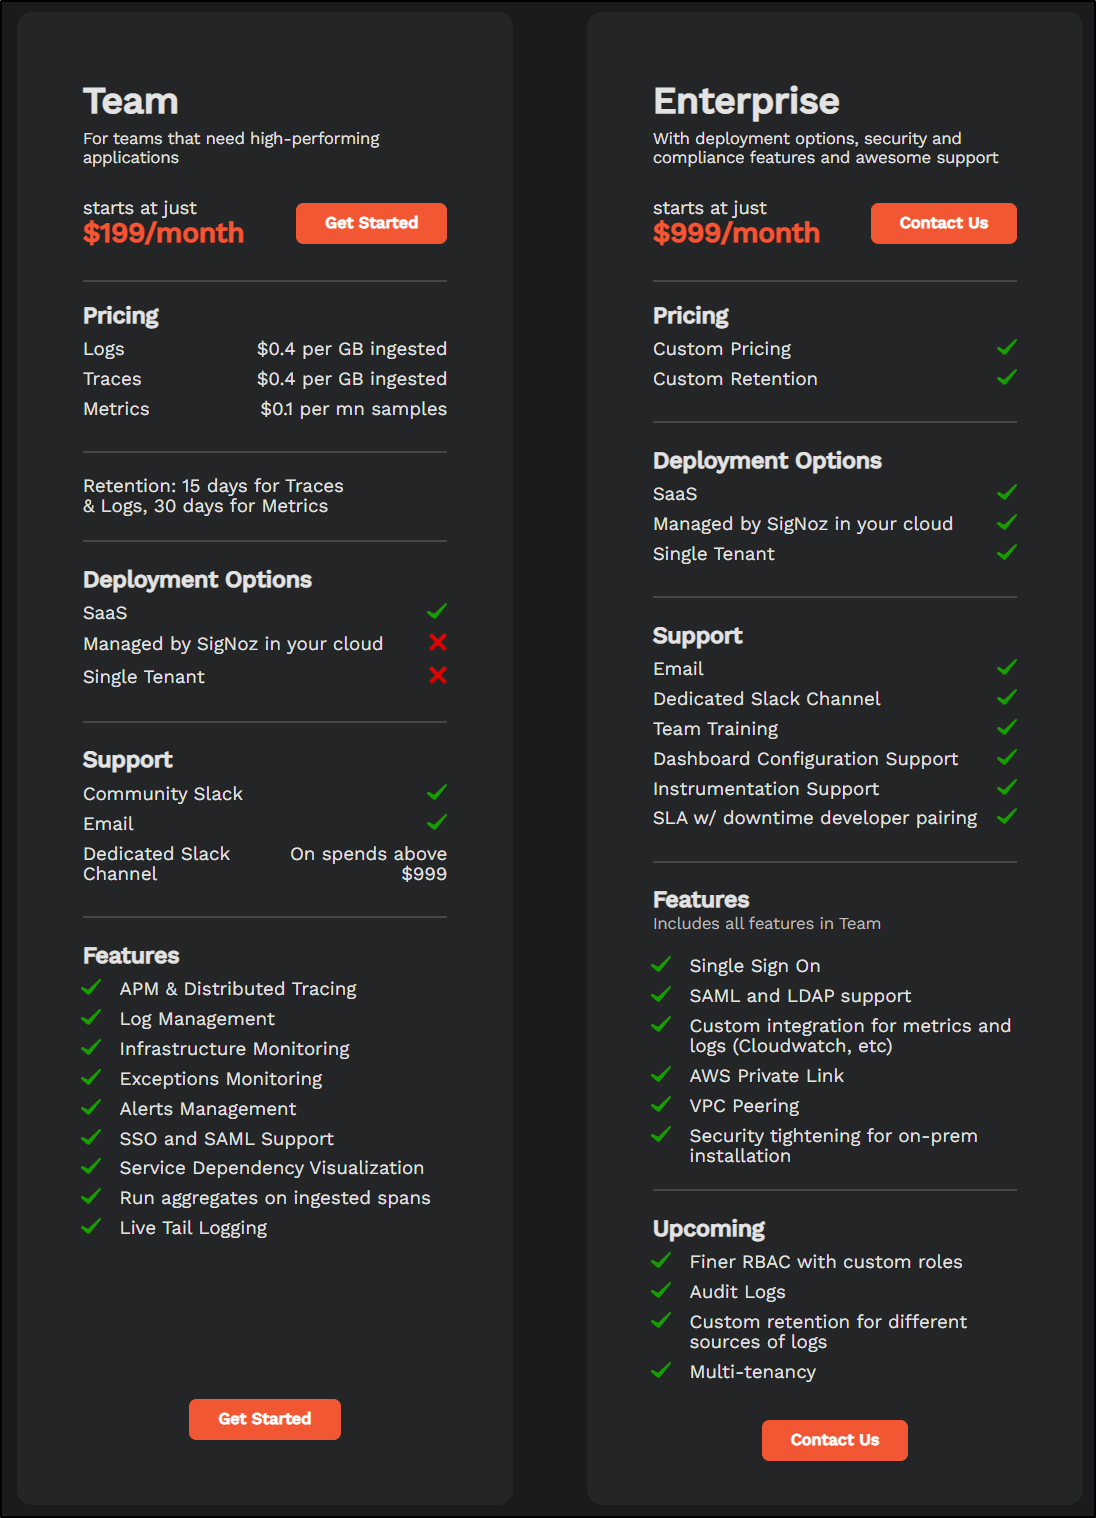
Pricing
There are two main paid plans - Team (US$200/mo) and Enterprise (US$1000/mo).
A quick breakdown
The pricing, for say logs, is comparable to other providers:
| Vendor | Free per mo | price per Gb beyond | addtional costs | retention |
|---|---|---|---|---|
| SigNoz | 0 | $0.40 | - | 15-day |
| Datadog | 0 | $0.10 | $1.70/million log events/mo | 15-day |
| New Relic | 100Gb | $0.30 | $0.50/gb for advanced features - 90d | 30-days |
| Mezmo (LogDNA) | 0 | $1.30 | $0.80/3-day to $1.80/30-day retention | 3 to 30 (14d shown) |
| Sumo Logic | 0 | $3.00 | free tier at 1Gb/day | you set retention 7d to 365d (pay per Gb) |
| GCP Stackdriver (Logm Monitor, Operations Suite) | 50Gb | $0.50 | 1 mill monitored instances free, then $0.05c/instance beyond | traces and logs combined |
| Azure Logging | 5Gb/day | $0.50 - $0.615 - basic | types of logs vary: 0.50 pay as you go basic, $2.30gb for analytics logs, $0.005/gb for search queries | 30d |
As we will be looking into the self-hosted option, the only costs will be my local infrastructure.
Setup
We’ll follow the guide for ‘other’ kubernetes. AWS and GCP have other guides.
We’ll set a var to our Default Storage class
$ DEFAULT_STORAGE_CLASS=$(kubectl get storageclass -o=jsonpath='{.items[?(@.metadata.annotations.storageclass\.kubernetes\.io/is-default-class=="true")].metadata.name}')
$ echo $DEFAULT_STORAGE_CLASS
local-path
Now we will patch it to allow Volume Expansion
$ kubectl patch storageclass "$DEFAULT_STORAGE_CLASS" -p '{"allowVolumeExpansion": true}'
storageclass.storage.k8s.io/local-path patched
Now let’s add the SigNoz repo and update
$ helm repo add signoz https://charts.signoz.io
"signoz" has been added to your repositories

$ helm repo update
Hang tight while we grab the latest from your chart repositories...
...Successfully got an update from the "signoz" chart repository
...Successfully got an update from the "freshbrewed" chart repository
...Successfully got an update from the "myharbor" chart repository
...Successfully got an update from the "confluentinc" chart repository
...Successfully got an update from the "dapr" chart repository
...Successfully got an update from the "jfelten" chart repository
...Successfully got an update from the "ngrok" chart repository
...Successfully got an update from the "zabbix-community" chart repository
...Successfully got an update from the "adwerx" chart repository
...Successfully got an update from the "actions-runner-controller" chart repository
...Successfully got an update from the "novum-rgi-helm" chart repository
...Successfully got an update from the "kube-state-metrics" chart repository
...Successfully got an update from the "rhcharts" chart repository
...Successfully got an update from the "uptime-kuma" chart repository
...Successfully got an update from the "sumologic" chart repository
...Successfully got an update from the "hashicorp" chart repository
...Successfully got an update from the "castai-helm" chart repository
...Successfully got an update from the "azure-samples" chart repository
...Successfully got an update from the "rook-release" chart repository
...Successfully got an update from the "kuma" chart repository
...Successfully got an update from the "longhorn" chart repository
...Successfully got an update from the "epsagon" chart repository
...Successfully got an update from the "nginx-stable" chart repository
...Successfully got an update from the "lifen-charts" chart repository
...Successfully got an update from the "kubecost" chart repository
...Successfully got an update from the "sonarqube" chart repository
...Successfully got an update from the "elastic" chart repository
...Successfully got an update from the "open-telemetry" chart repository
...Successfully got an update from the "harbor" chart repository
...Successfully got an update from the "datadog" chart repository
...Successfully got an update from the "argo-cd" chart repository
...Successfully got an update from the "grafana" chart repository
...Successfully got an update from the "crossplane-stable" chart repository
...Successfully got an update from the "newrelic" chart repository
...Successfully got an update from the "incubator" chart repository
...Successfully got an update from the "gitlab" chart repository
...Successfully got an update from the "prometheus-community" chart repository
...Successfully got an update from the "rancher-latest" chart repository
...Successfully got an update from the "bitnami" chart repository
Update Complete. ⎈Happy Helming!⎈
We can now install it into a new “Platform” namespace
$ helm --namespace platform install my-release signoz/signoz --create-namespace
coalesce.go:175: warning: skipped value for zookeeper.initContainers: Not a table.
NAME: my-release
LAST DEPLOYED: Sun Apr 23 11:29:57 2023
NAMESPACE: platform
STATUS: deployed
REVISION: 1
NOTES:
1. You have just deployed SigNoz cluster:

- frontend version: '0.18.2'
- query-service version: '0.18.2'
- alertmanager version: '0.23.0-0.2'
- otel-collector version: '0.66.7'
- otel-collector-metrics version: '0.66.7'

2. Get the application URL by running these commands:

  export POD_NAME=$(kubectl get pods --namespace platform -l "app.kubernetes.io/name=signoz,app.kubernetes.io/instance=my-release,app.kubernetes.io/component=frontend" -o jsonpath="{.items[0].metadata.name}")
  echo "Visit http://127.0.0.1:3301 to use your application"
  kubectl --namespace platform port-forward $POD_NAME 3301:3301


If you have any ideas, questions, or any feedback, please share on our Github Discussions:
  https://github.com/SigNoz/signoz/discussions/713
It takes a few minutes to spin up
$ kubectl get pods -n platform
NAME                                                        READY   STATUS     RESTARTS   AGE
my-release-signoz-frontend-85d47bcc96-xctlr                 0/1     Init:0/1   0          2m6s
my-release-signoz-query-service-0                           0/1     Init:0/1   0          2m6s
my-release-signoz-otel-collector-metrics-5f57c54f9f-z25kj   0/1     Init:0/1   0          2m6s
my-release-signoz-otel-collector-565477699c-2b5zj           0/1     Init:0/1   0          2m6s
my-release-signoz-alertmanager-0                            0/1     Init:0/1   0          2m6s
my-release-k8s-infra-otel-agent-b9p6b                       1/1     Running    0          2m6s
my-release-k8s-infra-otel-deployment-7ffd8dfbfb-kfrg4       1/1     Running    0          2m6s
my-release-k8s-infra-otel-agent-959f9                       1/1     Running    0          2m6s
my-release-k8s-infra-otel-agent-j45tp                       1/1     Running    0          2m6s
my-release-clickhouse-operator-5c5c5ddcf7-hs8ch             2/2     Running    0          2m6s
my-release-zookeeper-0                                      1/1     Running    0          2m6s
chi-my-release-clickhouse-cluster-0-0-0                     1/1     Running    0          66s
I was surprised to see it was based on busybox. Seems a strange choice for a platform base
$ kubectl describe pod my-release-signoz-frontend-85d47bcc96-xctlr -nplatform | tail -n7
  Type    Reason     Age    From               Message
  ----    ------     ----   ----               -------
  Normal  Scheduled  2m57s  default-scheduler  Successfully assigned platform/my-release-signoz-frontend-85d47bcc96-xctlr to anna-macbookair
  Normal  Pulling    2m57s  kubelet            Pulling image "docker.io/busybox:1.35"
  Normal  Pulled     2m49s  kubelet            Successfully pulled image "docker.io/busybox:1.35" in 7.526860406s
  Normal  Created    2m49s  kubelet            Created container my-release-signoz-frontend-init
  Normal  Started    2m49s  kubelet            Started container my-release-signoz-frontend-init
We can see it coming up
$ kubectl get pods -n platform
NAME                                                        READY   STATUS     RESTARTS   AGE
my-release-signoz-frontend-85d47bcc96-xctlr                 0/1     Init:0/1   0          4m22s
my-release-signoz-alertmanager-0                            0/1     Init:0/1   0          4m22s
my-release-k8s-infra-otel-agent-b9p6b                       1/1     Running    0          4m22s
my-release-k8s-infra-otel-deployment-7ffd8dfbfb-kfrg4       1/1     Running    0          4m22s
my-release-k8s-infra-otel-agent-959f9                       1/1     Running    0          4m22s
my-release-k8s-infra-otel-agent-j45tp                       1/1     Running    0          4m22s
my-release-clickhouse-operator-5c5c5ddcf7-hs8ch             2/2     Running    0          4m22s
my-release-zookeeper-0                                      1/1     Running    0          4m22s
chi-my-release-clickhouse-cluster-0-0-0                     1/1     Running    0          3m22s
my-release-signoz-query-service-0                           1/1     Running    0          4m22s
my-release-signoz-otel-collector-metrics-5f57c54f9f-z25kj   1/1     Running    0          4m22s
my-release-signoz-otel-collector-565477699c-2b5zj           1/1     Running    0          4m22s

$ kubectl get pods -n platform
NAME                                                        READY   STATUS    RESTARTS   AGE
my-release-k8s-infra-otel-agent-b9p6b                       1/1     Running   0          8m20s
my-release-k8s-infra-otel-deployment-7ffd8dfbfb-kfrg4       1/1     Running   0          8m20s
my-release-k8s-infra-otel-agent-959f9                       1/1     Running   0          8m20s
my-release-k8s-infra-otel-agent-j45tp                       1/1     Running   0          8m20s
my-release-clickhouse-operator-5c5c5ddcf7-hs8ch             2/2     Running   0          8m20s
my-release-zookeeper-0                                      1/1     Running   0          8m20s
chi-my-release-clickhouse-cluster-0-0-0                     1/1     Running   0          7m20s
my-release-signoz-query-service-0                           1/1     Running   0          8m20s
my-release-signoz-otel-collector-metrics-5f57c54f9f-z25kj   1/1     Running   0          8m20s
my-release-signoz-otel-collector-565477699c-2b5zj           1/1     Running   0          8m20s
my-release-signoz-frontend-85d47bcc96-xctlr                 1/1     Running   0          8m20s
my-release-signoz-alertmanager-0                            1/1     Running   0          8m20s
We can now port-forward to our SIgNoz instance
$ kubectl --namespace platform port-forward svc/`kubectl get svc --namespace platform -l "app.kubernetes.io/component=frontend" -o jsonpath="{.items[0].metadata.name}"` 3301:3301
Forwarding from 127.0.0.1:3301 -> 3301
Forwarding from [::1]:3301 -> 3301
Handling connection for 3301
Handling connection for 3301
Handling connection for 3301
Handling connection for 3301
...
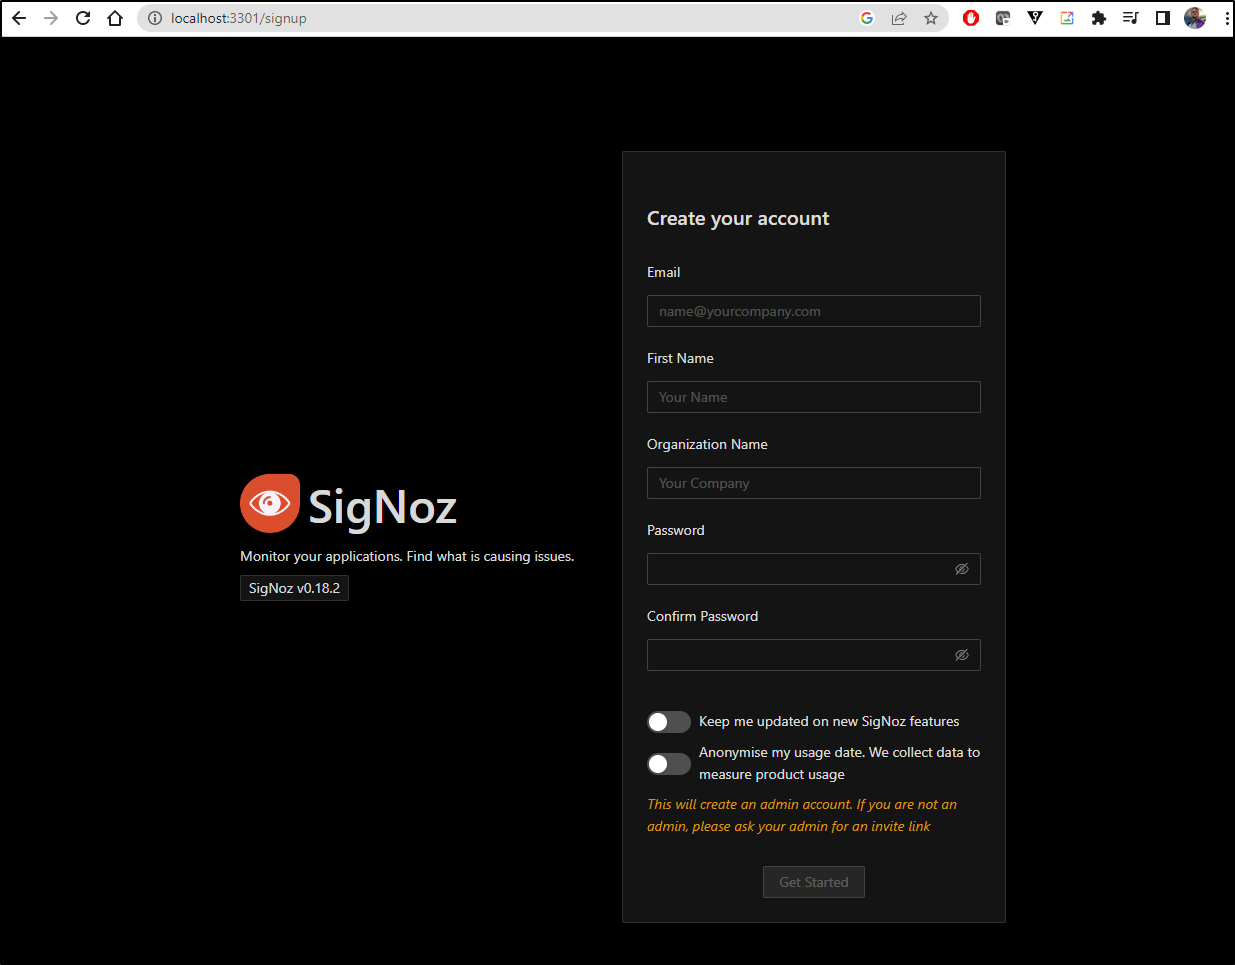
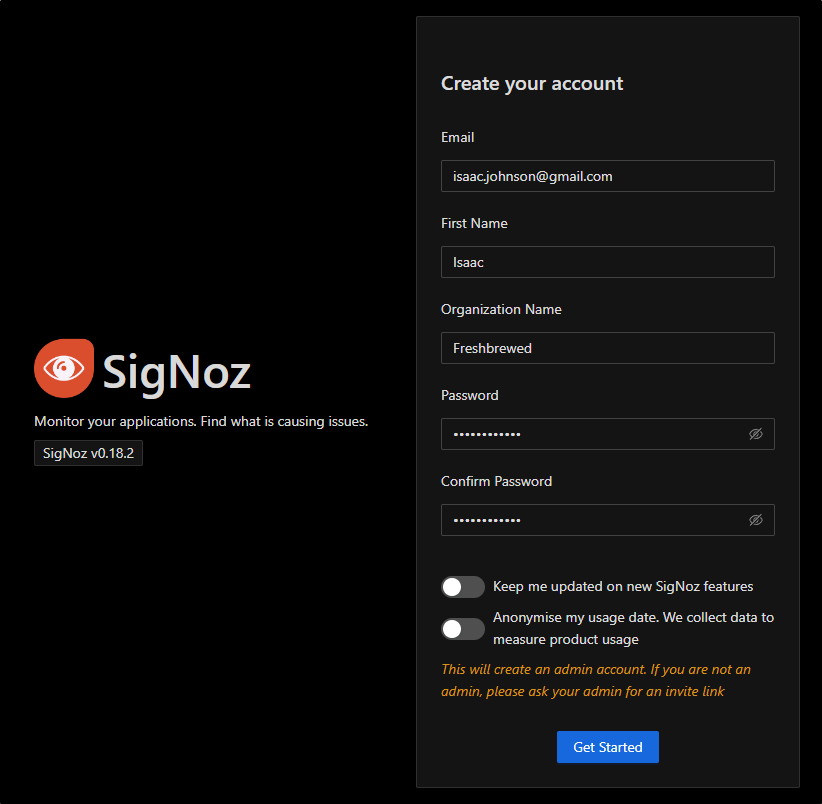
I’ll put in some details
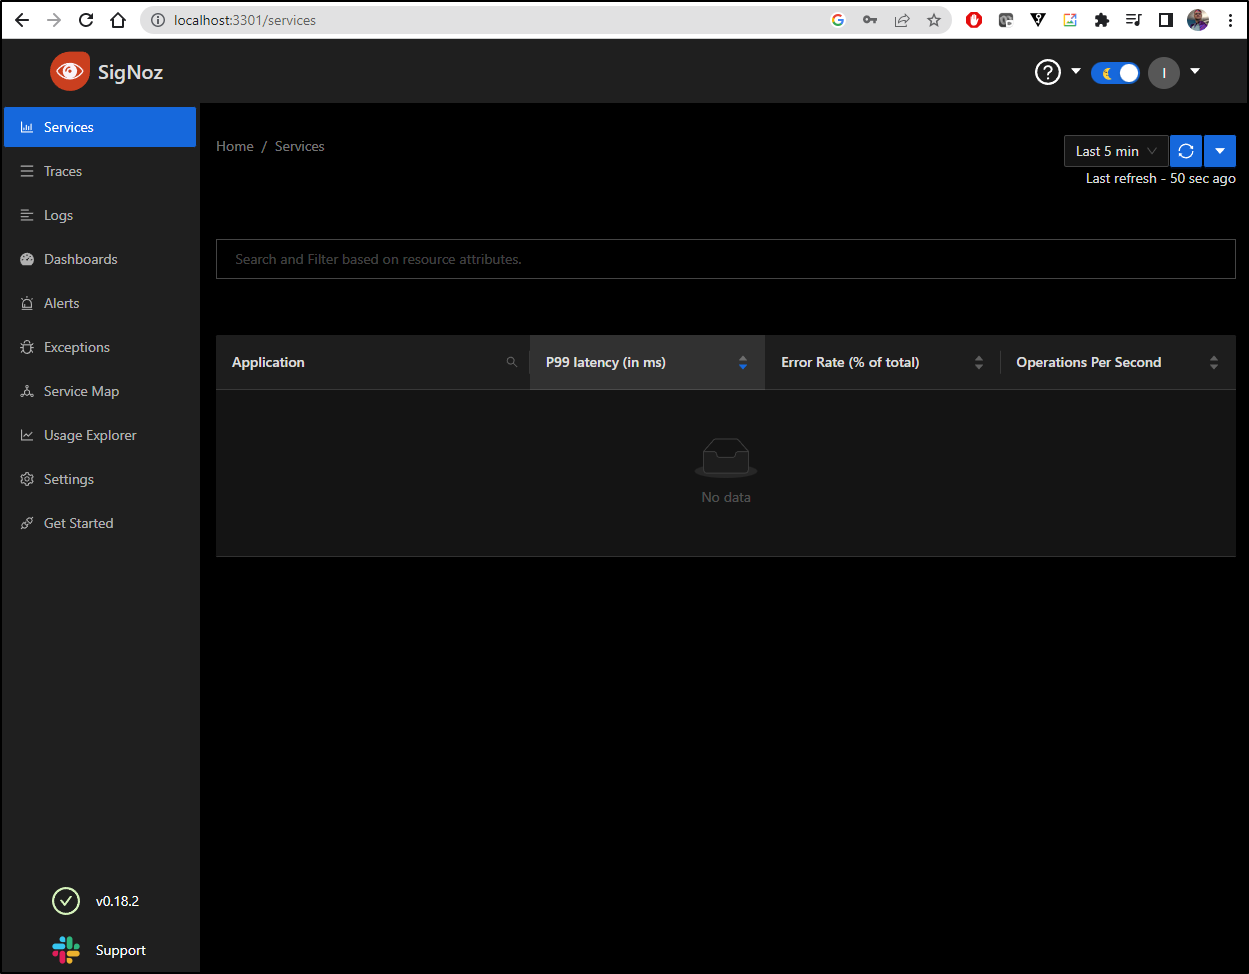
We can now see the dashboard
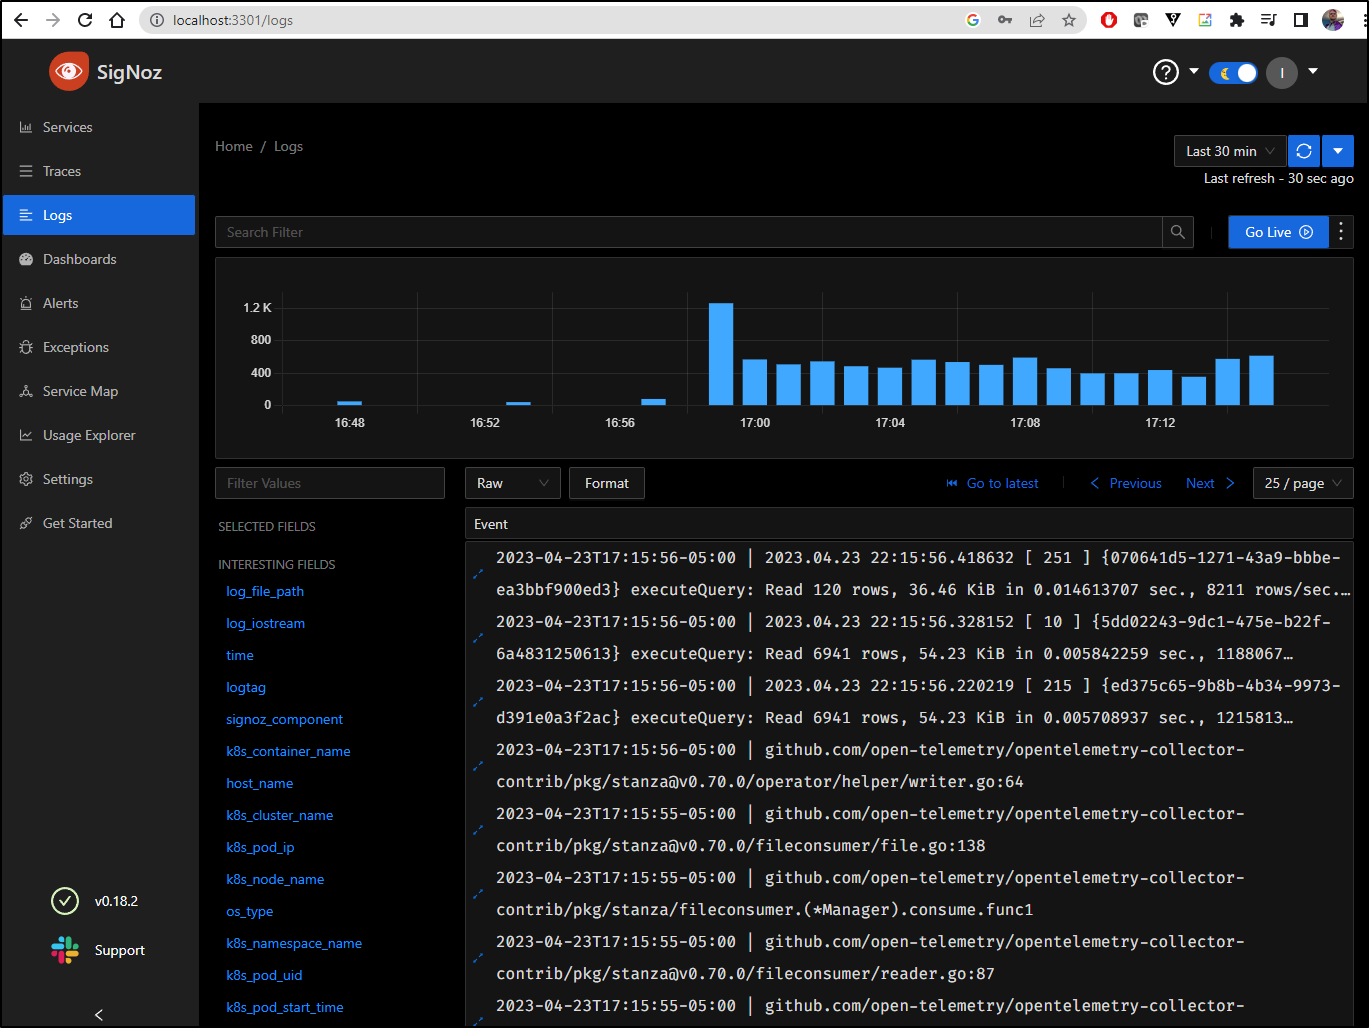
Logs
Right off, we can see logs collected
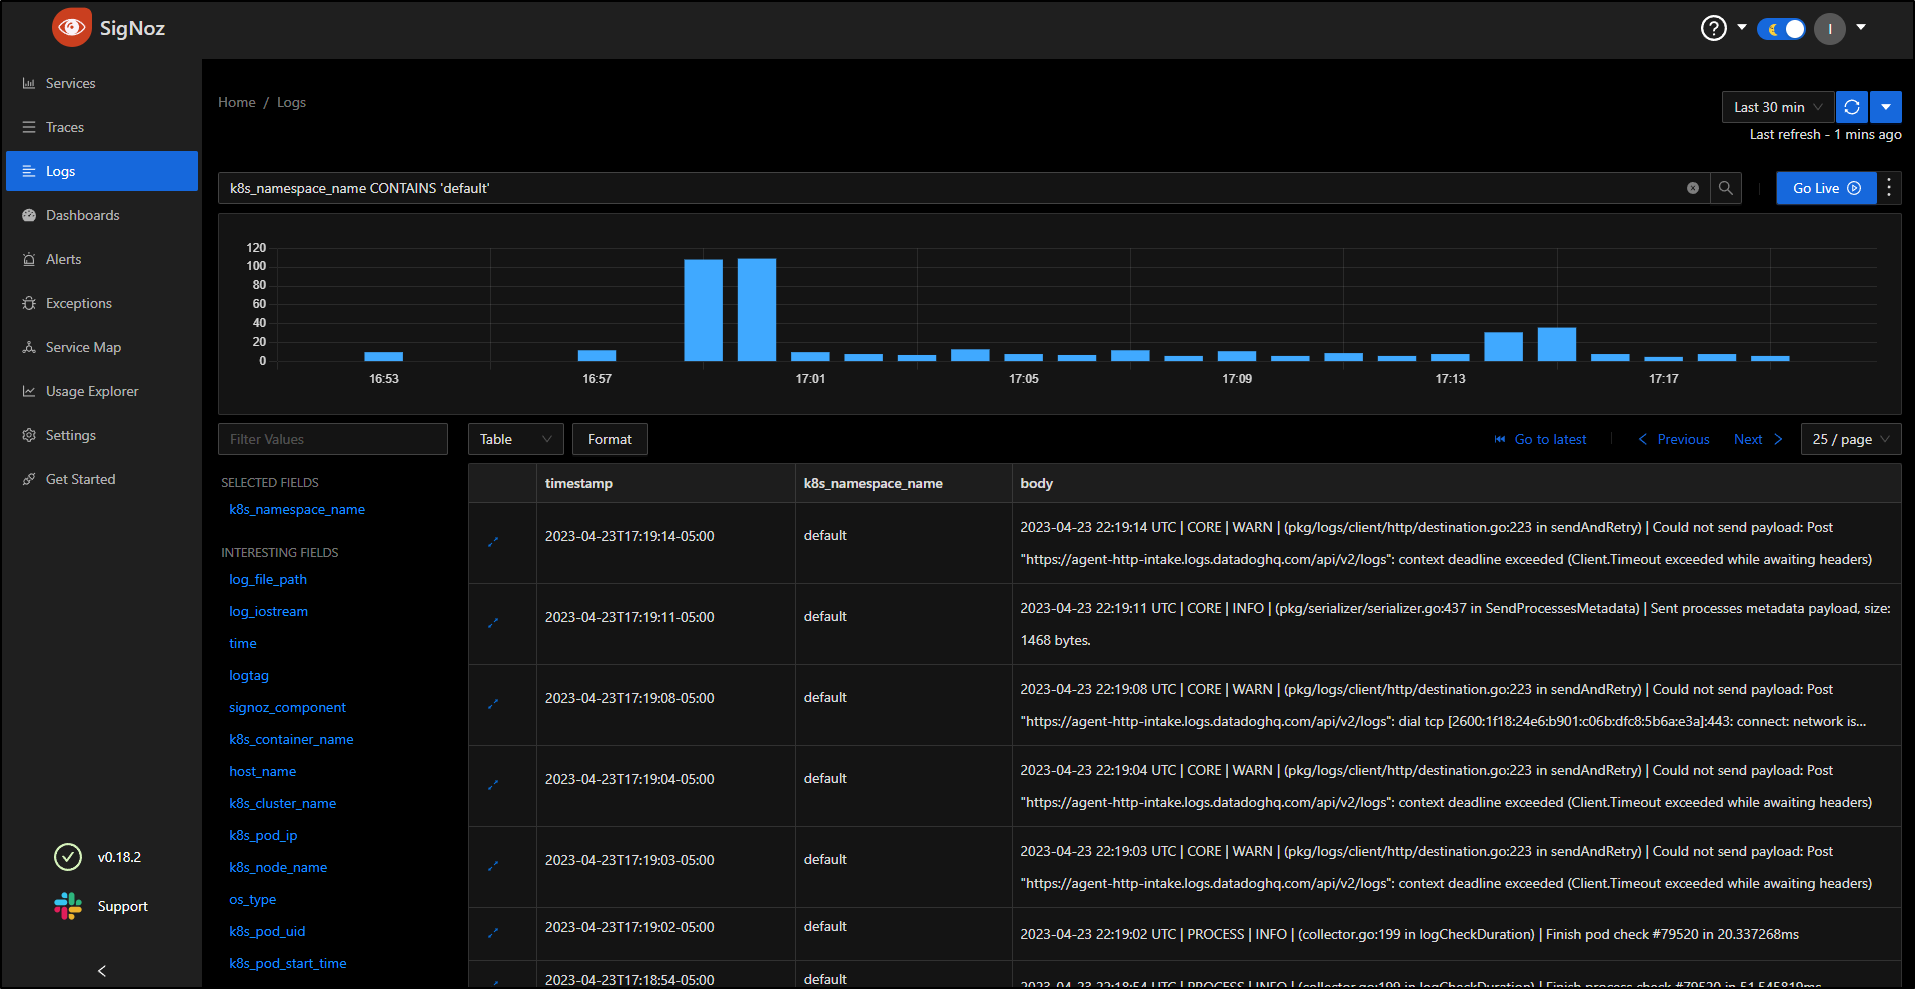
I can use filters. For instance, we can filter to just a namespace k8s_namespace_name CONTAINS 'default'
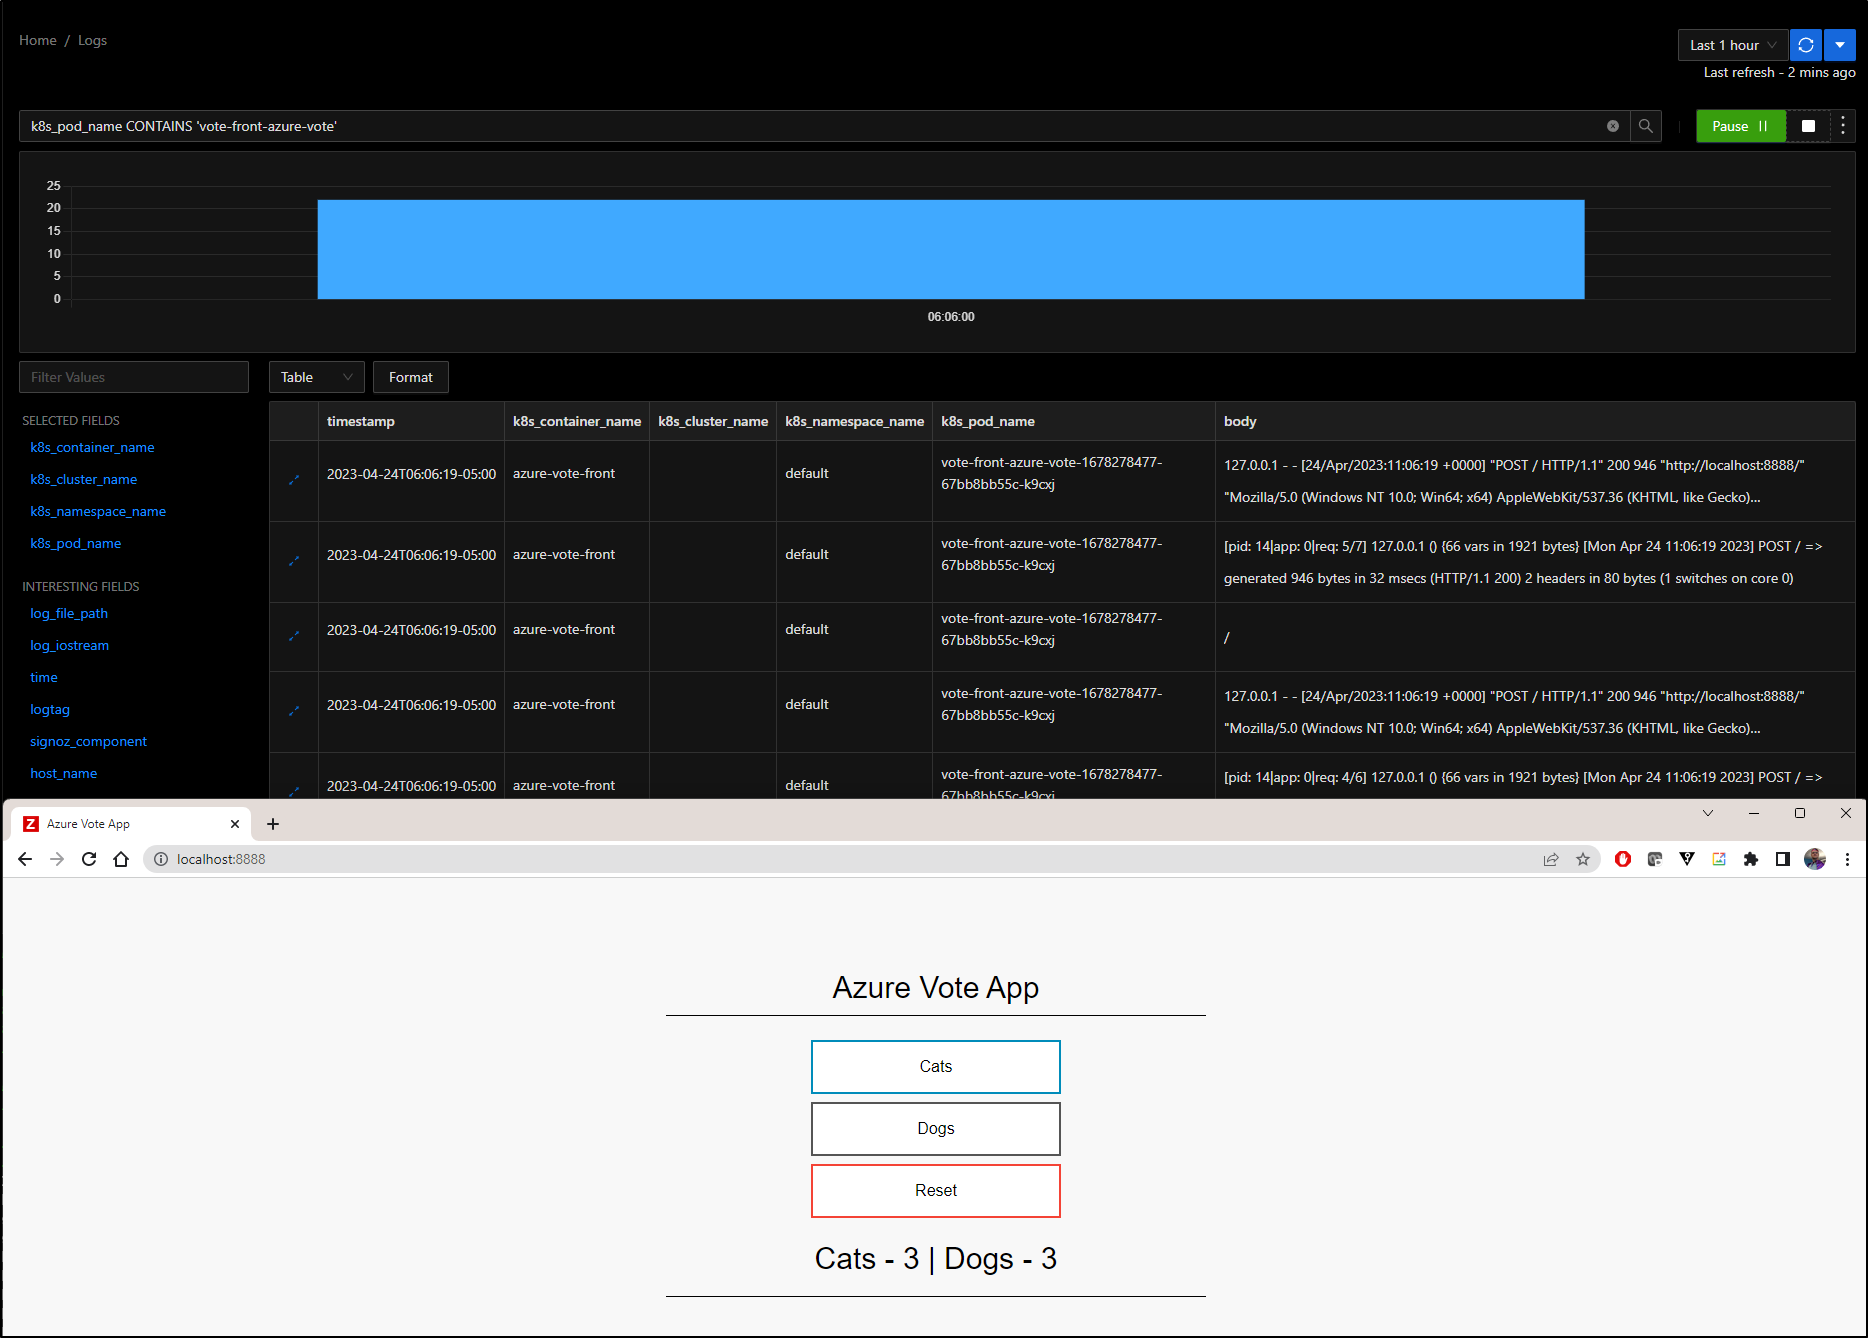
Live Logs
Let’s say I wanted to monitor just one pod, such as the vote front end
$ kubectl get pods | grep vote
vote-back-azure-vote-1678278477-7dc4cf9668-gfxvw       1/1     Running   0             23d
vote-front-azure-vote-1678278477-67bb8bb55c-k9cxj      1/1     Running   0             14d
I can port-forward to the Vote App and click some choices
$ kubectl port-forward vote-front-azure-vote-1678278477-67bb8bb55c-k9cxj 8888:80
Forwarding from 127.0.0.1:8888 -> 80
Forwarding from [::1]:8888 -> 80
Handling connection for 8888
Handling connection for 8888
Handling connection for 8888
And see that reflected in Live Logs
Log based alerts
Before we can get an alert created, we need to pause and create an alert channel.
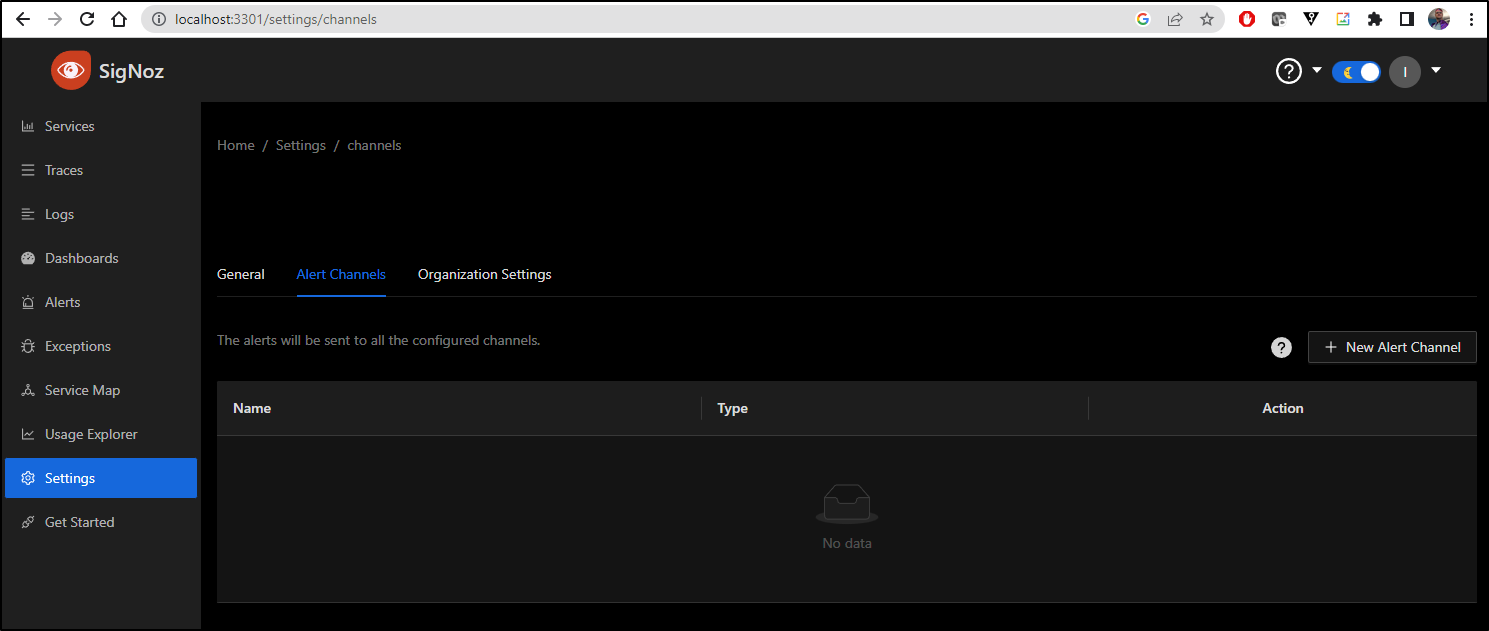
Alert Channels
In settings, choose “Alert Channels” and select “+ New Alert Channel”
I’ll add a slack channel (our choices being Slack, Webhook and Pagerduty)
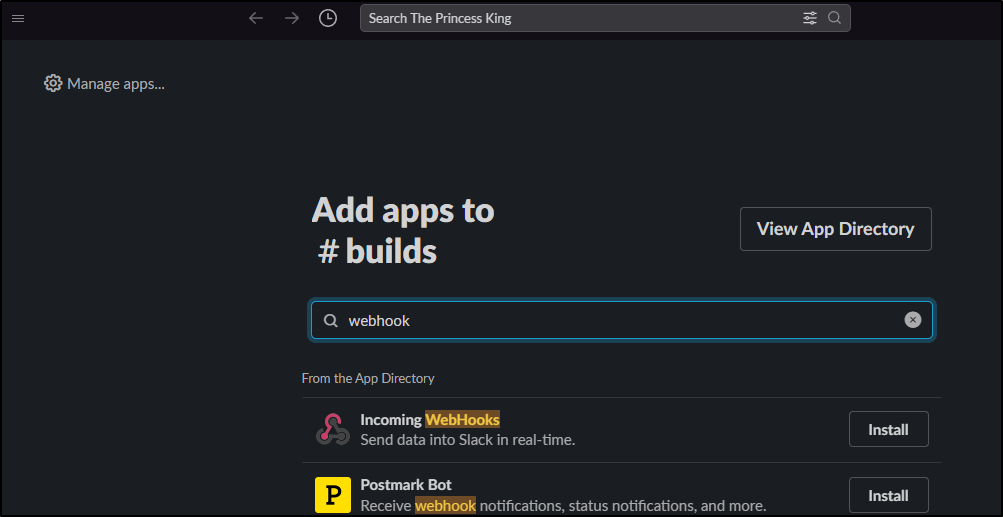
On a slack channel, view Integrations then add Integration. Here we can search for “Incoming Webhook” (Careful, there is an “Outgoing” as well and there is now a limit on free accounts of total integrations)
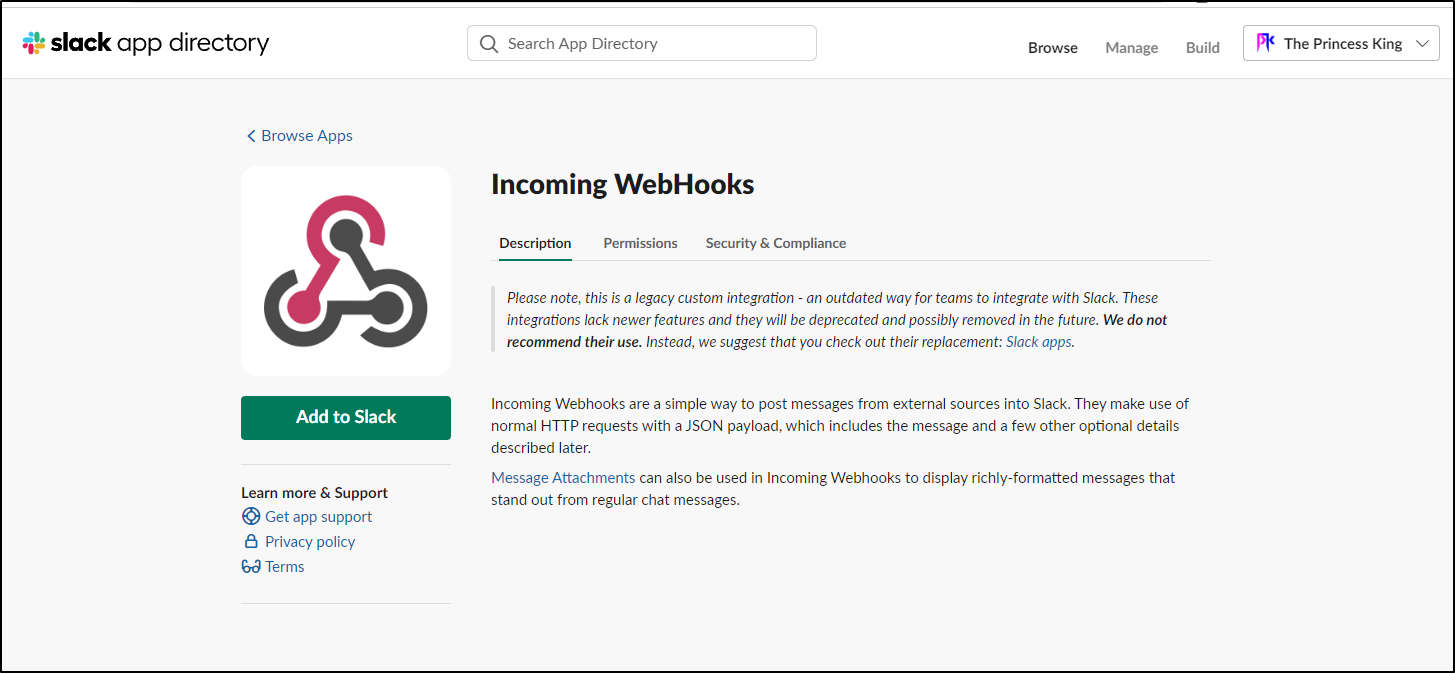
We then click “Add to Slack”
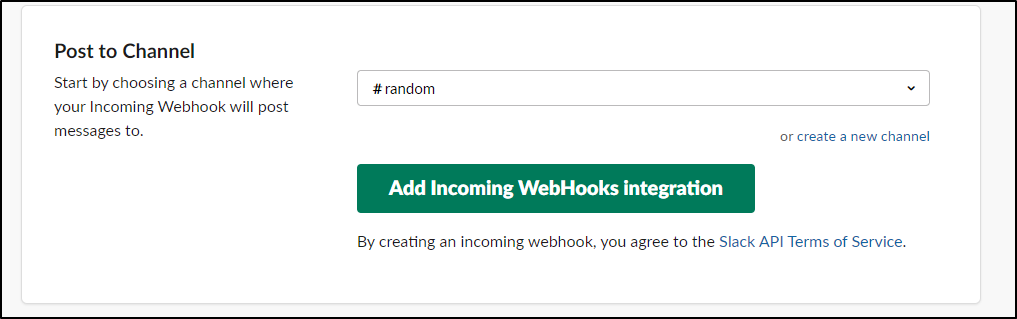
My main Slack was over the limit, so i used a rarely touched slack instance that had “room”
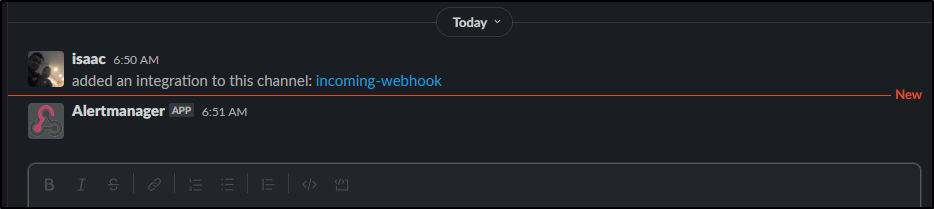
After I clicked “Add Incoming WebHooks Integration”
I saw both a note in that “#Random” channel and was presented with a page that had a URL
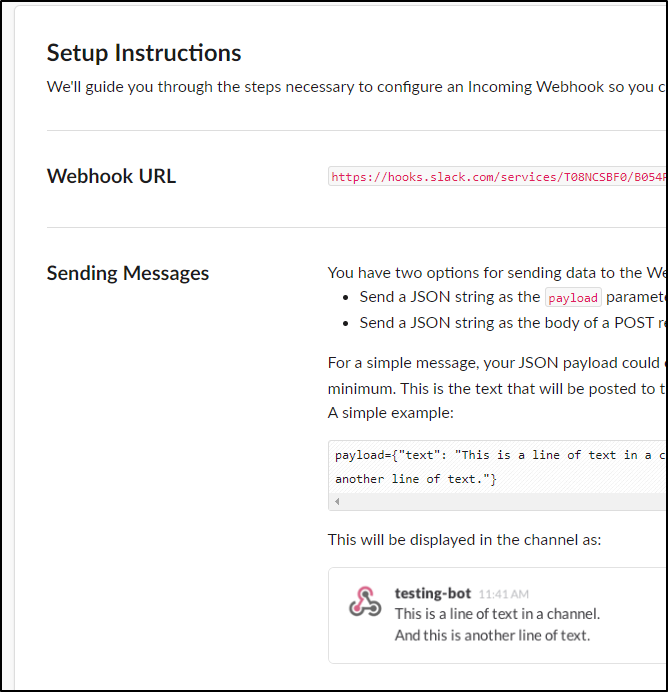
I then used that in the SigNoz page and clicked test
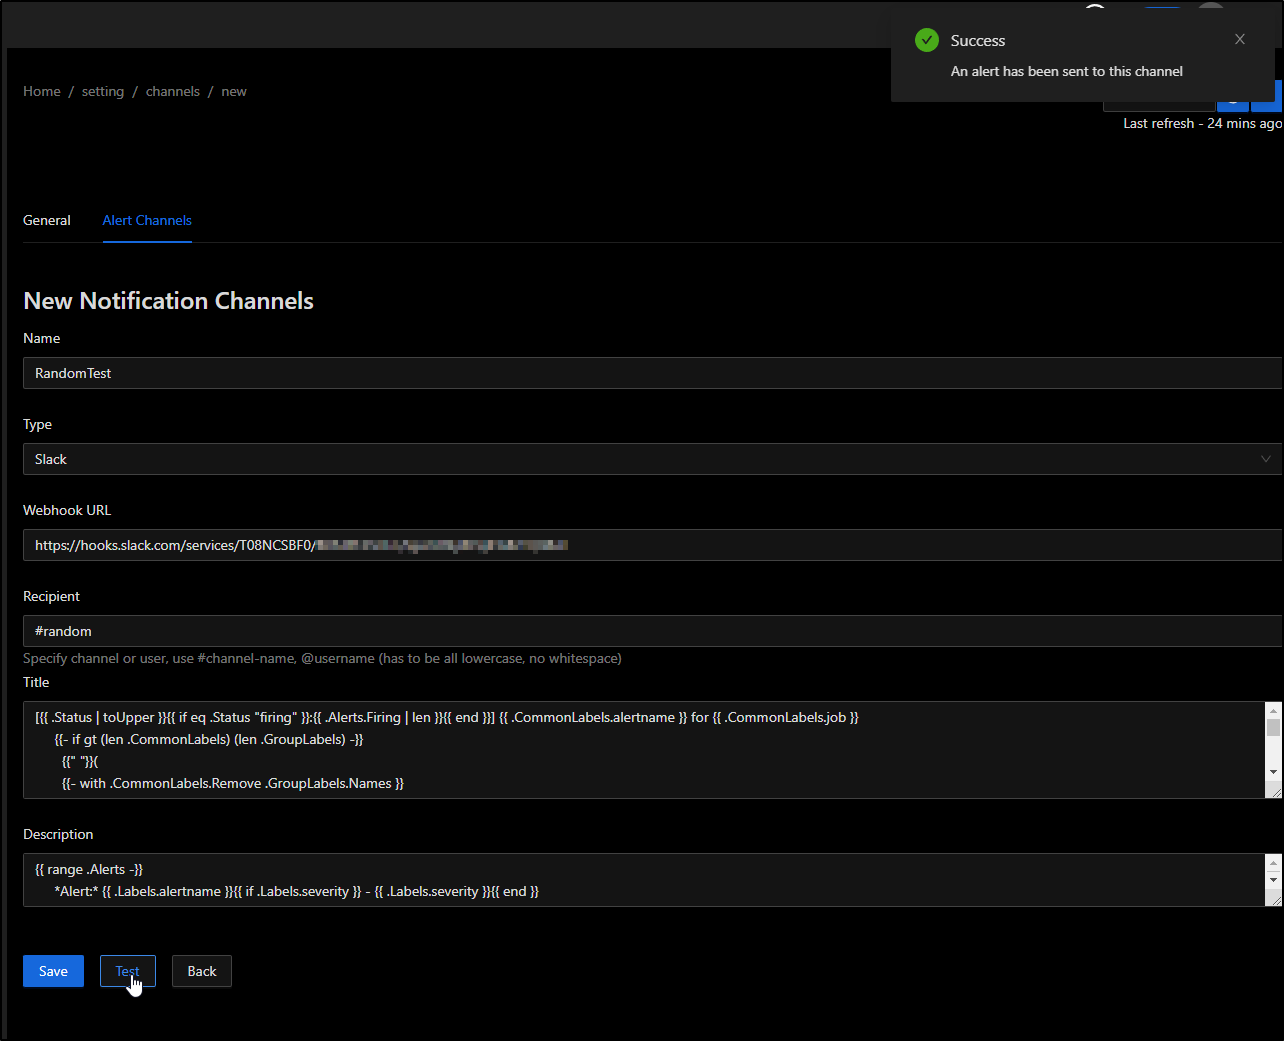
I could see an uninteresting test message posted.
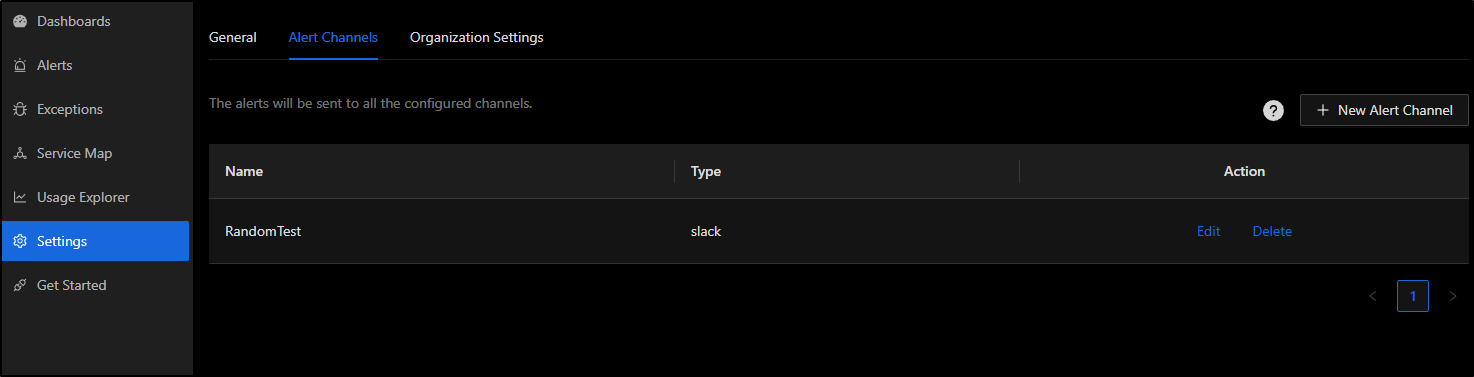
This means we have at least one integration. I’ll click “Save” at the bottom in SigNoz
Now I can see at least one alert channel defined
Log Based Alerts
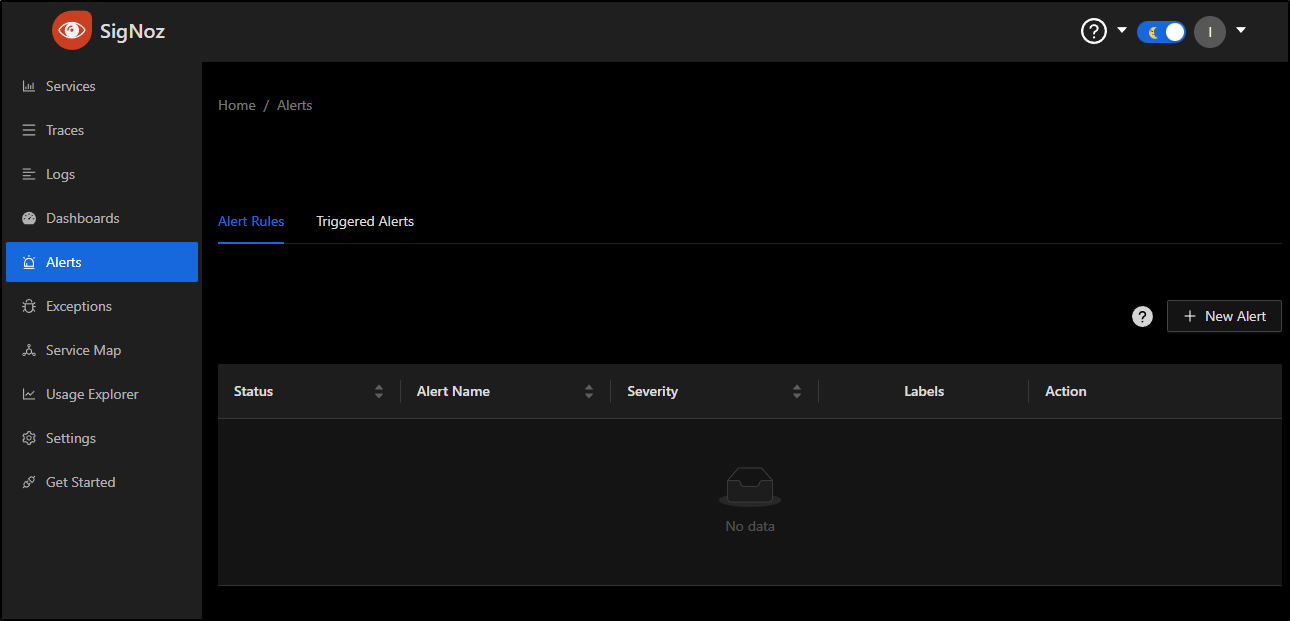
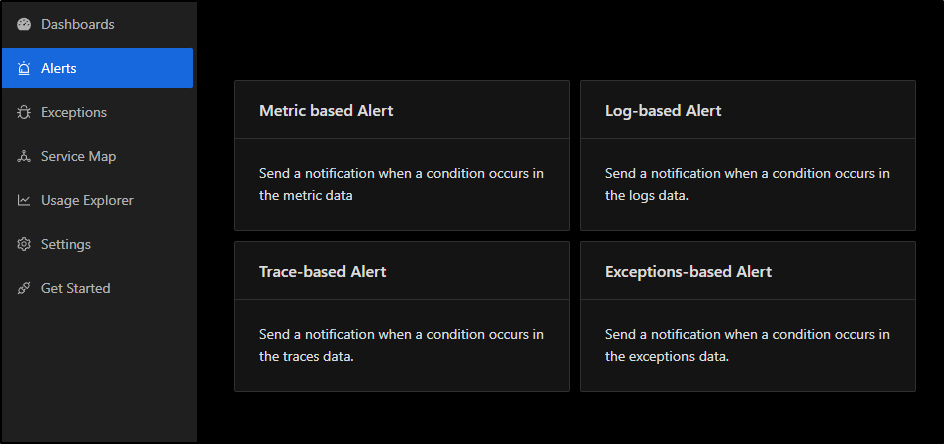
Going to Alerts, we could do “+ New Alert”
We’ll pick “Log-based Alert” from the choices
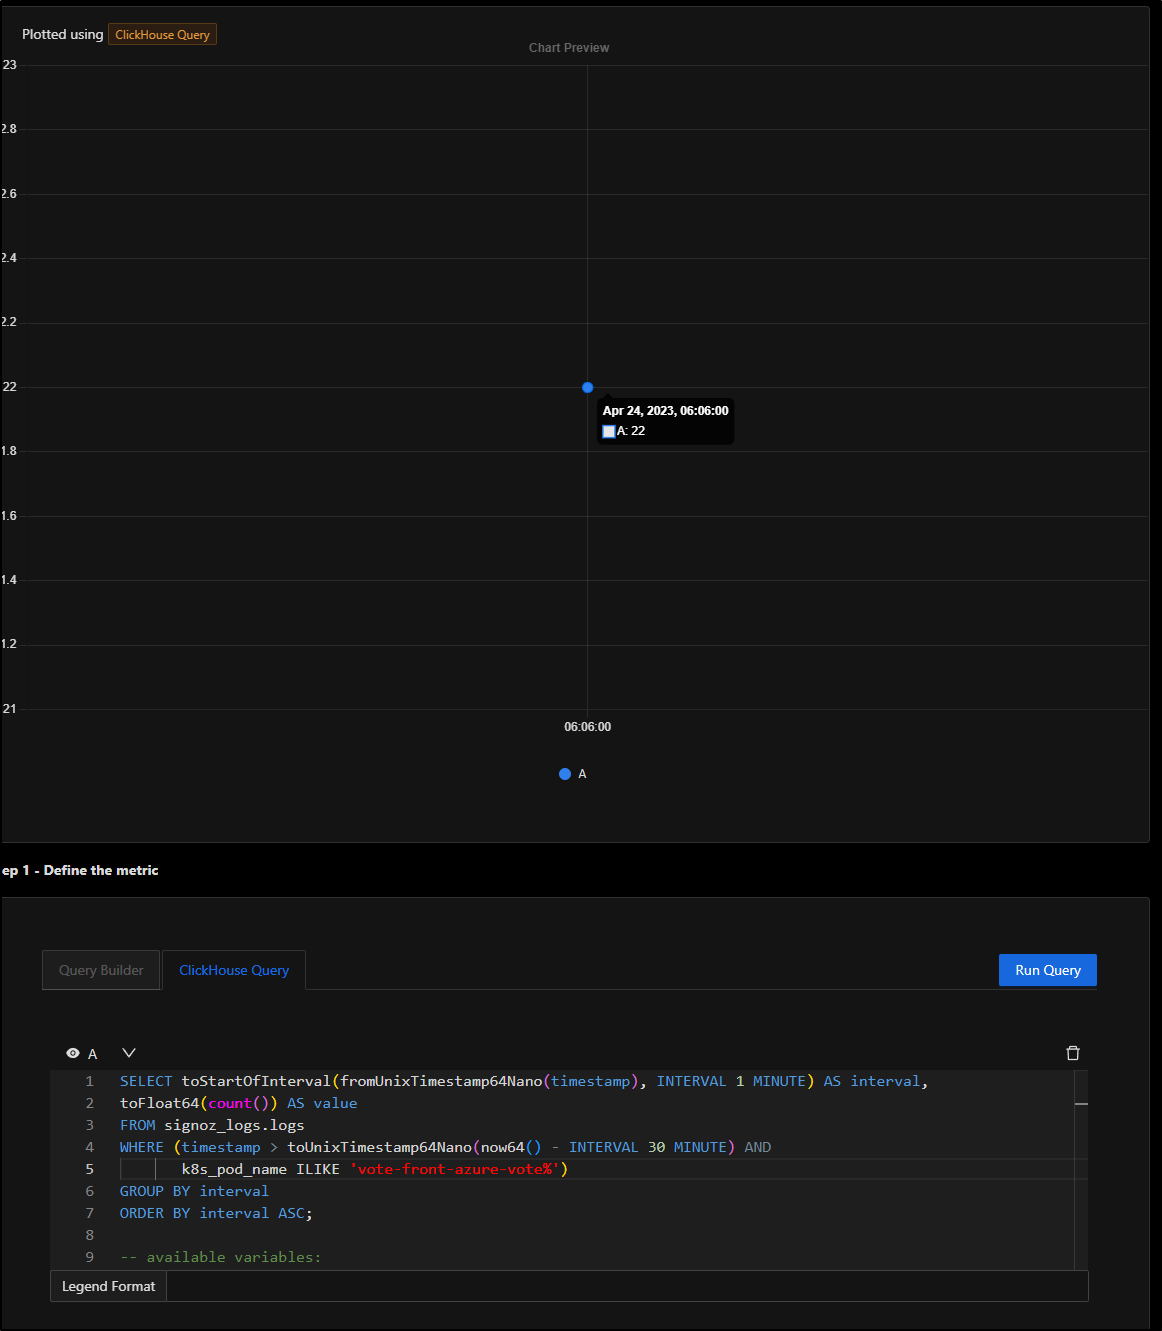
This sets up a ClickHouse Query that essentially selects all things in a 30m interval from logs.
select
toStartOfInterval(fromUnixTimestamp64Nano(timestamp), INTERVAL 30 MINUTE) AS interval,
toFloat64(count()) as value
FROM signoz_logs.distributed_logs
WHERE timestamp BETWEEN {{.start_timestamp_nano}} AND {{.end_timestamp_nano}}
GROUP BY interval;
We can see by clicking Run Query, at present, the cluster has 2.9K logs in the last day
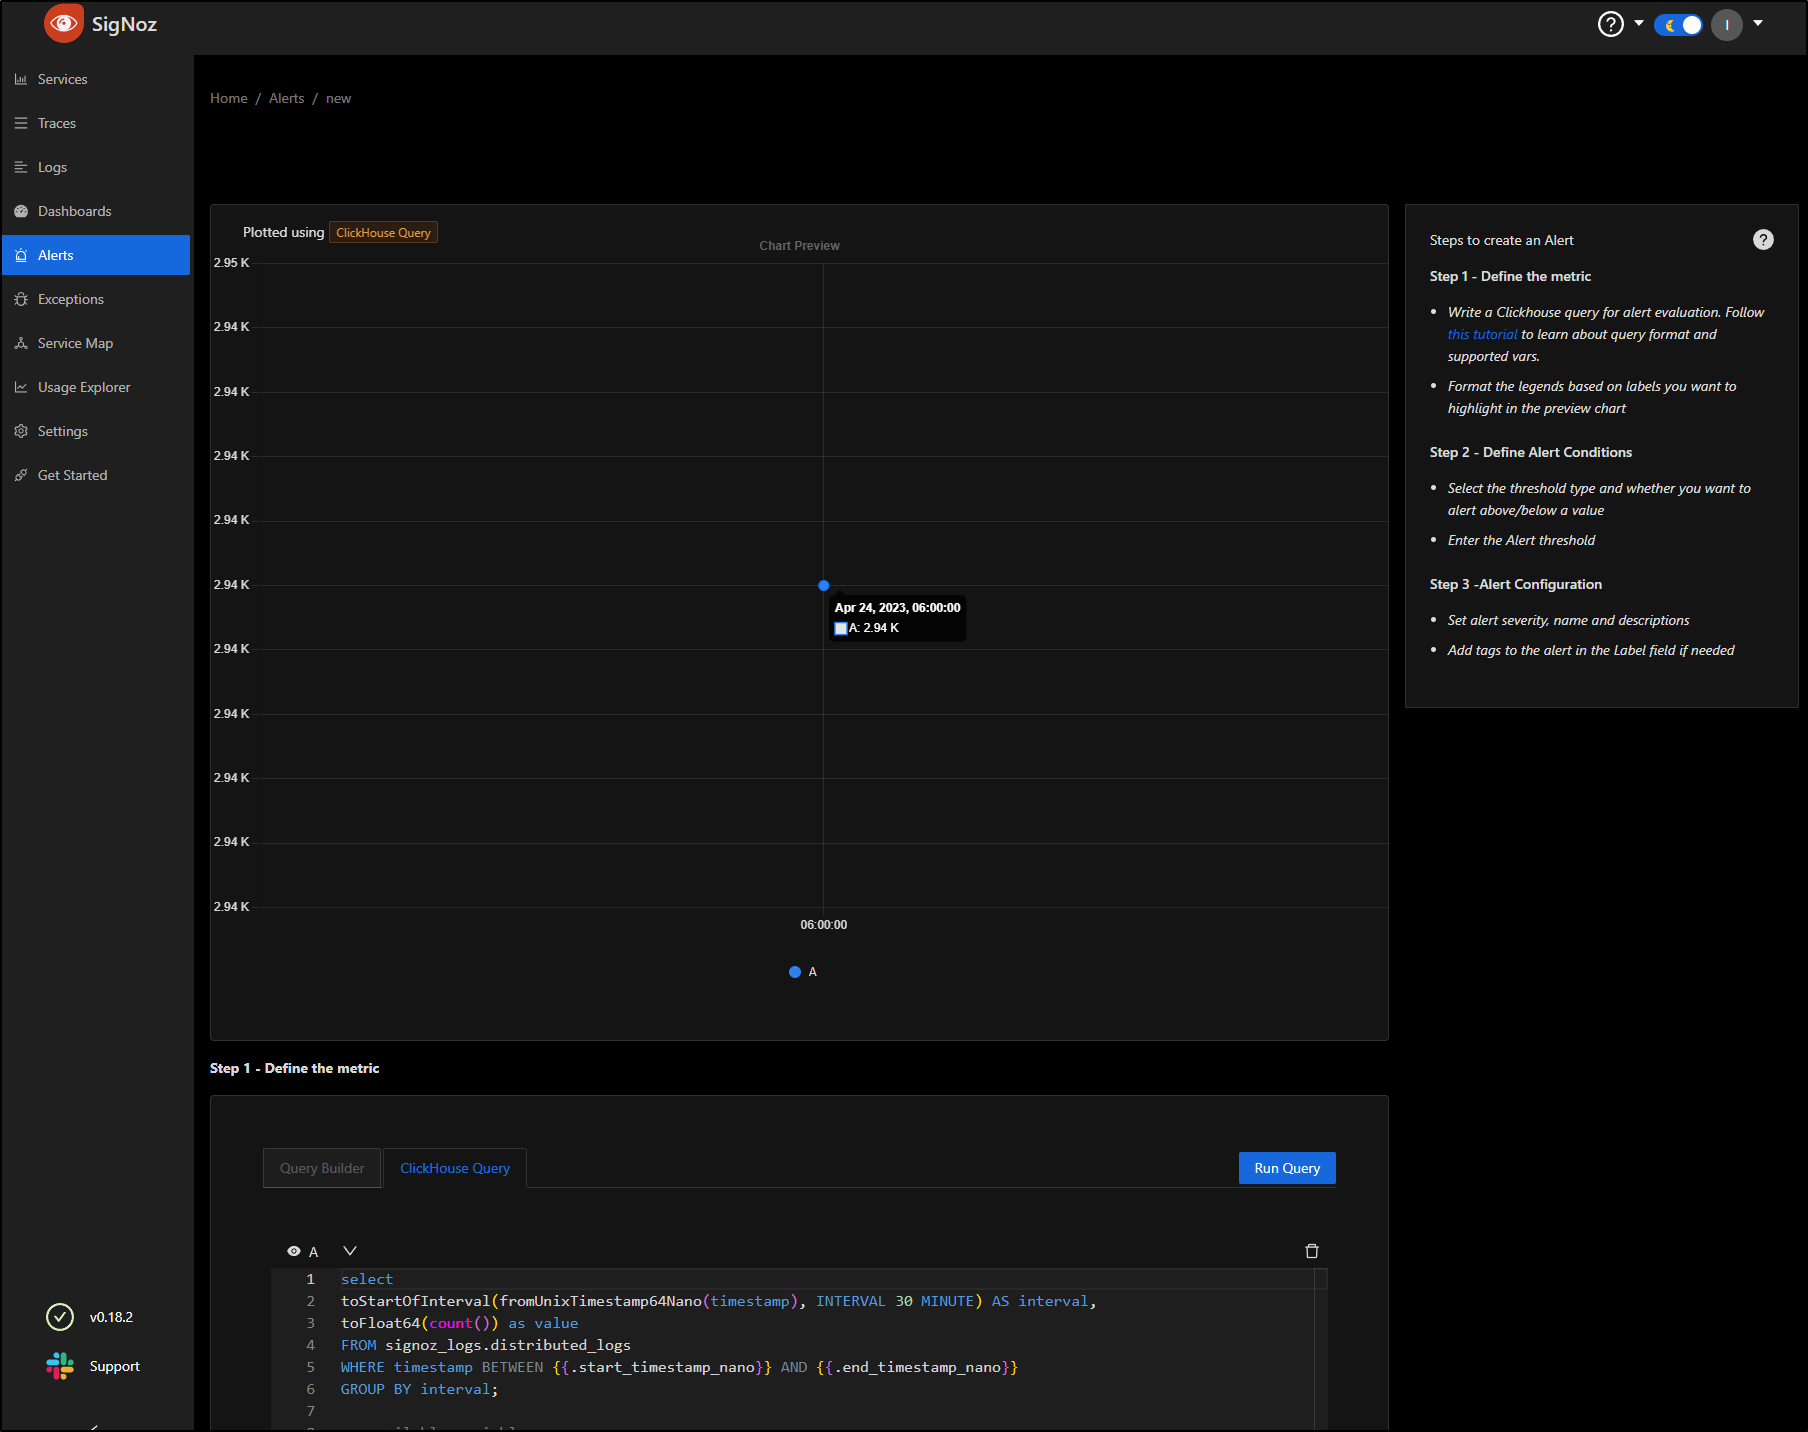
Let’s change that to loglines per minute to see a more interesting graph
SELECT toStartOfInterval(fromUnixTimestamp64Nano(timestamp), INTERVAL 1 MINUTE) AS interval,
toFloat64(count()) AS value
FROM signoz_logs.logs
WHERE timestamp > toUnixTimestamp64Nano(now64() - INTERVAL 30 MINUTE)
GROUP BY interval
ORDER BY interval ASC;
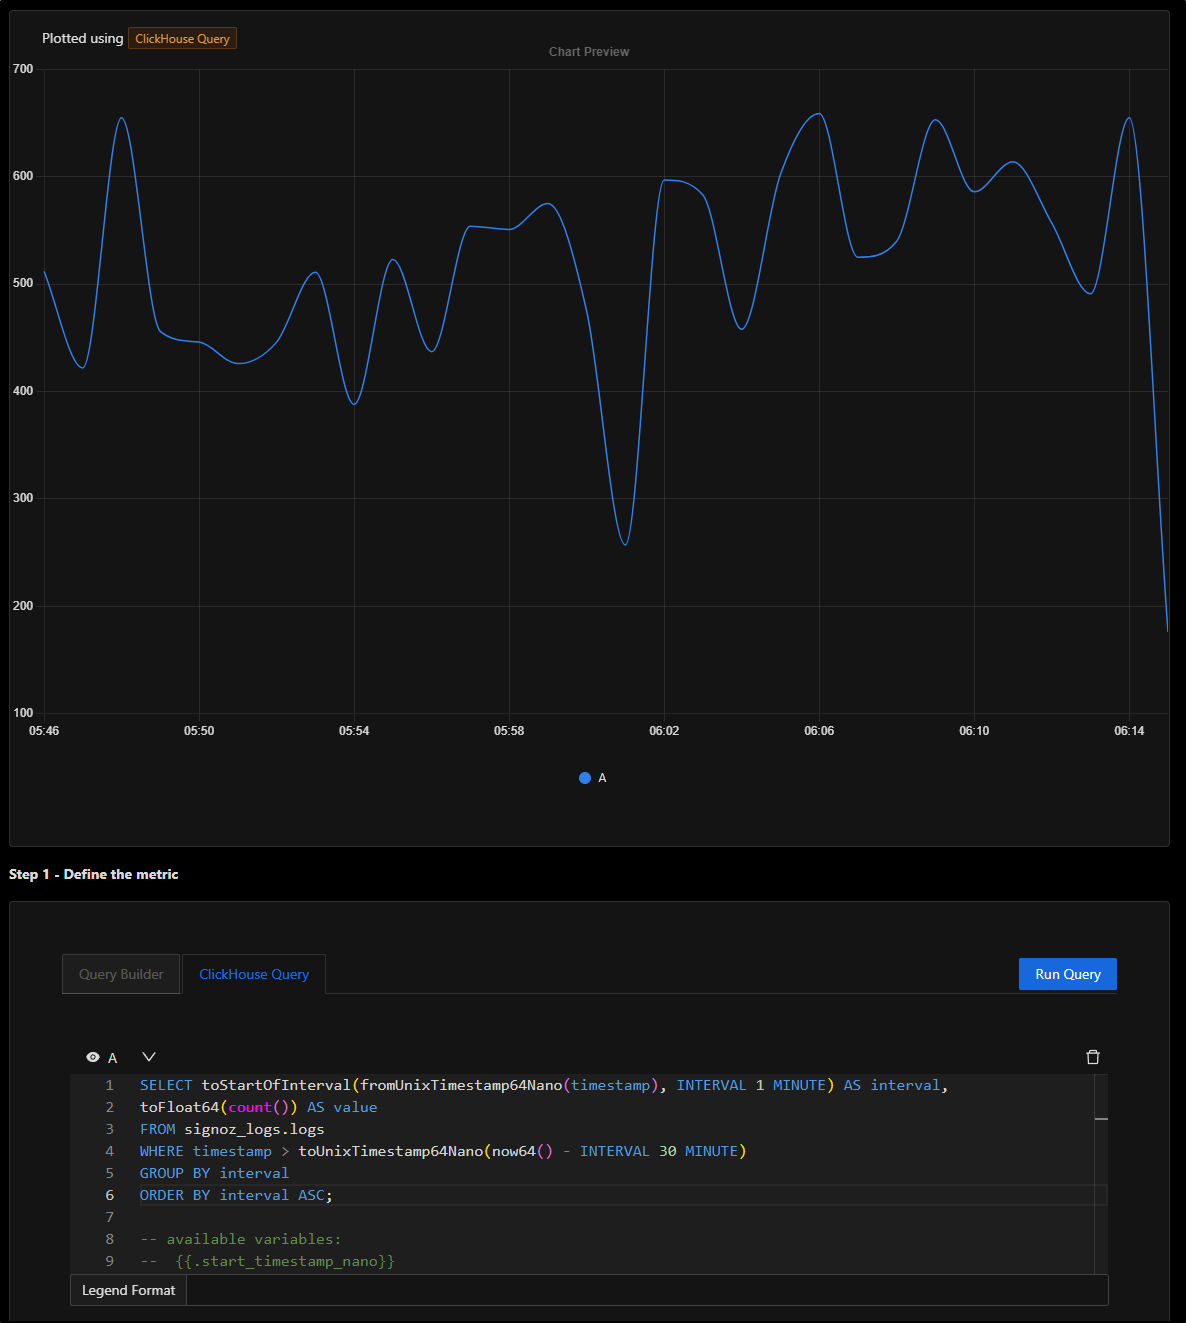
I could trim the query to just logs from the vote pod
SELECT toStartOfInterval(fromUnixTimestamp64Nano(timestamp), INTERVAL 1 MINUTE) AS interval,
toFloat64(count()) AS value
FROM signoz_logs.logs
WHERE (timestamp > toUnixTimestamp64Nano(now64() - INTERVAL 30 MINUTE) AND
       k8s_pod_name ILIKE 'vote-front-azure-vote%')
GROUP BY interval
ORDER BY interval ASC;
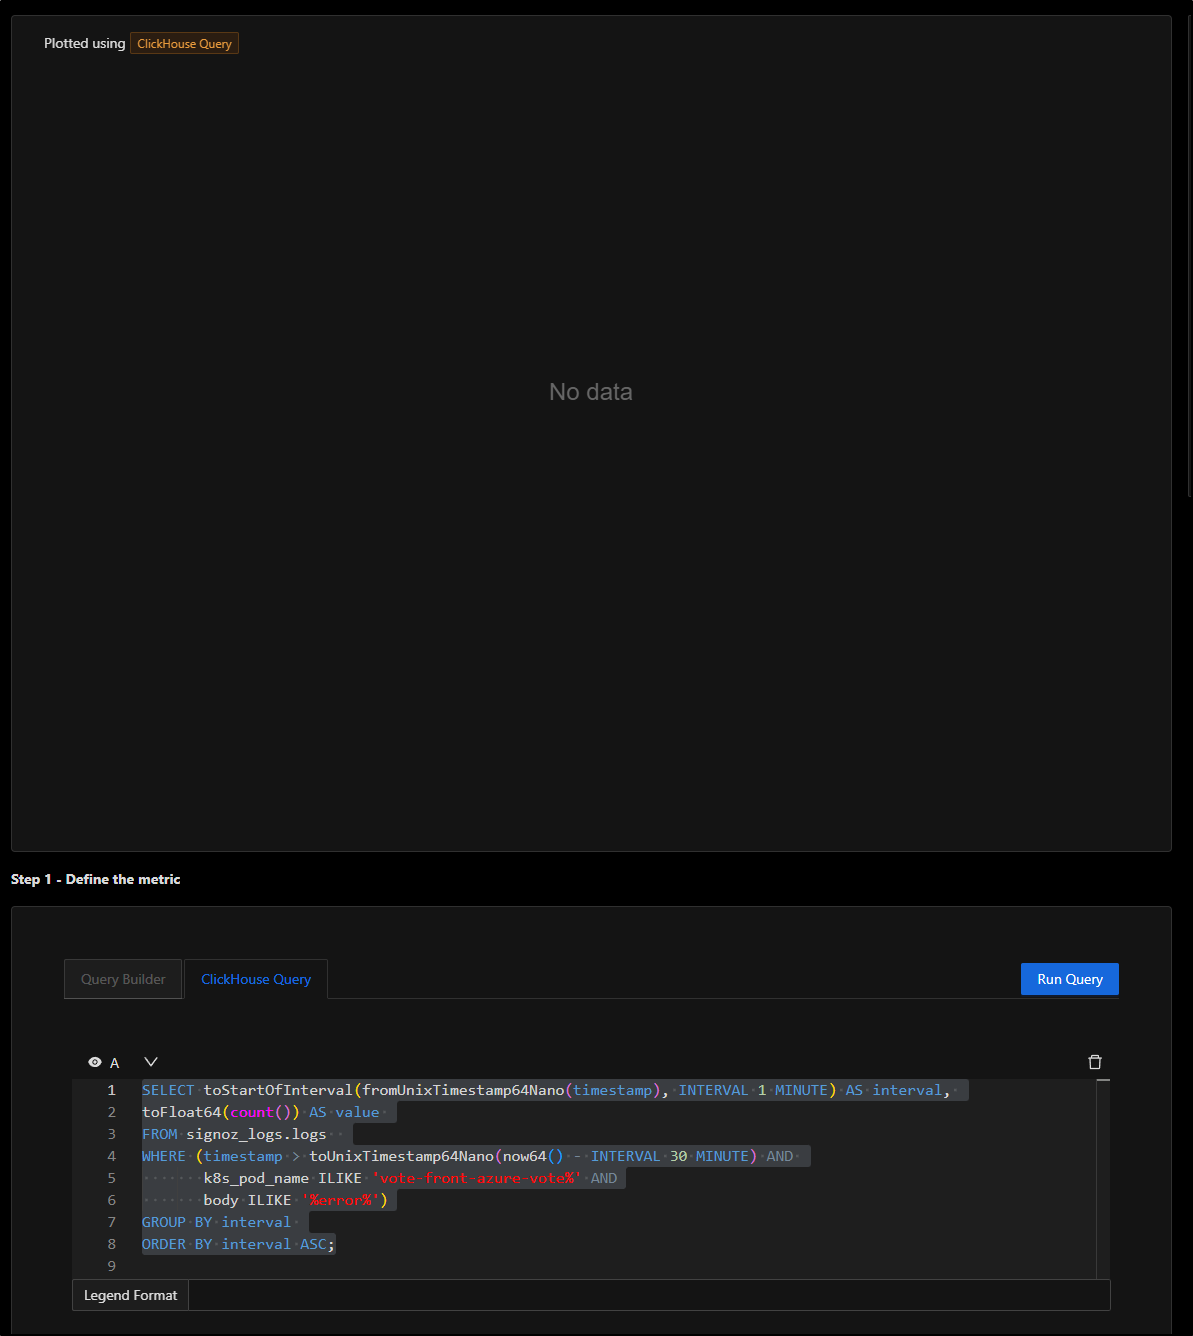
The logical query for an alert might be to check if the body contains “error”
SELECT toStartOfInterval(fromUnixTimestamp64Nano(timestamp), INTERVAL 1 MINUTE) AS interval,
toFloat64(count()) AS value
FROM signoz_logs.logs
WHERE (timestamp > toUnixTimestamp64Nano(now64() - INTERVAL 30 MINUTE) AND
       k8s_pod_name ILIKE 'vote-front-azure-vote%' AND
       body ILIKE '%error%')
GROUP BY interval
ORDER BY interval ASC;
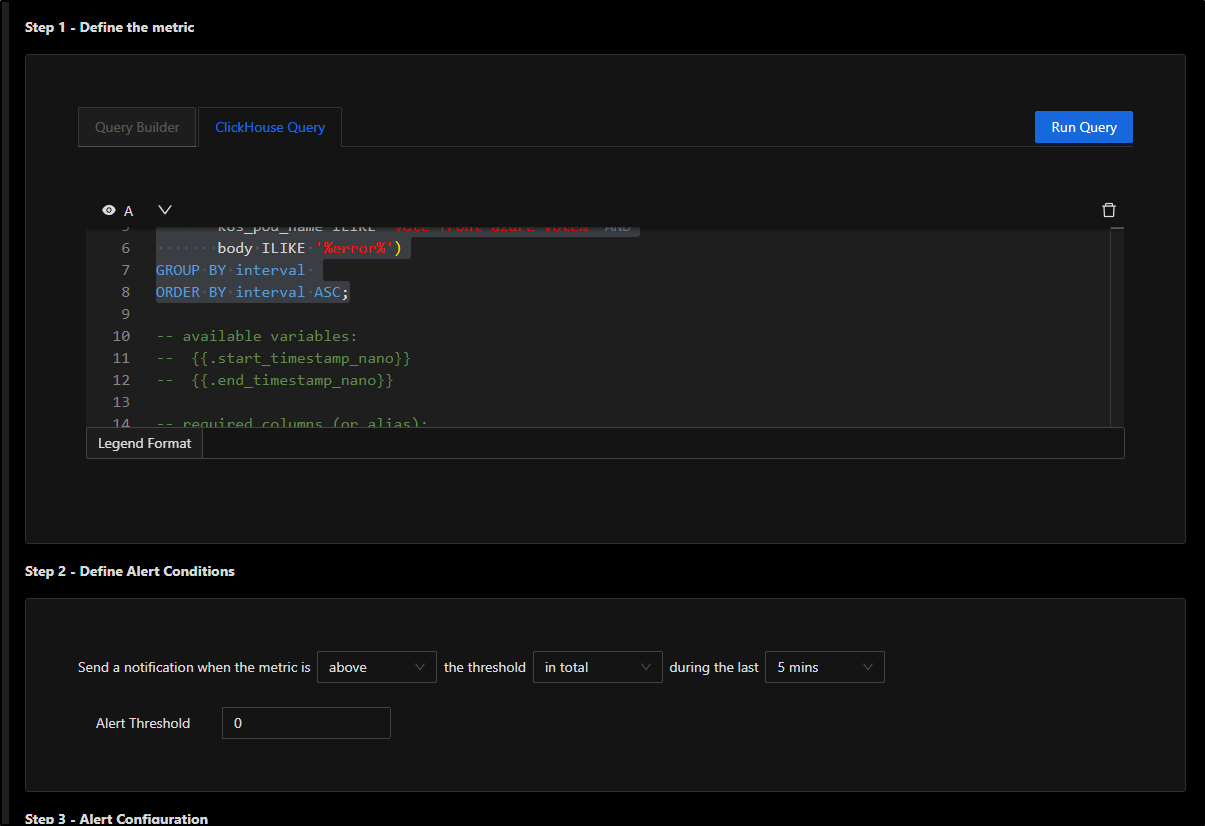
Now that I’m happy with that alert, I’ll define the rest of the fields.
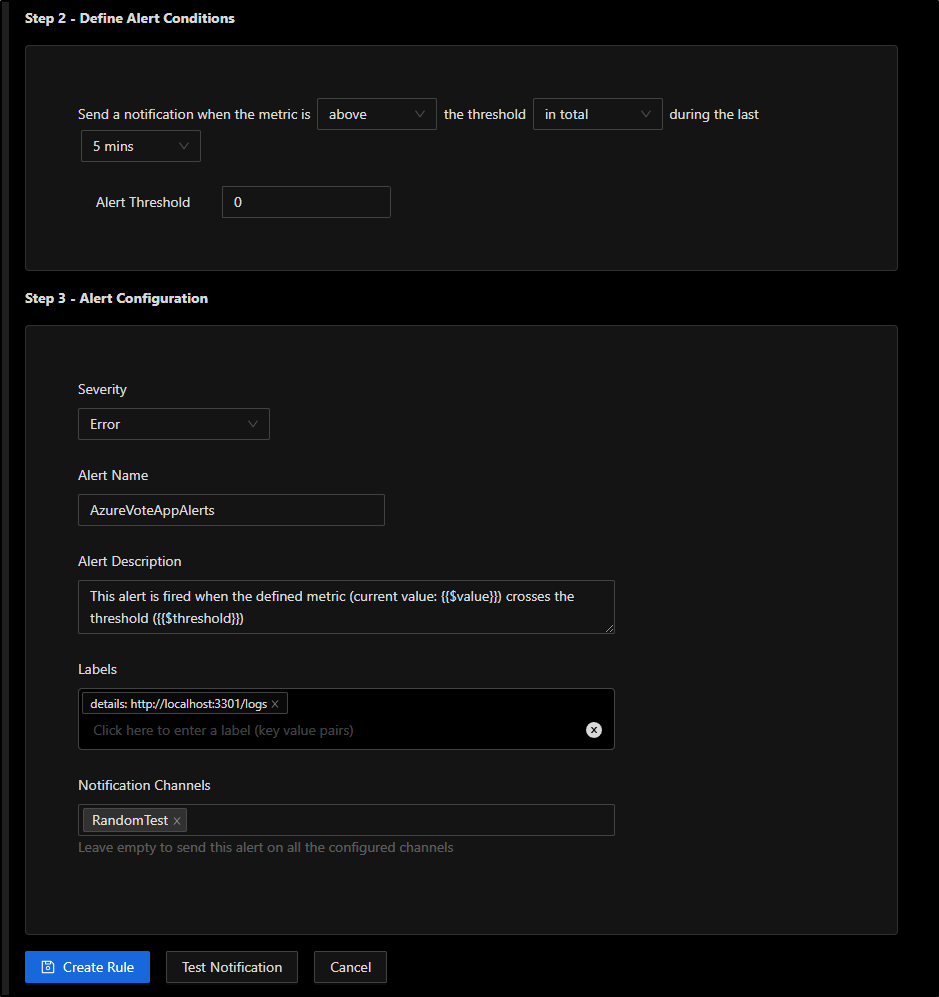
I’ll want a condition that says to trigger when over 0 for 5m
Lastly, I’ll give it a name and select an alert channel. We can use the Slack one we defined earlier and click “Create Rule”
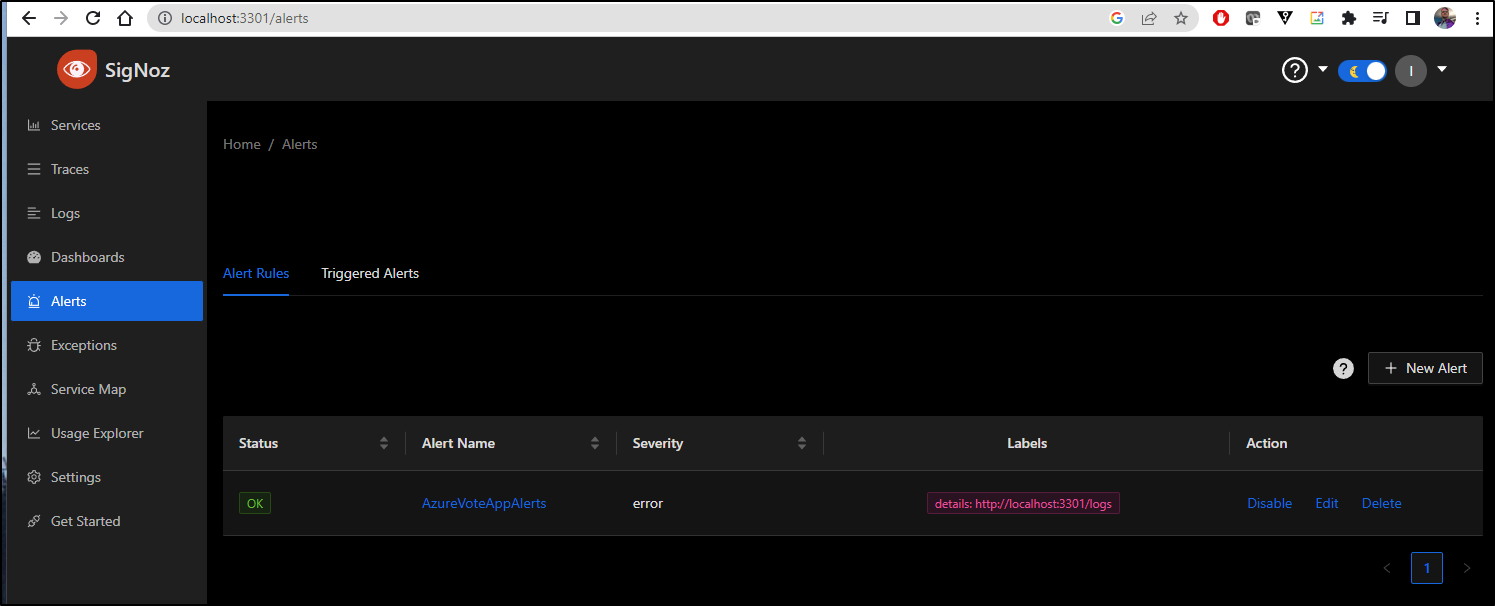
I can now see the alert defined and in a state of “OK”
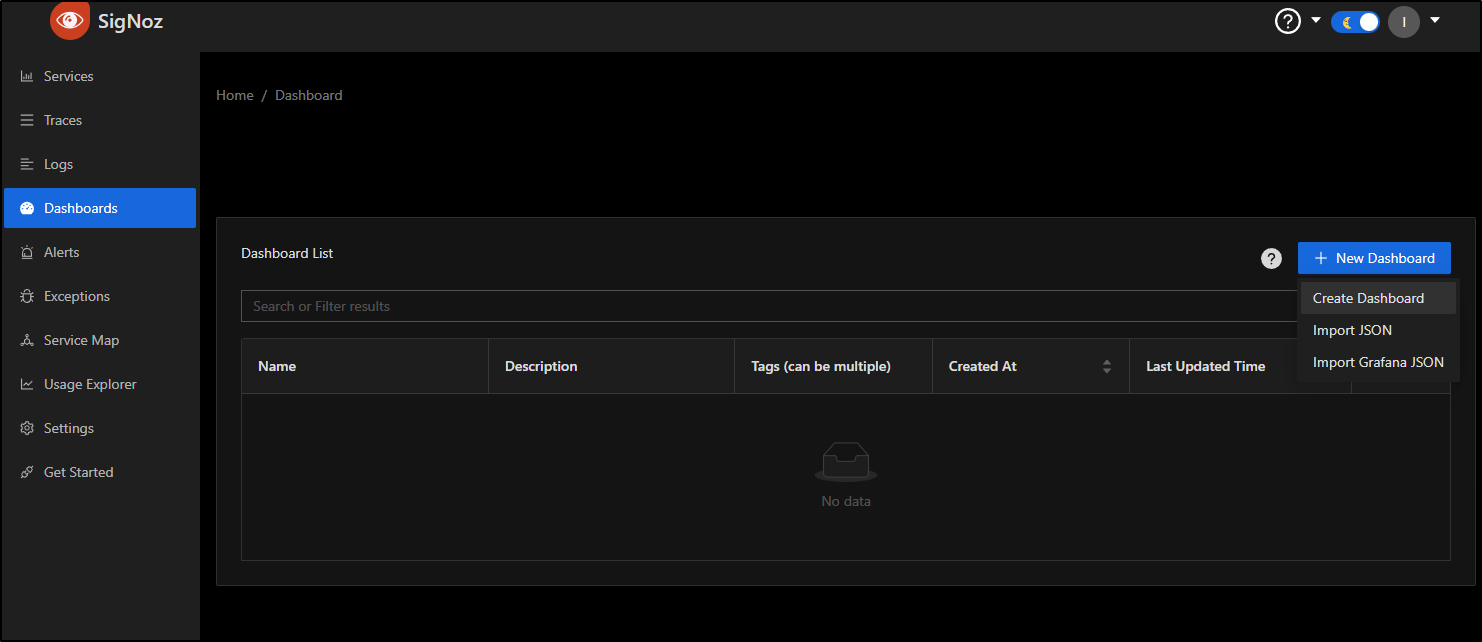
Dashboards
Under dashboards, let’s create a new blank dashboard
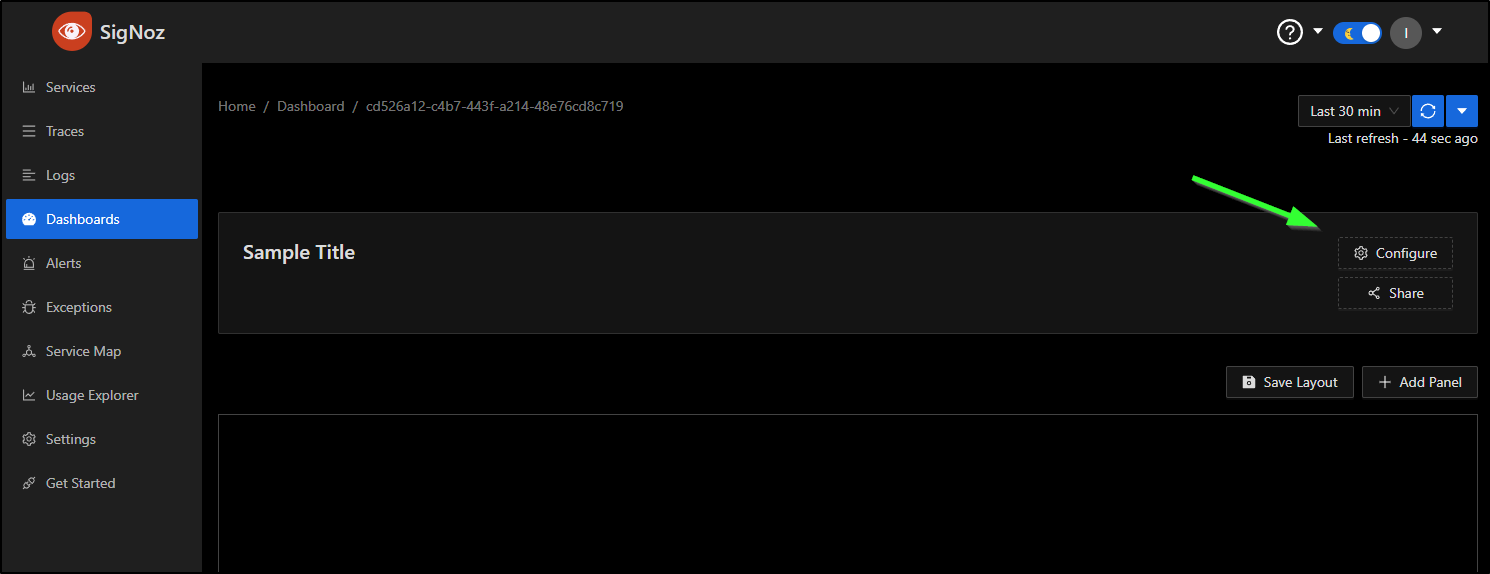
I’ll choose configure so we can give it a name
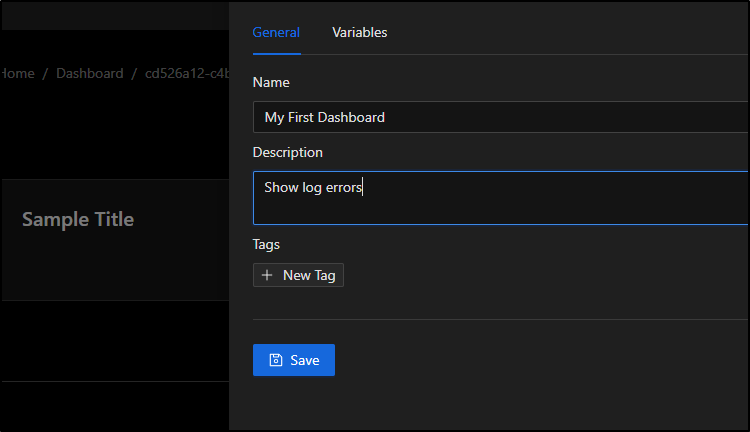
I’ll give it a name and description and click save
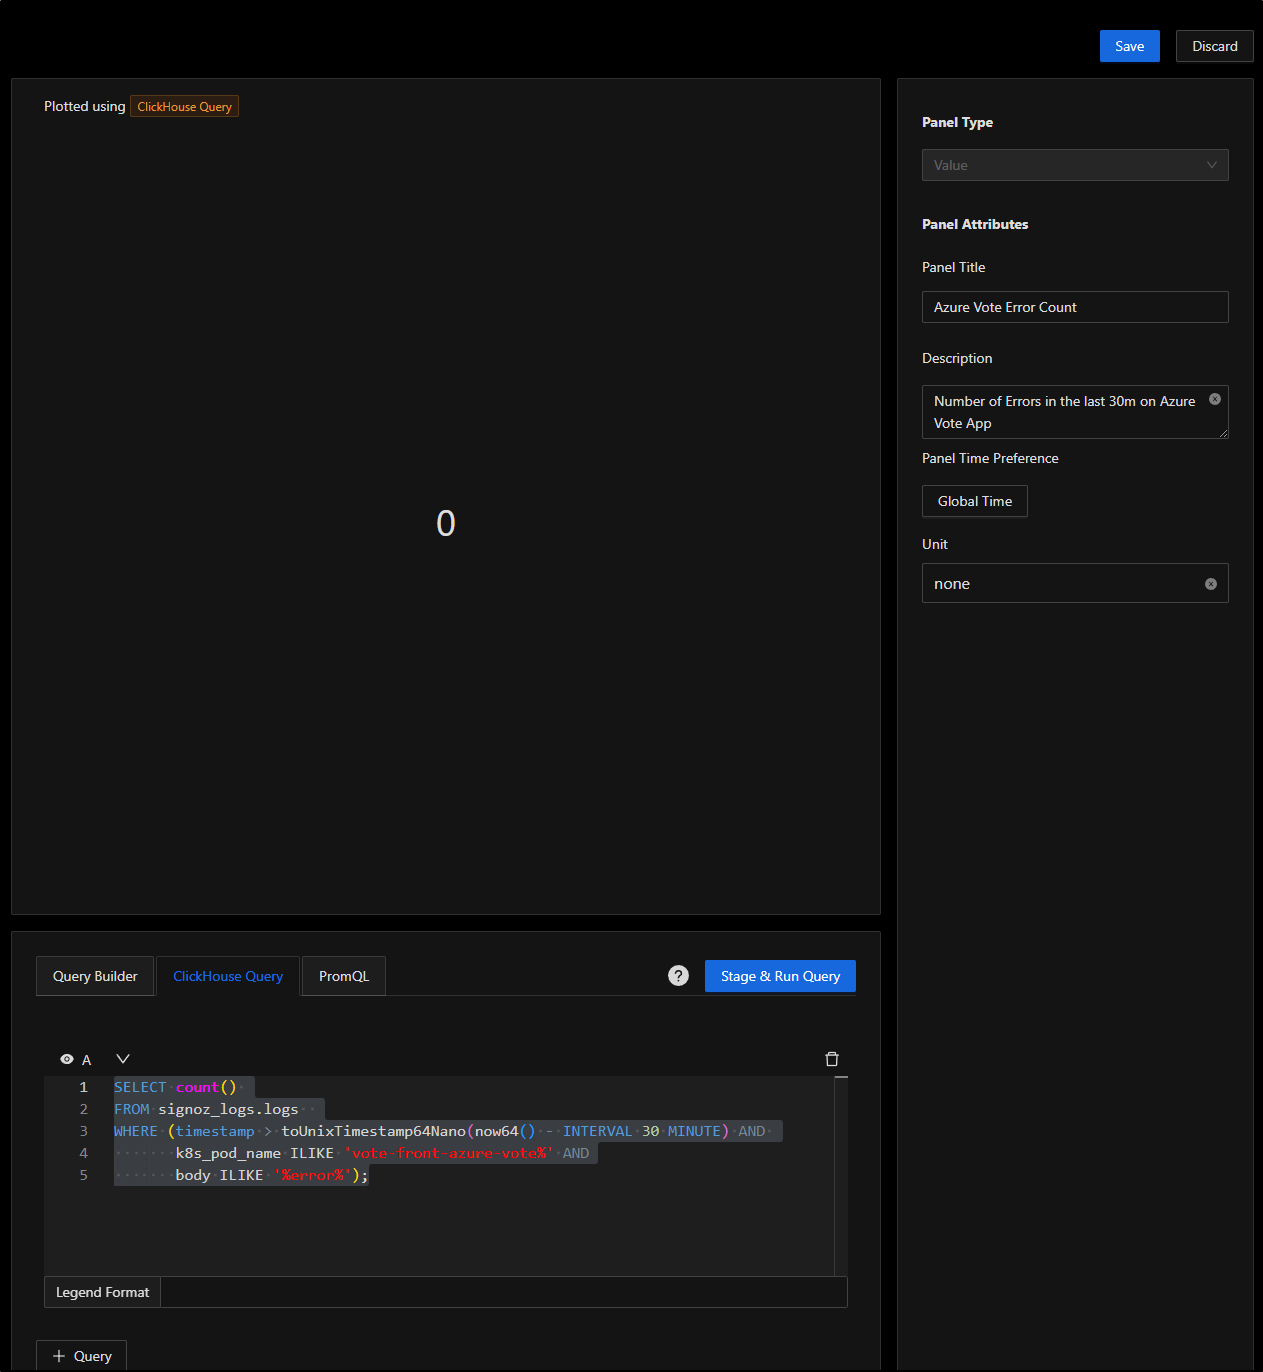
Next, I’ll choose “+ Add Panel” and click the “Value” panel
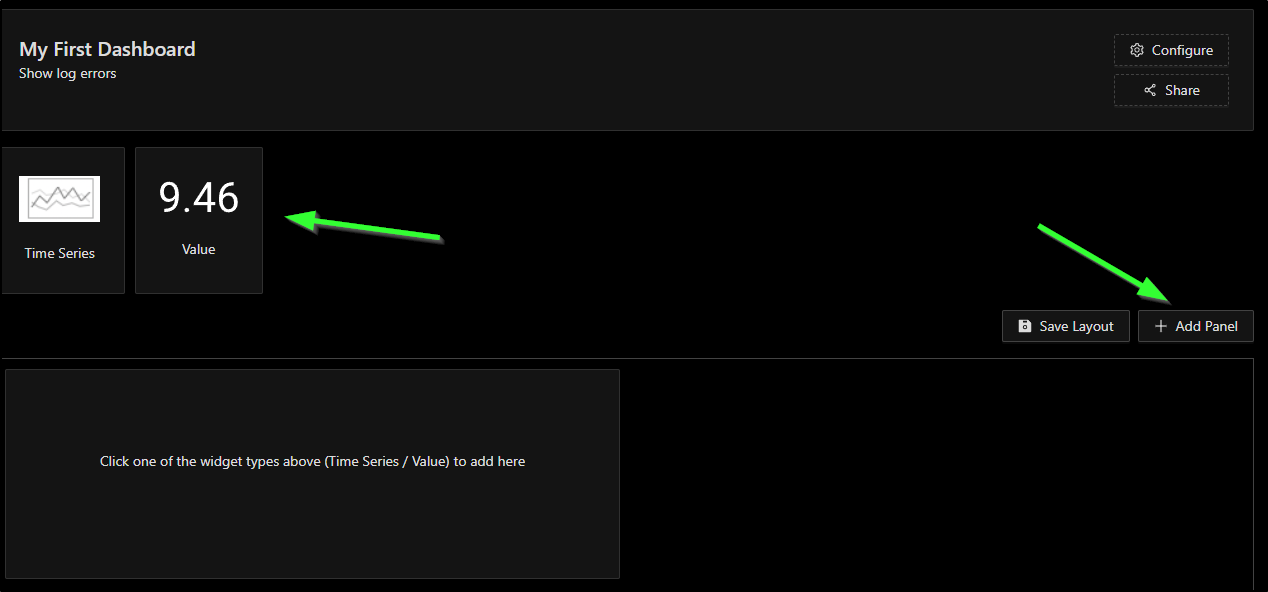
I’ll want just a simple count this time of the log errors for the Azure Vote app
SELECT count()
FROM signoz_logs.logs
WHERE (timestamp > toUnixTimestamp64Nano(now64() - INTERVAL 30 MINUTE) AND
       k8s_pod_name ILIKE 'vote-front-azure-vote%' AND
       body ILIKE '%error%');
You’ll see I gave it Panel title and description on the right then filled in the query in “ClickHouse Query” below. I clicked “Stage and Run Query” to check it was accurate
Now when I click “Save”, I can see the panel in the page
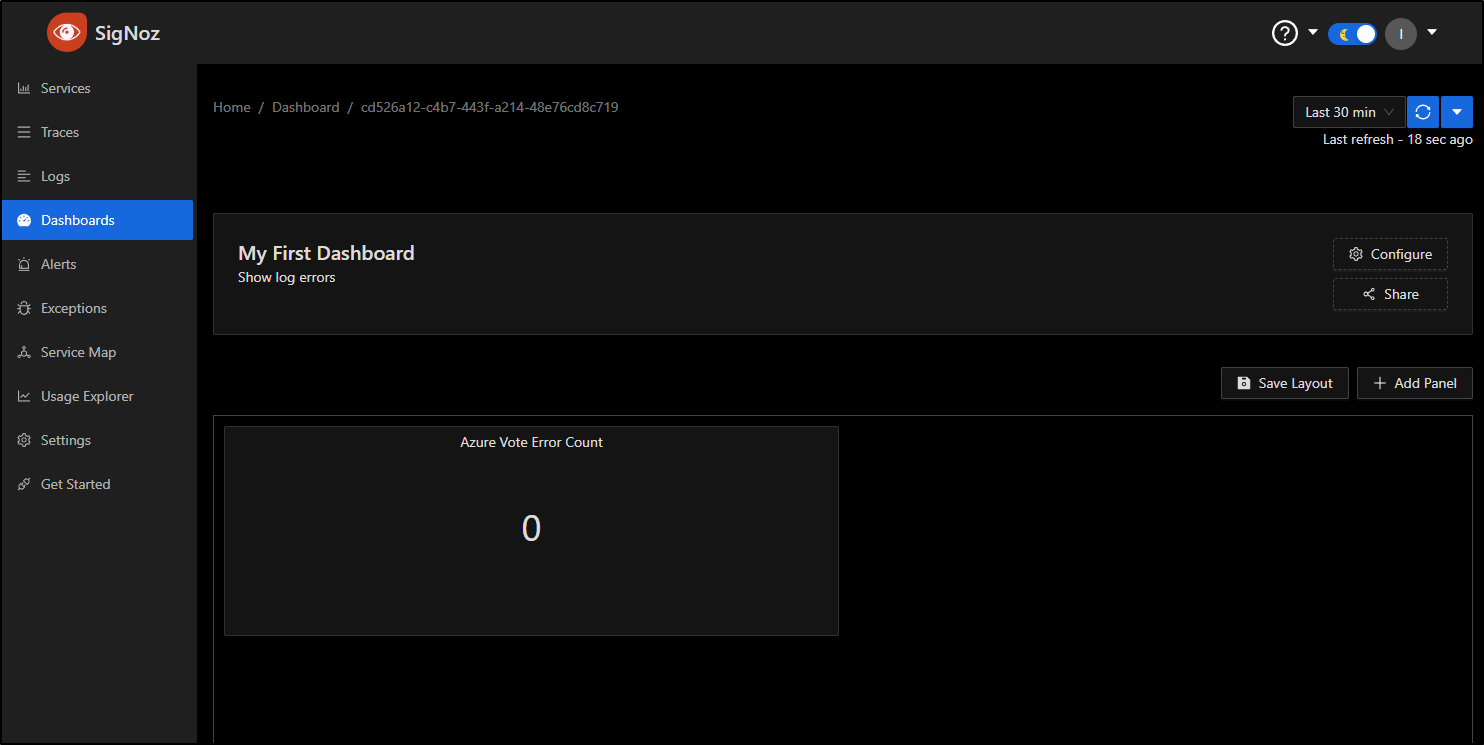
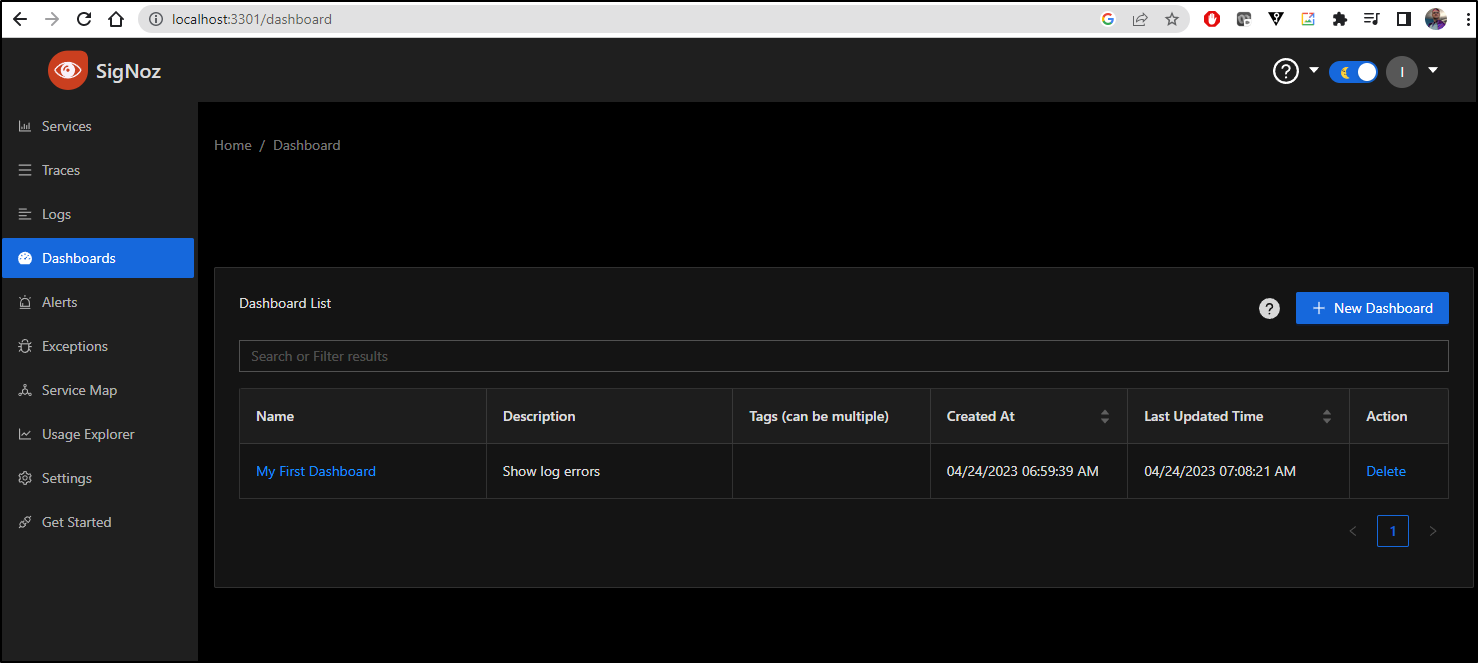
From here, I’ll click “Save Layout” to save this initial dashboard. Now when I go to Dashboards, I can see “My First Dashboard” listed
APM Data
I won’t cover the full setup for Dapr and the Calculator App. You can find most of the samples here.
However, in short, I’m routing Zipkin traces to the IP of the Open Telemetry pod by way of dapr via a Configuration
$ kubectl get configuration appconfig -o yaml | tail -n 8
  metric:
    enabled: true
  metrics:
    enabled: true
  tracing:
    samplingRate: "1"
    zipkin:
      endpointAddress: http://10.43.156.140:9411/api/v2/spans
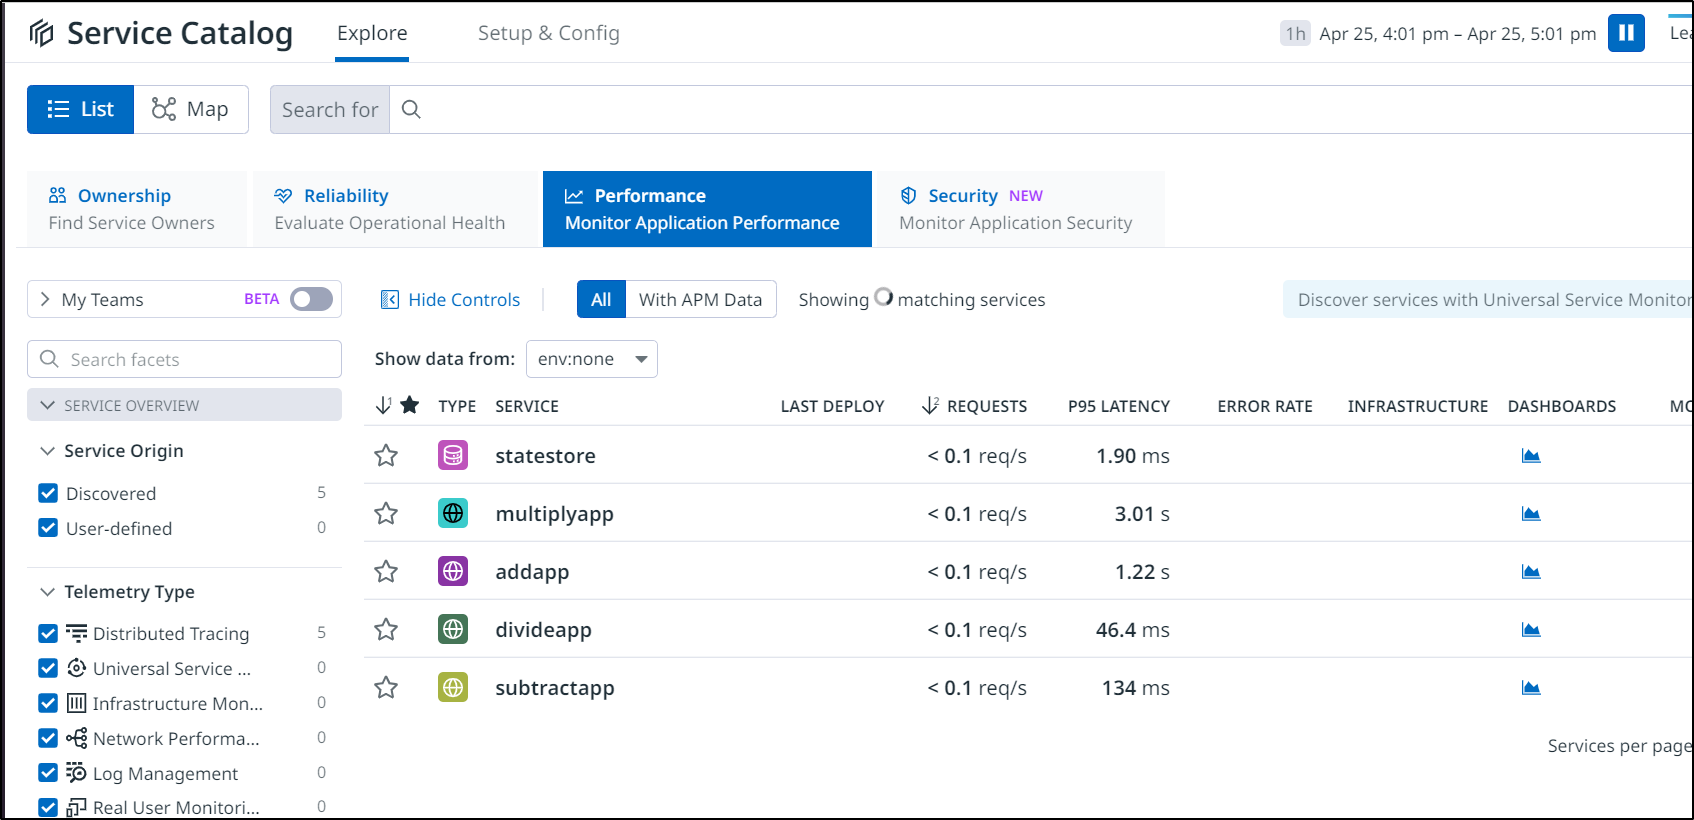
The OTel config is pointed out to Datadog to receive APM trace data. Poking around the Calculator a bit, I can see the output here
If we lookup services in the SigNoz namespace, we can see some collectors
$ kubectl get svc -n platform | grep otel
my-release-k8s-infra-otel-deployment       ClusterIP   10.43.100.12    <none>        13133/TCP                                        2d5h
my-release-signoz-otel-collector-metrics   ClusterIP   10.43.173.102   <none>        13133/TCP                                        2d5h
my-release-k8s-infra-otel-agent            ClusterIP   10.43.118.130   <none>        13133/TCP,8888/TCP,4317/TCP,4318/TCP             2d5h
my-release-signoz-otel-collector           ClusterIP   10.43.246.225   <none>        14250/TCP,14268/TCP,8888/TCP,4317/TCP,4318/TCP   2d5h
While they don’t have a native zipkin (9411), I do see OTLP (4317, 4318)
I updated the appconfig then rotated all the pods
$ kubectl get svc -n platform
NAME                                       TYPE        CLUSTER-IP      EXTERNAL-IP   PORT(S)                                          AGE
my-release-signoz-alertmanager-headless    ClusterIP   None            <none>        9093/TCP                                         2d8h
my-release-zookeeper-headless              ClusterIP   None            <none>        2181/TCP,2888/TCP,3888/TCP                       2d8h
my-release-signoz-query-service            ClusterIP   10.43.81.119    <none>        8080/TCP,8085/TCP                                2d8h
my-release-signoz-alertmanager             ClusterIP   10.43.215.188   <none>        9093/TCP                                         2d8h
my-release-signoz-frontend                 ClusterIP   10.43.59.191    <none>        3301/TCP                                         2d8h
my-release-clickhouse-operator-metrics     ClusterIP   10.43.104.64    <none>        8888/TCP                                         2d8h
my-release-k8s-infra-otel-deployment       ClusterIP   10.43.100.12    <none>        13133/TCP                                        2d8h
my-release-signoz-otel-collector-metrics   ClusterIP   10.43.173.102   <none>        13133/TCP                                        2d8h
my-release-k8s-infra-otel-agent            ClusterIP   10.43.118.130   <none>        13133/TCP,8888/TCP,4317/TCP,4318/TCP             2d8h
my-release-zookeeper                       ClusterIP   10.43.9.137     <none>        2181/TCP,2888/TCP,3888/TCP                       2d8h
my-release-signoz-otel-collector           ClusterIP   10.43.246.225   <none>        14250/TCP,14268/TCP,8888/TCP,4317/TCP,4318/TCP   2d8h
my-release-clickhouse                      ClusterIP   10.43.219.182   <none>        8123/TCP,9000/TCP                                2d8h
chi-my-release-clickhouse-cluster-0-0      ClusterIP   None            <none>        8123/TCP,9000/TCP,9009/TCP                       2d8h

$ cat appconfig.yaml
apiVersion: dapr.io/v1alpha1
kind: Configuration
metadata:
  annotations:
    kubectl.kubernetes.io/last-applied-configuration: |
      {"apiVersion":"dapr.io/v1alpha1","kind":"Configuration","metadata":{"annotations":{},"creationTimestamp":"2023-04-25T19:36:08Z","generation":4,"name":"appconfig","namespace":"default","resourceVersion":"4981104","uid":"f4ba482b-9213-4704-a2e6-73d157f4b69f"},"spec":{"metric":{"enabled":true},"metrics":{"enabled":true},"tracing":{"samplingRate":"1","zipkin":{"endpointAddress":"http://10.43.156.140:9411/api/v2/spans"}}}}
  creationTimestamp: "2023-04-25T19:36:08Z"
  generation: 5
  name: appconfig
  namespace: default
  resourceVersion: "4982167"
  uid: f4ba482b-9213-4704-a2e6-73d157f4b69f
spec:
  metric:
    enabled: true
  metrics:
    enabled: true
  tracing:
    samplingRate: "1"
    otel:
      endpointAddress: "10.43.246.225:4317"
      isSecure: false
      protocol: grpc

$ kubectl apply -f appconfig.yaml
Then rotate all the pods with Dapr enabled
$ kubectl get pod -o=jsonpath='{.items[?(@.metadata.annotations.dapr\.io/enabled=="true")].metadata.name}' | xargs kubectl delete pod
After poking around the Calculator app
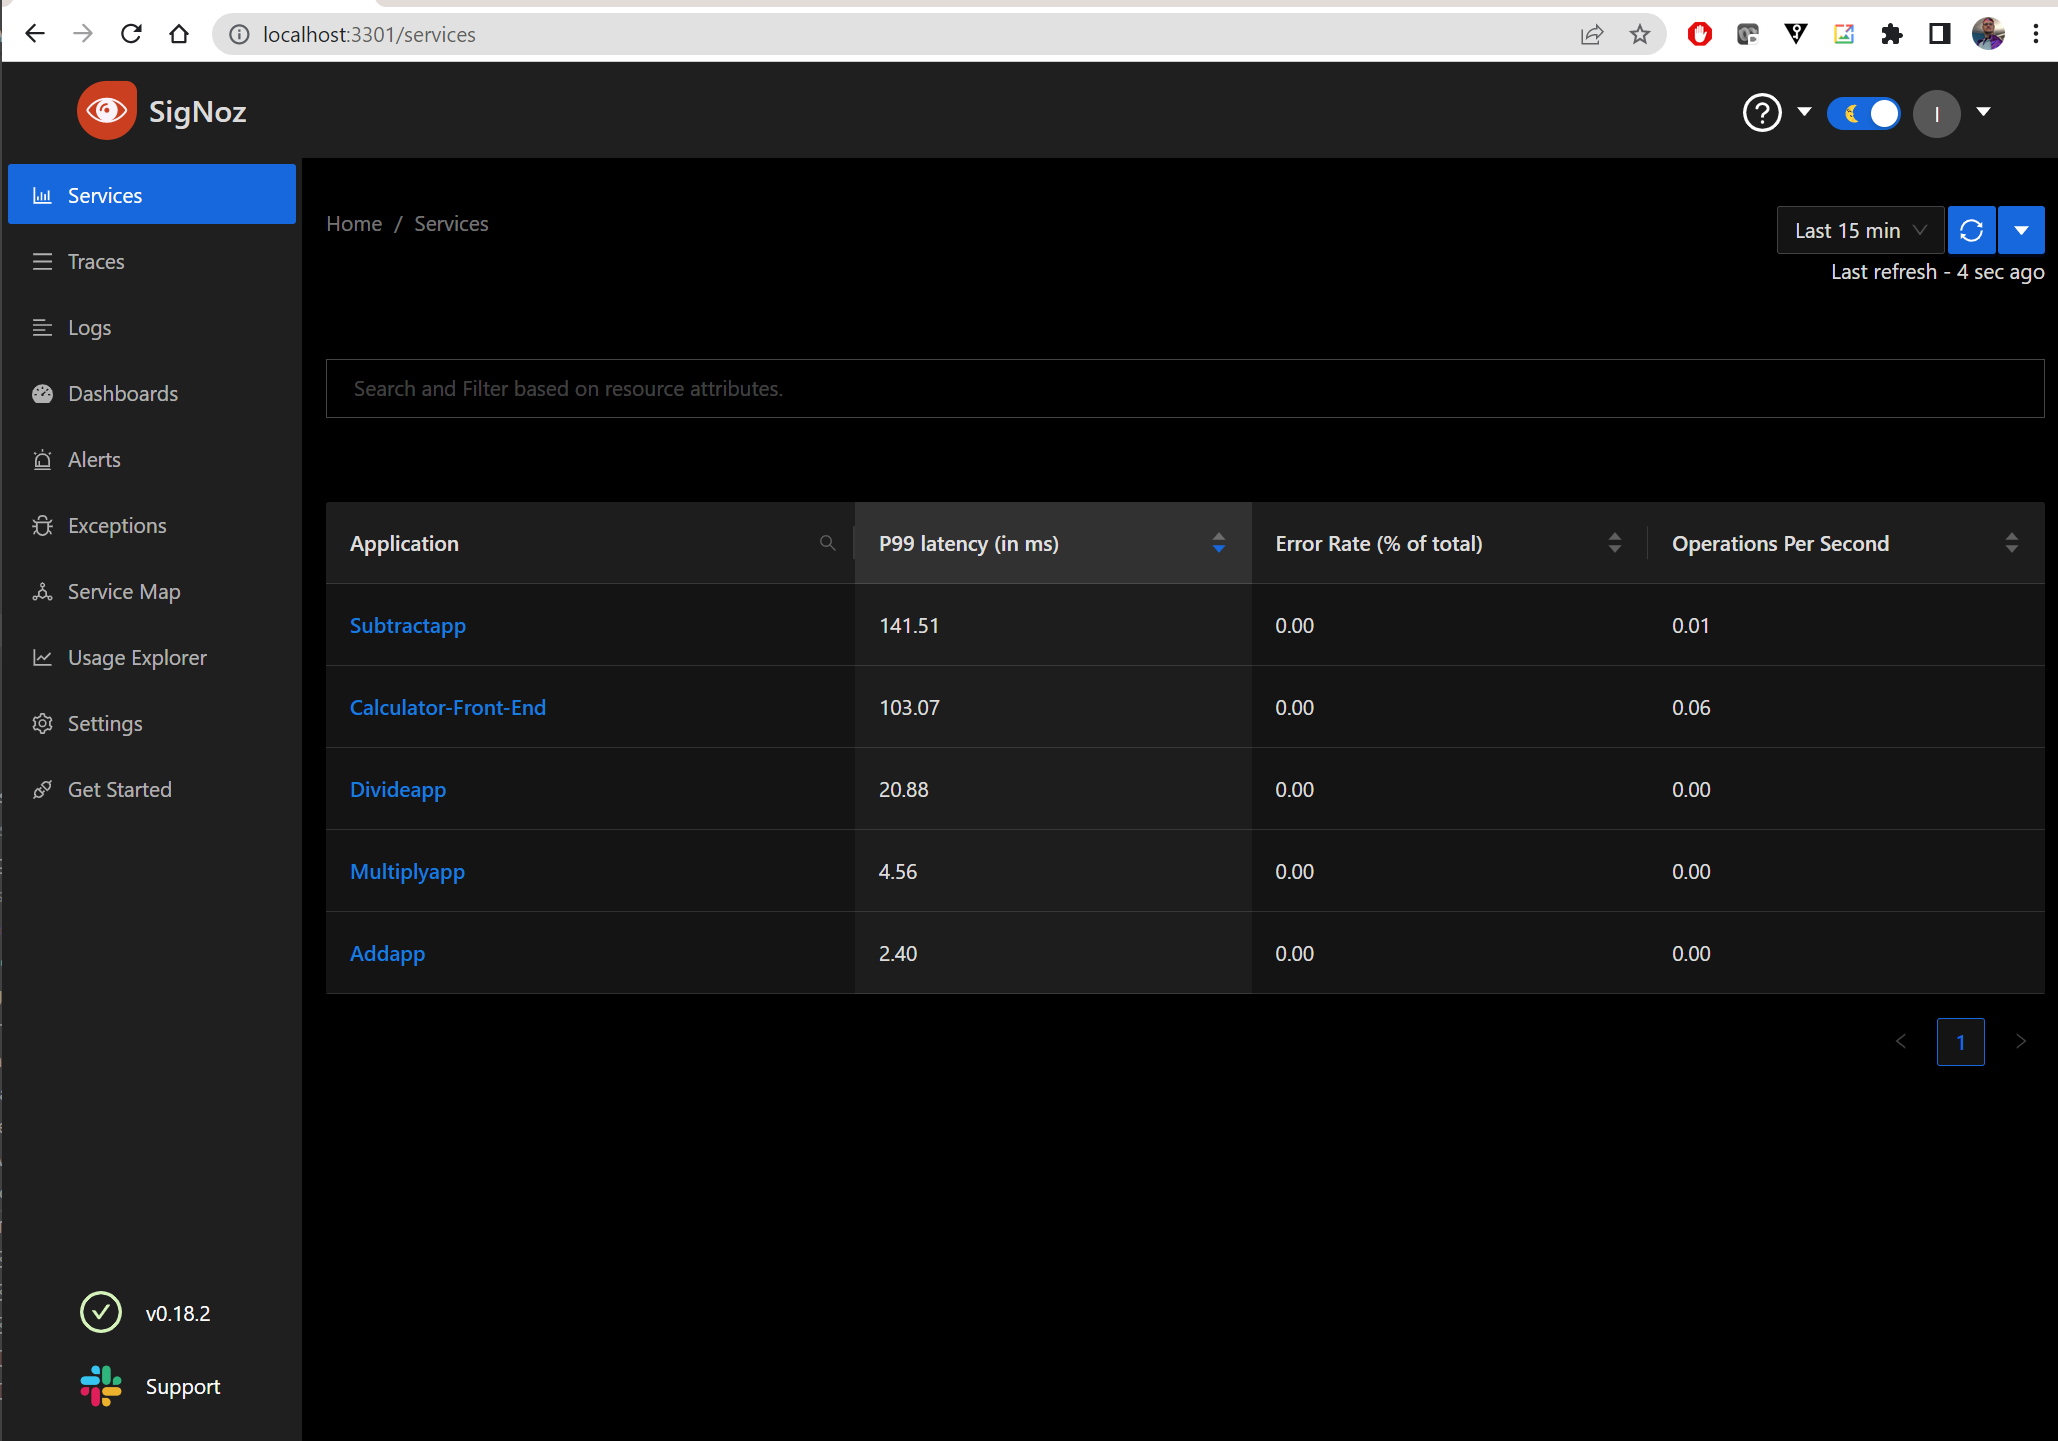
And I can now see it in SigNoz
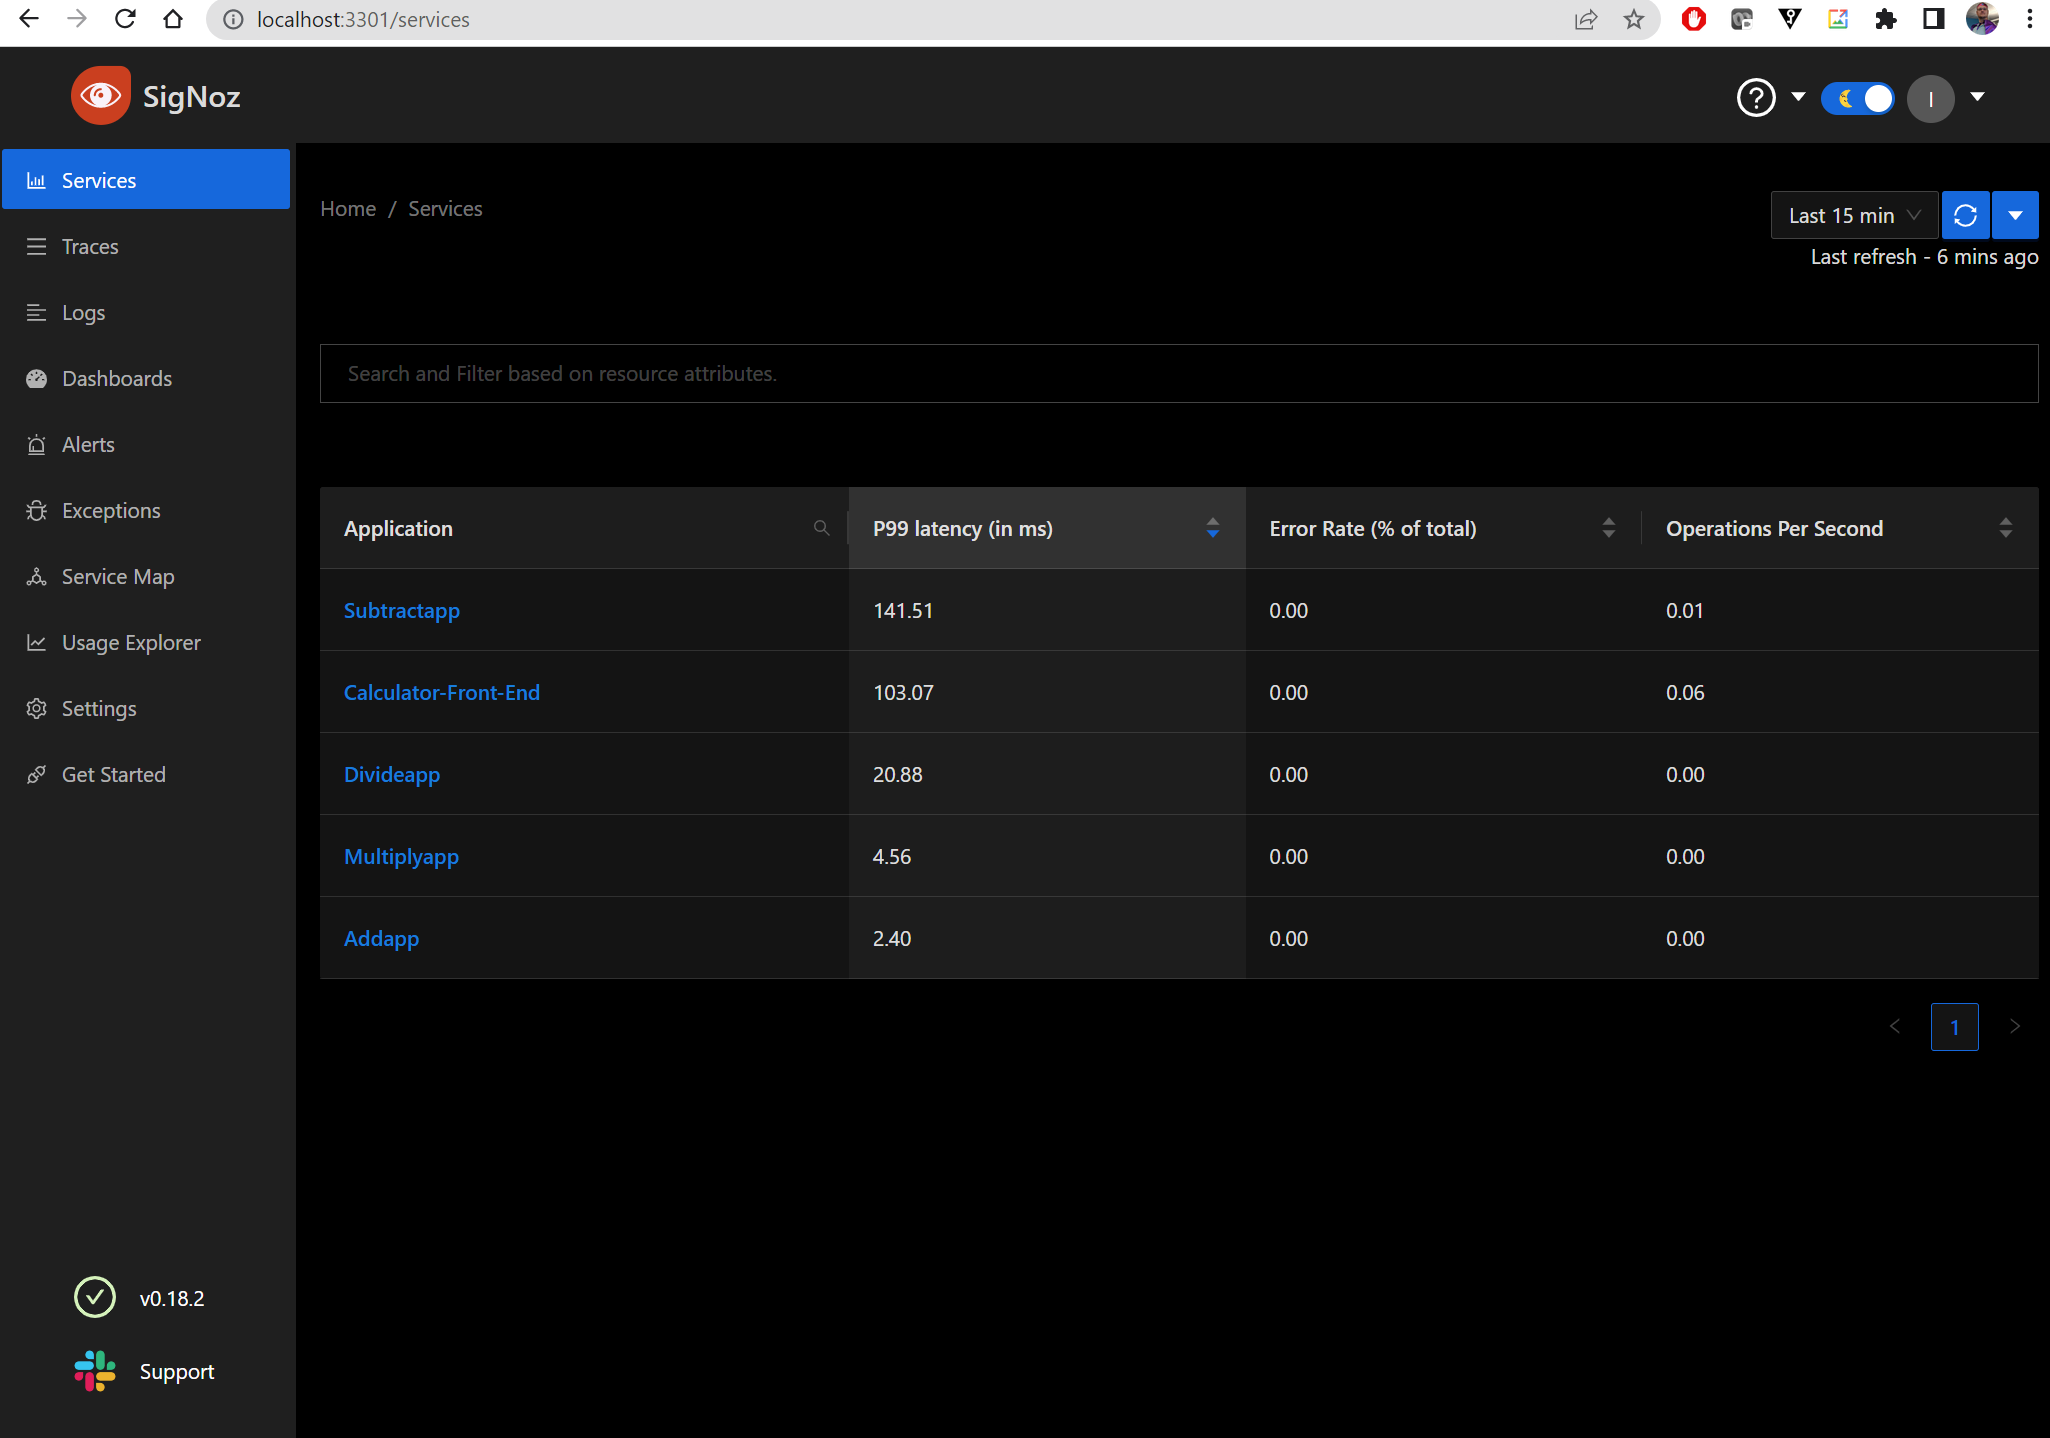
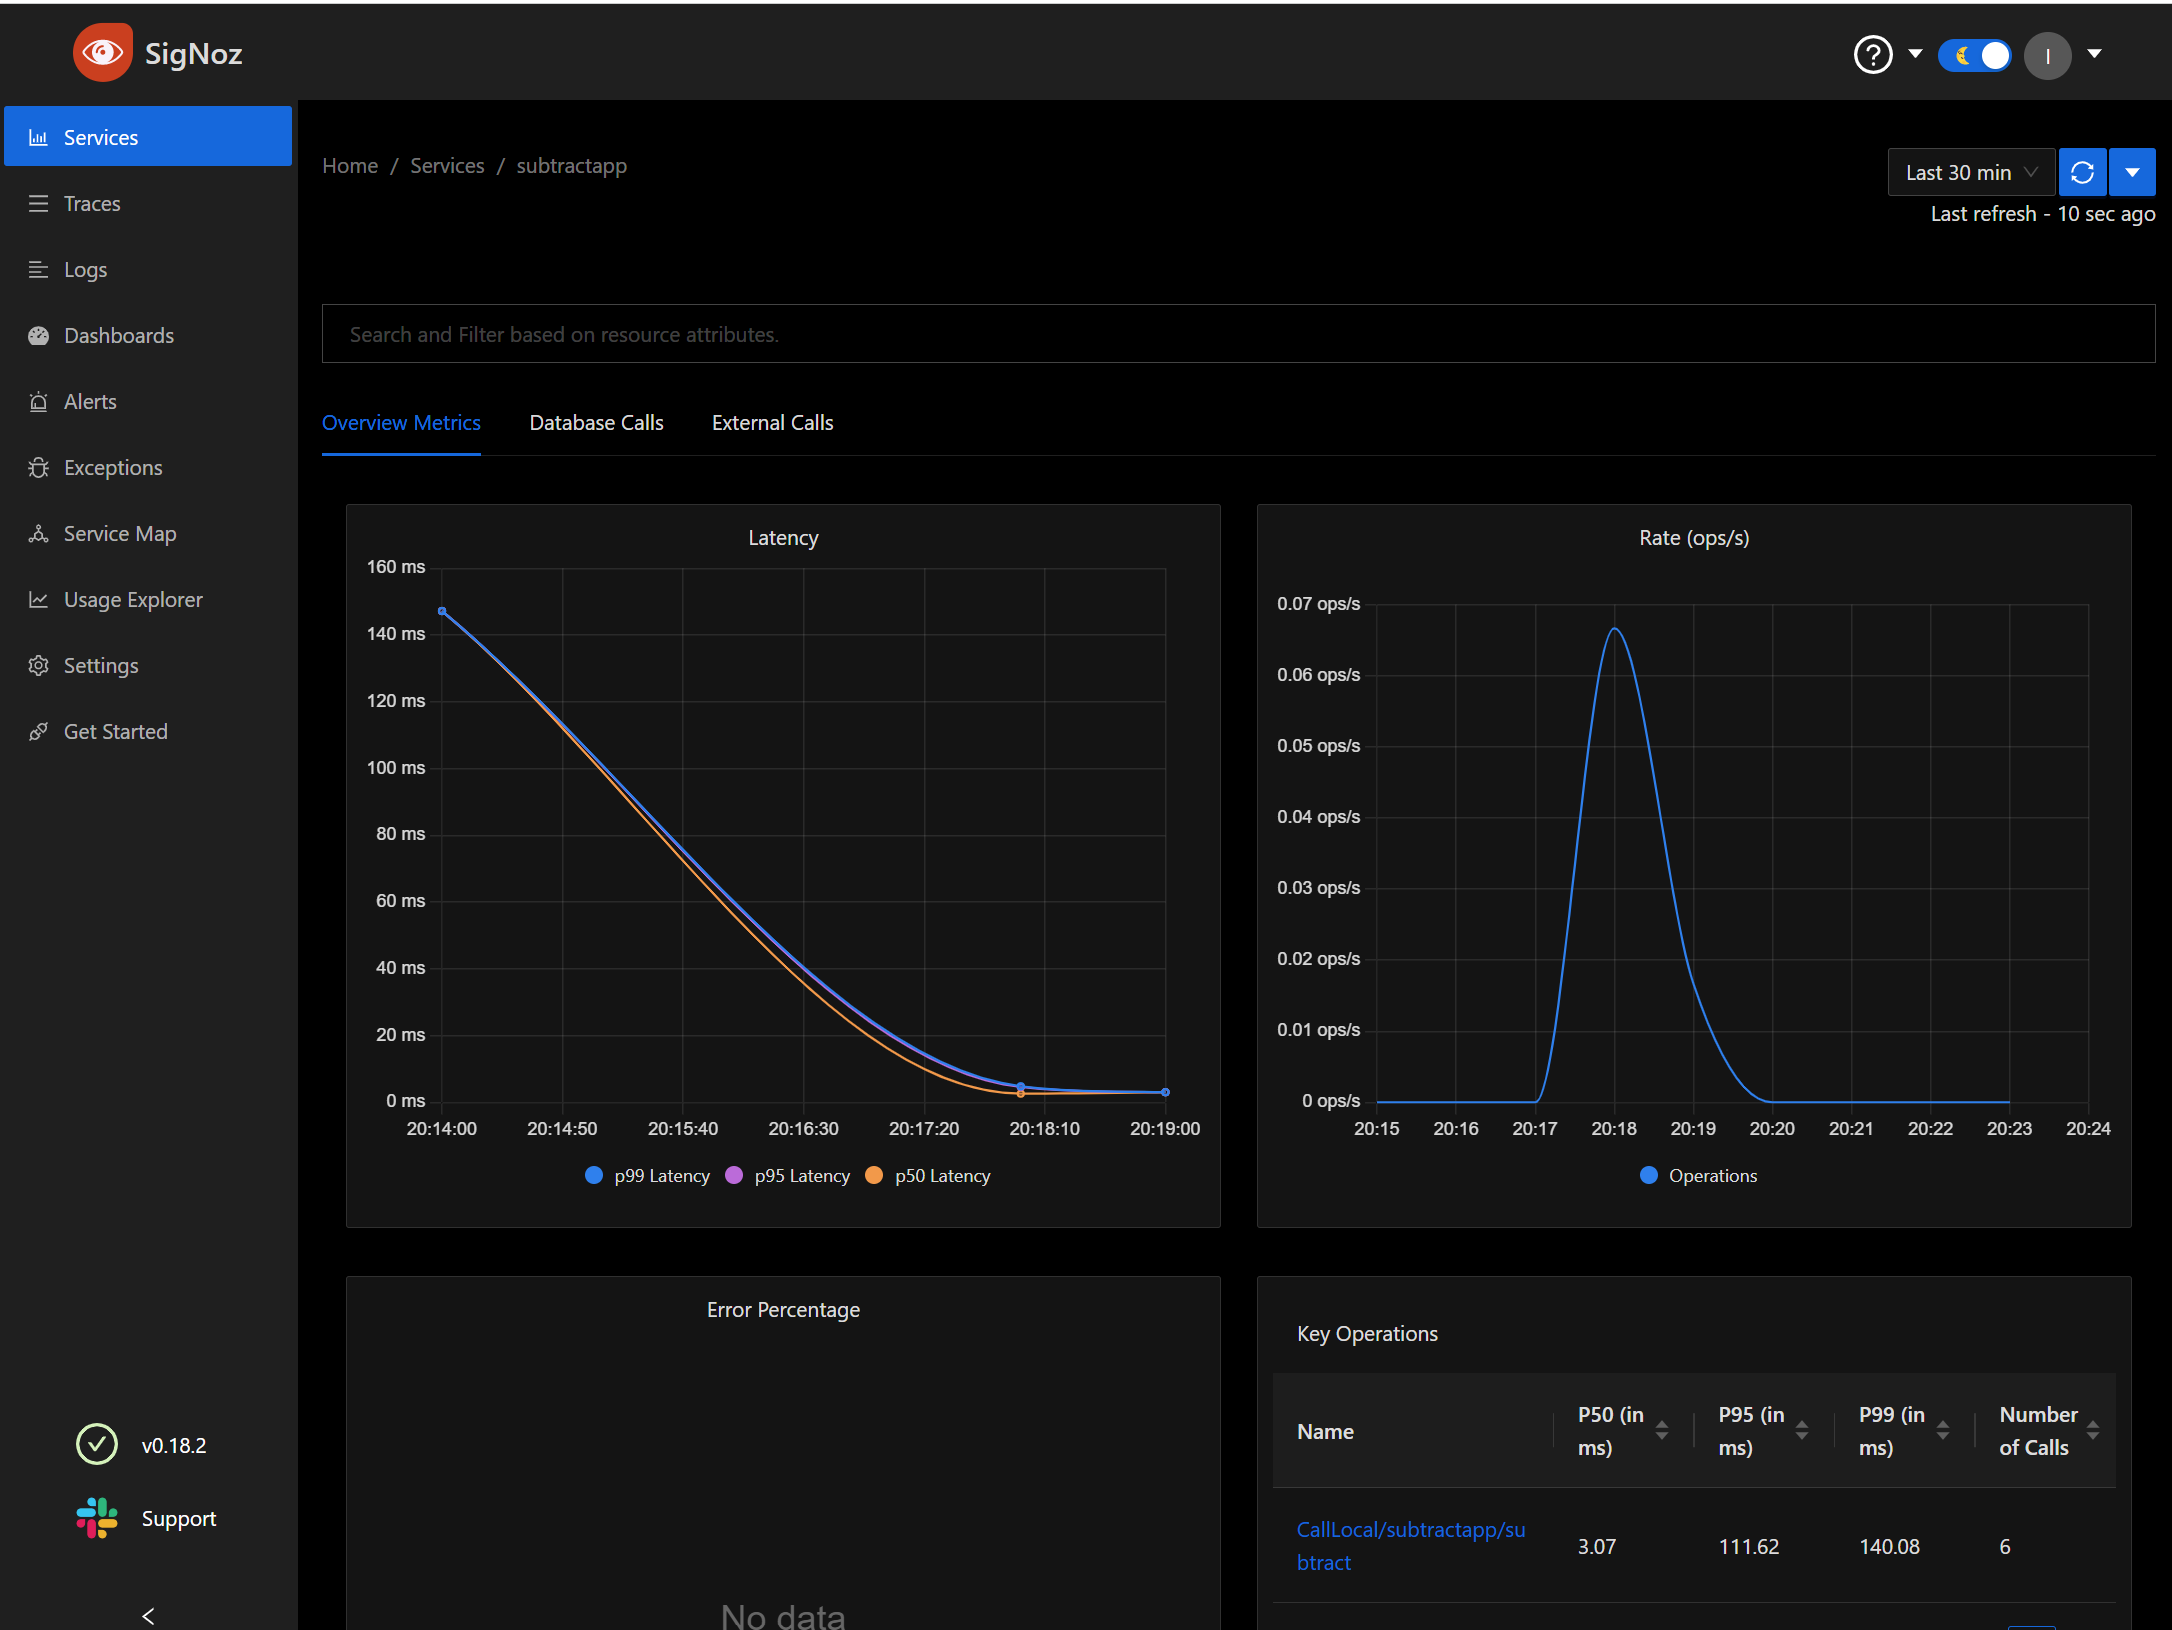
We can see specific details on one of the microservices
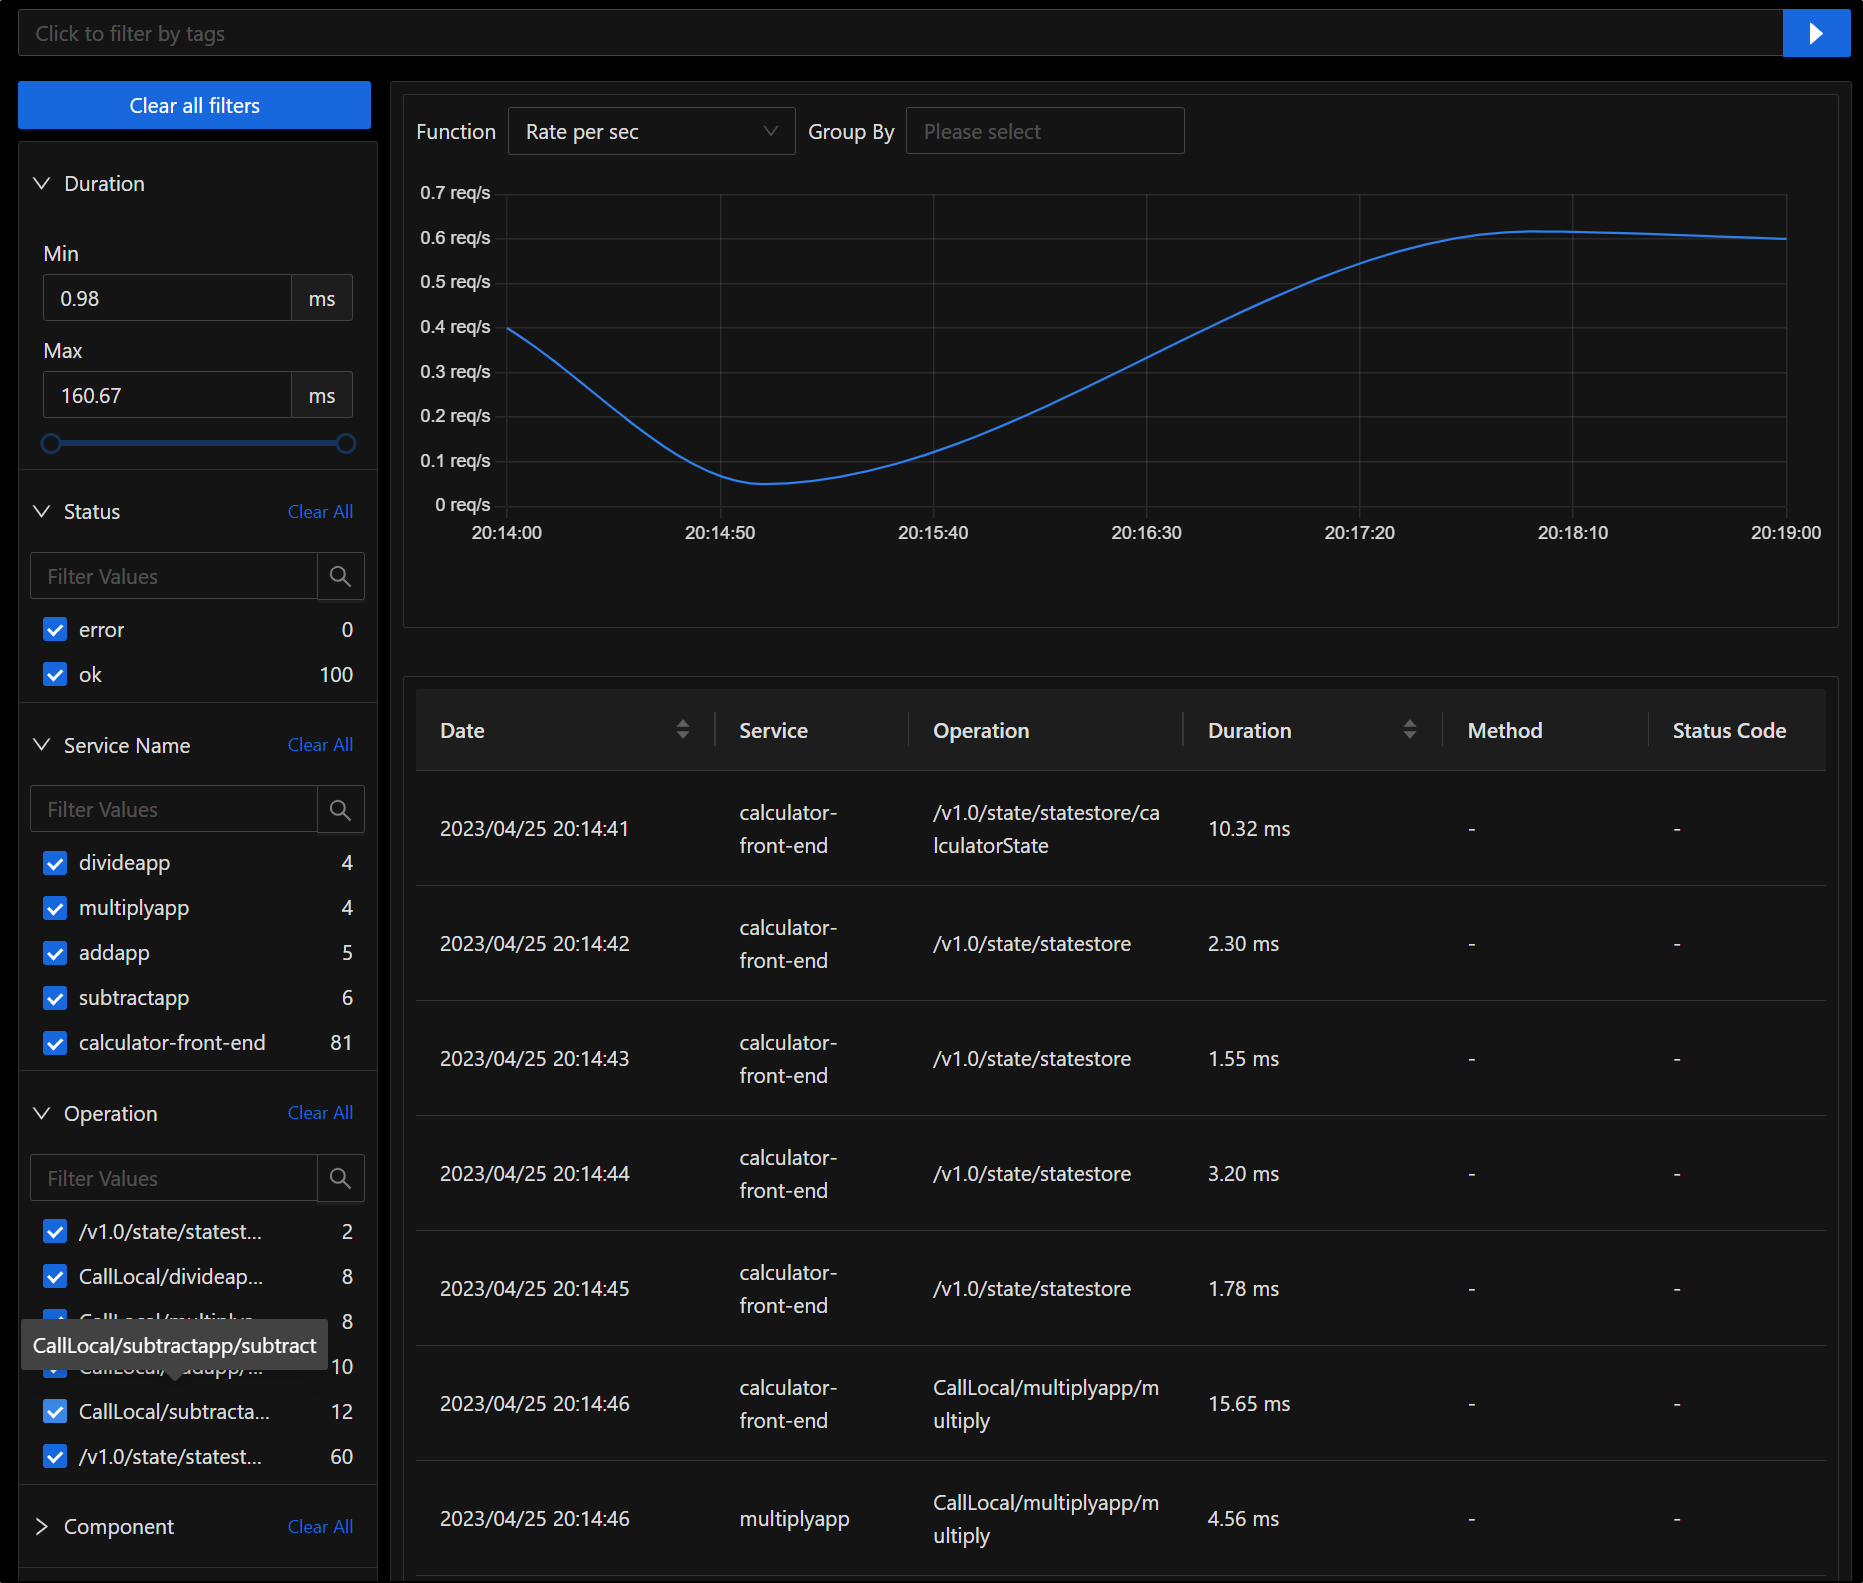
We can also review all the traces
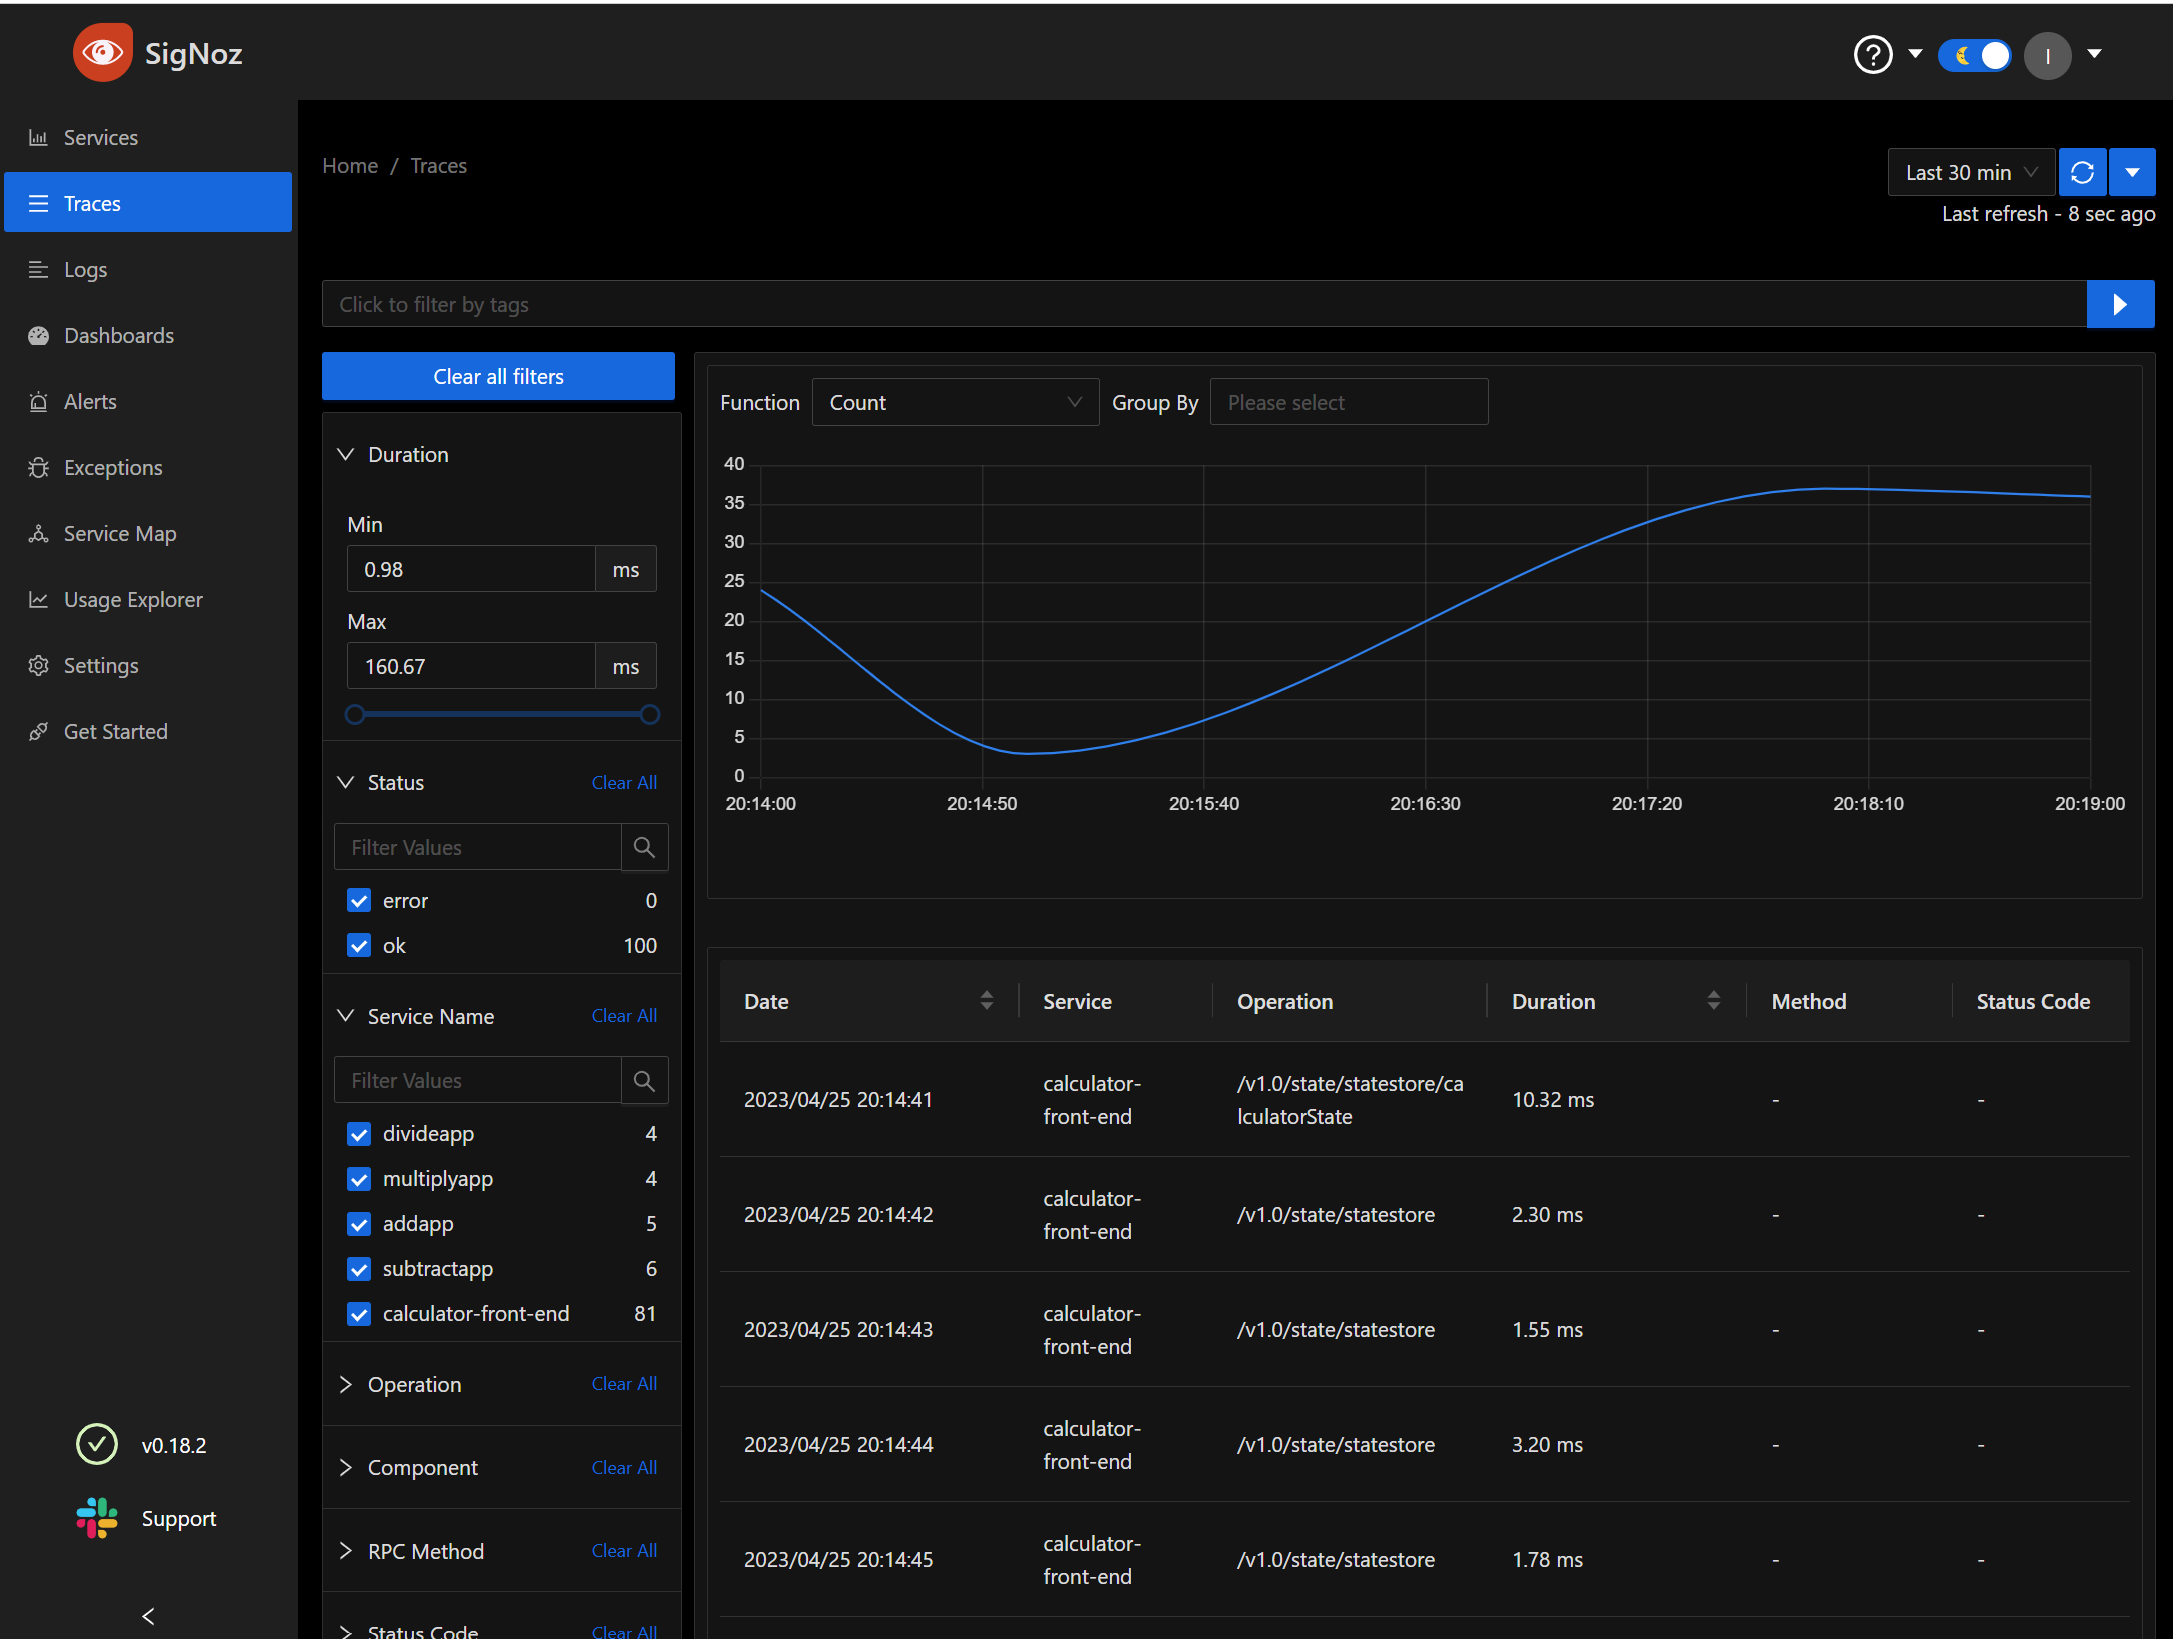
We can do all the things you would expect, such as break down results by time frame, call and graph by Rate/Sec
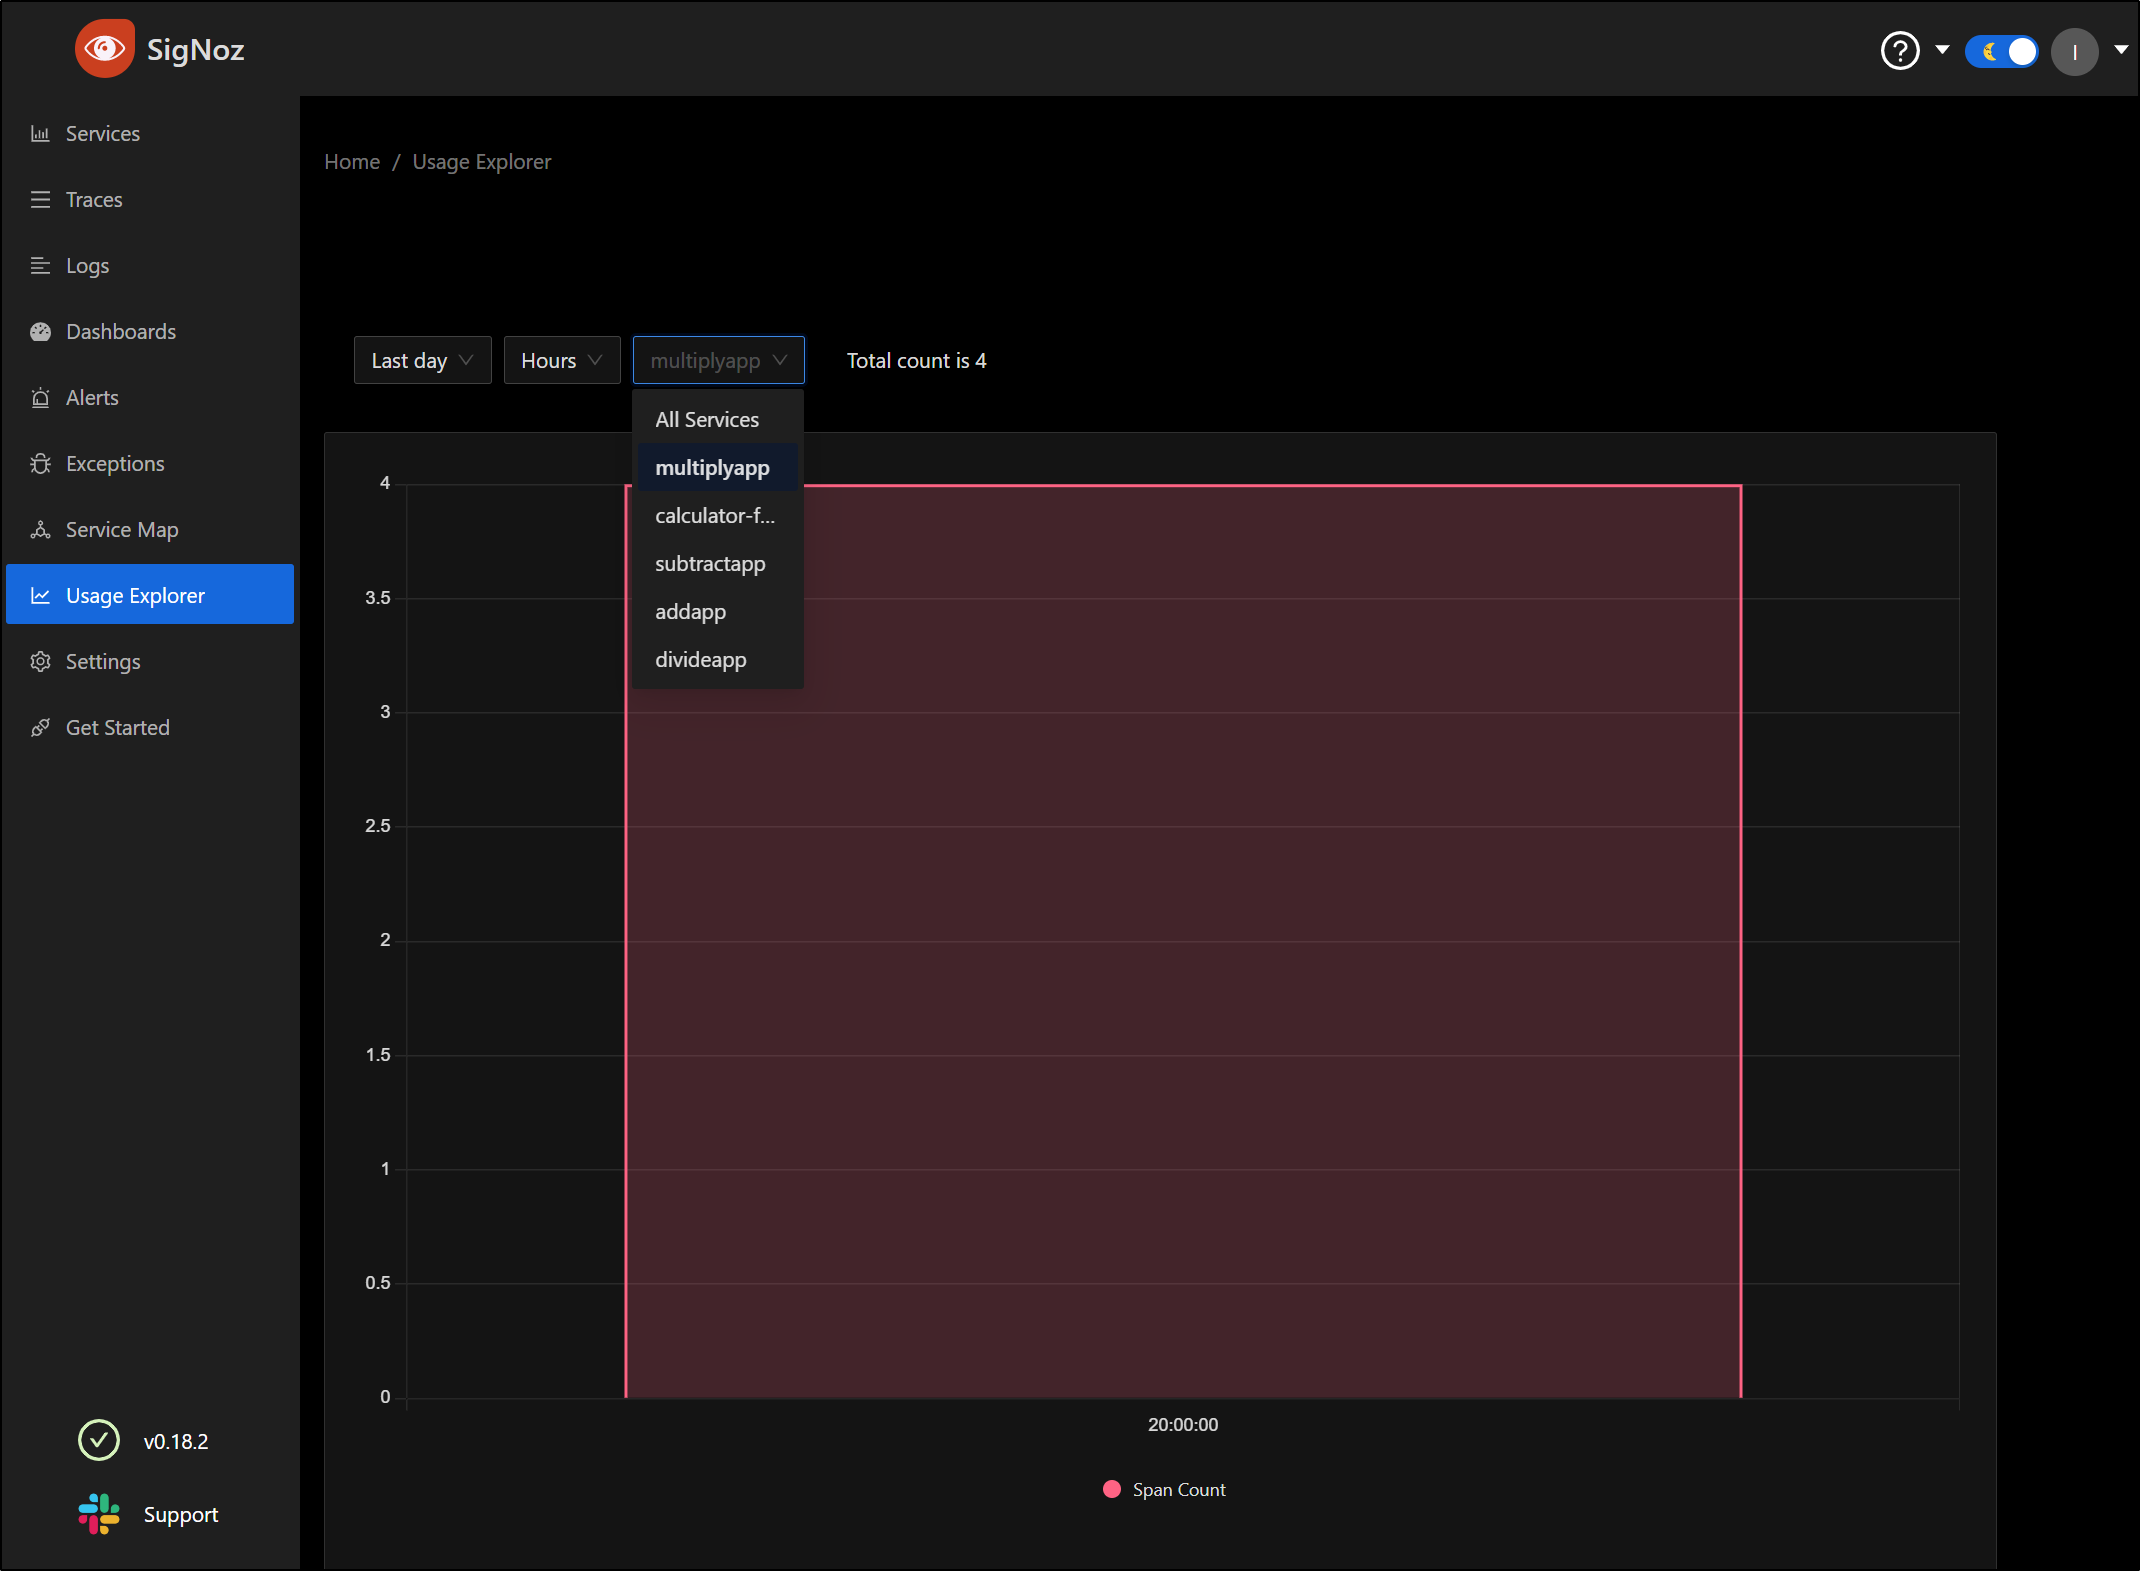
Under usage, we can see spans over time by service
There is a nice Animated Map as well
PVCs
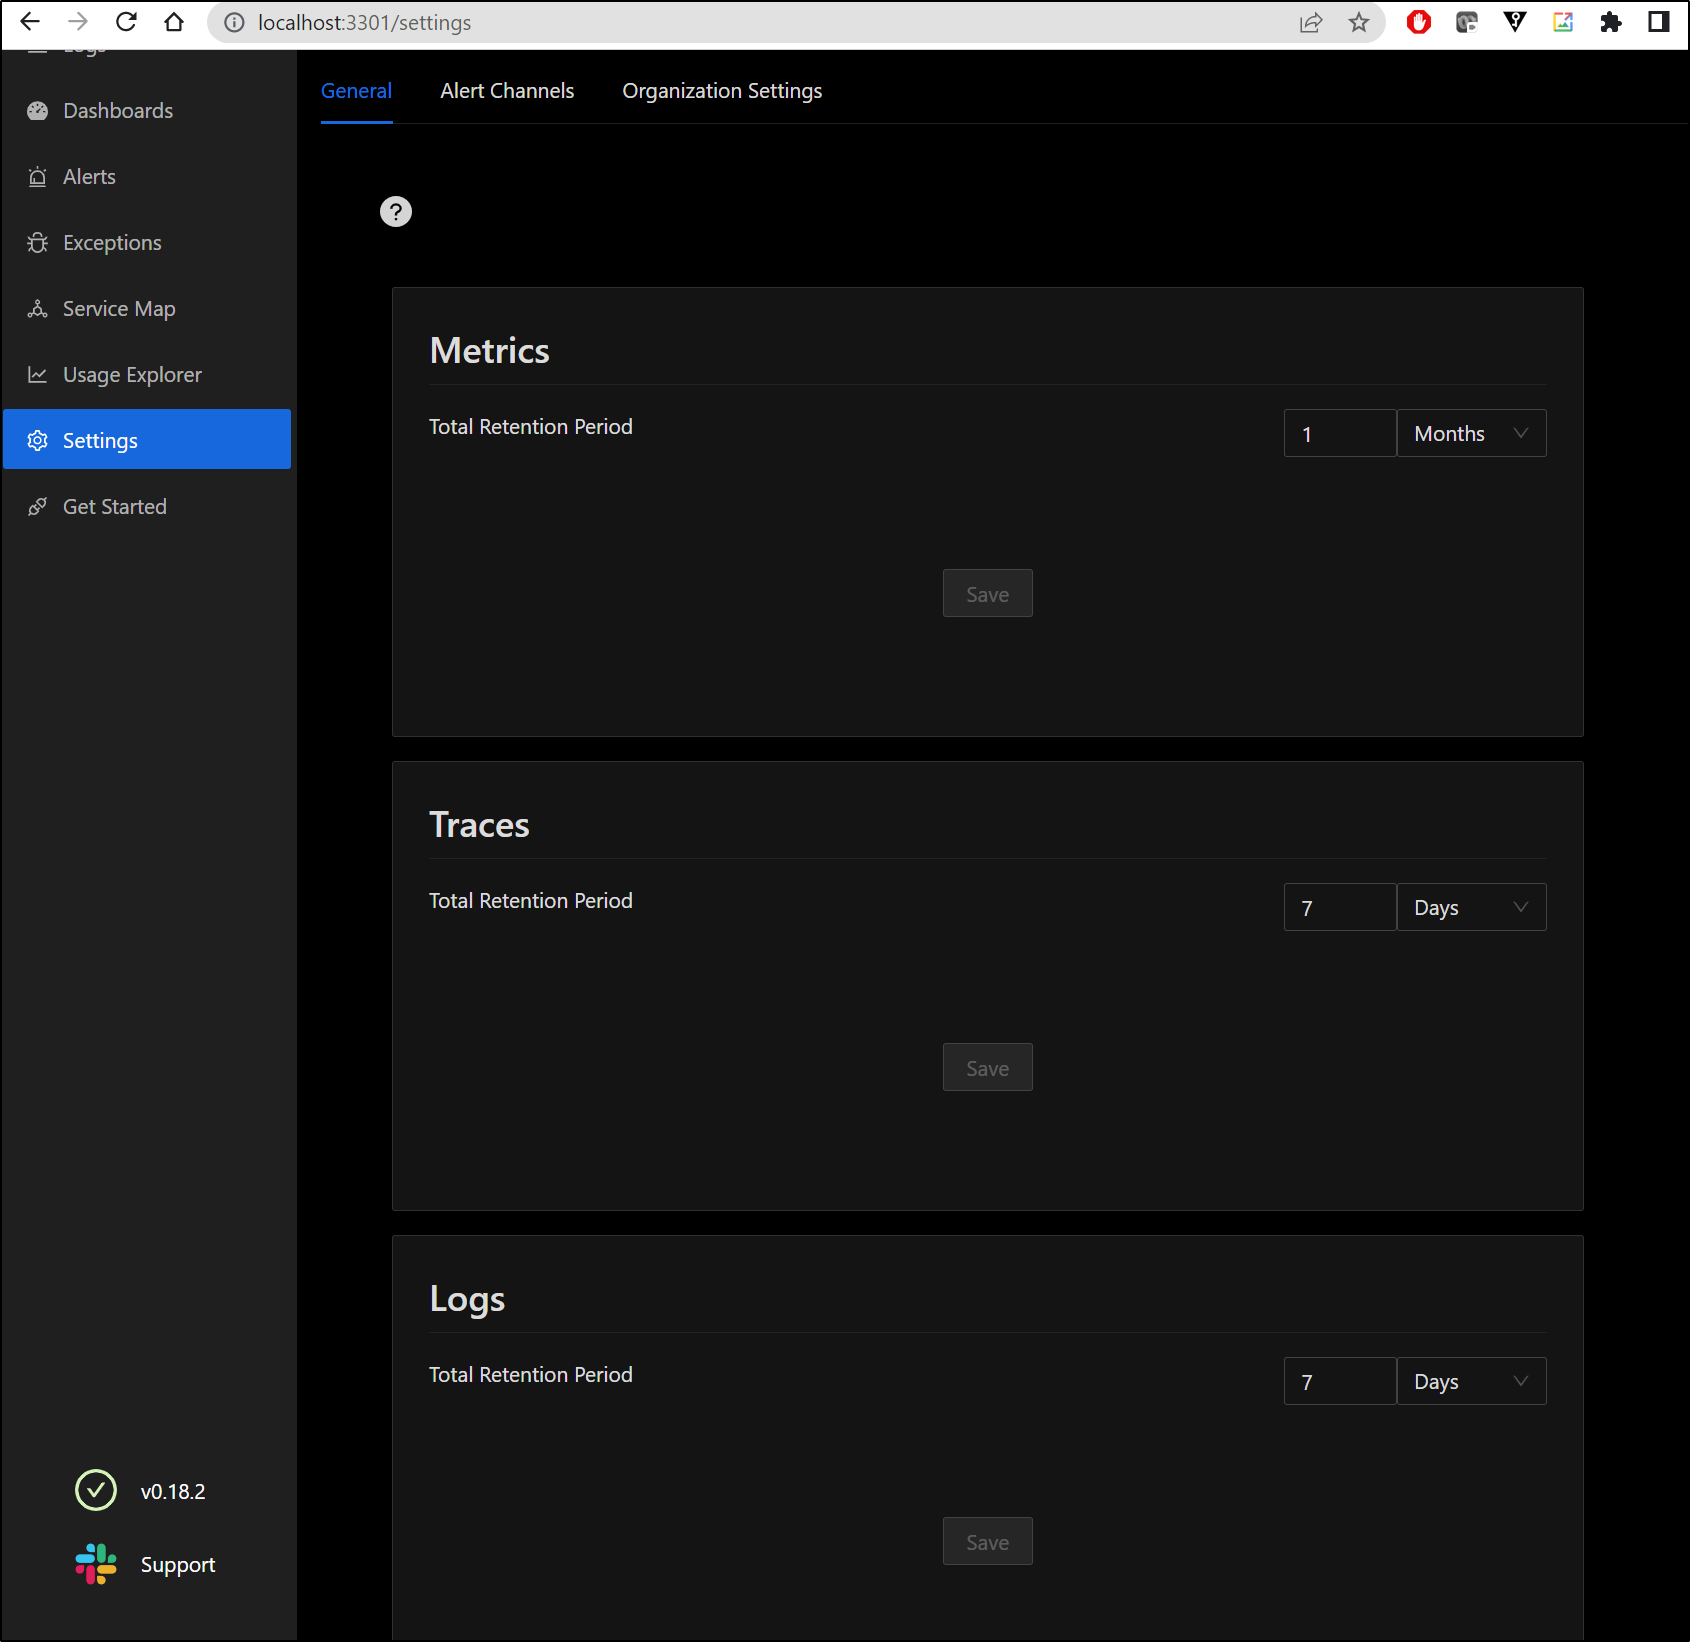
We can set our retention which will affect total storage
The data lands in our PVCs in the namespace
$ kubectl get pvc -n platform
NAME                                                                STATUS   VOLUME                                     CAPACITY   ACCESS MODES   STORAGECLASS   AGE
data-my-release-zookeeper-0                                         Bound    pvc-19c35a26-0913-4084-a9bf-c8398b55fec9   8Gi        RWO            local-path     2d9h
storage-my-release-signoz-alertmanager-0                            Bound    pvc-c7767051-bb48-41b0-b96f-9a39d07ec3bf   100Mi      RWO            local-path     2d9h
signoz-db-my-release-signoz-query-service-0                         Bound    pvc-0dc7624d-114d-49dc-bec1-c22241b54569   1Gi        RWO            local-path     2d9h
data-volumeclaim-template-chi-my-release-clickhouse-cluster-0-0-0   Bound    pvc-f0f9383a-c7ee-4e75-8de7-4e697cf73254   20Gi       RWO            local-path     2d9h
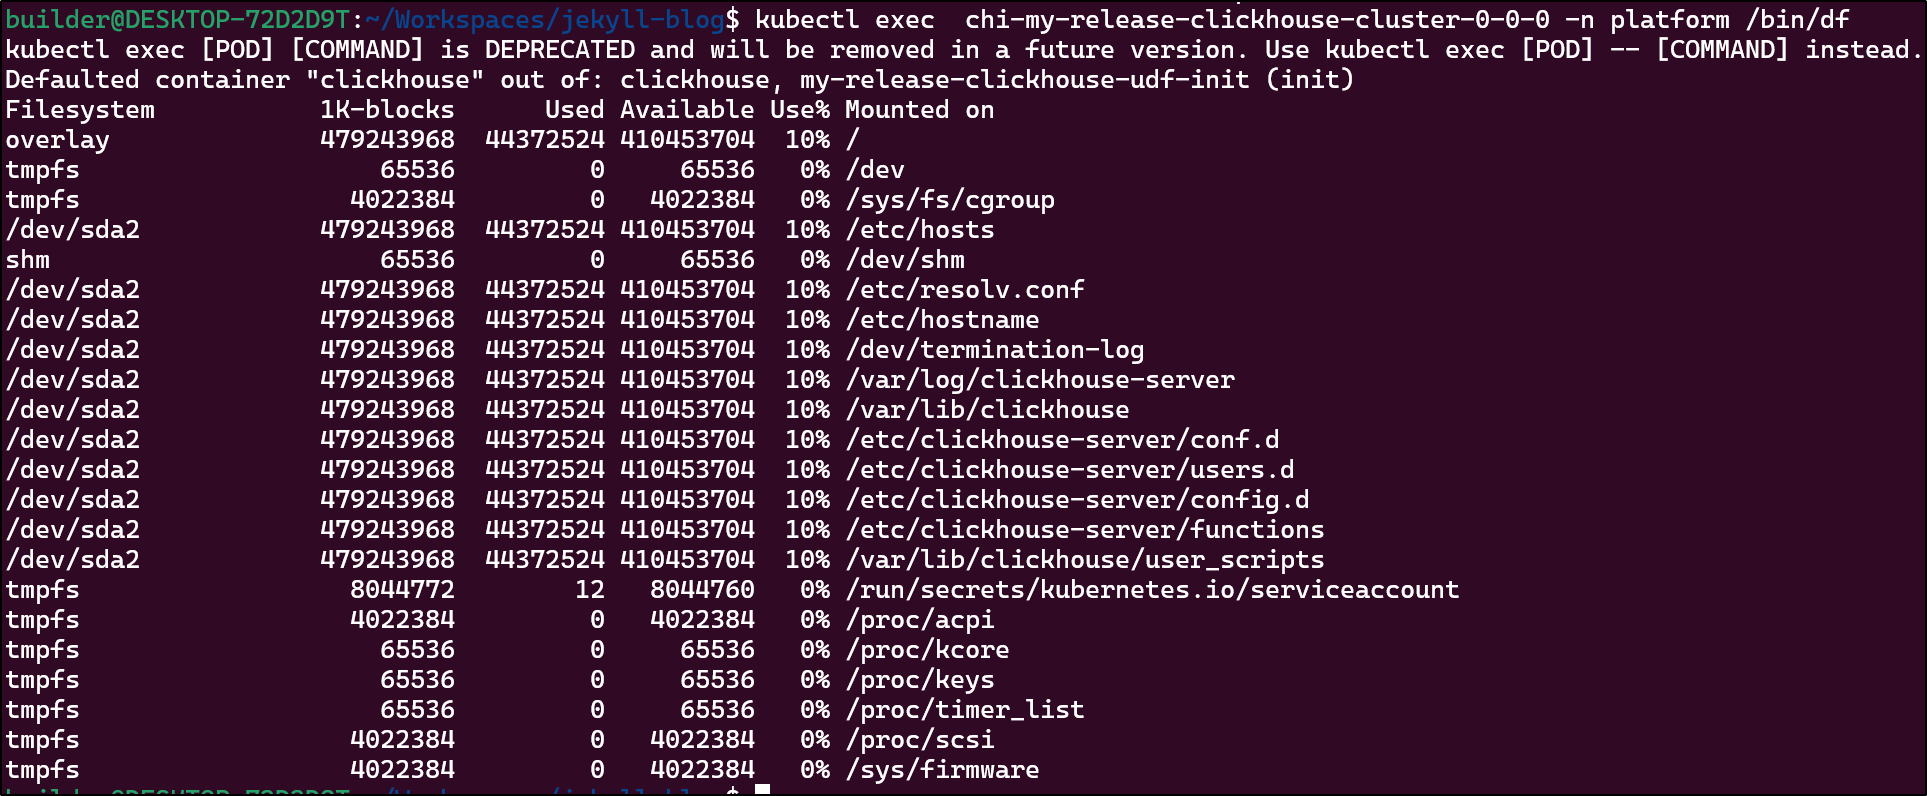
I can check the disk consumed by running df on the container which is about 10%
Summary
SigNoz was founded in 2020 by Ankit Nayan (current CTO) and Pranay Prateek and named after a play on the phrase “Signal vs Noise”.
They have an office in San Francisco and of the developers listed on LinkedIn it would appear that most of their developers are in Bengaluru (which matches this WorkAtAStartup listing).
As I see it, SigNoz has created a refreshingly complete open-source offering. I found it easy to consume logs out of the box as well as traces. I did not explore metrics or routing logs from external sources (though they have guides for FluentBit, FluentD and LogStash)
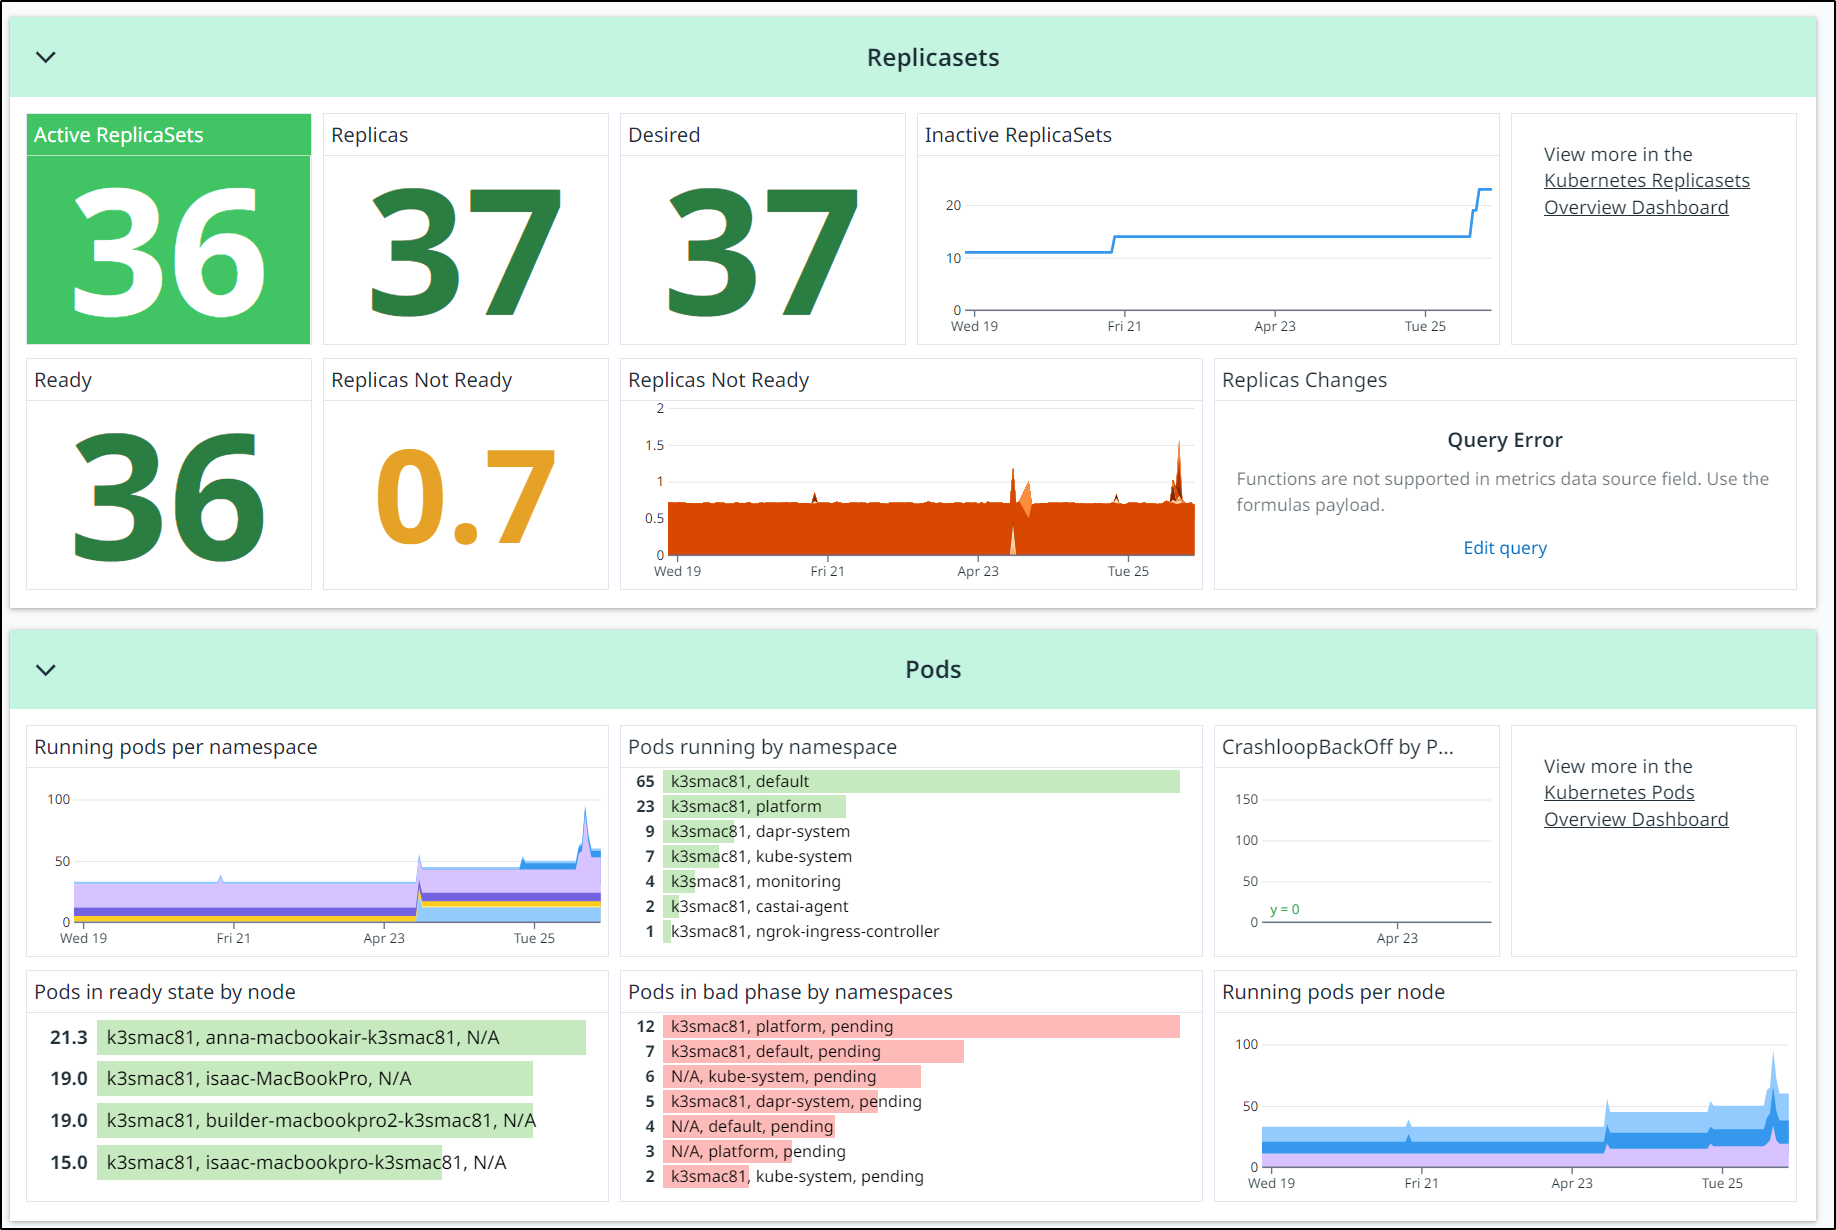
I checked Datadog and found it didn’t overburden the cluster
I could expose SigNoz externally, but port-forwarding is easy
$ kubectl --namespace platform port-forward svc/`kubectl get svc --namespace platform -l "app.kubernetes.io/component=frontend" -o jsonpath="{.items[0].metadata.name}"` 3301:3301
Forwarding from 127.0.0.1:3301 -> 3301
Forwarding from [::1]:3301 -> 3301
Handling connection for 3301
Handling connection for 3301
Handling connection for 3301
Handling connection for 3301
Handling connection for 3301
My next steps will likely be externalizing SigNoz, adding a proper webhook to discord, and seeing how to route external cluster logs into a centralized SigNoz instance.