Published: Apr 20, 2023 by Isaac Johnson
We all know that Prometheus and Grafana can be used to monitor Kubernetes workloads. But today we will explore the other features of Grafana/Prom to monitor Databases, Hosts and more.
How does this powerful OSS stack up to suites like Zabbix, Uptime Kuma, Zipkin and more.
Adding Prom and KSM
Let’s first add the Prometheus and Kube State Metrics charts, then update
$ helm repo add prometheus-community https://prometheus-community.github.io/helm-charts
"prometheus-community" has been added to your repositories
$ helm repo add kube-state-metrics https://kubernetes.github.io/kube-state-metrics
"kube-state-metrics" has been added to your repositories
$ helm repo update
Hang tight while we grab the latest from your chart repositories...
...Successfully got an update from the "kube-state-metrics" chart repository
...Successfully got an update from the "actions-runner-controller" chart repository
...Successfully got an update from the "dapr" chart repository
...Successfully got an update from the "zabbix-community" chart repository
...Successfully got an update from the "kuma" chart repository
...Successfully got an update from the "jfelten" chart repository
...Successfully got an update from the "uptime-kuma" chart repository
...Successfully got an update from the "azure-samples" chart repository
...Successfully got an update from the "hashicorp" chart repository
...Successfully got an update from the "confluentinc" chart repository
...Successfully got an update from the "castai-helm" chart repository
...Successfully got an update from the "longhorn" chart repository
...Successfully got an update from the "rhcharts" chart repository
...Successfully got an update from the "sonarqube" chart repository
...Successfully got an update from the "ngrok" chart repository
...Successfully got an update from the "kubecost" chart repository
...Successfully got an update from the "adwerx" chart repository
...Successfully got an update from the "sumologic" chart repository
...Successfully got an update from the "lifen-charts" chart repository
...Successfully got an update from the "novum-rgi-helm" chart repository
...Successfully got an update from the "open-telemetry" chart repository
...Successfully got an update from the "epsagon" chart repository
...Successfully got an update from the "nginx-stable" chart repository
...Successfully got an update from the "elastic" chart repository
...Successfully got an update from the "harbor" chart repository
...Successfully got an update from the "datadog" chart repository
...Successfully got an update from the "argo-cd" chart repository
...Successfully got an update from the "rook-release" chart repository
...Successfully got an update from the "crossplane-stable" chart repository
...Successfully got an update from the "prometheus-community" chart repository
...Successfully got an update from the "incubator" chart repository
...Successfully got an update from the "newrelic" chart repository
...Successfully got an update from the "gitlab" chart repository
...Successfully got an update from the "rancher-latest" chart repository
...Successfully got an update from the "bitnami" chart repository
...Successfully got an update from the "freshbrewed" chart repository
...Successfully got an update from the "myharbor" chart repository
Update Complete. ⎈Happy Helming!⎈
The first time I tried to install, I got an error
$ helm install prometheus prometheus-community/prometheus
Error: template: prometheus/templates/NOTES.txt:85:46: executing "prometheus/templates/NOTES.txt" at <index .Subcharts "prometheus-pushgateway">: error calling index: index of untyped nil
This is due to using a Helm earlier than 3.7
$ helm version
version.BuildInfo{Version:"v3.6.3", GitCommit:"d506314abfb5d21419df8c7e7e68012379db2354", GitTreeState:"clean", GoVersion:"go1.16.5"}
Upgrading was easy
$ curl -fsSL -o get_helm.sh https://raw.githubusercontent.com/helm/helm/main/scripts/get-helm-3 && chmod u+x get_helm.sh && ./get_helm.sh
Helm v3.11.3 is available. Changing from version v3.6.3.
Downloading https://get.helm.sh/helm-v3.11.3-linux-amd64.tar.gz
Verifying checksum... Done.
Preparing to install helm into /usr/local/bin
helm installed into /usr/local/bin/helm
$ helm version
version.BuildInfo{Version:"v3.11.3", GitCommit:"323249351482b3bbfc9f5004f65d400aa70f9ae7", GitTreeState:"clean", GoVersion:"go1.20.3"}
There is a deprecated API that will spew errors in our Helm deploys if we don’t remove it. I’ll do that now
$ kubectl delete apiservices v1beta1.external.metrics.k8s.io
apiservice.apiregistration.k8s.io "v1beta1.external.metrics.k8s.io" deleted
Next, I’ll add Kube State Metrics
$ helm install kube-state-metrics prometheus-community/kube-state-metrics
NAME: kube-state-metrics
LAST DEPLOYED: Tue Apr 18 06:06:16 2023
NAMESPACE: default
STATUS: deployed
REVISION: 1
TEST SUITE: None
NOTES:
kube-state-metrics is a simple service that listens to the Kubernetes API server and generates metrics about the state of the objects.
The exposed metrics can be found here:
https://github.com/kubernetes/kube-state-metrics/blob/master/docs/README.md#exposed-metrics

The metrics are exported on the HTTP endpoint /metrics on the listening port.
In your case, kube-state-metrics.default.svc.cluster.local:8080/metrics

They are served either as plaintext or protobuf depending on the Accept header.
They are designed to be consumed either by Prometheus itself or by a scraper that is compatible with scraping a Prometheus client endpoint.
Then Prometheus
$ helm install prometheus prometheus-community/prometheus
NAME: prometheus
LAST DEPLOYED: Tue Apr 18 06:06:50 2023
NAMESPACE: default
STATUS: deployed
REVISION: 1
NOTES:
The Prometheus server can be accessed via port 80 on the following DNS name from within your cluster:
prometheus-server.default.svc.cluster.local


Get the Prometheus server URL by running these commands in the same shell:
  export POD_NAME=$(kubectl get pods --namespace default -l "app=prometheus,component=server" -o jsonpath="{.items[0].metadata.name}")
  kubectl --namespace default port-forward $POD_NAME 9090


The Prometheus alertmanager can be accessed via port  on the following DNS name from within your cluster:
prometheus-%!s(<nil>).default.svc.cluster.local


Get the Alertmanager URL by running these commands in the same shell:
  export POD_NAME=$(kubectl get pods --namespace default -l "app=prometheus,component=" -o jsonpath="{.items[0].metadata.name}")
  kubectl --namespace default port-forward $POD_NAME 9093
#################################################################################
######   WARNING: Pod Security Policy has been disabled by default since    #####
######            it deprecated after k8s 1.25+. use                        #####
######            (index .Values "prometheus-node-exporter" "rbac"          #####
###### .          "pspEnabled") with (index .Values                         #####
######            "prometheus-node-exporter" "rbac" "pspAnnotations")       #####
######            in case you still need it.                                #####
#################################################################################


The Prometheus PushGateway can be accessed via port 9091 on the following DNS name from within your cluster:
prometheus-prometheus-pushgateway.default.svc.cluster.local


Get the PushGateway URL by running these commands in the same shell:
  export POD_NAME=$(kubectl get pods --namespace default -l "app=prometheus-pushgateway,component=pushgateway" -o jsonpath="{.items[0].metadata.name}")
  kubectl --namespace default port-forward $POD_NAME 9091

For more information on running Prometheus, visit:
https://prometheus.io/
The steps there at the end aren’t quite right, at least for the label, but close. We can forward to the push gateway using
$ export POD_NAME=$(kubectl get pods --namespace default -l "app.kubernetes.io/name=prometheus-pushgateway" -o jsonpath="{.items[0].metadata.name}")
$ kubectl --namespace default port-forward $POD_NAME 9091
Forwarding from 127.0.0.1:9091 -> 9091
Forwarding from [::1]:9091 -> 9091
Handling connection for 9091
Handling connection for 9091
Handling connection for 9091
Handling connection for 9091
Handling connection for 9091
Handling connection for 9091
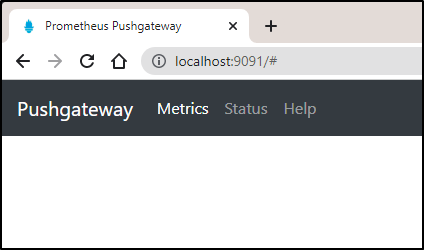
Not very exciting as nothing has been configured to push to the gateway yet.
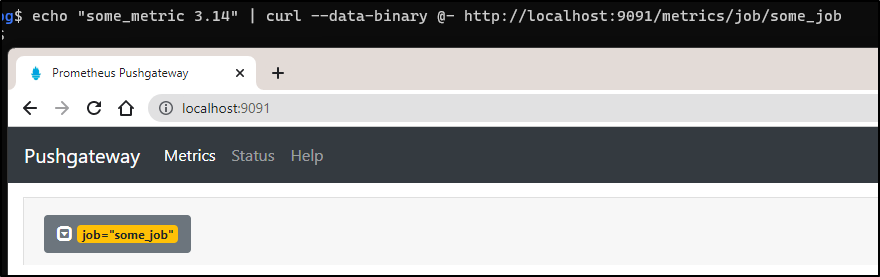
That said, you can test that it works by using a different shell to push a metric up and see it reflected
$ echo "some_metric 3.14" | curl --data-binary @- http://localhost:9091/metrics/job/some_job
Grafana
Adding Grafana is just as easy.
Note: Later near the end I cover setting up email via Sendgrid. This requires updating the helm chart and in doing so, it removes all the Data Sources that you might have already configured. If you are doing this on a host you intend to keep, I would recommend skipping ahead to add the values for SMTP at this time
We add the chart and update
$ helm repo add grafana https://grafana.github.io/helm-charts
"grafana" has been added to your repositories
$ helm repo update
Hang tight while we grab the latest from your chart repositories...
...Successfully got an update from the "confluentinc" chart repository
...Successfully got an update from the "zabbix-community" chart repository
...Successfully got an update from the "kube-state-metrics" chart repository
...Successfully got an update from the "longhorn" chart repository
...Successfully got an update from the "actions-runner-controller" chart repository
...Successfully got an update from the "kuma" chart repository
...Successfully got an update from the "jfelten" chart repository
...Successfully got an update from the "ngrok" chart repository
...Successfully got an update from the "azure-samples" chart repository
...Successfully got an update from the "uptime-kuma" chart repository
...Successfully got an update from the "novum-rgi-helm" chart repository
...Successfully got an update from the "sonarqube" chart repository
...Successfully got an update from the "rhcharts" chart repository
...Successfully got an update from the "castai-helm" chart repository
...Successfully got an update from the "dapr" chart repository
...Successfully got an update from the "adwerx" chart repository
...Successfully got an update from the "freshbrewed" chart repository
...Successfully got an update from the "myharbor" chart repository
...Successfully got an update from the "kubecost" chart repository
...Successfully got an update from the "hashicorp" chart repository
...Successfully got an update from the "sumologic" chart repository
...Successfully got an update from the "open-telemetry" chart repository
...Successfully got an update from the "lifen-charts" chart repository
...Successfully got an update from the "rook-release" chart repository
...Successfully got an update from the "epsagon" chart repository
...Successfully got an update from the "nginx-stable" chart repository
...Successfully got an update from the "elastic" chart repository
...Successfully got an update from the "argo-cd" chart repository
...Successfully got an update from the "harbor" chart repository
...Successfully got an update from the "datadog" chart repository
...Successfully got an update from the "incubator" chart repository
...Successfully got an update from the "grafana" chart repository
...Successfully got an update from the "newrelic" chart repository
...Successfully got an update from the "crossplane-stable" chart repository
...Successfully got an update from the "prometheus-community" chart repository
...Successfully got an update from the "gitlab" chart repository
...Successfully got an update from the "rancher-latest" chart repository
...Successfully got an update from the "bitnami" chart repository
Update Complete. ⎈Happy Helming!⎈
Then install with helm
$ helm install grafana grafana/grafana
NAME: grafana
LAST DEPLOYED: Tue Apr 18 06:15:00 2023
NAMESPACE: default
STATUS: deployed
REVISION: 1
NOTES:
1. Get your 'admin' user password by running:

   kubectl get secret --namespace default grafana -o jsonpath="{.data.admin-password}" | base64 --decode ; echo


2. The Grafana server can be accessed via port 80 on the following DNS name from within your cluster:

   grafana.default.svc.cluster.local

   Get the Grafana URL to visit by running these commands in the same shell:
     export POD_NAME=$(kubectl get pods --namespace default -l "app.kubernetes.io/name=grafana,app.kubernetes.io/instance=grafana" -o jsonpath="{.items[0].metadata.name}")
     kubectl --namespace default port-forward $POD_NAME 3000

3. Login with the password from step 1 and the username: admin
#################################################################################
######   WARNING: Persistence is disabled!!! You will lose your data when   #####
######            the Grafana pod is terminated.                            #####
#################################################################################
As shown, we can fetch the default password
$ kubectl get secret --namespace default grafana -o jsonpath="{.data.admin-password}" | base64 --decode && echo
Y4WPtos7BtBzHvdxqmnxjIN6wct9bT2ObjELYL95
Then Port Forward
builder@DESKTOP-QADGF36:~/Workspaces/jekyll-blog$ kubectl --namespace default port-forward `kubectl get pods --namespace default -l "app.kubernetes.io/name=grafana,app.kubernetes.io/instance=grafana" -o jsonpath="{.items[0].metadata.name}"` 3000
Forwarding from 127.0.0.1:3000 -> 3000
Forwarding from [::1]:3000 -> 3000
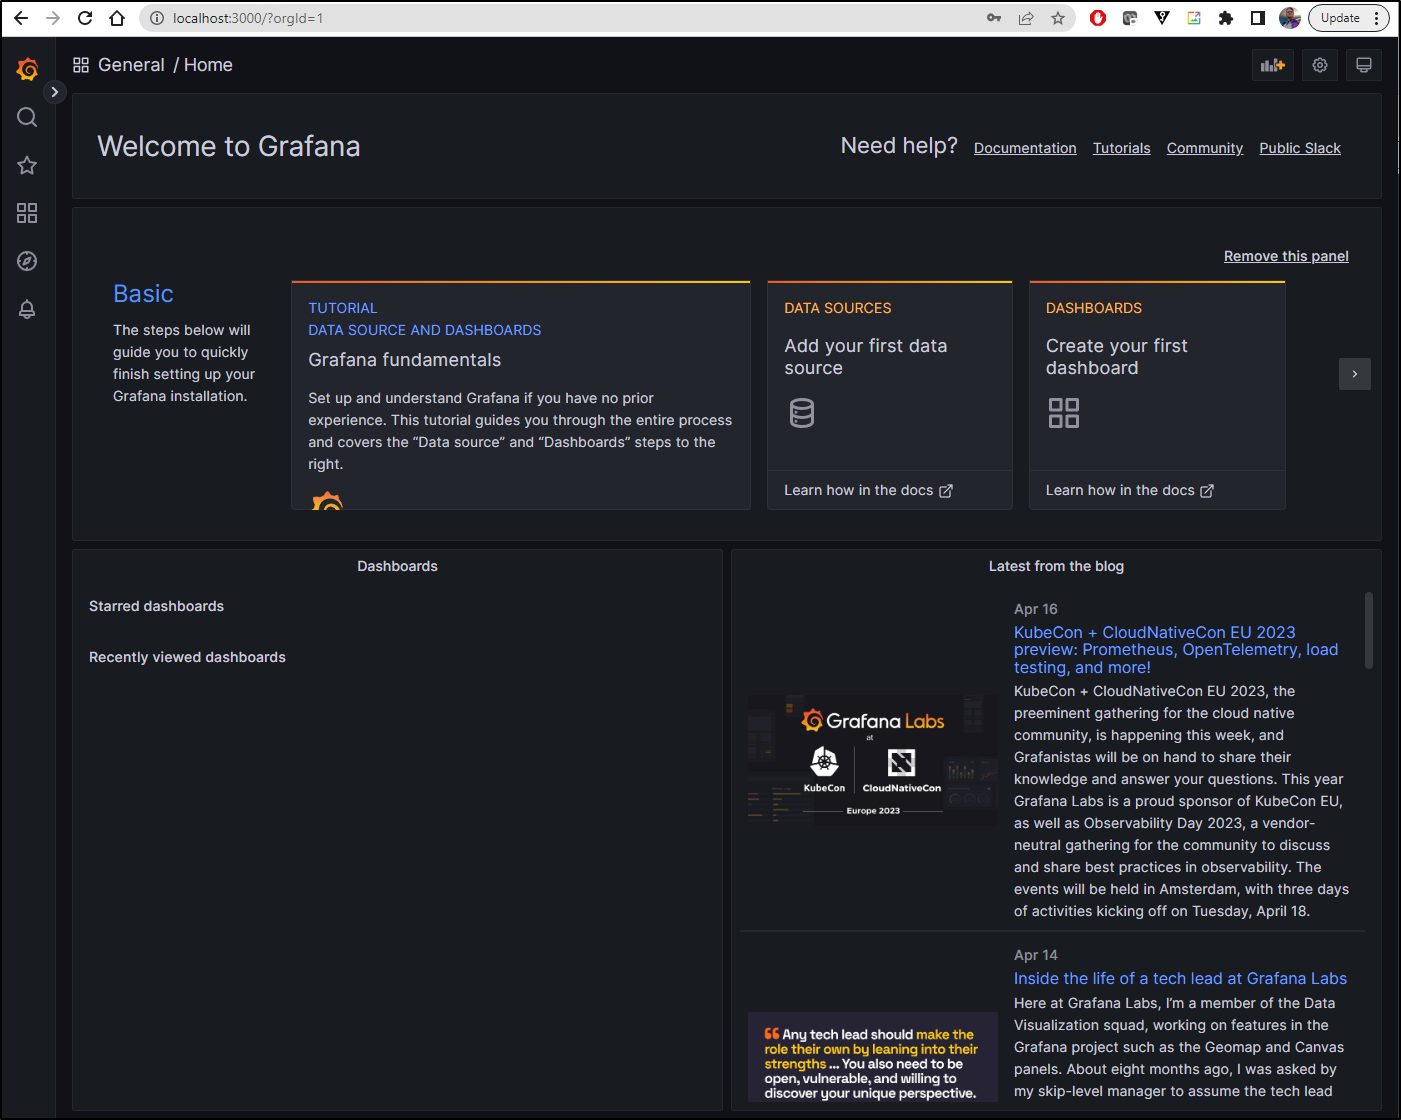
Once logged in, we get the initial Dashboard
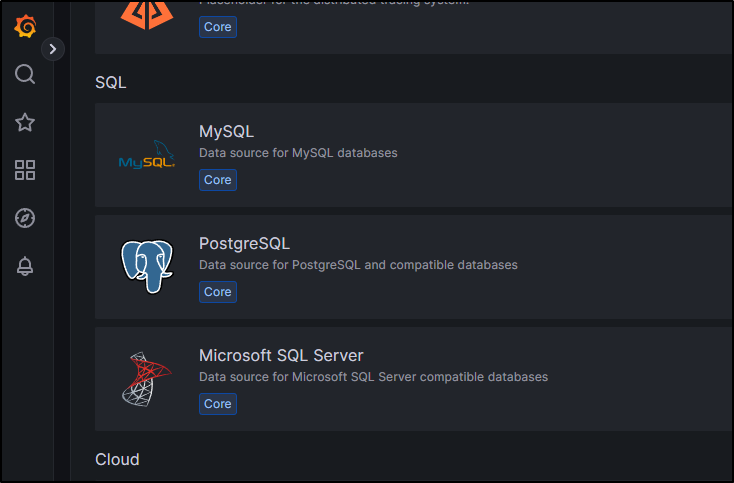
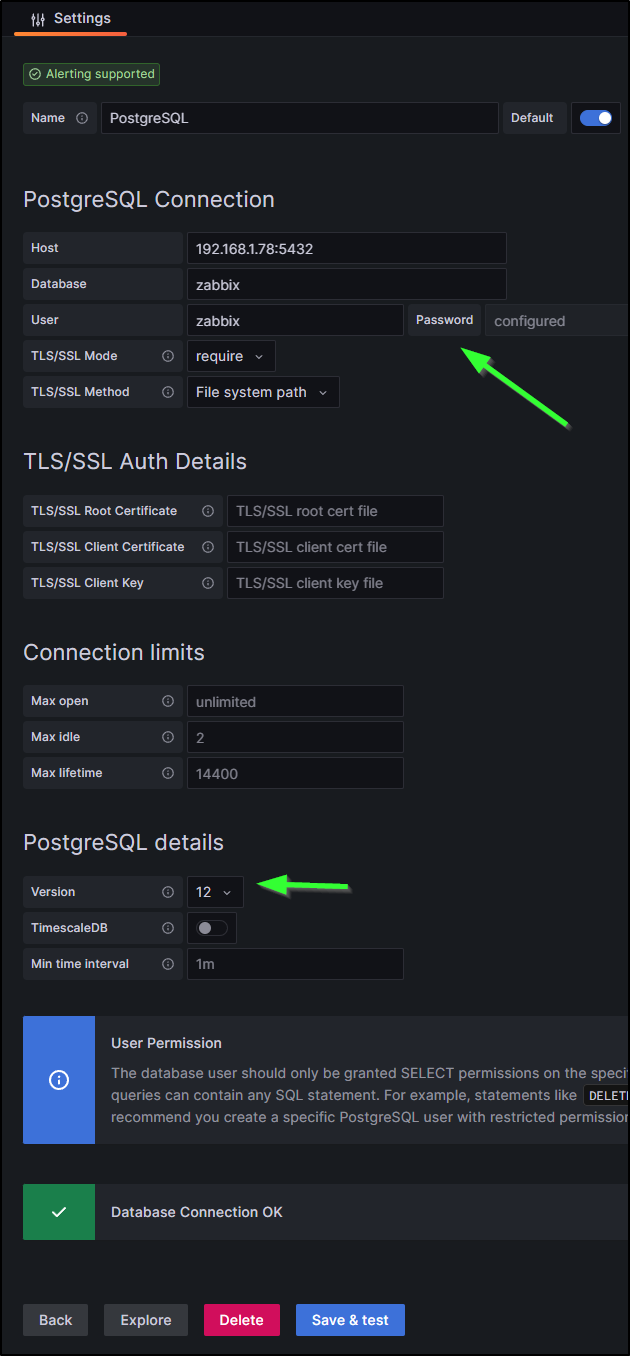
The first monitor I’ll add is for PostgreSQL which backs my Zabbix and Harbor applications.
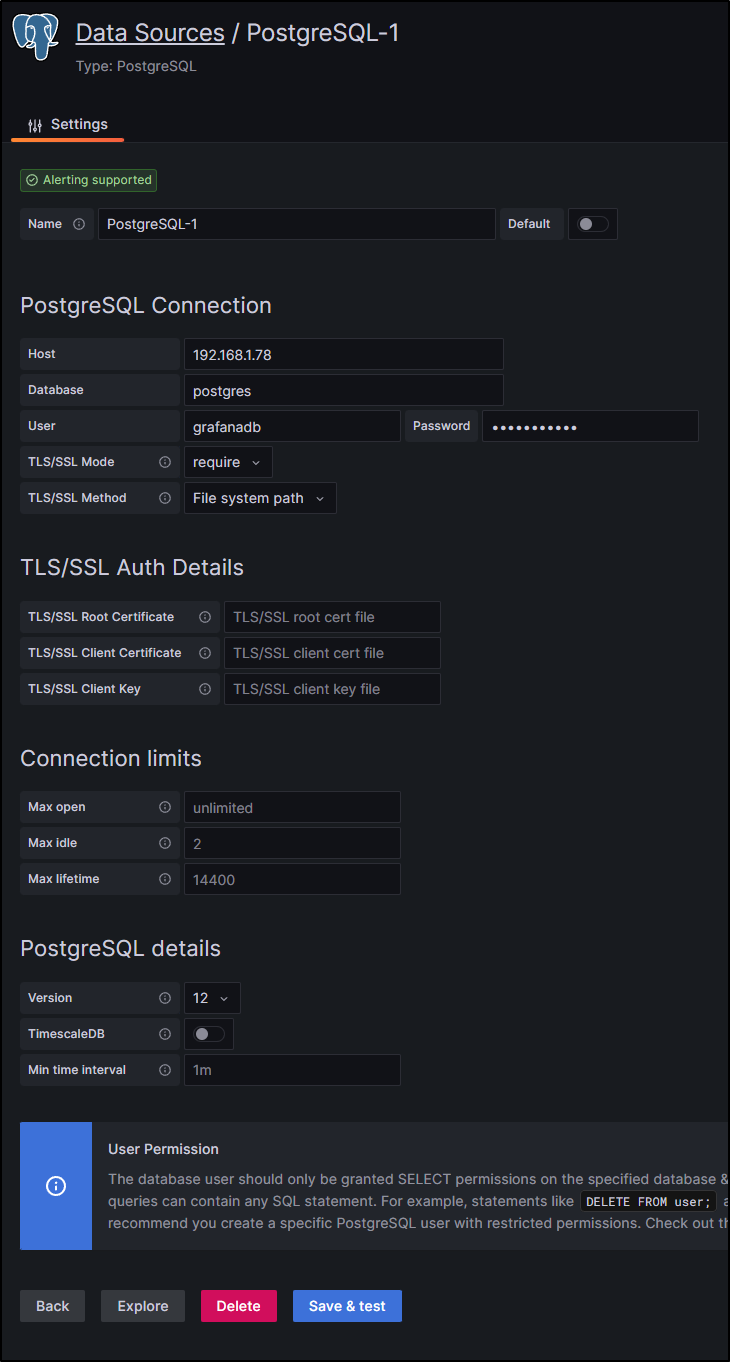
Click Add Data Sources then choose PostgreSQL
I can save and test, and if needed, go back and change the password or Postgres version
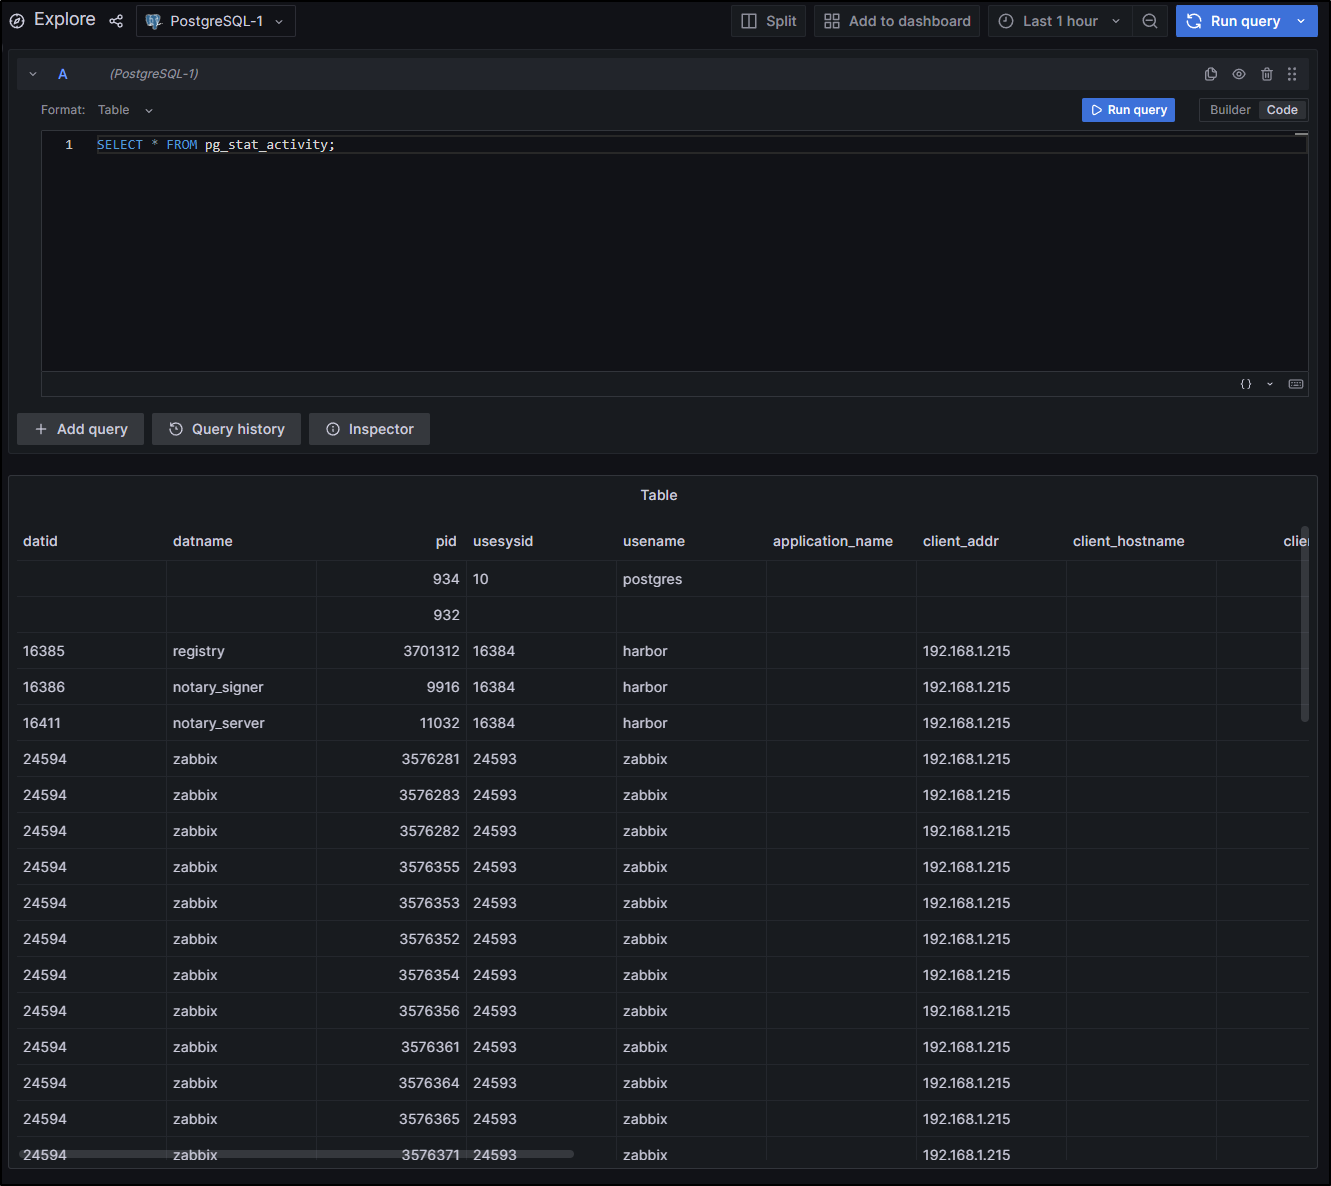
I can now explore some details, like querying a table
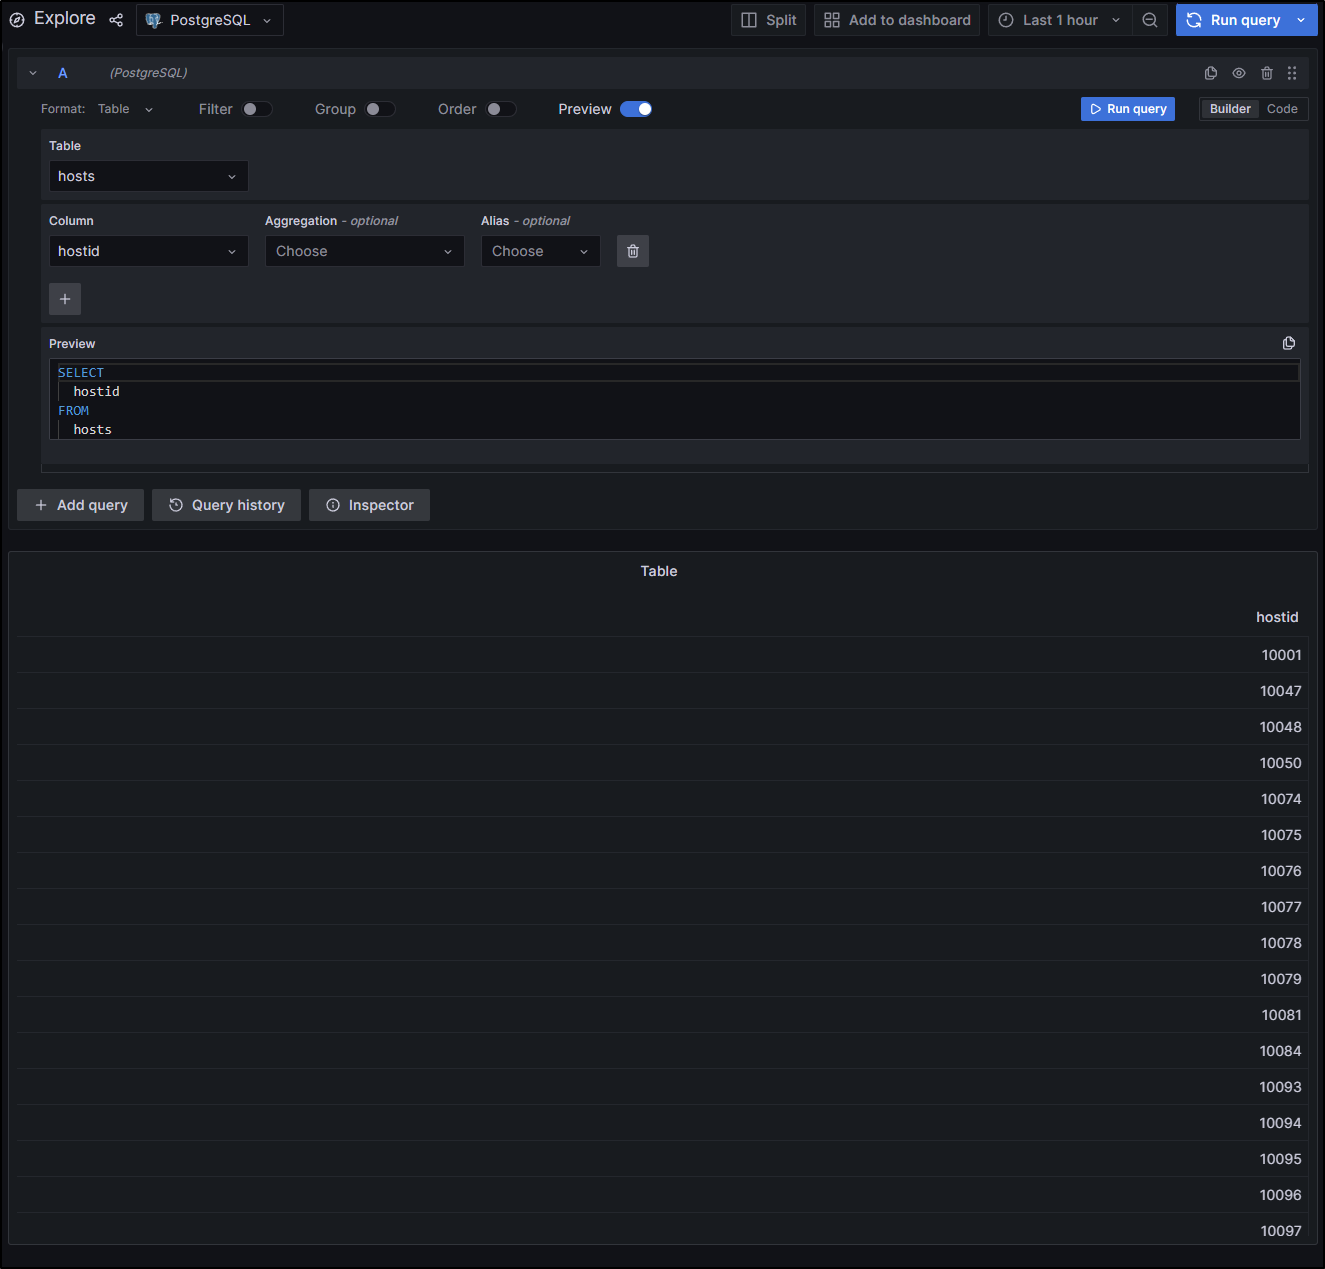
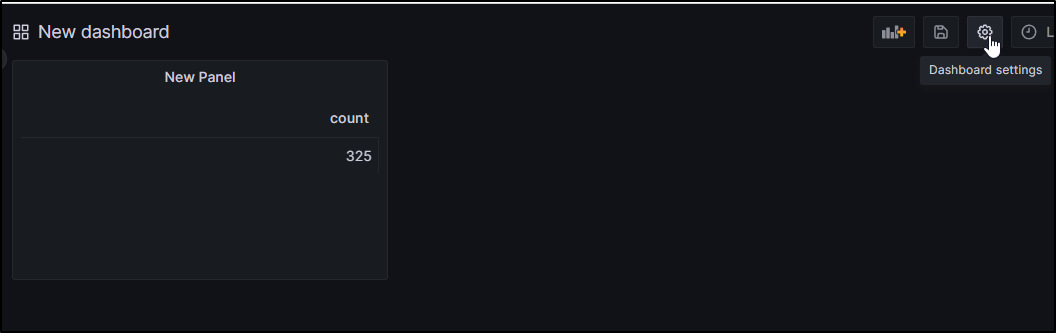
Let’s say I have a simple query - the number of hosts that are enabled

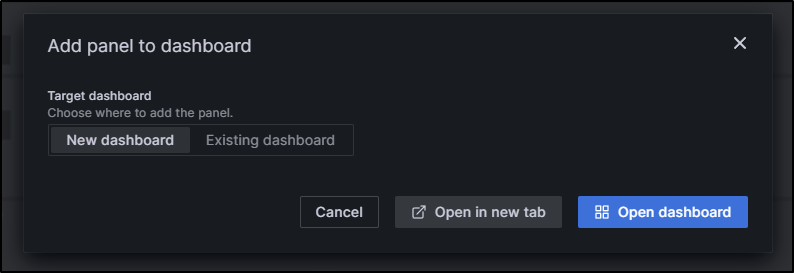
I can click “Add to dashboard”, then create a “New Dashboard”
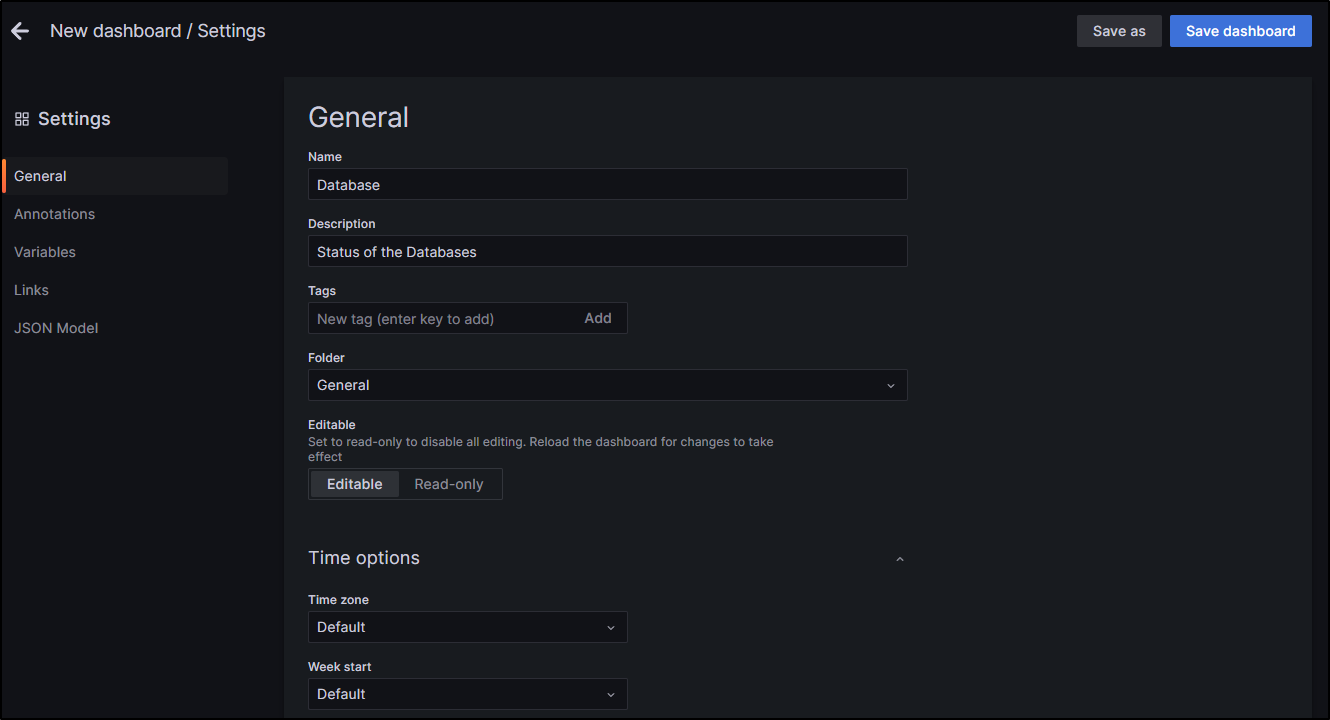
I’ll “configure” the new dashboard settings
I’ll give it a name and description, and optionally change the timezone.
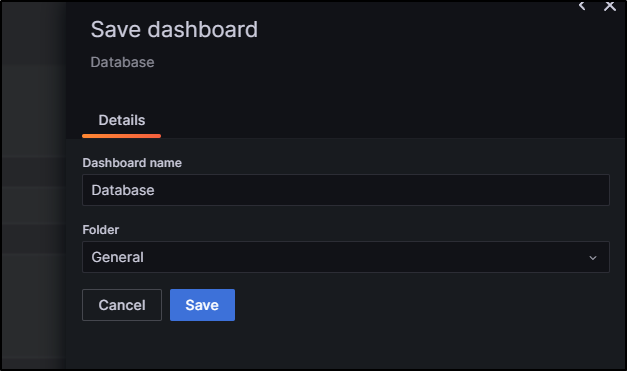
Then click “Save dashboard”, confirm values and click “Save”
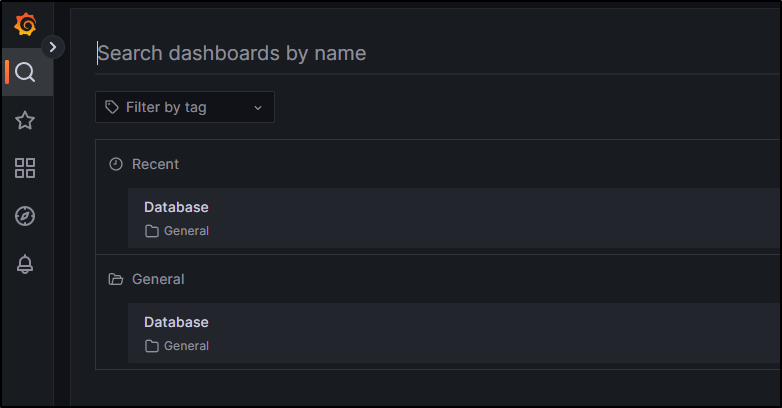
Now under dashboards, we can see our new Database Dashboard
I’d like to monitor more details, so I’ll create a user for Grafana in the cluster with a password
isaac@isaac-MacBookAir:~$ sudo su - postgres
[sudo] password for isaac:
postgres@isaac-MacBookAir:~$ psql
psql (12.14 (Ubuntu 12.14-0ubuntu0.20.04.1))
Type "help" for help.

postgres=# create user grafanadb superuser;
CREATE ROLE
postgres=# alter user grafanadb with password 'notthepasswordiused';
ALTER ROLE
postgres=# \du;
                                   List of roles
 Role name |                         Attributes                         | Member of
-----------+------------------------------------------------------------+-----------
 grafanadb | Superuser                                                  | {}
 harbor    | Superuser, Create role, Create DB                          | {}
 instana   |                                                            | {}
 postgres  | Superuser, Create role, Create DB, Replication, Bypass RLS | {}
 zabbix    |                                                            | {}

postgres=#
Then I’ll add a new Database source in Grafana
Which I can now use to see all connections
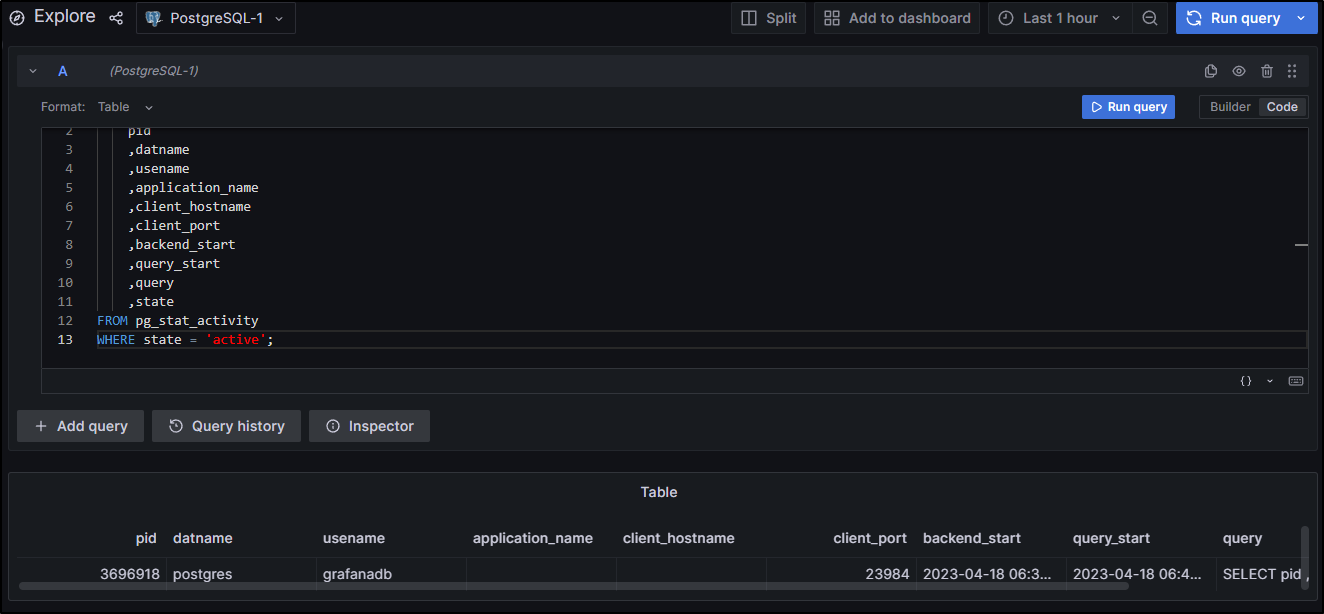
Or just active with the SQL
SELECT
    pid
    ,datname
    ,usename
    ,application_name
    ,client_hostname
    ,client_port
    ,backend_start
    ,query_start
    ,query
    ,state
FROM pg_stat_activity
WHERE state = 'active';
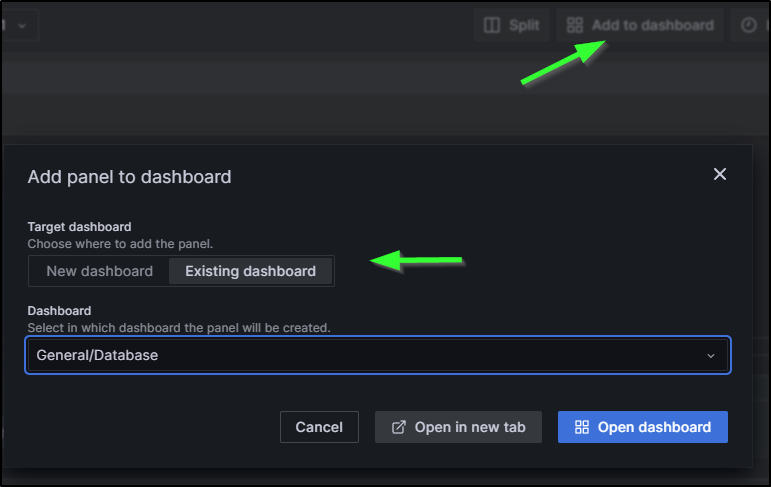
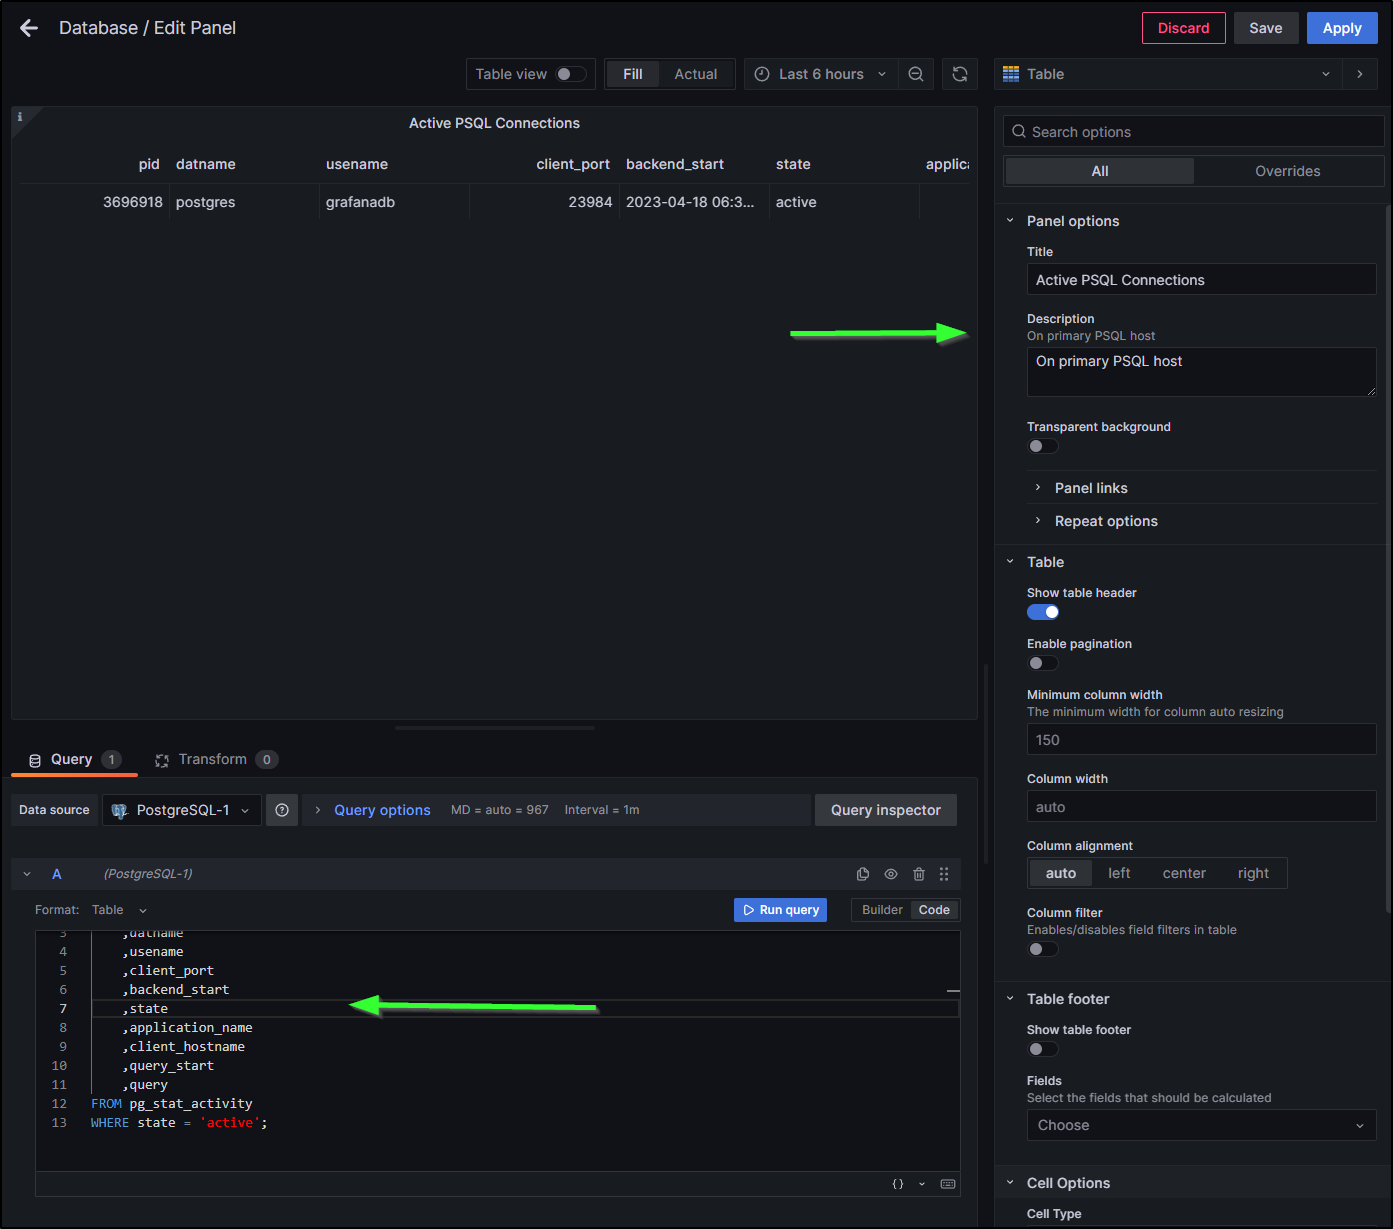
I’ll add it to the Dashboard, though this time I’ll select my existing Dashboard
I’ll then want to rename my panel
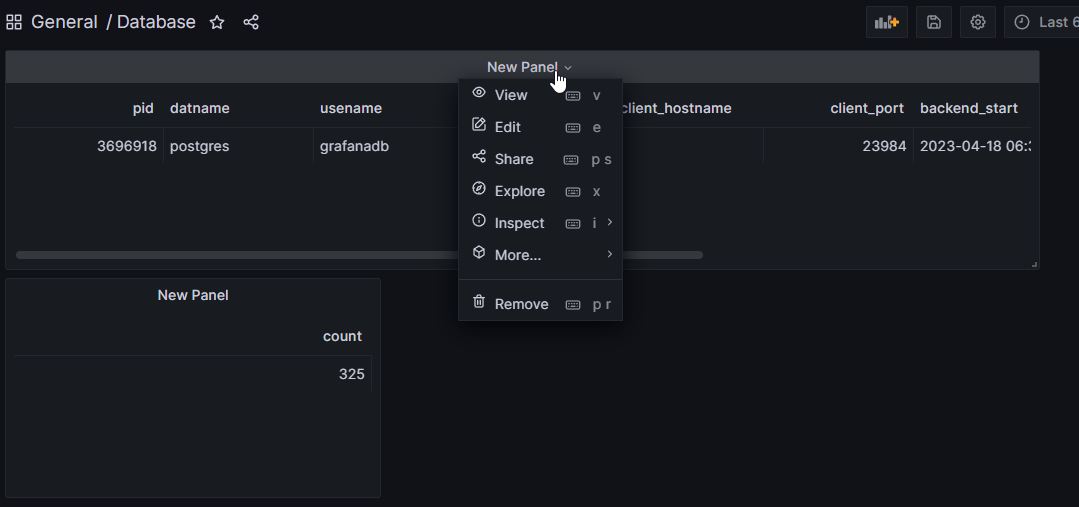
I’ll rearrange the query a bit then give it a name and description, lastly I’ll click Apply to save
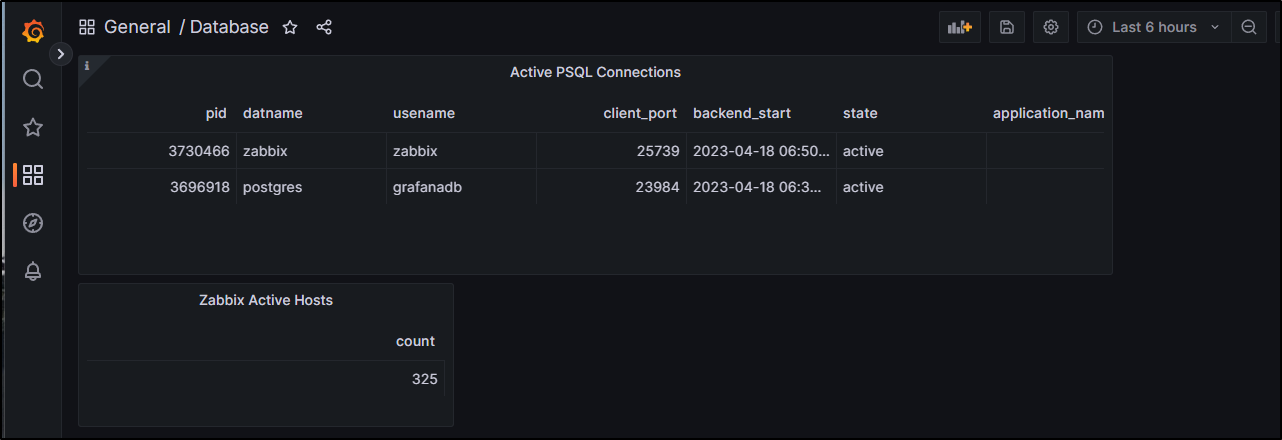
I did the same with the Zabbix Hosts and now I have a fairly functional Dashboard
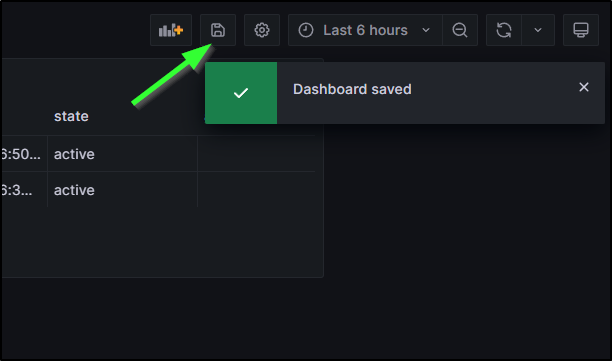
Lest you forget, always remember to save the dashboard when you are done making changes
Adding a host
To add metrics and monitors for a host, we’ll need to add an agent that provides Prometheus metrics from that host up to grafana.
Let’s say we wish to monitor the primary node for my test cluster.
I would login and download the latest prometheus release
builder@anna-MacBookAir:~$ wget https://github.com/prometheus/prometheus/releases/download/v2.43.0/prometheus-2.43.0.linux-amd64.tar.gz
--2023-04-18 07:05:02--  https://github.com/prometheus/prometheus/releases/download/v2.43.0/prometheus-2.43.0.linux-amd64.tar.gz
Resolving github.com (github.com)... 140.82.114.3
Connecting to github.com (github.com)|140.82.114.3|:443... connected.
HTTP request sent, awaiting response... 302 Found
Location: https://objects.githubusercontent.com/github-production-release-asset-2e65be/6838921/cdffb95e-2db9-48c1-8ee8-69bd587a304a?X-Amz-Algorithm=AWS4-HMAC-SHA256&X-Amz-Credential=AKIAIWNJYAX4CSVEH53A%2F20230418%2Fus-east-1%2Fs3%2Faws4_request&X-Amz-Date=20230418T120503Z&X-Amz-Expires=300&X-Amz-Signature=704fb02f88cad576f4386ee571cd3dc2c615329e26d81f4199b3dde814ff2d0e&X-Amz-SignedHeaders=host&actor_id=0&key_id=0&repo_id=6838921&response-content-disposition=attachment%3B%20filename%3Dprometheus-2.43.0.linux-amd64.tar.gz&response-content-type=application%2Foctet-stream [following]
--2023-04-18 07:05:03--  https://objects.githubusercontent.com/github-production-release-asset-2e65be/6838921/cdffb95e-2db9-48c1-8ee8-69bd587a304a?X-Amz-Algorithm=AWS4-HMAC-SHA256&X-Amz-Credential=AKIAIWNJYAX4CSVEH53A%2F20230418%2Fus-east-1%2Fs3%2Faws4_request&X-Amz-Date=20230418T120503Z&X-Amz-Expires=300&X-Amz-Signature=704fb02f88cad576f4386ee571cd3dc2c615329e26d81f4199b3dde814ff2d0e&X-Amz-SignedHeaders=host&actor_id=0&key_id=0&repo_id=6838921&response-content-disposition=attachment%3B%20filename%3Dprometheus-2.43.0.linux-amd64.tar.gz&response-content-type=application%2Foctet-stream
Resolving objects.githubusercontent.com (objects.githubusercontent.com)... 185.199.108.133, 185.199.109.133, 185.199.111.133, ...
Connecting to objects.githubusercontent.com (objects.githubusercontent.com)|185.199.108.133|:443... connected.
HTTP request sent, awaiting response... 200 OK
Length: 91091544 (87M) [application/octet-stream]
Saving to: ‘prometheus-2.43.0.linux-amd64.tar.gz’

prometheus-2.43.0.linux-amd64.tar.gz                       100%[======================================================================================================================================>]  86.87M  71.3MB/s    in 1.2s

2023-04-18 07:05:04 (71.3 MB/s) - ‘prometheus-2.43.0.linux-amd64.tar.gz’ saved [91091544/91091544]
I would expand then go into the expanded directory and see the configuration YAML file
builder@anna-MacBookAir:~$ tar xf prometheus-2.43.0.linux-amd64.tar.gz
builder@anna-MacBookAir:~$ cd prometheus-2.43.0.linux-amd64/
builder@anna-MacBookAir:~/prometheus-2.43.0.linux-amd64$
builder@anna-MacBookAir:~/prometheus-2.43.0.linux-amd64$ ls
console_libraries  consoles  LICENSE  NOTICE  prometheus  prometheus.yml  promtool
Just to test, I can run Prometheus locally with the default config
builder@anna-MacBookAir:~/prometheus-2.43.0.linux-amd64$ ./prometheus --config.file=./prometheus.yml
ts=2023-04-18T12:13:03.457Z caller=main.go:520 level=info msg="No time or size retention was set so using the default time retention" duration=15d
ts=2023-04-18T12:13:03.457Z caller=main.go:564 level=info msg="Starting Prometheus Server" mode=server version="(version=2.43.0, branch=HEAD, revision=edfc3bcd025dd6fe296c167a14a216cab1e552ee)"
ts=2023-04-18T12:13:03.457Z caller=main.go:569 level=info build_context="(go=go1.19.7, platform=linux/amd64, user=root@8a0ee342e522, date=20230321-12:56:07, tags=netgo,builtinassets)"
ts=2023-04-18T12:13:03.457Z caller=main.go:570 level=info host_details="(Linux 5.15.0-69-generic #76~20.04.1-Ubuntu SMP Mon Mar 20 15:54:19 UTC 2023 x86_64 anna-MacBookAir (none))"
ts=2023-04-18T12:13:03.457Z caller=main.go:571 level=info fd_limits="(soft=1048576, hard=1048576)"
ts=2023-04-18T12:13:03.457Z caller=main.go:572 level=info vm_limits="(soft=unlimited, hard=unlimited)"
ts=2023-04-18T12:13:03.459Z caller=web.go:561 level=info component=web msg="Start listening for connections" address=0.0.0.0:9090
ts=2023-04-18T12:13:03.459Z caller=main.go:1005 level=info msg="Starting TSDB ..."
ts=2023-04-18T12:13:03.461Z caller=tls_config.go:232 level=info component=web msg="Listening on" address=[::]:9090
ts=2023-04-18T12:13:03.461Z caller=tls_config.go:235 level=info component=web msg="TLS is disabled." http2=false address=[::]:9090
ts=2023-04-18T12:13:03.465Z caller=head.go:587 level=info component=tsdb msg="Replaying on-disk memory mappable chunks if any"
ts=2023-04-18T12:13:03.465Z caller=head.go:658 level=info component=tsdb msg="On-disk memory mappable chunks replay completed" duration=3.814µs
ts=2023-04-18T12:13:03.465Z caller=head.go:664 level=info component=tsdb msg="Replaying WAL, this may take a while"
ts=2023-04-18T12:13:03.465Z caller=head.go:735 level=info component=tsdb msg="WAL segment loaded" segment=0 maxSegment=0
ts=2023-04-18T12:13:03.465Z caller=head.go:772 level=info component=tsdb msg="WAL replay completed" checkpoint_replay_duration=37.44µs wal_replay_duration=460.436µs wbl_replay_duration=163ns total_replay_duration=554.023µs
ts=2023-04-18T12:13:03.467Z caller=main.go:1026 level=info fs_type=EXT4_SUPER_MAGIC
ts=2023-04-18T12:13:03.467Z caller=main.go:1029 level=info msg="TSDB started"
ts=2023-04-18T12:13:03.467Z caller=main.go:1209 level=info msg="Loading configuration file" filename=./prometheus.yml
ts=2023-04-18T12:13:03.468Z caller=main.go:1246 level=info msg="Completed loading of configuration file" filename=./prometheus.yml totalDuration=733.833µs db_storage=1.521µs remote_storage=2.227µs web_handler=647ns query_engine=1.03µs scrape=268.435µs scrape_sd=35.331µs notify=52.393µs notify_sd=27.021µs rules=1.514µs tracing=7.461µs
ts=2023-04-18T12:13:03.468Z caller=main.go:990 level=info msg="Server is ready to receive web requests."
ts=2023-04-18T12:13:03.468Z caller=manager.go:974 level=info component="rule manager" msg="Starting rule manager..."
I can then add a Data Source in Grafana
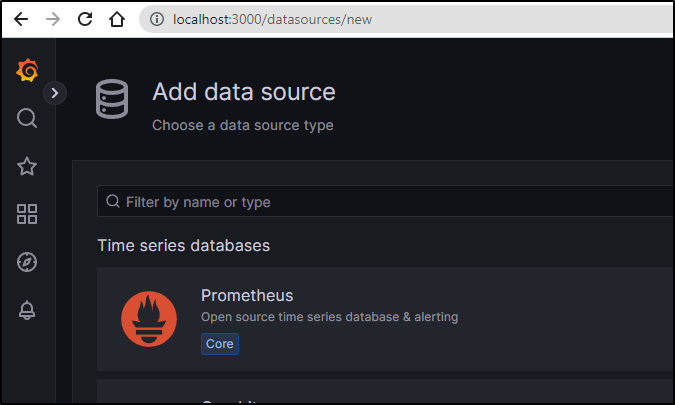
and point to the host (using all default values otherwise)
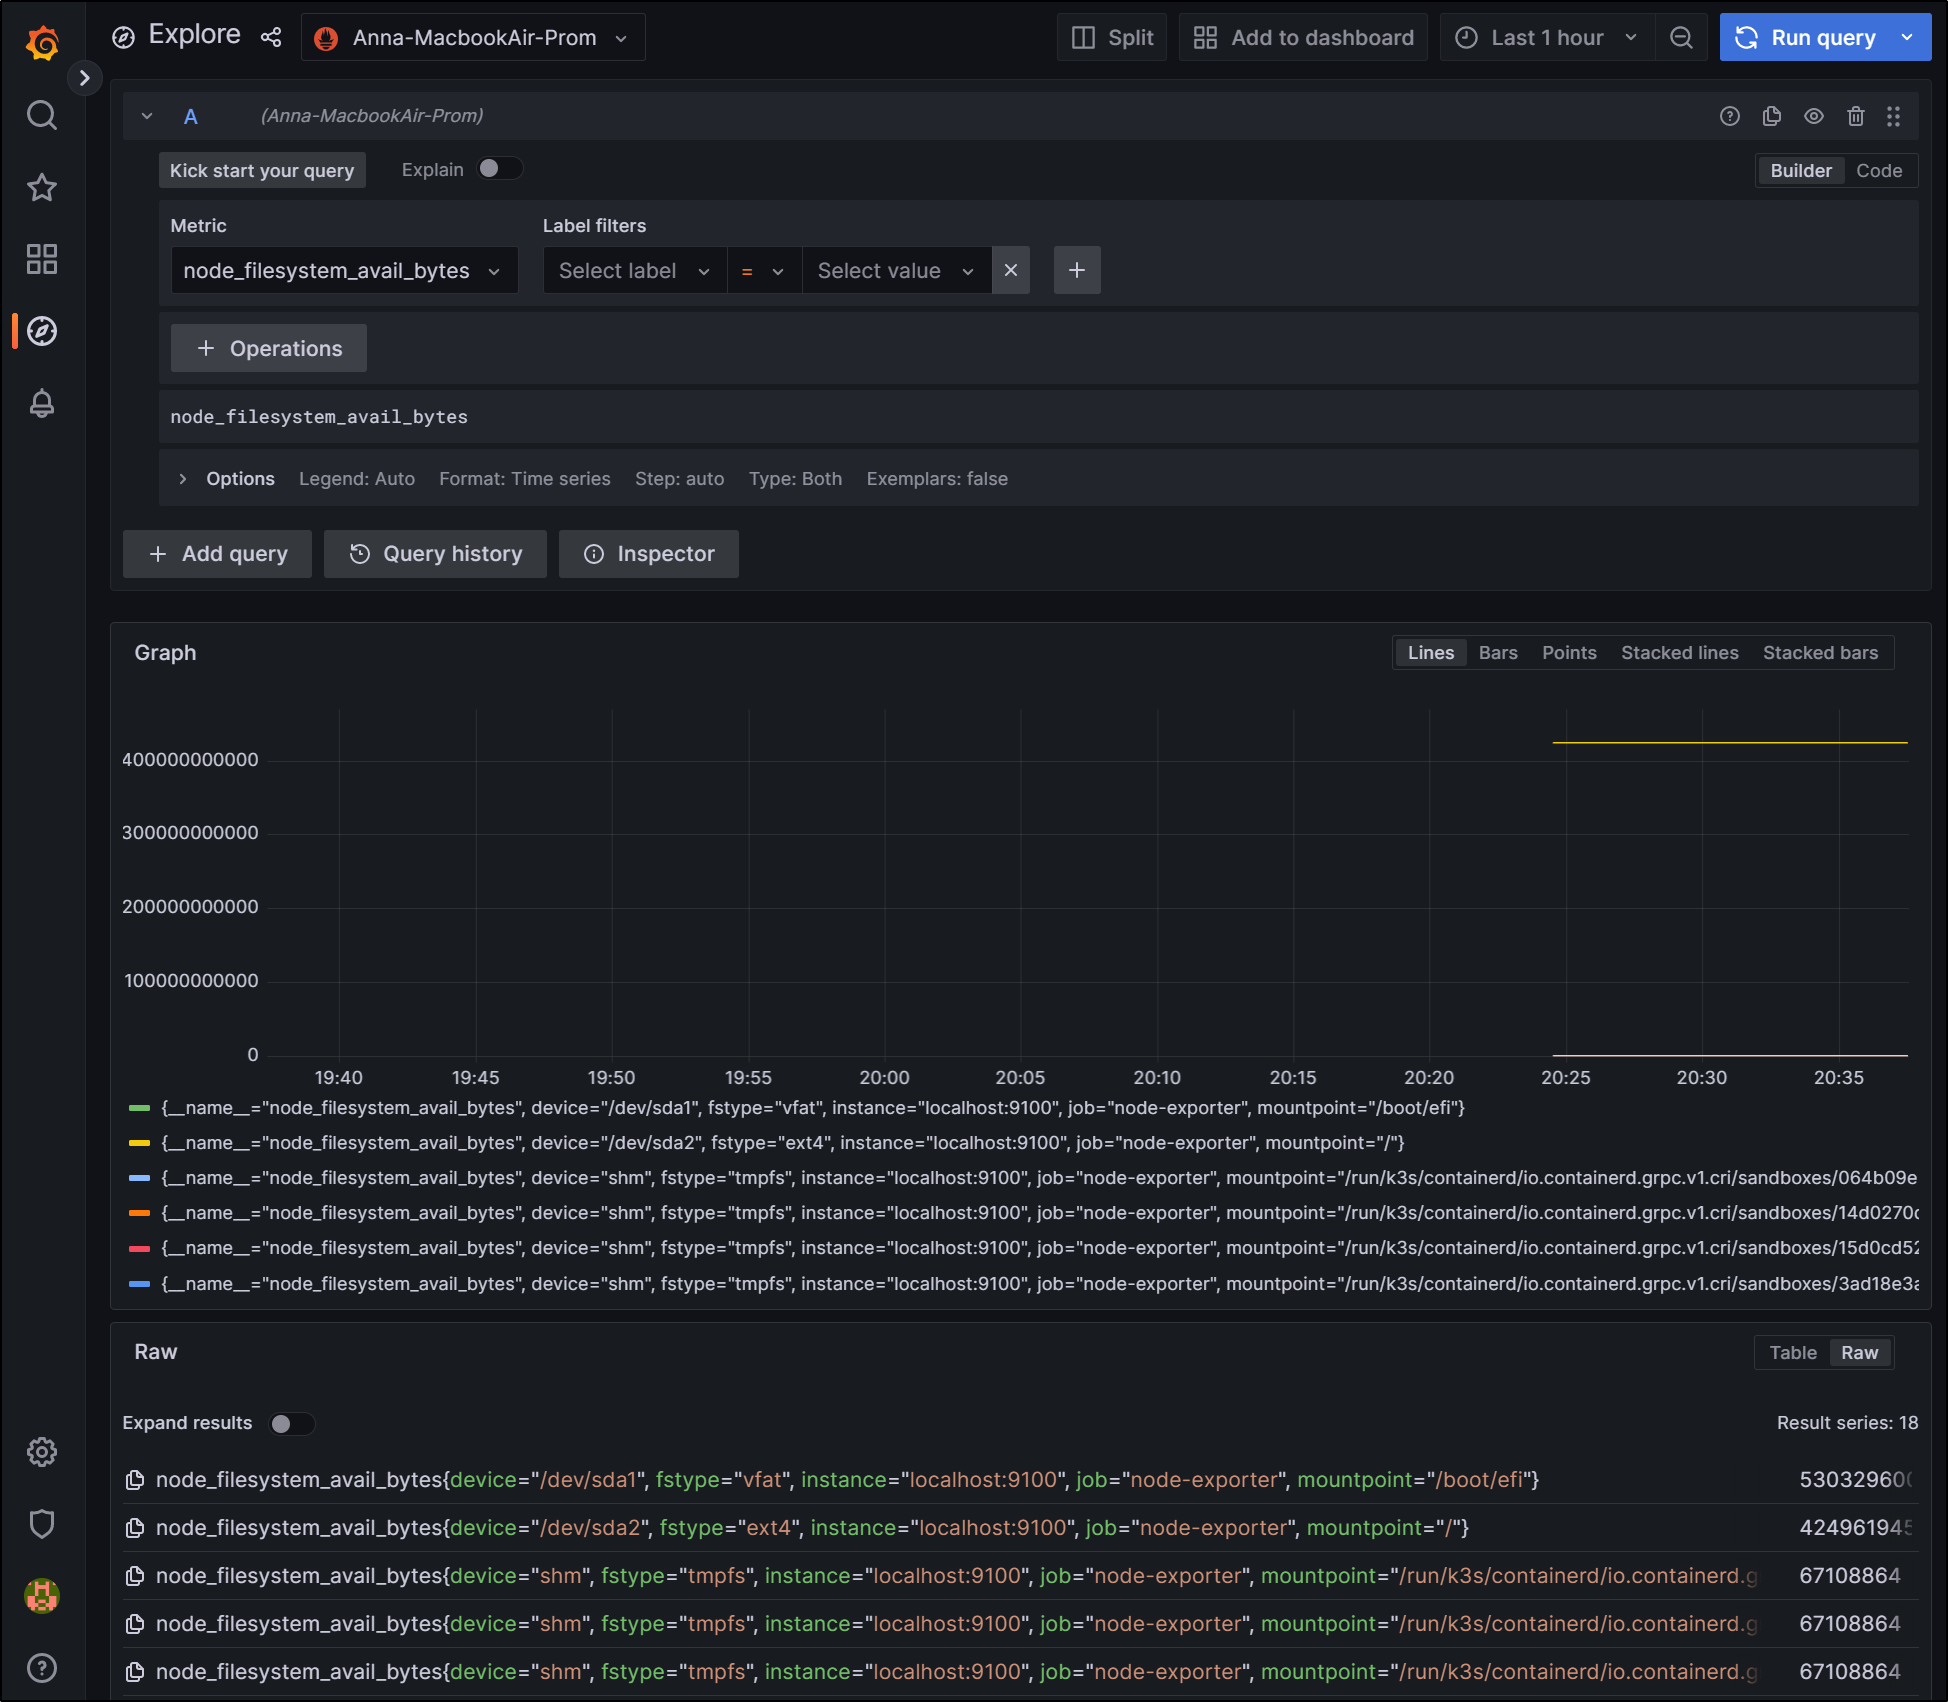
I can then explore to see some basic graphs
To do this properly, we could follow a guide like this one to create the proper user and folders and move things around. That is super duper, but I’ll just KISS and add a startup script based on my current user and path
builder@anna-MacBookAir:~/prometheus-2.43.0.linux-amd64$ sudo vi /etc/systemd/system/prometheus.service
builder@anna-MacBookAir:~/prometheus-2.43.0.linux-amd64$ cat /etc/systemd/system/prometheus.service
[Unit]
Description=PromServer
Wants=network-online.target
After=network-online.target

[Service]
User=builder
Group=builder
Type=simple
ExecStart=/home/builder/prometheus-2.43.0.linux-amd64/prometheus \
--config.file /home/builder/prometheus-2.43.0.linux-amd64/prometheus.yml \
--storage.tsdb.path /tmp

[Install]
WantedBy=multi-user.target
In my first try I had a typo. If you are trying to get details for a failed service start, you can use ` journalctl -u prometheus.service`.
builder@anna-MacBookAir:/var/log$ sudo systemctl daemon-reload
builder@anna-MacBookAir:/var/log$ sudo systemctl start prometheus
builder@anna-MacBookAir:/var/log$ sudo systemctl status prometheus
● prometheus.service - PromServer
     Loaded: loaded (/etc/systemd/system/prometheus.service; disabled; vendor preset: enabled)
     Active: active (running) since Tue 2023-04-18 07:27:01 CDT; 2s ago
   Main PID: 3984838 (prometheus)
      Tasks: 9 (limit: 9327)
     Memory: 16.3M
     CGroup: /system.slice/prometheus.service
             └─3984838 /home/builder/prometheus-2.43.0.linux-amd64/prometheus --config.file /home/builder/prometheus-2.43.0.linux-amd64/prometheus.yml --storage.tsdb.path /tmp

Apr 18 07:27:01 anna-MacBookAir prometheus[3984838]: ts=2023-04-18T12:27:01.202Z caller=head.go:658 level=info component=tsdb msg="On-disk memory mappable chunks replay completed" duration=5.991µs
Apr 18 07:27:01 anna-MacBookAir prometheus[3984838]: ts=2023-04-18T12:27:01.202Z caller=head.go:664 level=info component=tsdb msg="Replaying WAL, this may take a while"
Apr 18 07:27:01 anna-MacBookAir prometheus[3984838]: ts=2023-04-18T12:27:01.203Z caller=head.go:735 level=info component=tsdb msg="WAL segment loaded" segment=0 maxSegment=0
Apr 18 07:27:01 anna-MacBookAir prometheus[3984838]: ts=2023-04-18T12:27:01.203Z caller=head.go:772 level=info component=tsdb msg="WAL replay completed" checkpoint_replay_duration=53.644µs wal_replay_duration=1.107075ms wbl_replay_duration=152ns t>
Apr 18 07:27:01 anna-MacBookAir prometheus[3984838]: ts=2023-04-18T12:27:01.206Z caller=main.go:1026 level=info fs_type=EXT4_SUPER_MAGIC
Apr 18 07:27:01 anna-MacBookAir prometheus[3984838]: ts=2023-04-18T12:27:01.206Z caller=main.go:1029 level=info msg="TSDB started"
Apr 18 07:27:01 anna-MacBookAir prometheus[3984838]: ts=2023-04-18T12:27:01.206Z caller=main.go:1209 level=info msg="Loading configuration file" filename=/home/builder/prometheus-2.43.0.linux-amd64/prometheus.yml
Apr 18 07:27:01 anna-MacBookAir prometheus[3984838]: ts=2023-04-18T12:27:01.207Z caller=main.go:1246 level=info msg="Completed loading of configuration file" filename=/home/builder/prometheus-2.43.0.linux-amd64/prometheus.yml totalDuration=892.994>
Apr 18 07:27:01 anna-MacBookAir prometheus[3984838]: ts=2023-04-18T12:27:01.207Z caller=main.go:990 level=info msg="Server is ready to receive web requests."
Apr 18 07:27:01 anna-MacBookAir prometheus[3984838]: ts=2023-04-18T12:27:01.207Z caller=manager.go:974 level=info component="rule manager" msg="Starting rule manager..."
lines 1-19/19 (END)
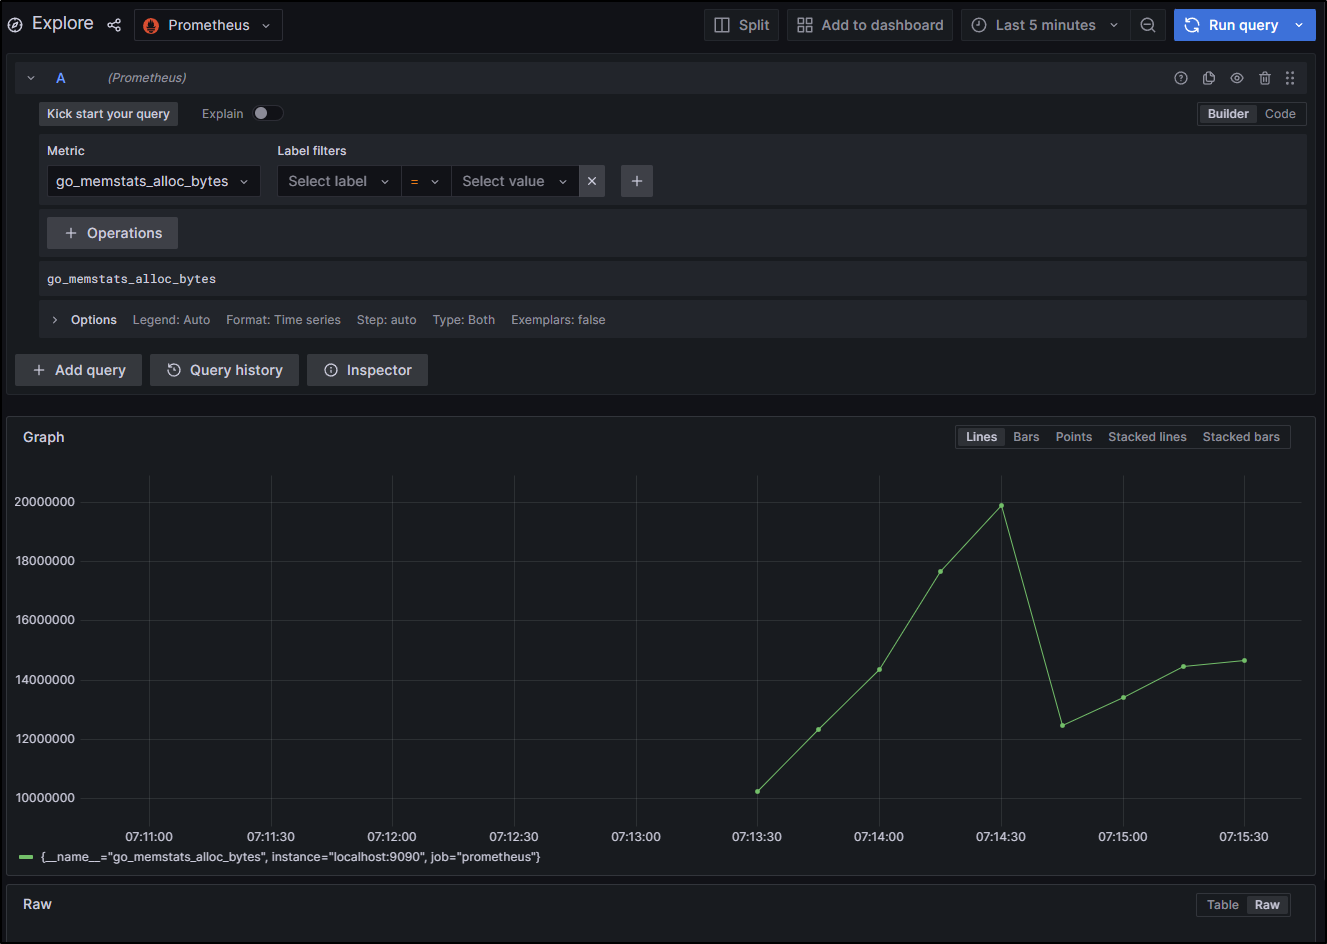
If there are any doubts on if the “Prometheus” datasource is really this host, we can stop Prom and see it show an error in Explore

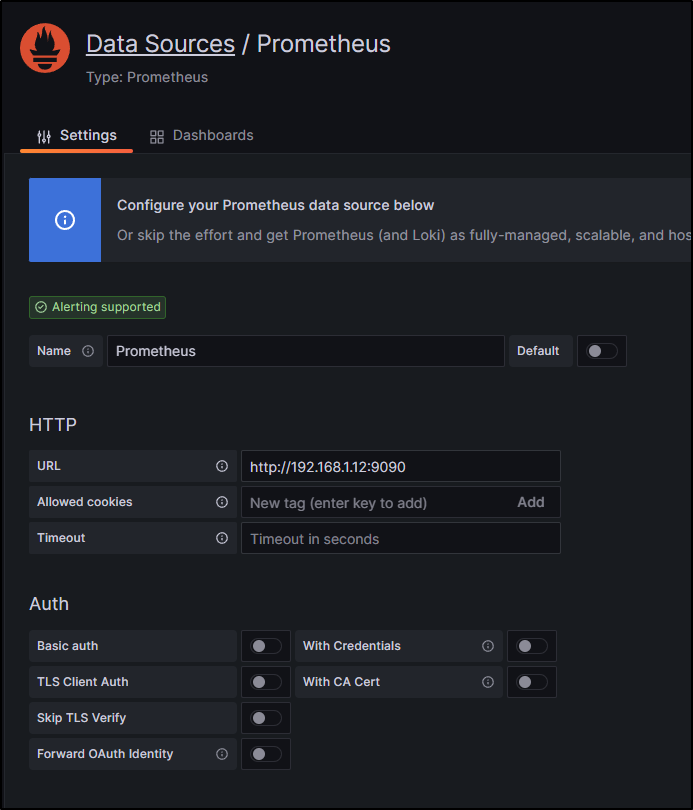
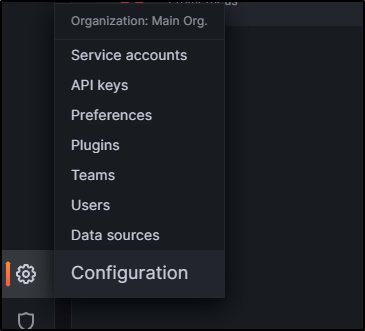
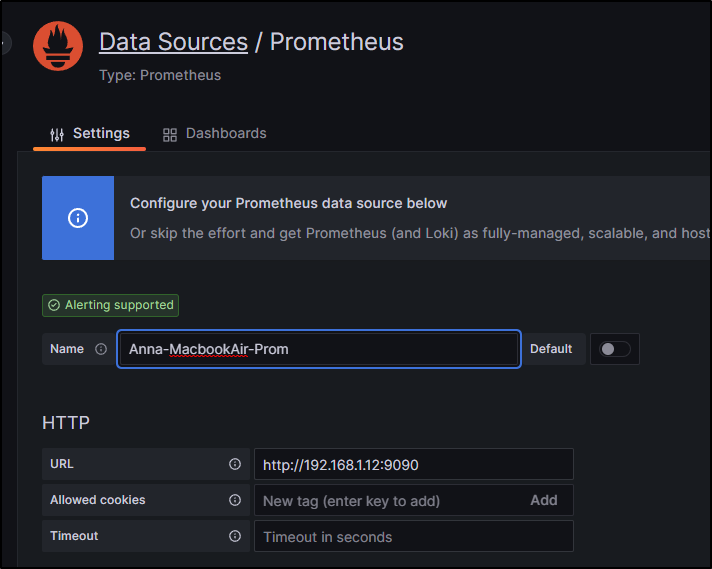
Since I find that a bit of a hassle to remember, I’ll rename it. Go to Settings/Data Sources
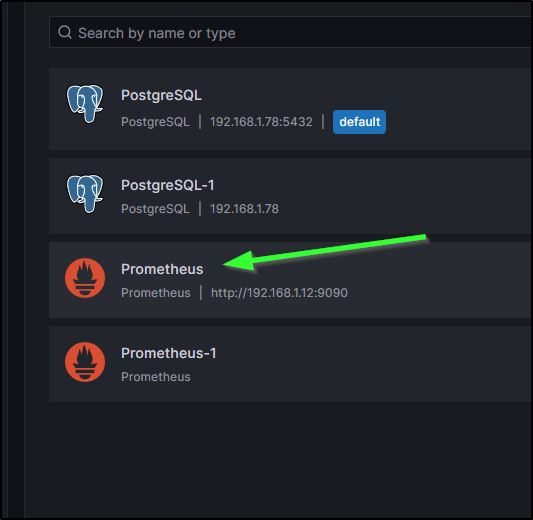
I’ll click on the name of the one I wish to rename
and I’ll give it a better name
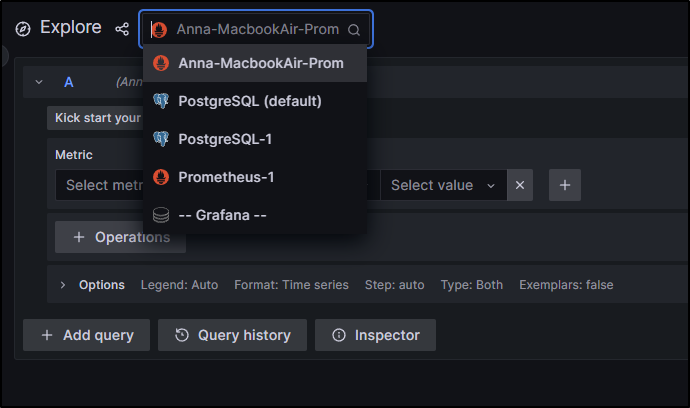
Now when I go to explore metrics, it is a bit more clear
…. Next.. move on to installing Node Exporter, then configuring Prom to expose it for disks stats…
I’ll get Node Exporter from the latest release
builder@anna-MacBookAir:~$ wget https://github.com/prometheus/node_exporter/releases/download/v1.5.0/node_exporter-1.5.0.linux-amd64.tar.gz
--2023-04-18 19:57:13--  https://github.com/prometheus/node_exporter/releases/download/v1.5.0/node_exporter-1.5.0.linux-amd64.tar.gz
Resolving github.com (github.com)... 140.82.113.4
Connecting to github.com (github.com)|140.82.113.4|:443... connected.
HTTP request sent, awaiting response... 302 Found
Location: https://objects.githubusercontent.com/github-production-release-asset-2e65be/9524057/fc1630e0-8913-427f-94ba-4131d3ed96c7?X-Amz-Algorithm=AWS4-HMAC-SHA256&X-Amz-Credential=AKIAIWNJYAX4CSVEH53A%2F20230419%2Fus-east-1%2Fs3%2Faws4_request&X-Amz-Date=20230419T005648Z&X-Amz-Expires=300&X-Amz-Signature=cbea8ffdda7667c8ae10e54abd364b44c7dc70fea3a81d16086306f361355784&X-Amz-SignedHeaders=host&actor_id=0&key_id=0&repo_id=9524057&response-content-disposition=attachment%3B%20filename%3Dnode_exporter-1.5.0.linux-amd64.tar.gz&response-content-type=application%2Foctet-stream [following]
--2023-04-18 19:57:13--  https://objects.githubusercontent.com/github-production-release-asset-2e65be/9524057/fc1630e0-8913-427f-94ba-4131d3ed96c7?X-Amz-Algorithm=AWS4-HMAC-SHA256&X-Amz-Credential=AKIAIWNJYAX4CSVEH53A%2F20230419%2Fus-east-1%2Fs3%2Faws4_request&X-Amz-Date=20230419T005648Z&X-Amz-Expires=300&X-Amz-Signature=cbea8ffdda7667c8ae10e54abd364b44c7dc70fea3a81d16086306f361355784&X-Amz-SignedHeaders=host&actor_id=0&key_id=0&repo_id=9524057&response-content-disposition=attachment%3B%20filename%3Dnode_exporter-1.5.0.linux-amd64.tar.gz&response-content-type=application%2Foctet-stream
Resolving objects.githubusercontent.com (objects.githubusercontent.com)... 185.199.108.133, 185.199.109.133, 185.199.111.133, ...
Connecting to objects.githubusercontent.com (objects.githubusercontent.com)|185.199.108.133|:443... connected.
HTTP request sent, awaiting response... 200 OK
Length: 10181045 (9.7M) [application/octet-stream]
Saving to: ‘node_exporter-1.5.0.linux-amd64.tar.gz’

node_exporter-1.5.0.linux-amd 100%[=================================================>]   9.71M  45.0MB/s    in 0.2s

2023-04-18 19:57:14 (45.0 MB/s) - ‘node_exporter-1.5.0.linux-amd64.tar.gz’ saved [10181045/10181045]
We can now extract node_exporter
builder@anna-MacBookAir:~$ tar xf node_exporter-1.5.0.linux-amd64.tar.gz
builder@anna-MacBookAir:~$ cd node_exporter-1.5.0.linux-amd64/
We’ll set up the systemd service
builder@anna-MacBookAir:~/node_exporter-1.5.0.linux-amd64$ sudo vi /usr/lib/systemd/system/node_exporter.service
builder@anna-MacBookAir:~/node_exporter-1.5.0.linux-amd64$ cat /usr/lib/systemd/system/node_exporter.service
[Unit]
Description=Node Exporter
Documentation=https://prometheus.io/docs/guides/node-exporter/
Wants=network-online.target
After=network-online.target

[Service]
User=builder
Group=builder
Type=simple
Restart=on-failure
ExecStart=/home/builder/node_exporter-1.5.0.linux-amd64/node_exporter \
  --web.listen-address=localhost:9200

[Install]
WantedBy=multi-user.target
Change permission and reload
builder@anna-MacBookAir:~/node_exporter-1.5.0.linux-amd64$ sudo chmod 664 /usr/lib/systemd/system/node_exporter.service
builder@anna-MacBookAir:~/node_exporter-1.5.0.linux-amd64$ sudo systemctl daemon-reload
Now we can start the service and check the status
builder@anna-MacBookAir:~/node_exporter-1.5.0.linux-amd64$ sudo systemctl start node_exporter

builder@anna-MacBookAir:~/node_exporter-1.5.0.linux-amd64$ sudo systemctl status node_exporter
● node_exporter.service - Node Exporter
     Loaded: loaded (/lib/systemd/system/node_exporter.service; disabled; vendor preset: enabled)
     Active: active (running) since Tue 2023-04-18 20:08:36 CDT; 4s ago
       Docs: https://prometheus.io/docs/guides/node-exporter/
   Main PID: 578074 (node_exporter)
      Tasks: 5 (limit: 9327)
     Memory: 3.0M
     CGroup: /system.slice/node_exporter.service
             └─578074 /home/builder/node_exporter-1.5.0.linux-amd64/node_exporter --web.listen-address=localhost:9200

Apr 18 20:08:36 anna-MacBookAir node_exporter[578074]: ts=2023-04-19T01:08:36.960Z caller=node_exporter.go:117 level=in>
Apr 18 20:08:36 anna-MacBookAir node_exporter[578074]: ts=2023-04-19T01:08:36.960Z caller=node_exporter.go:117 level=in>
Apr 18 20:08:36 anna-MacBookAir node_exporter[578074]: ts=2023-04-19T01:08:36.960Z caller=node_exporter.go:117 level=in>
Apr 18 20:08:36 anna-MacBookAir node_exporter[578074]: ts=2023-04-19T01:08:36.960Z caller=node_exporter.go:117 level=in>
Apr 18 20:08:36 anna-MacBookAir node_exporter[578074]: ts=2023-04-19T01:08:36.960Z caller=node_exporter.go:117 level=in>
Apr 18 20:08:36 anna-MacBookAir node_exporter[578074]: ts=2023-04-19T01:08:36.960Z caller=node_exporter.go:117 level=in>
Apr 18 20:08:36 anna-MacBookAir node_exporter[578074]: ts=2023-04-19T01:08:36.960Z caller=node_exporter.go:117 level=in>
Apr 18 20:08:36 anna-MacBookAir node_exporter[578074]: ts=2023-04-19T01:08:36.960Z caller=node_exporter.go:117 level=in>
Apr 18 20:08:36 anna-MacBookAir node_exporter[578074]: ts=2023-04-19T01:08:36.961Z caller=tls_config.go:232 level=info >
Apr 18 20:08:36 anna-MacBookAir node_exporter[578074]: ts=2023-04-19T01:08:36.961Z caller=tls_config.go:235 level=info >
We now can add an entry to the prometheus.yaml
$ vi ~/prometheus-2.43.0.linux-amd64/prometheus.yaml
... snip ...
  # The job name is added as a label `job=<job_name>` to any timeseries scraped from this config.

  - job_name: 'node-exporter'
    static_configs:
      - targets: ['localhost:9100']
  - job_name: "prometheus"
So now we can stop and start
builder@anna-MacBookAir:~/prometheus-2.43.0.linux-amd64$ sudo systemctl daemon-reload
builder@anna-MacBookAir:~/prometheus-2.43.0.linux-amd64$ sudo systemctl stop prometheus
builder@anna-MacBookAir:~/prometheus-2.43.0.linux-amd64$ sudo systemctl start prometheus
builder@anna-MacBookAir:~/prometheus-2.43.0.linux-amd64$ sudo systemctl status prometheus
● prometheus.service - PromServer
     Loaded: loaded (/etc/systemd/system/prometheus.service; disabled; vendor preset: enabled)
     Active: active (running) since Tue 2023-04-18 20:24:11 CDT; 4s ago
   Main PID: 594345 (prometheus)
      Tasks: 10 (limit: 9327)
     Memory: 20.7M
     CGroup: /system.slice/prometheus.service
             └─594345 /home/builder/prometheus-2.43.0.linux-amd64/prometheus --config.file /home/builder/prometheus-2.4>

Apr 18 20:24:11 anna-MacBookAir prometheus[594345]: ts=2023-04-19T01:24:11.561Z caller=head.go:735 level=info component>
Apr 18 20:24:11 anna-MacBookAir prometheus[594345]: ts=2023-04-19T01:24:11.565Z caller=head.go:735 level=info component>
Apr 18 20:24:11 anna-MacBookAir prometheus[594345]: ts=2023-04-19T01:24:11.565Z caller=head.go:735 level=info component>
Apr 18 20:24:11 anna-MacBookAir prometheus[594345]: ts=2023-04-19T01:24:11.565Z caller=head.go:772 level=info component>
Apr 18 20:24:11 anna-MacBookAir prometheus[594345]: ts=2023-04-19T01:24:11.568Z caller=main.go:1026 level=info fs_type=>
Apr 18 20:24:11 anna-MacBookAir prometheus[594345]: ts=2023-04-19T01:24:11.568Z caller=main.go:1029 level=info msg="TSD>
Apr 18 20:24:11 anna-MacBookAir prometheus[594345]: ts=2023-04-19T01:24:11.568Z caller=main.go:1209 level=info msg="Loa>
Apr 18 20:24:11 anna-MacBookAir prometheus[594345]: ts=2023-04-19T01:24:11.569Z caller=main.go:1246 level=info msg="Com>
Apr 18 20:24:11 anna-MacBookAir prometheus[594345]: ts=2023-04-19T01:24:11.569Z caller=main.go:990 level=info msg="Serv>
Apr 18 20:24:11 anna-MacBookAir prometheus[594345]: ts=2023-04-19T01:24:11.569Z caller=manager.go:974 level=info compon>
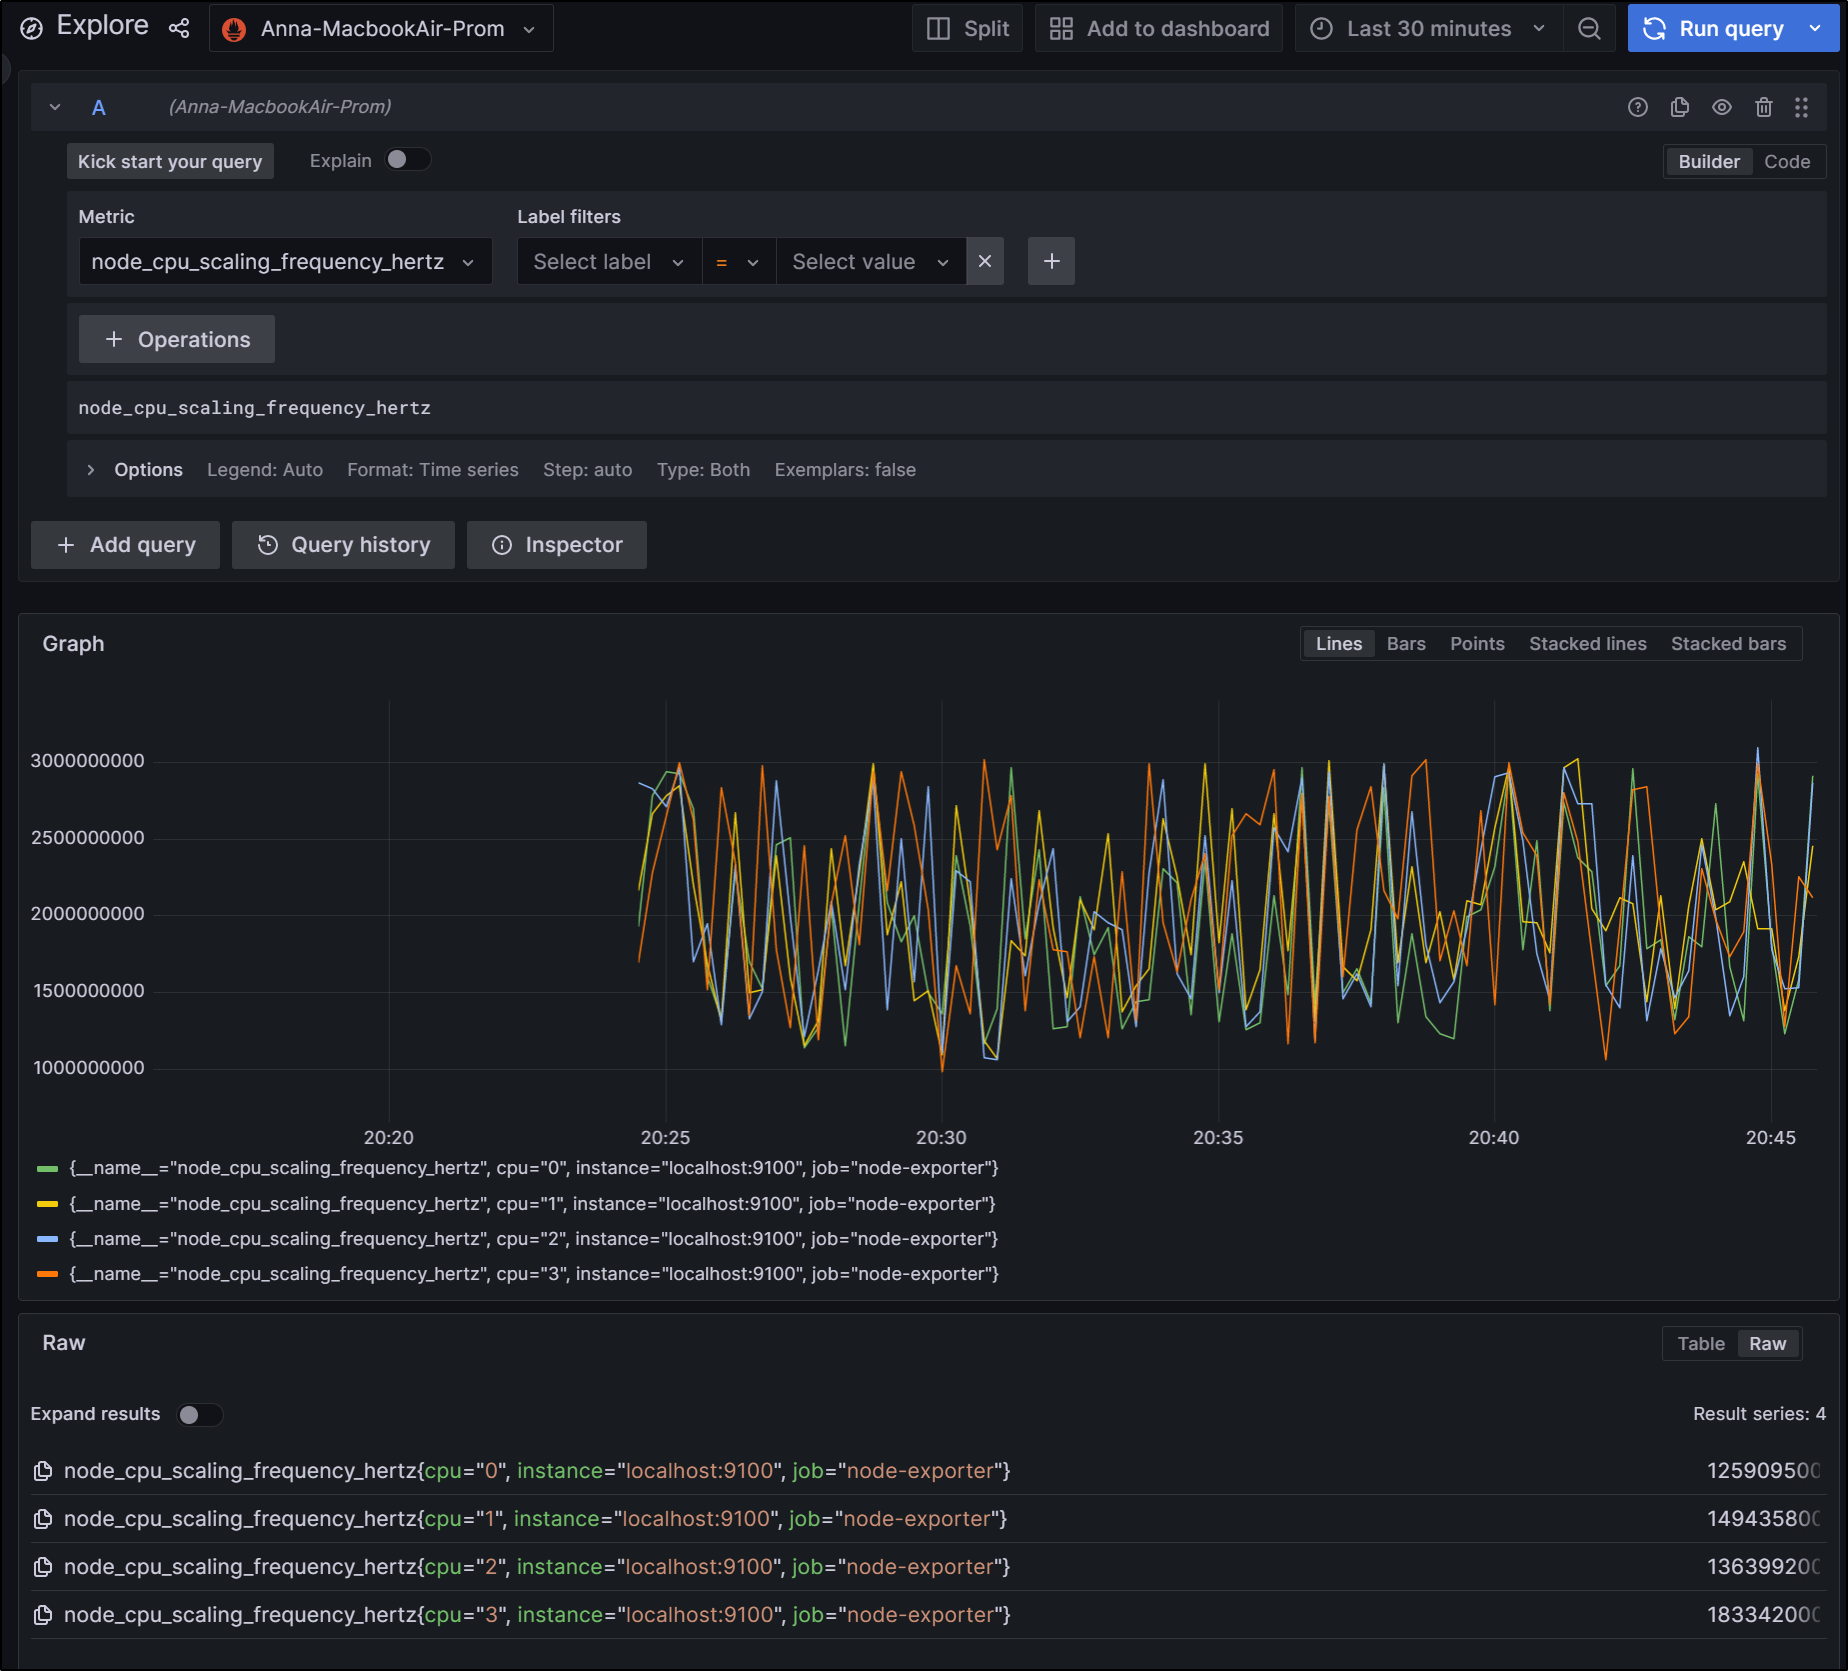
Now we can query Node metrics via our existing Prometheus data source
Such as CPU Ghz
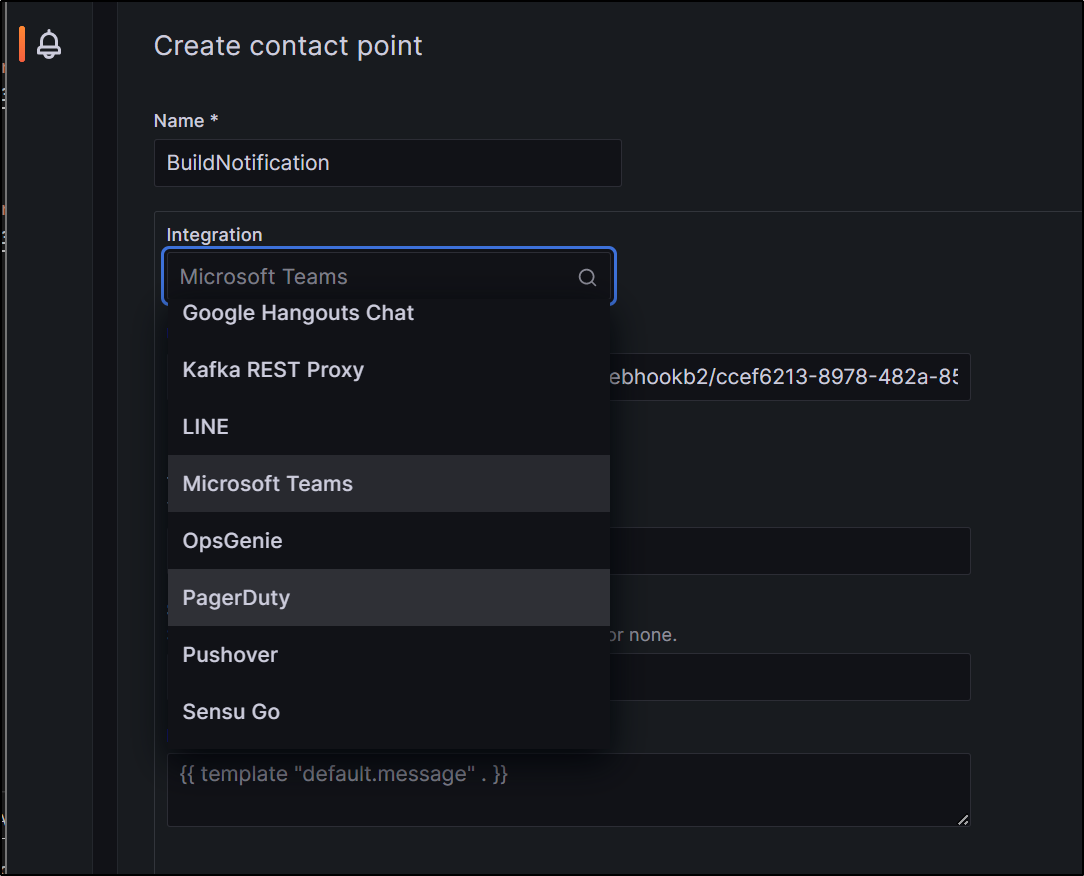
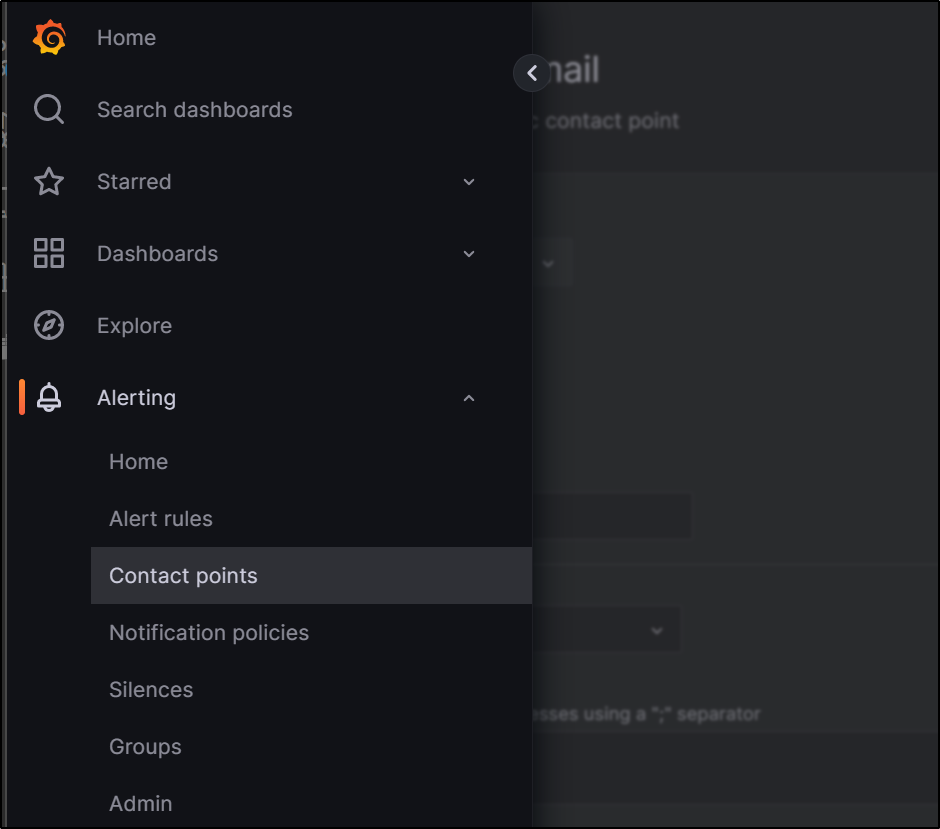
Contact Point
We can use Teams for a contact point
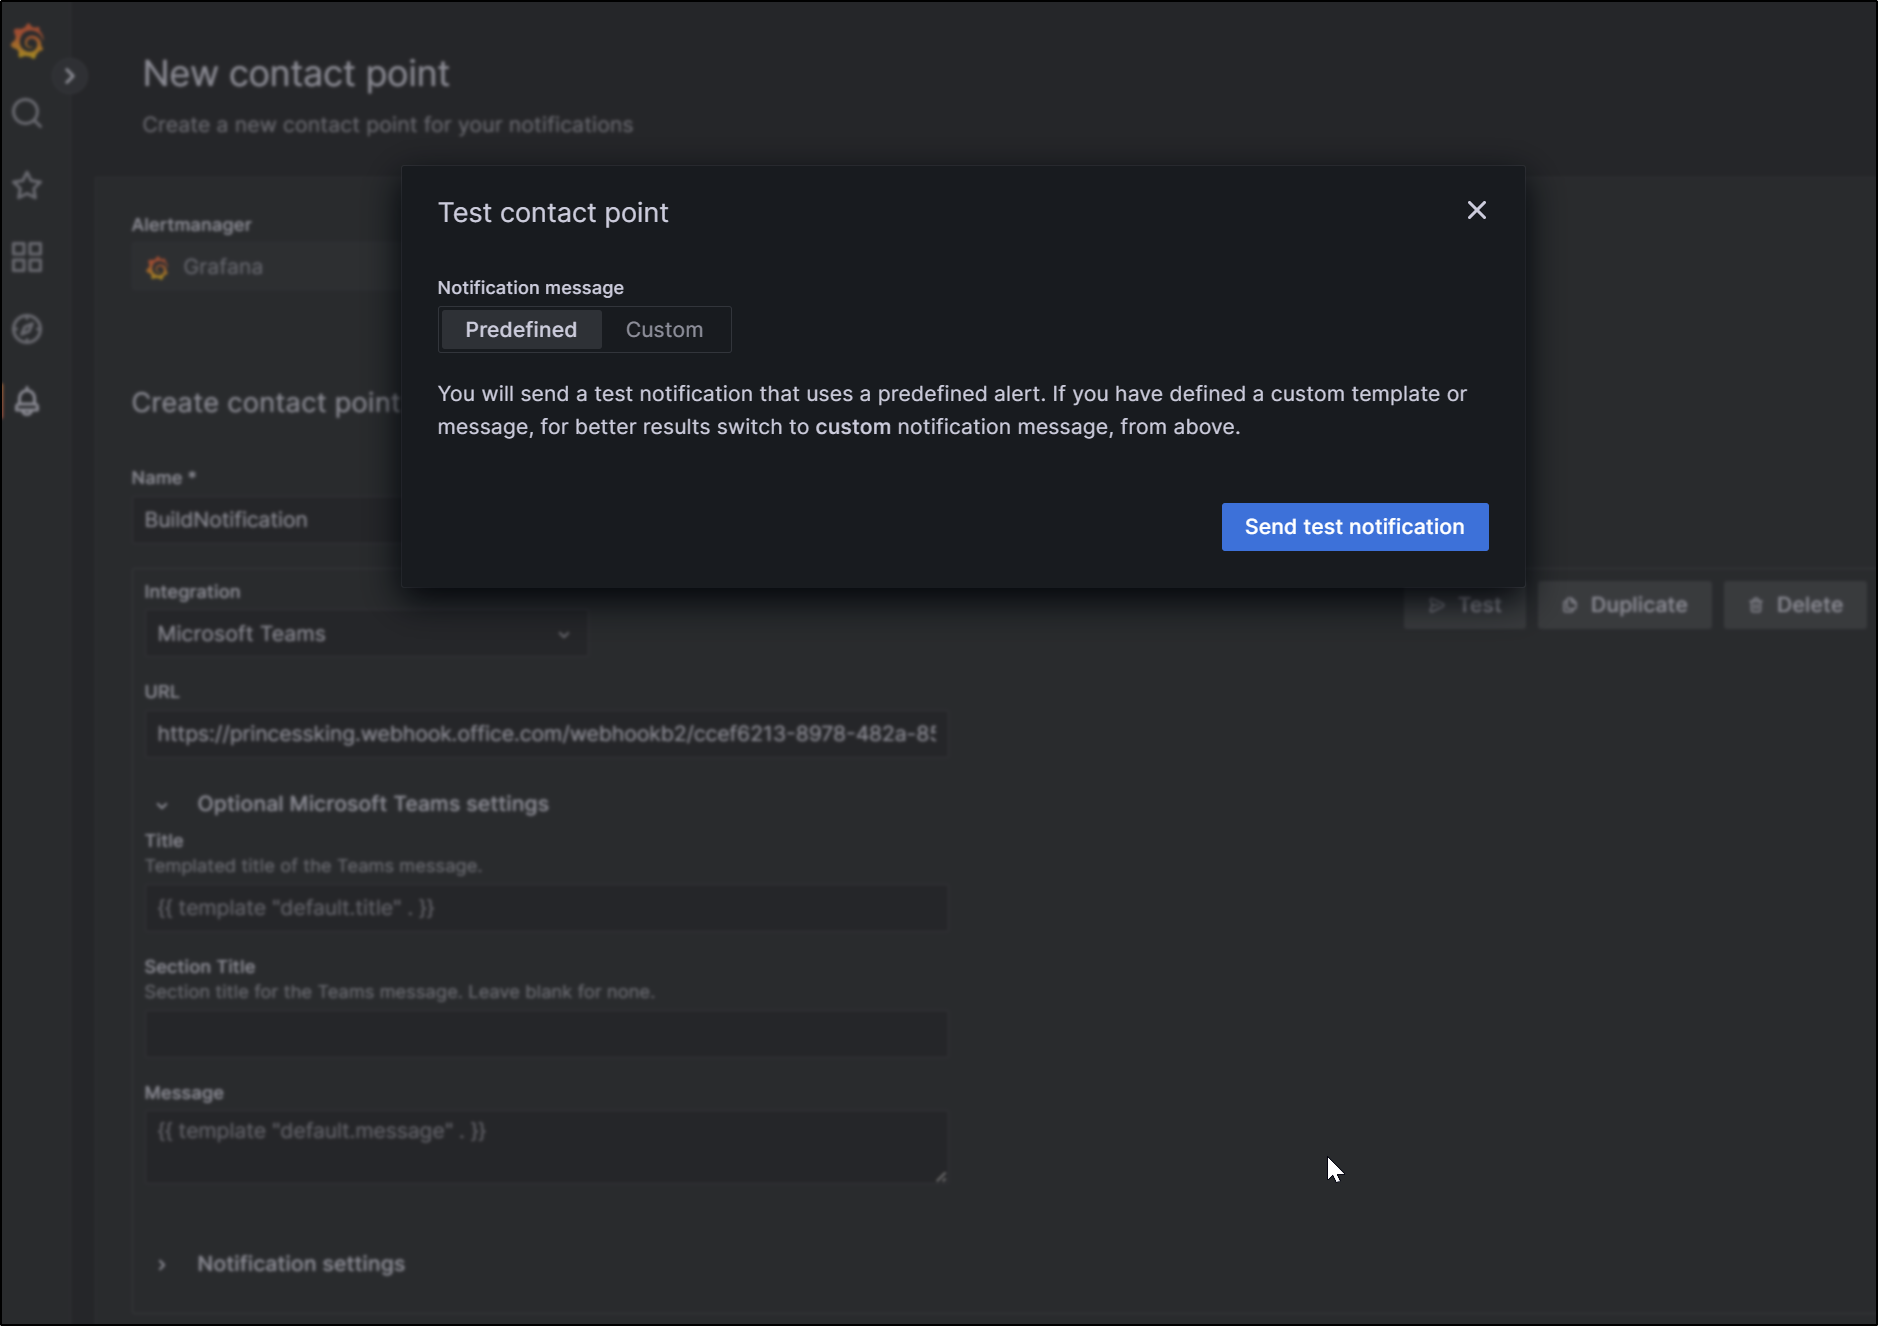
We can test Teams notification
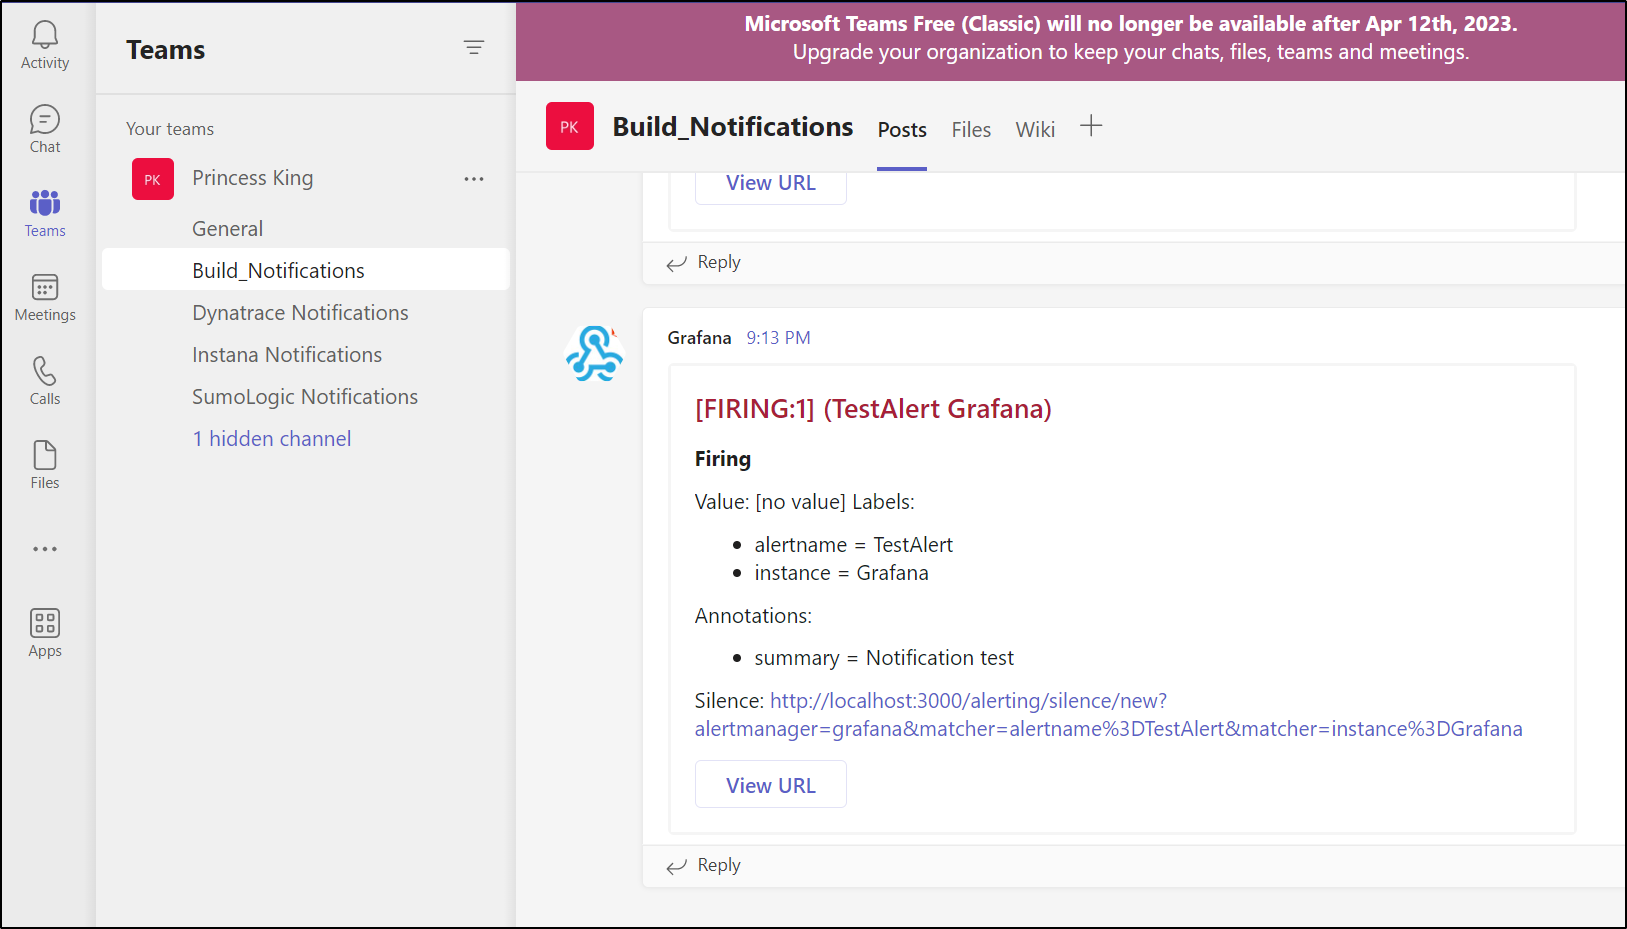
and see it reflected in Teams
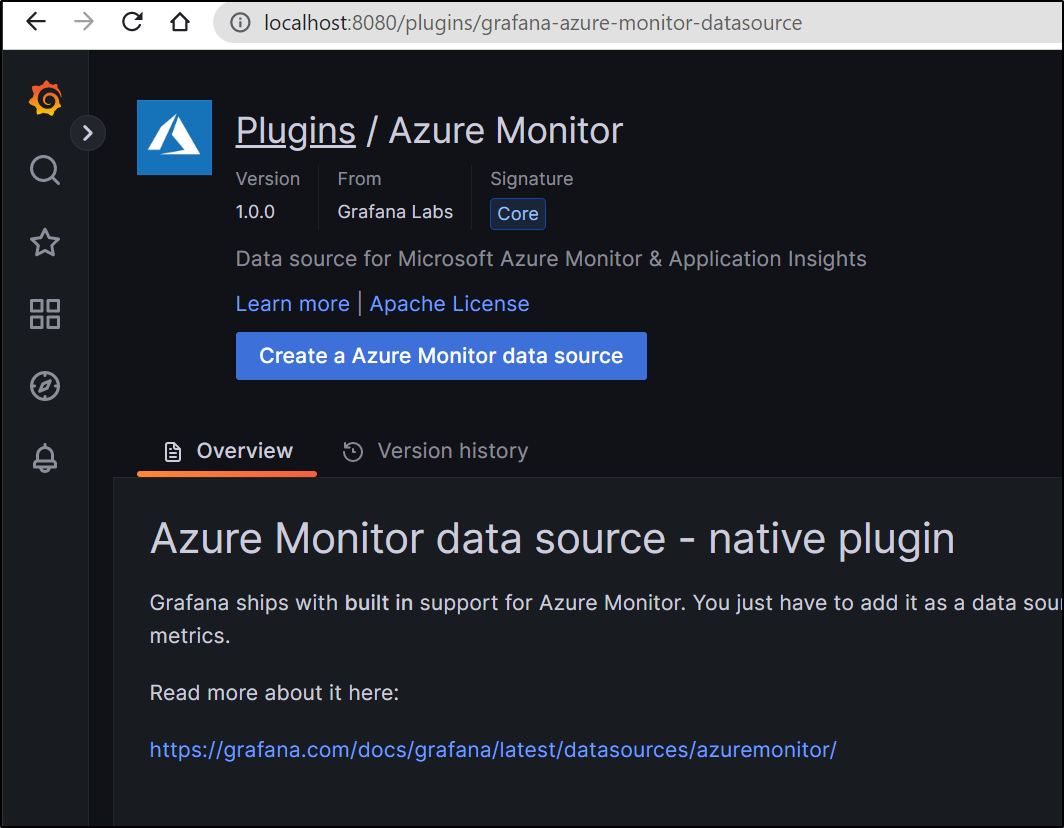
Azure Monitor
I can monitor Cloud Resources as well.
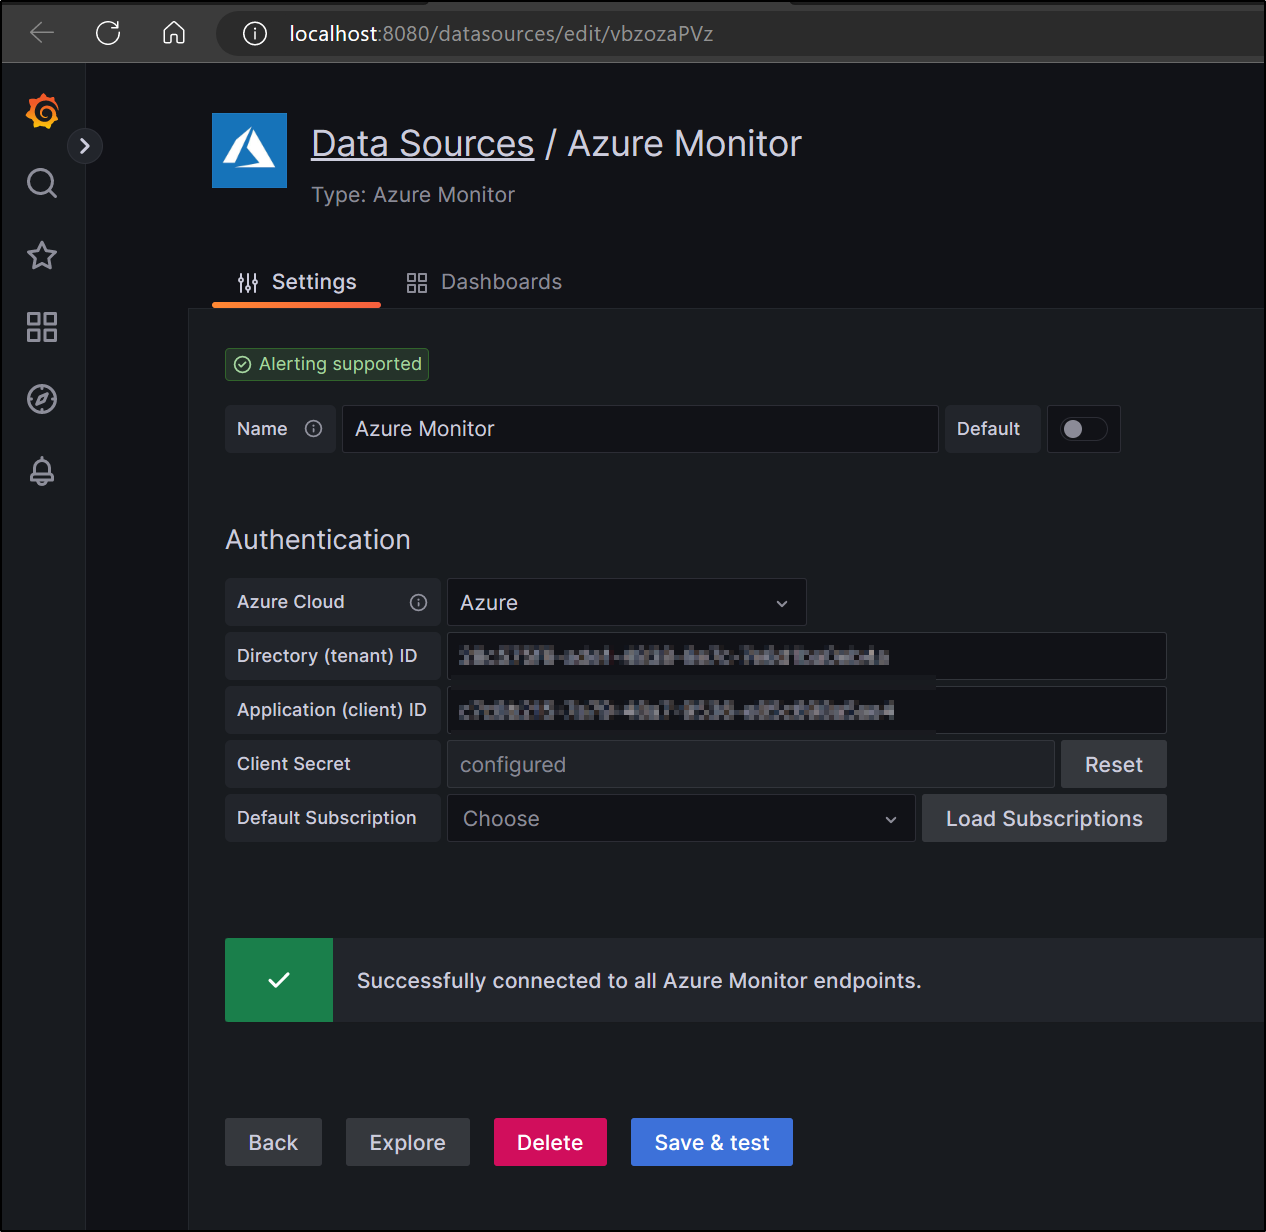
Let’s add the “Azure Monitor” plugin
I created an SP and added it as a Reader to my sub. I could then use my SP ID, Secret and Tenant
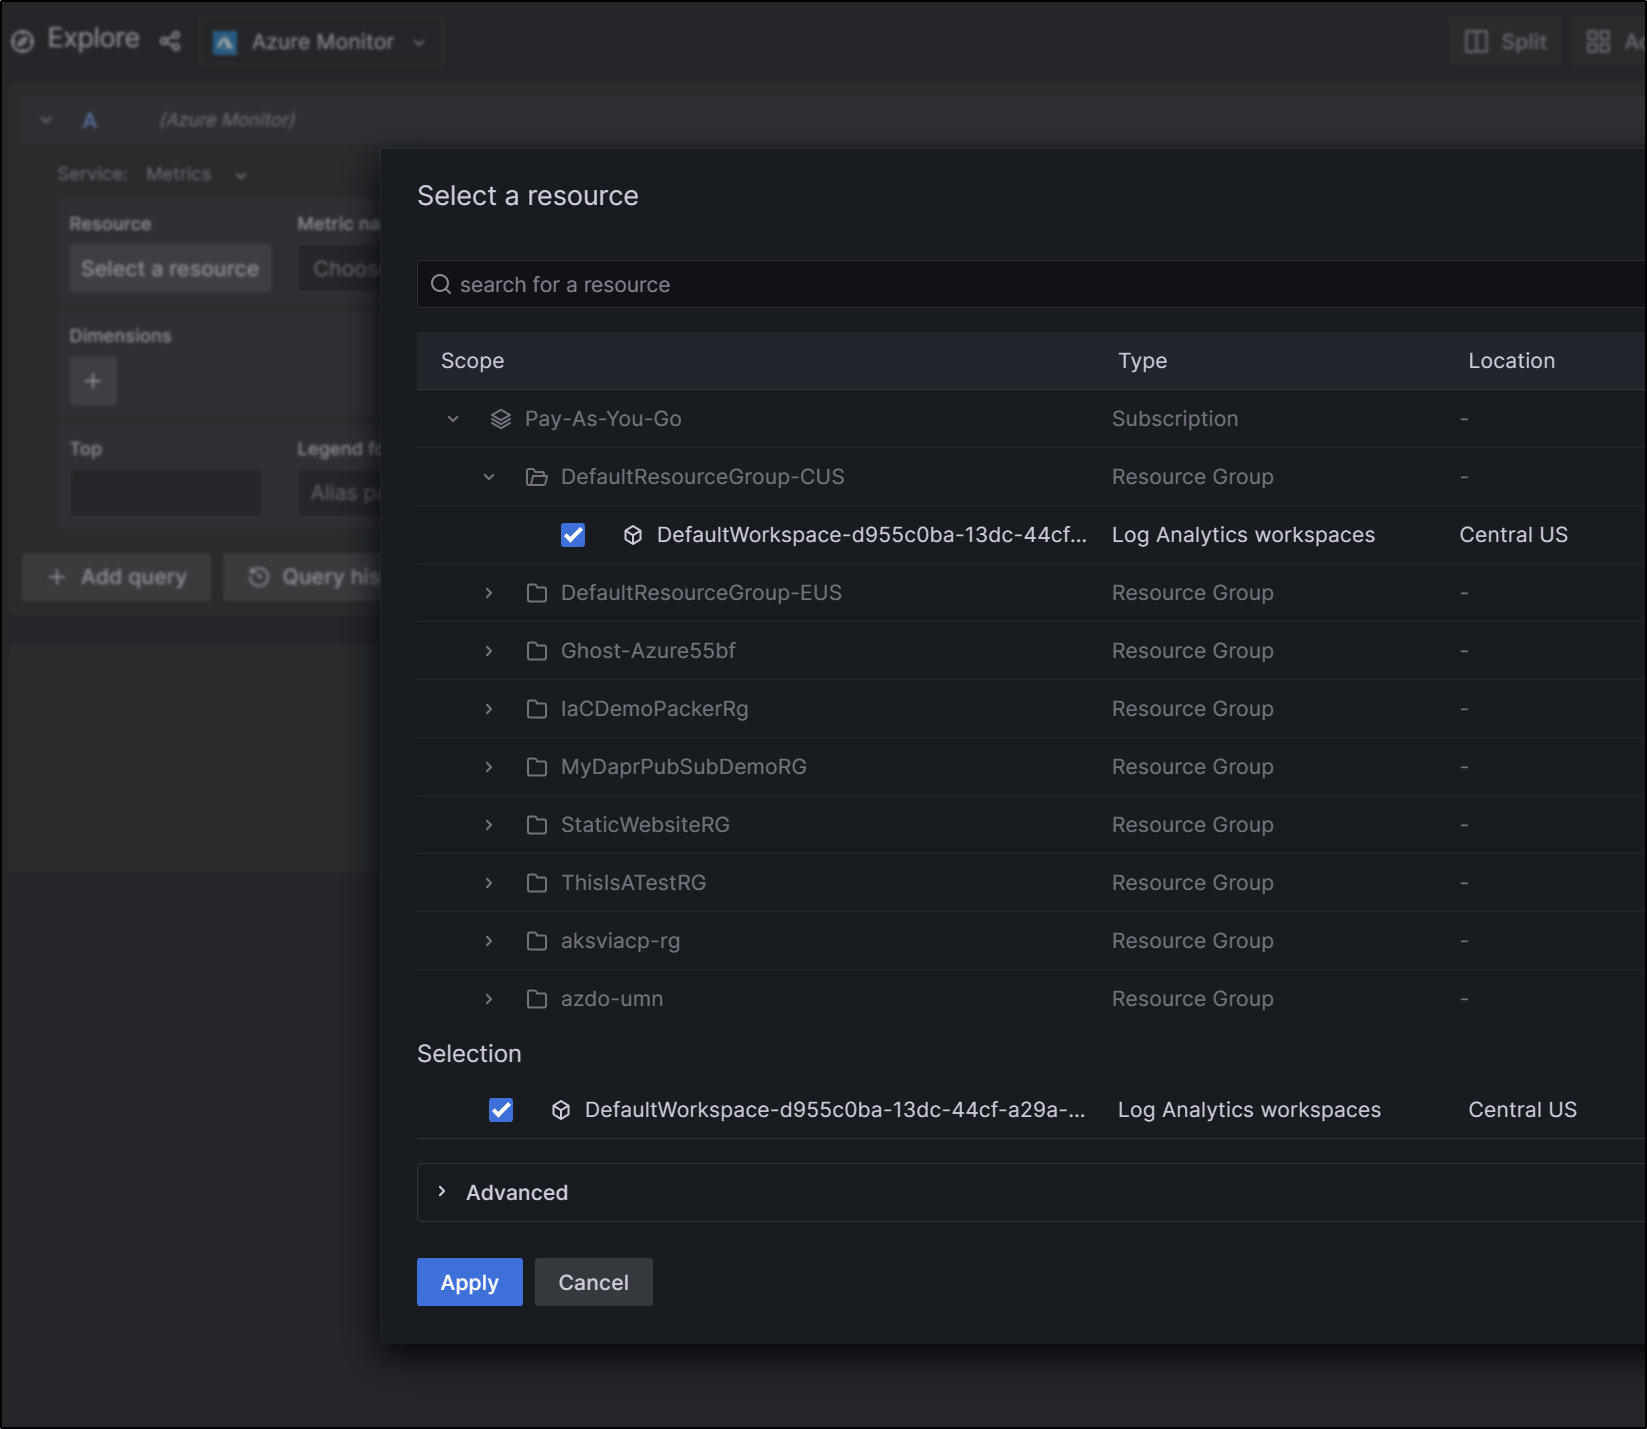
I can now explore and add a resource like a Workspace
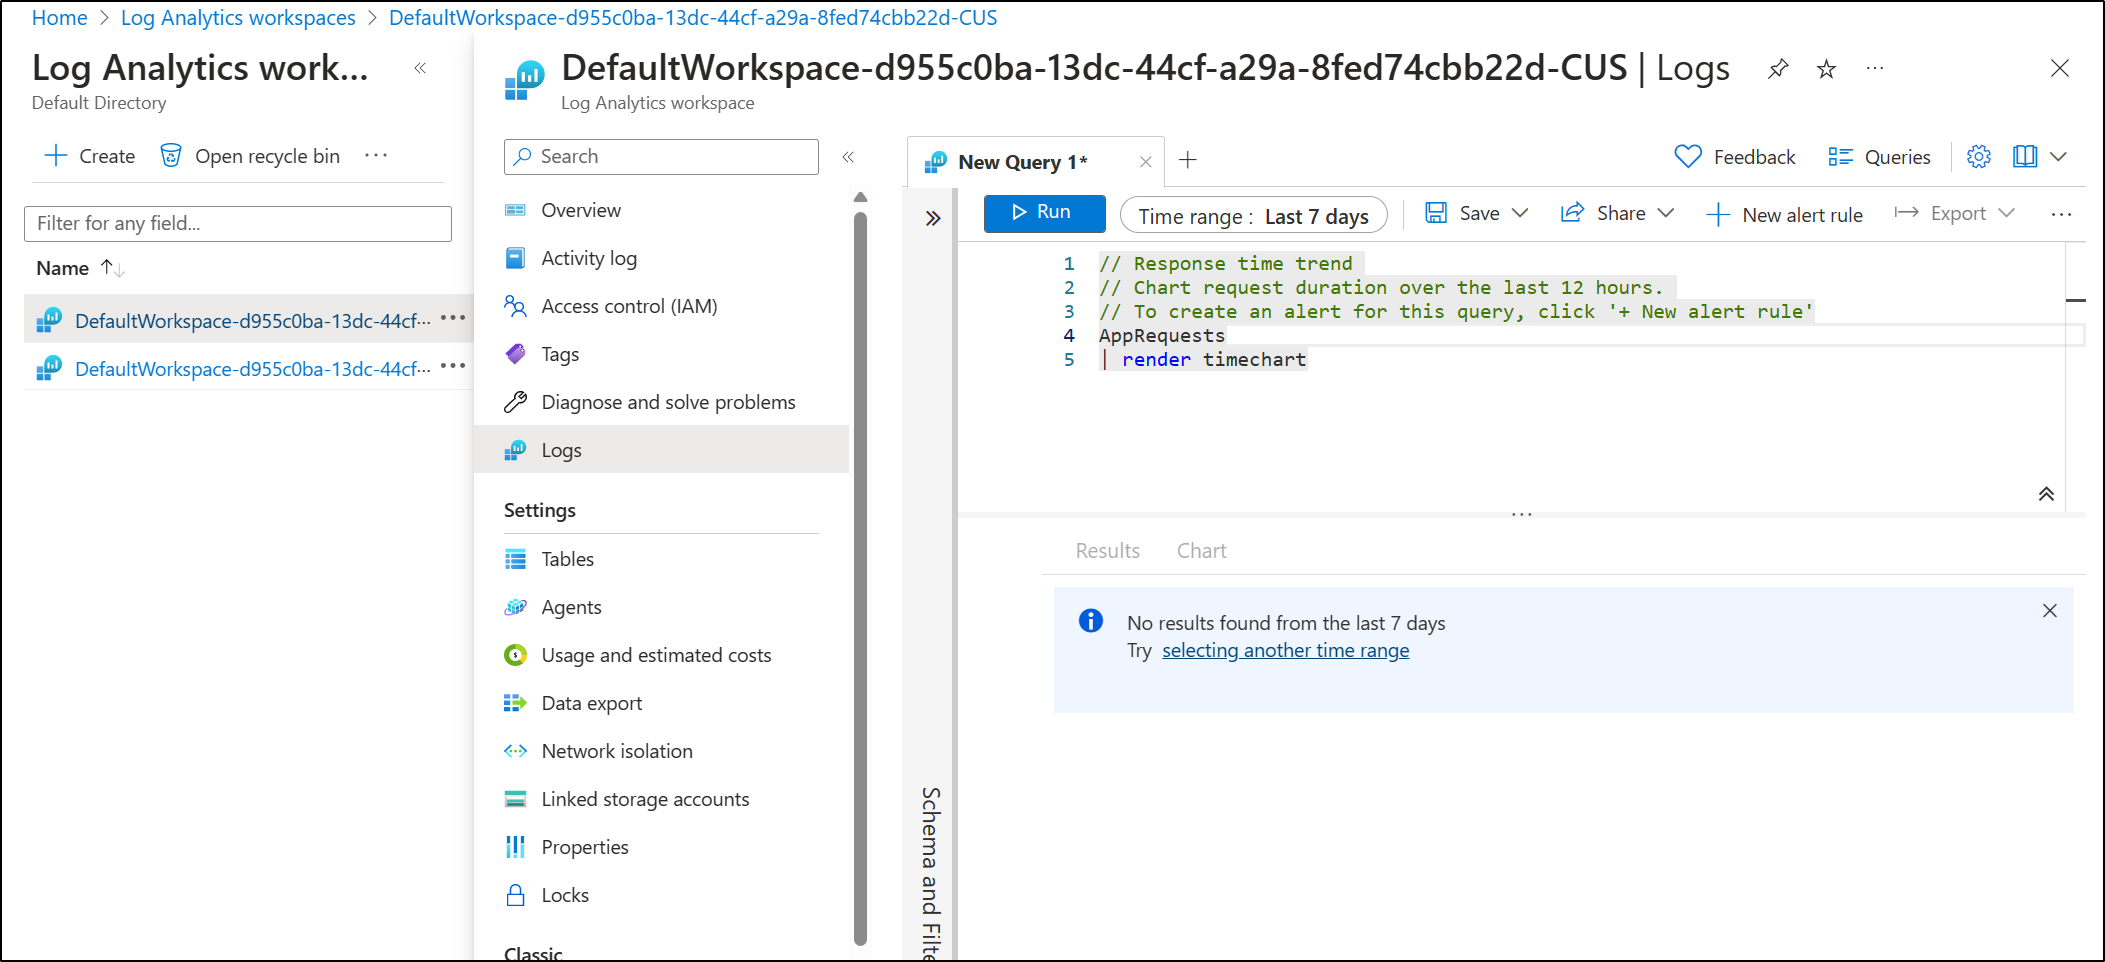
To see some data for a Azure Log Analytics Workspace, I’ll need to run some queries
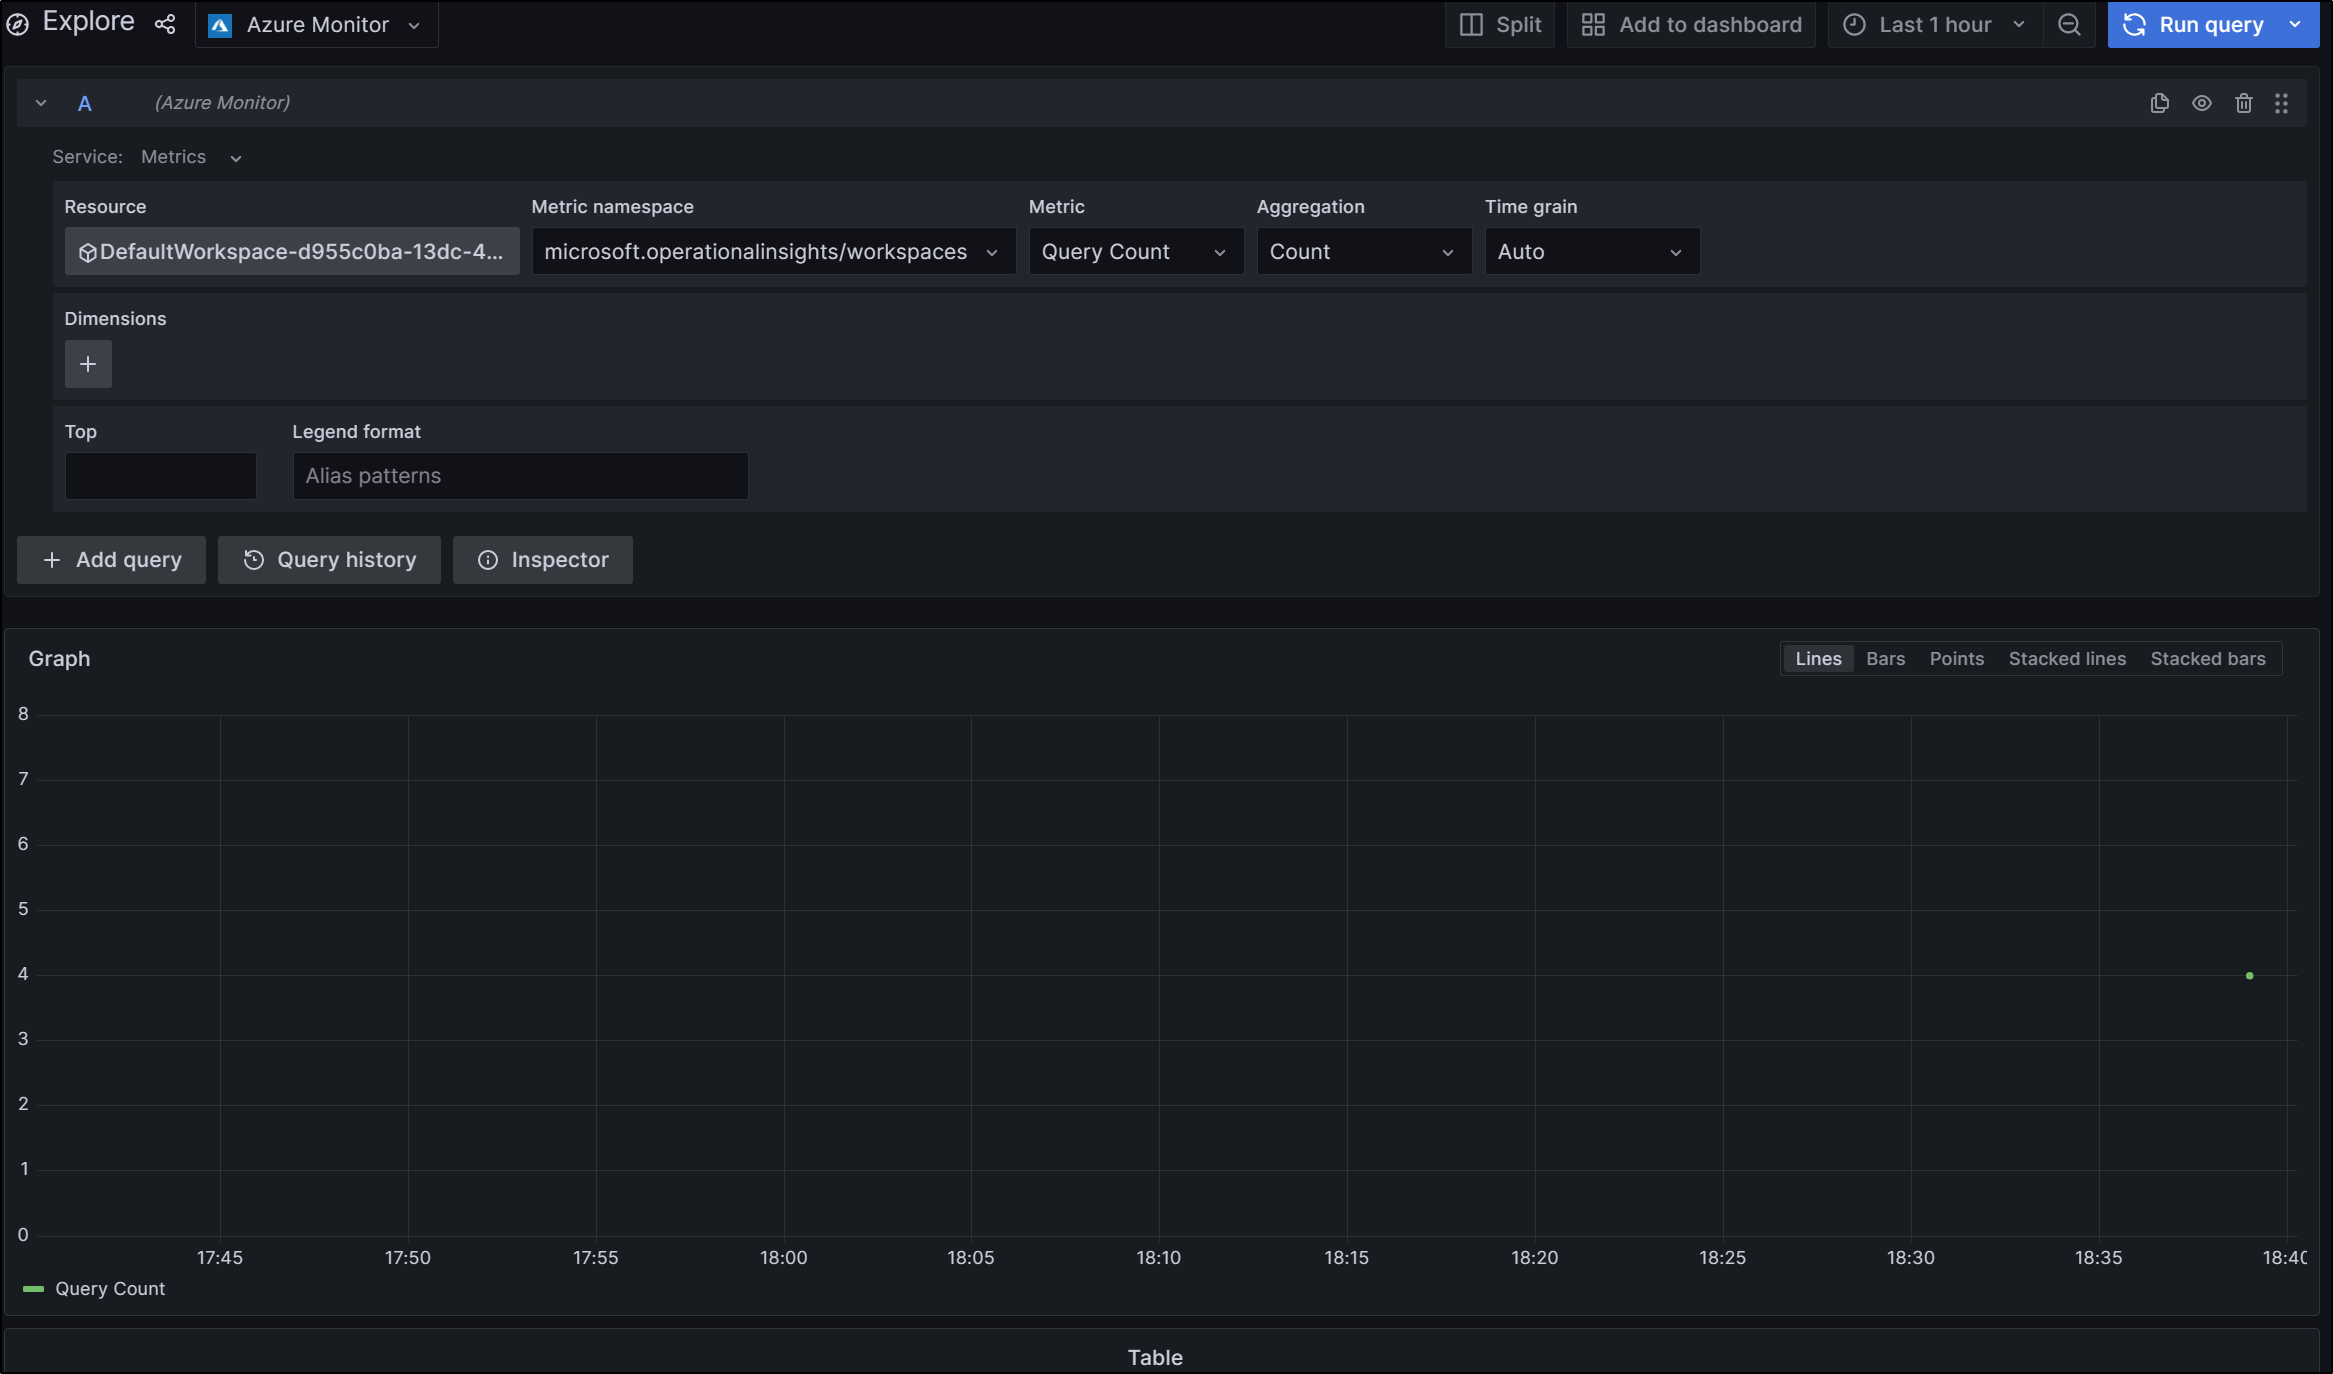
And now when I check on ALM queries, I can see some results in Grafana
Interestingly you need to use the Helm chart to setup email. It’s not via a plugin.
So as I can use Sendgrid, I might use the following helm values
$ cat grafana.all.yaml
grafana.ini:
  analytics:
    check_for_updates: true
  grafana_net:
    url: https://grafana.net
  log:
    mode: console
  paths:
    data: /var/lib/grafana/
    logs: /var/log/grafana
    plugins: /var/lib/grafana/plugins
    provisioning: /etc/grafana/provisioning
  smtp:
    enabled: true
    host: smtp.sendgrid.net:587
    user: apikey
    password: SG.asdfasdfasdfasdfsadasdf.asdfasdfasdfasdfasdfasdf-asdfasdfasd
    skip_verify: false
    from_address: isaac@freshbrewed.science
    from_name: Grafana
  server:
    domain: '{{ if (and .Values.ingress.enabled .Values.ingress.hosts) }}{{ .Values.ingress.hosts
      | first }}{{ else }}''''{{ end }}'
Then you can upgrade the existing deploy with those values
$ helm upgrade grafana -f grafana.all.yaml grafana/grafana
Release "grafana" has been upgraded. Happy Helming!
NAME: grafana
LAST DEPLOYED: Thu Apr 20 20:16:13 2023
NAMESPACE: default
STATUS: deployed
REVISION: 2
NOTES:
1. Get your 'admin' user password by running:

   kubectl get secret --namespace default grafana -o jsonpath="{.data.admin-password}" | base64 --decode ; echo


2. The Grafana server can be accessed via port 80 on the following DNS name from within your cluster:

   grafana.default.svc.cluster.local

   Get the Grafana URL to visit by running these commands in the same shell:
     export POD_NAME=$(kubectl get pods --namespace default -l "app.kubernetes.io/name=grafana,app.kubernetes.io/instance=grafana" -o jsonpath="{.items[0].metadata.name}")
     kubectl --namespace default port-forward $POD_NAME 3000

3. Login with the password from step 1 and the username: admin
#################################################################################
######   WARNING: Persistence is disabled!!! You will lose your data when   #####
######            the Grafana pod is terminated.                            #####
#################################################################################
….
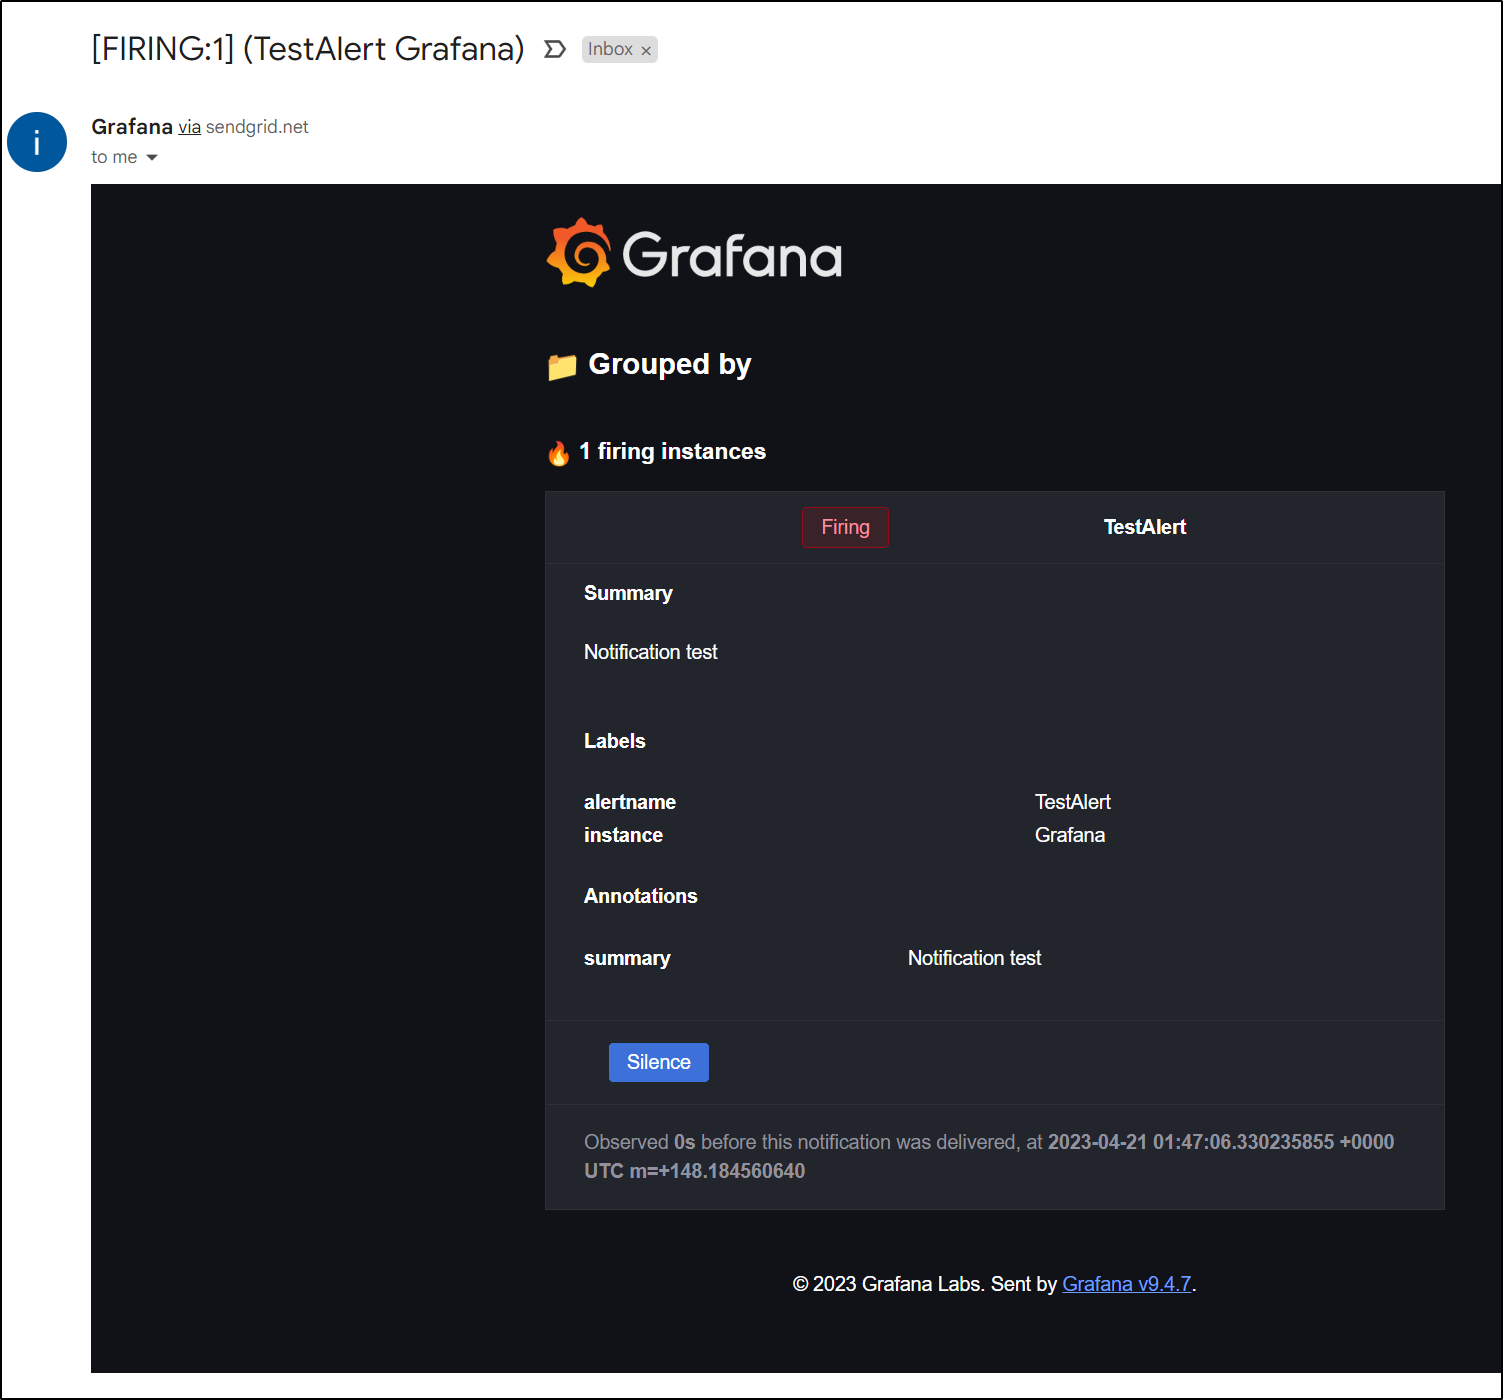
I can now see it in my inbox
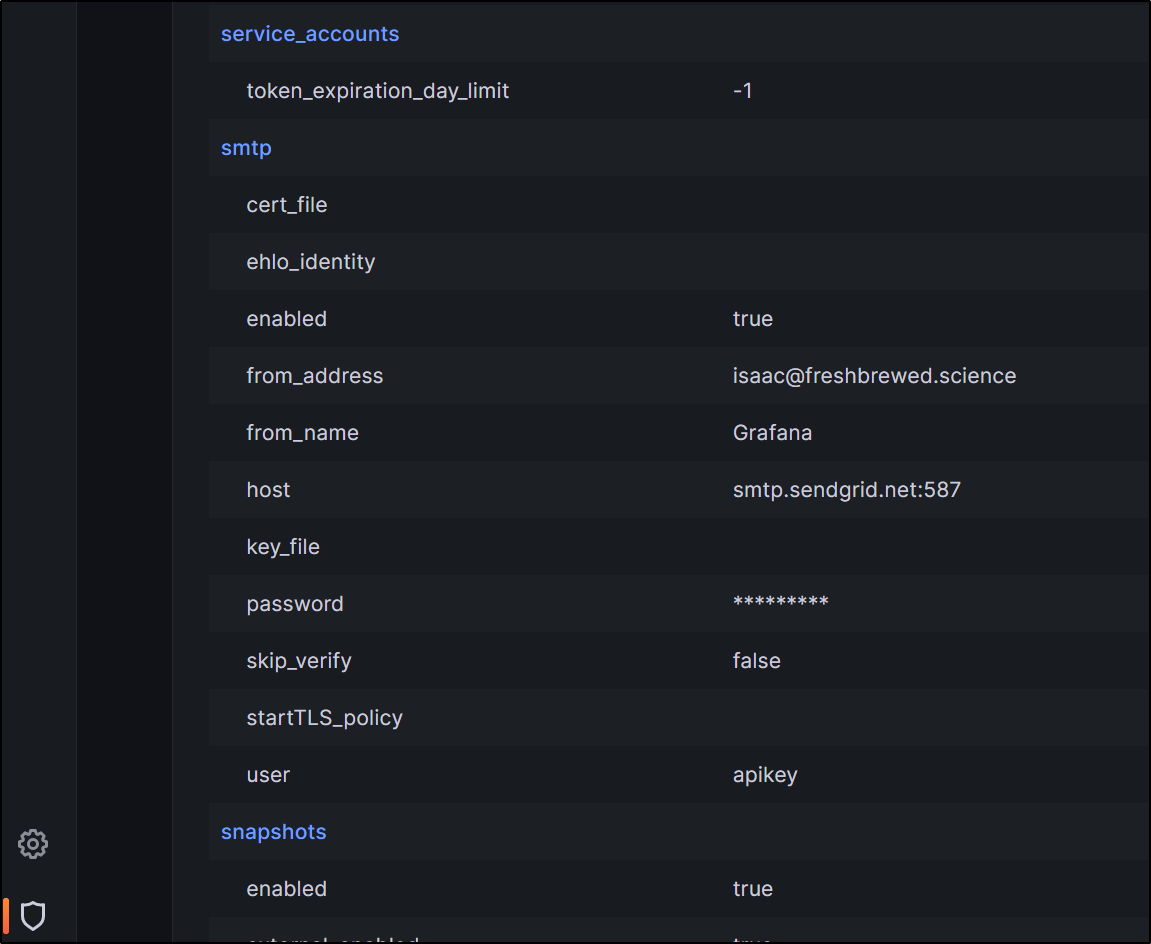
We can also go to Server Admin settings to check the values
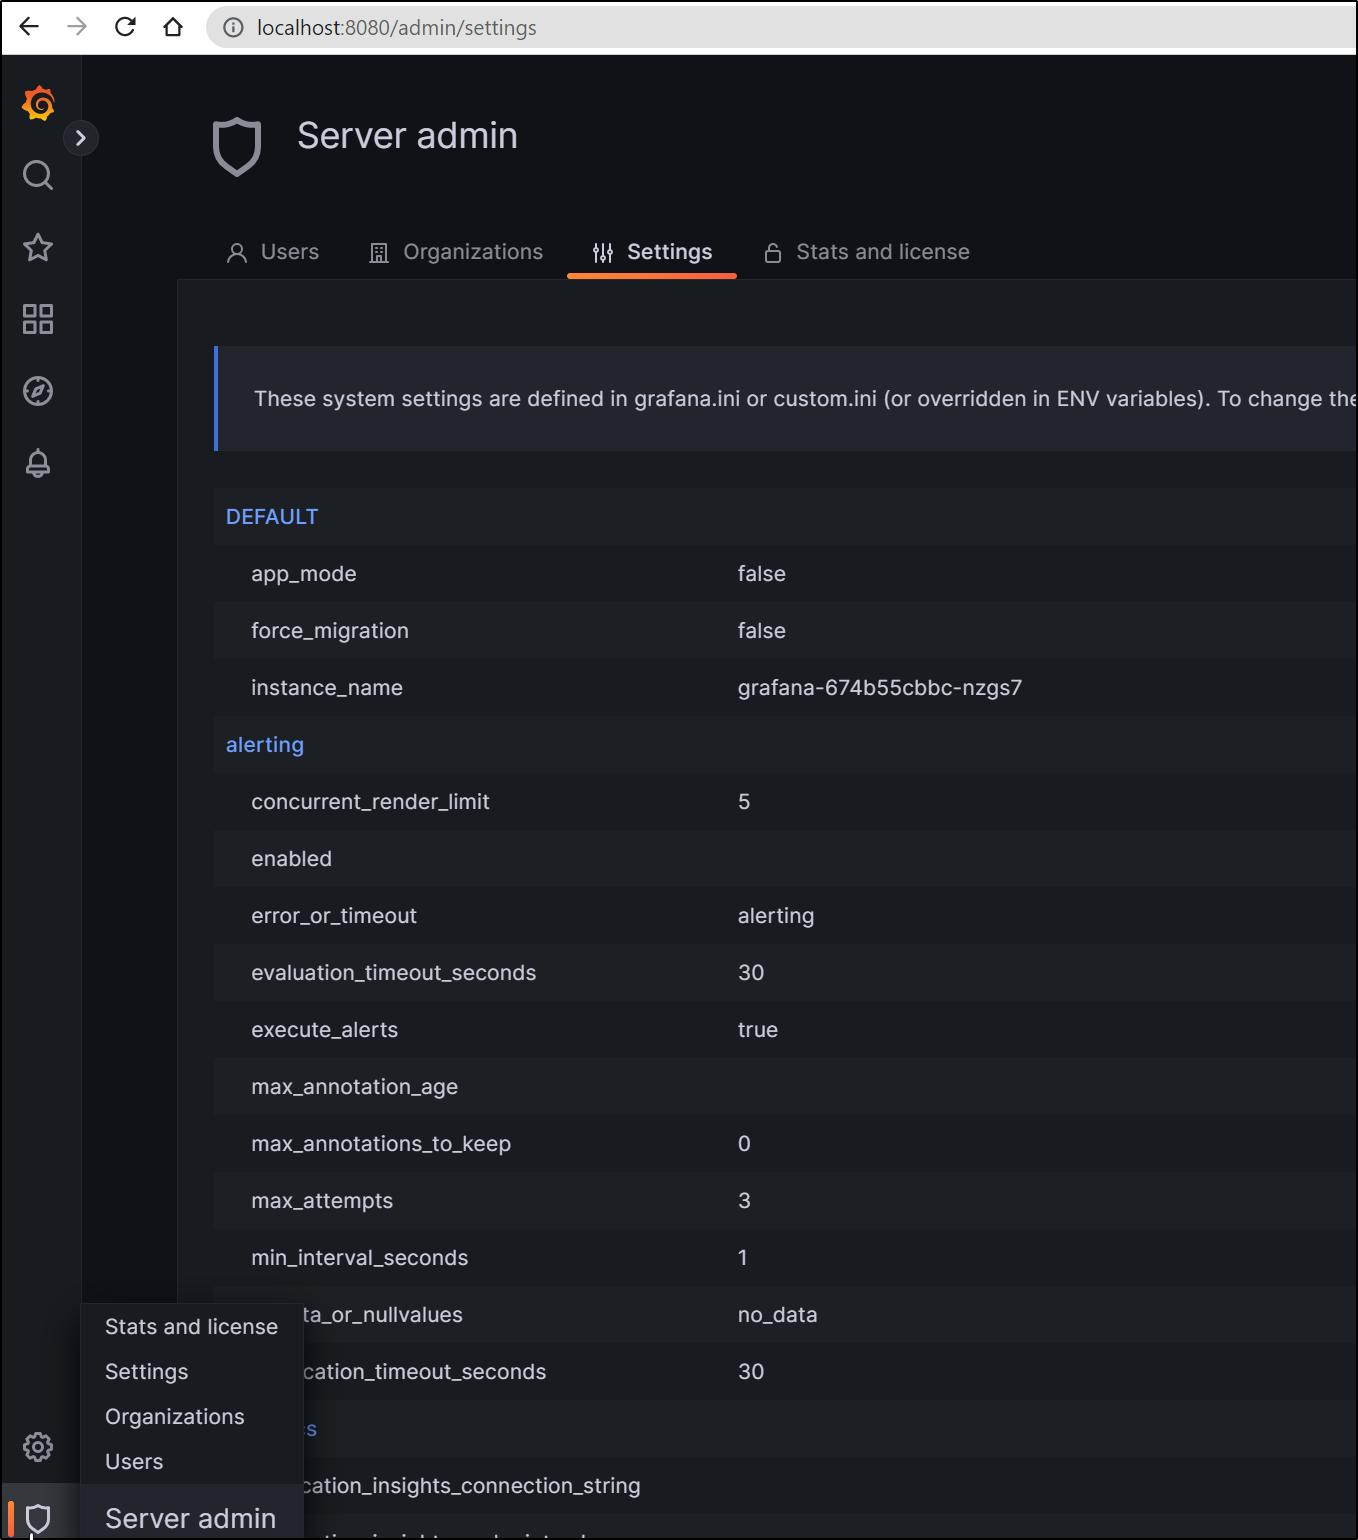
and see the same settings
PagerDuty
So one route we may want to pursue is to alert our pagerduty service when a condition happens.
To do so, we go PD and find our services to find the email integration. If absent, under integrations you can add it
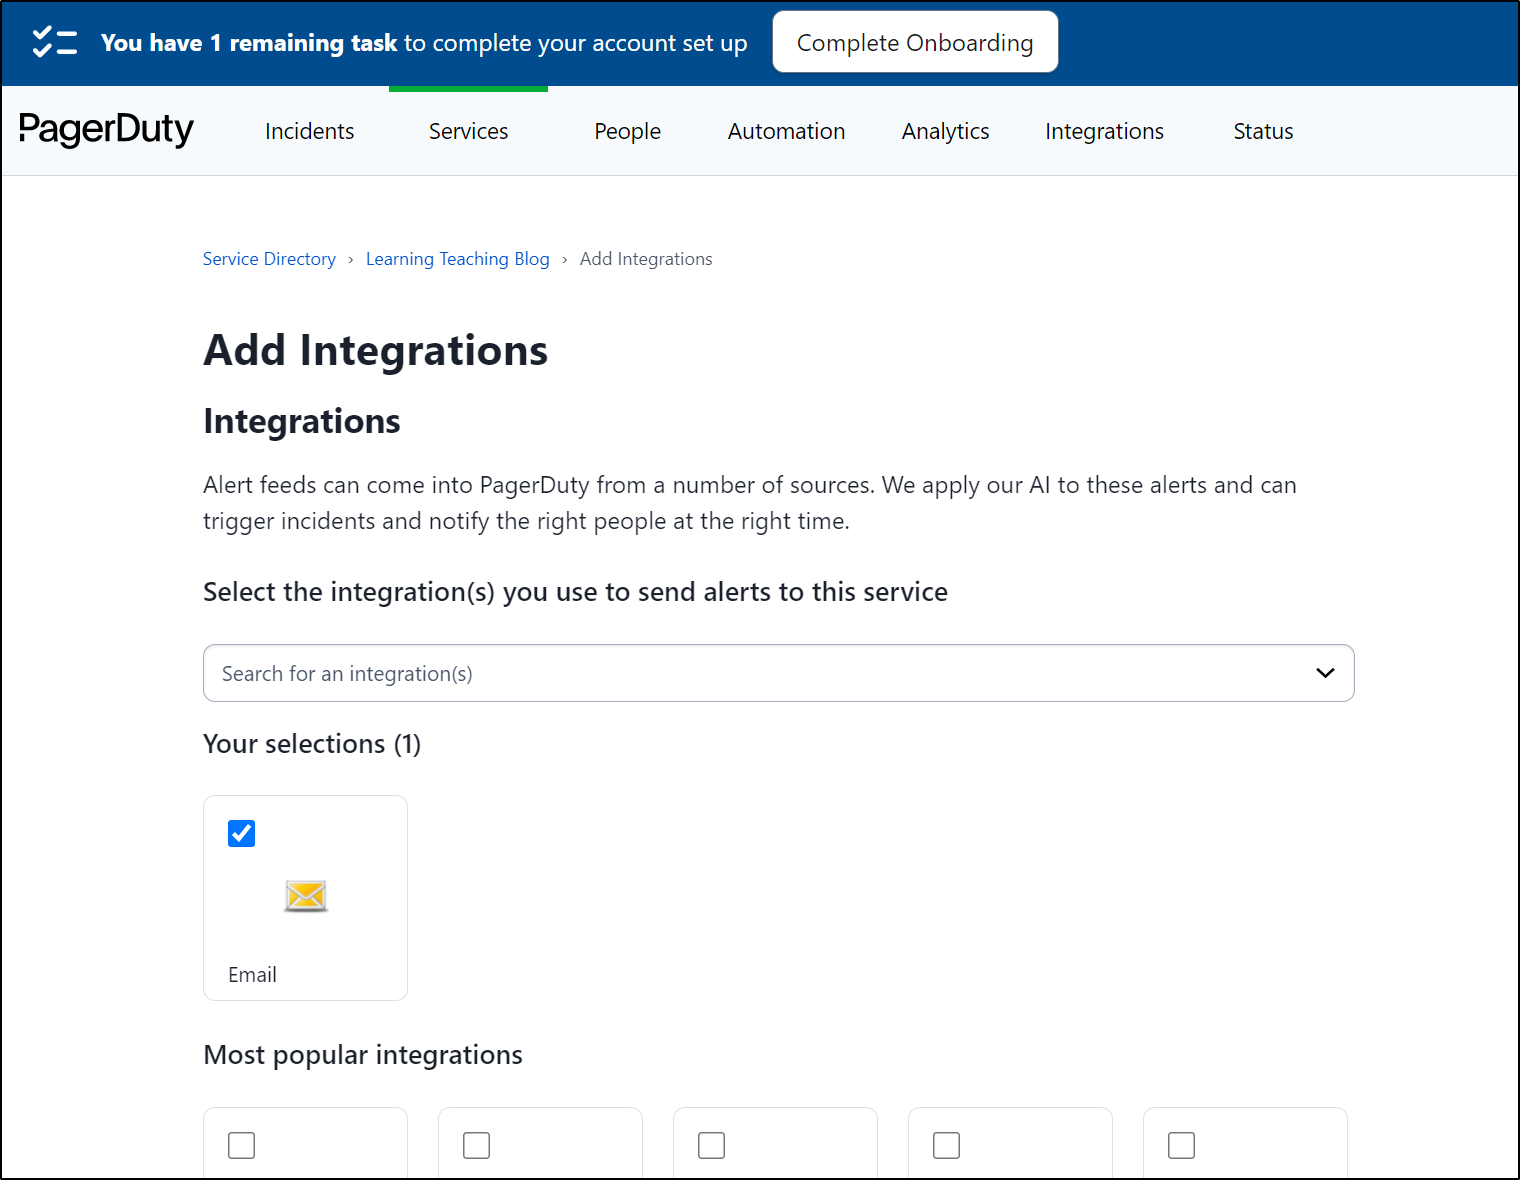
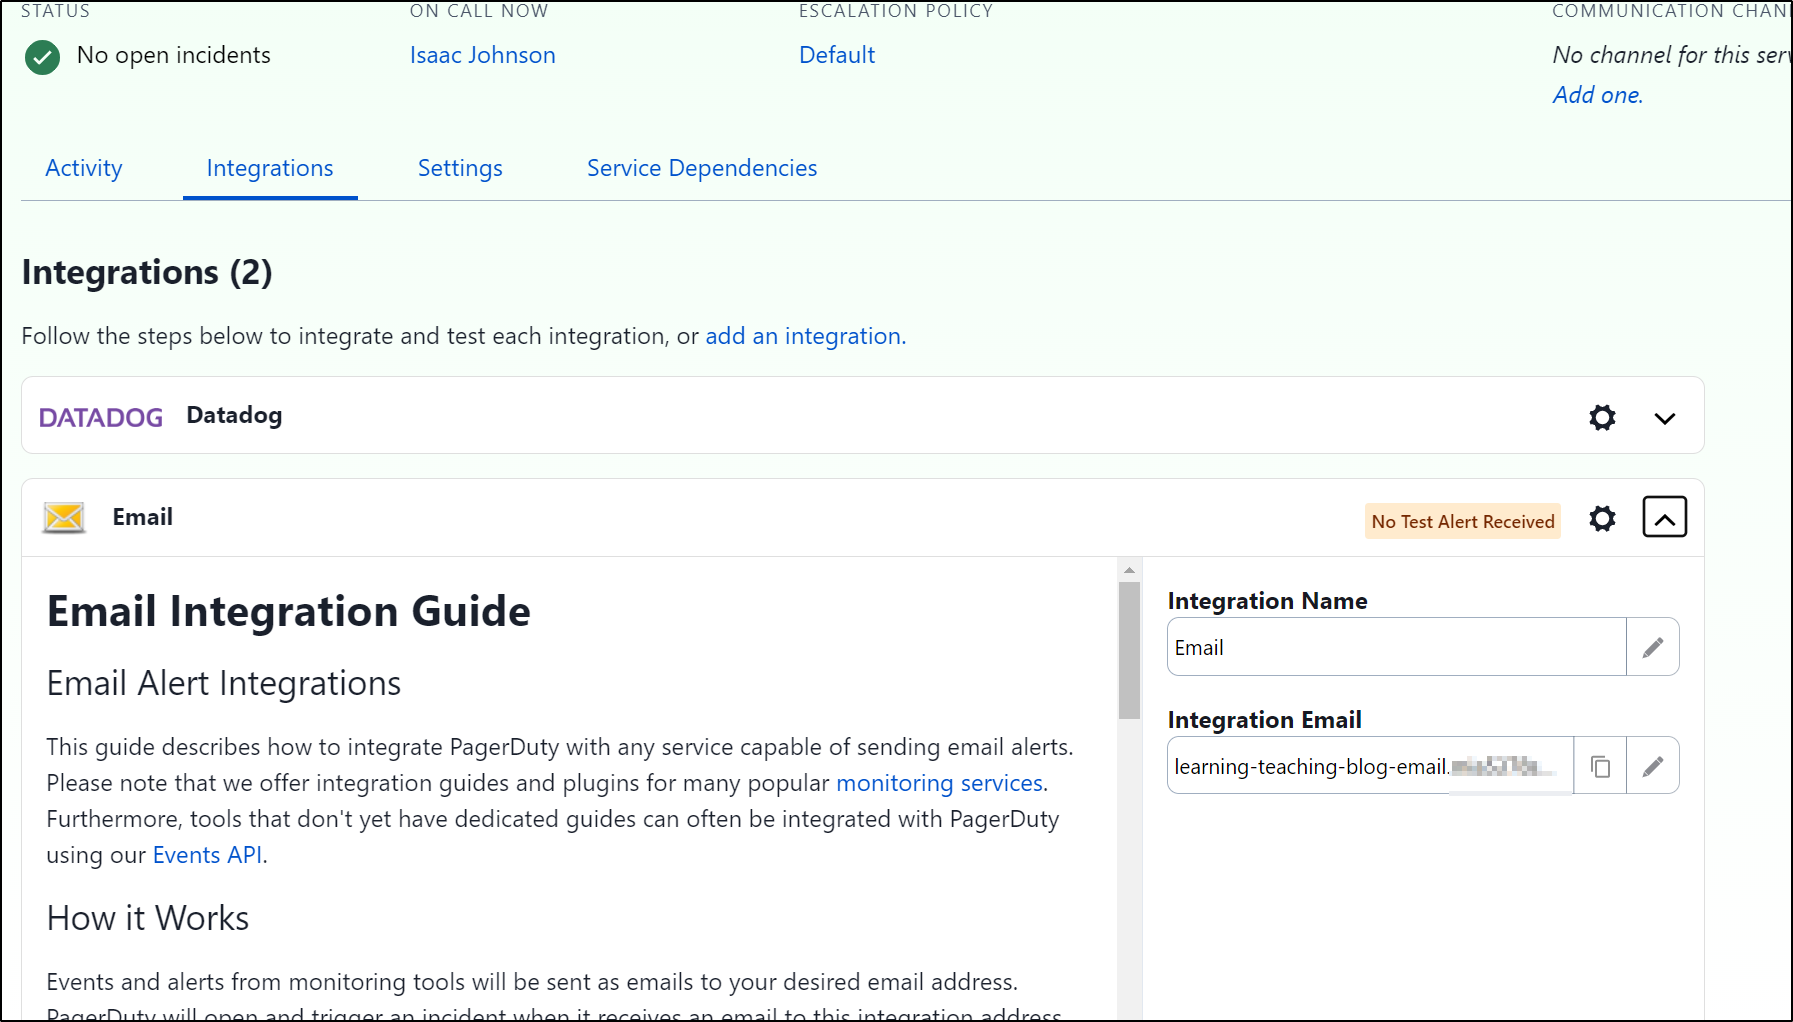
We can now see an email address we can use to trigger PD
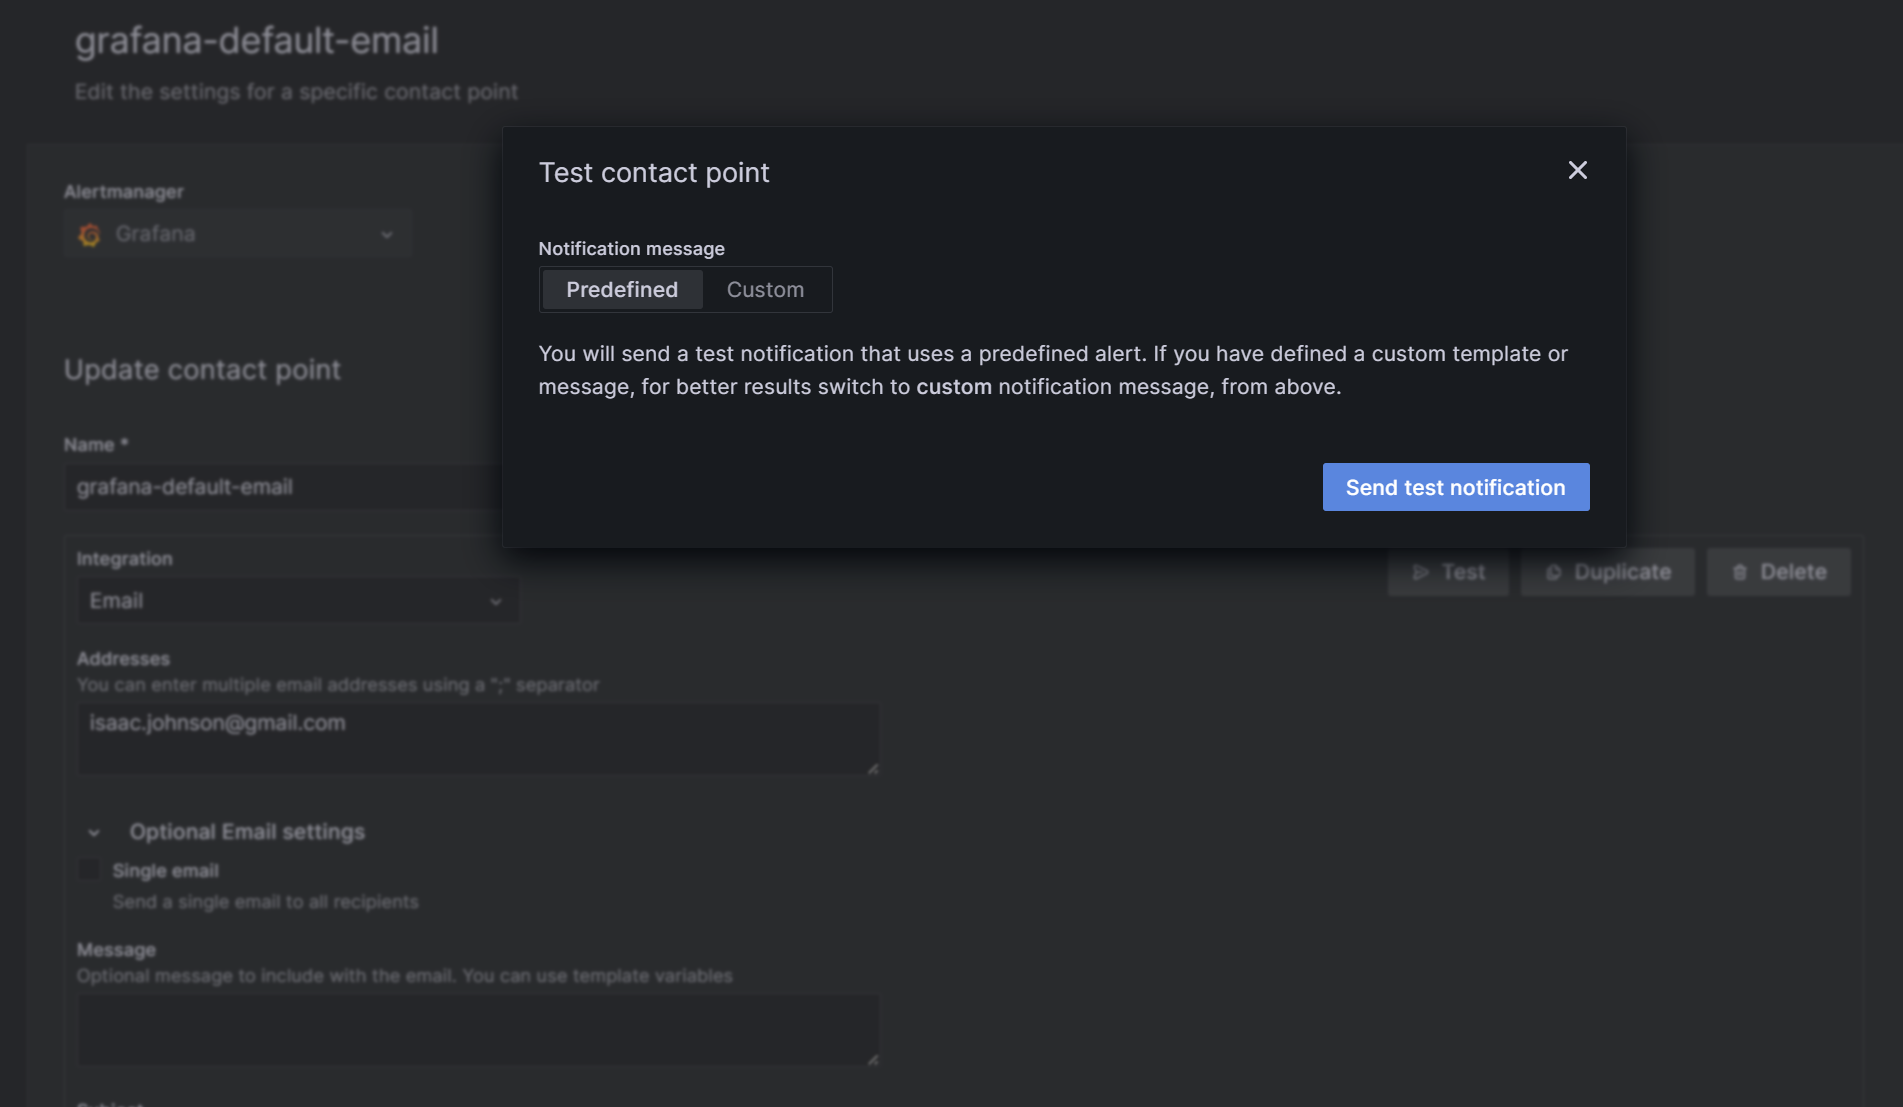
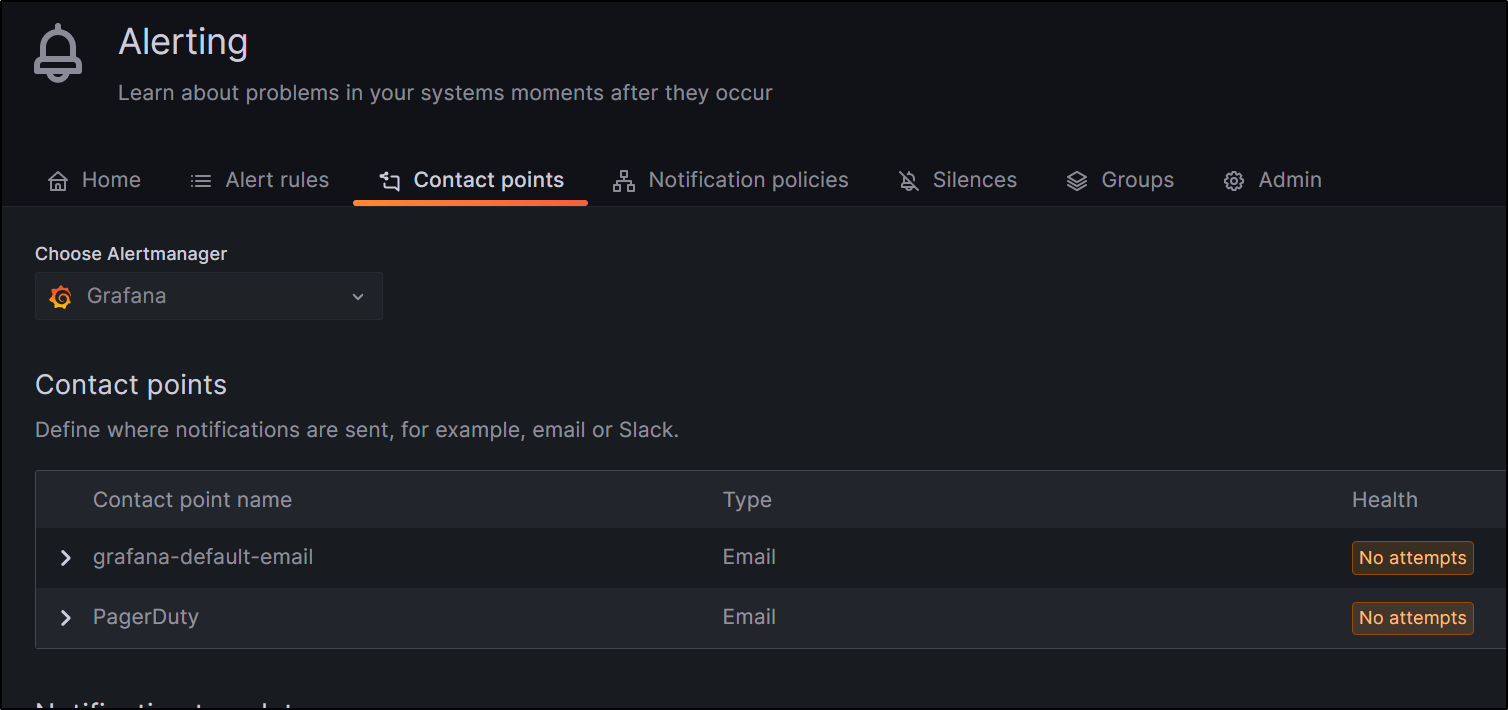
which we then add as a contact point in Grafana
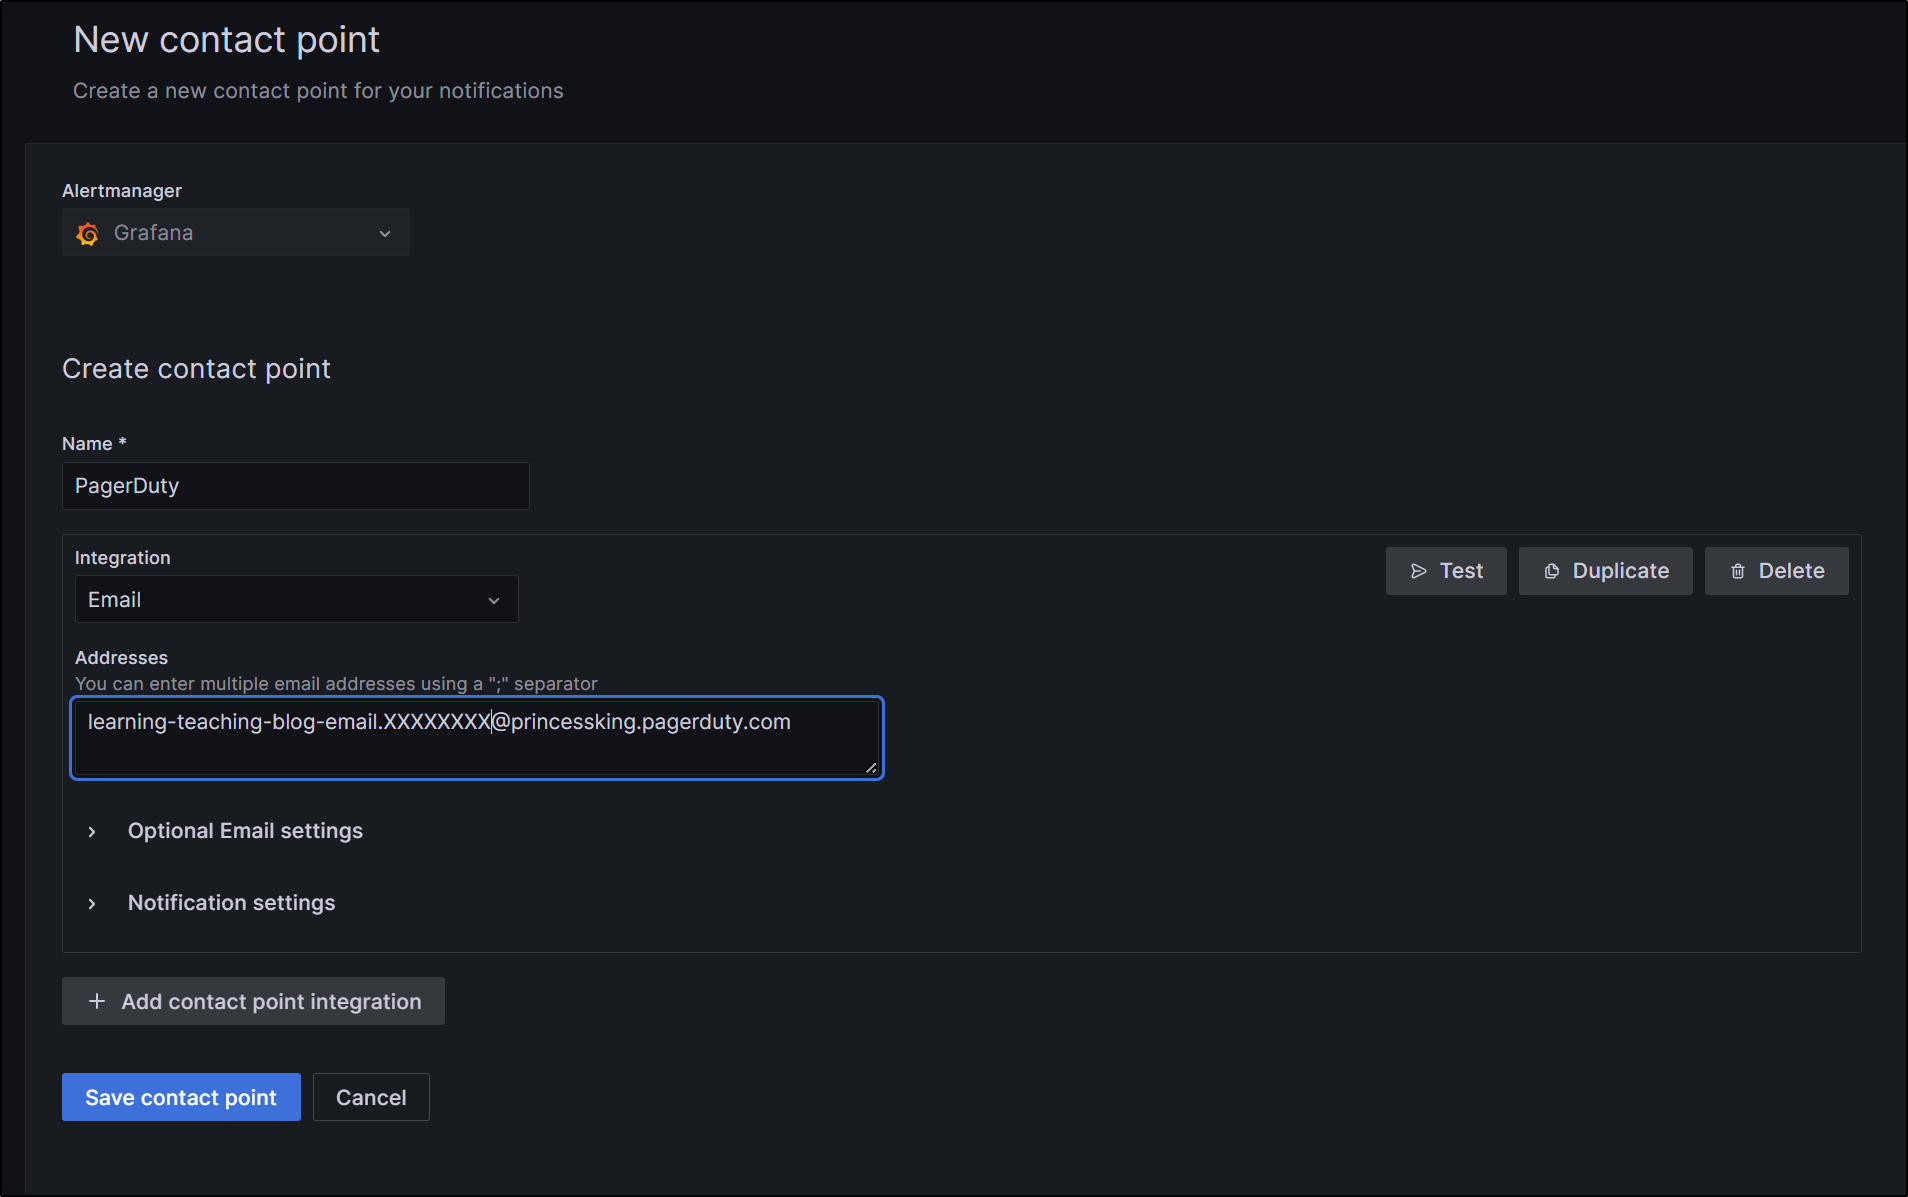
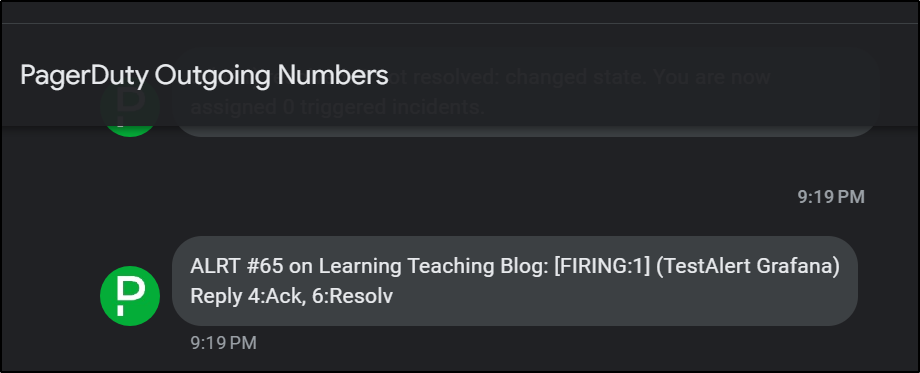
I can test it there
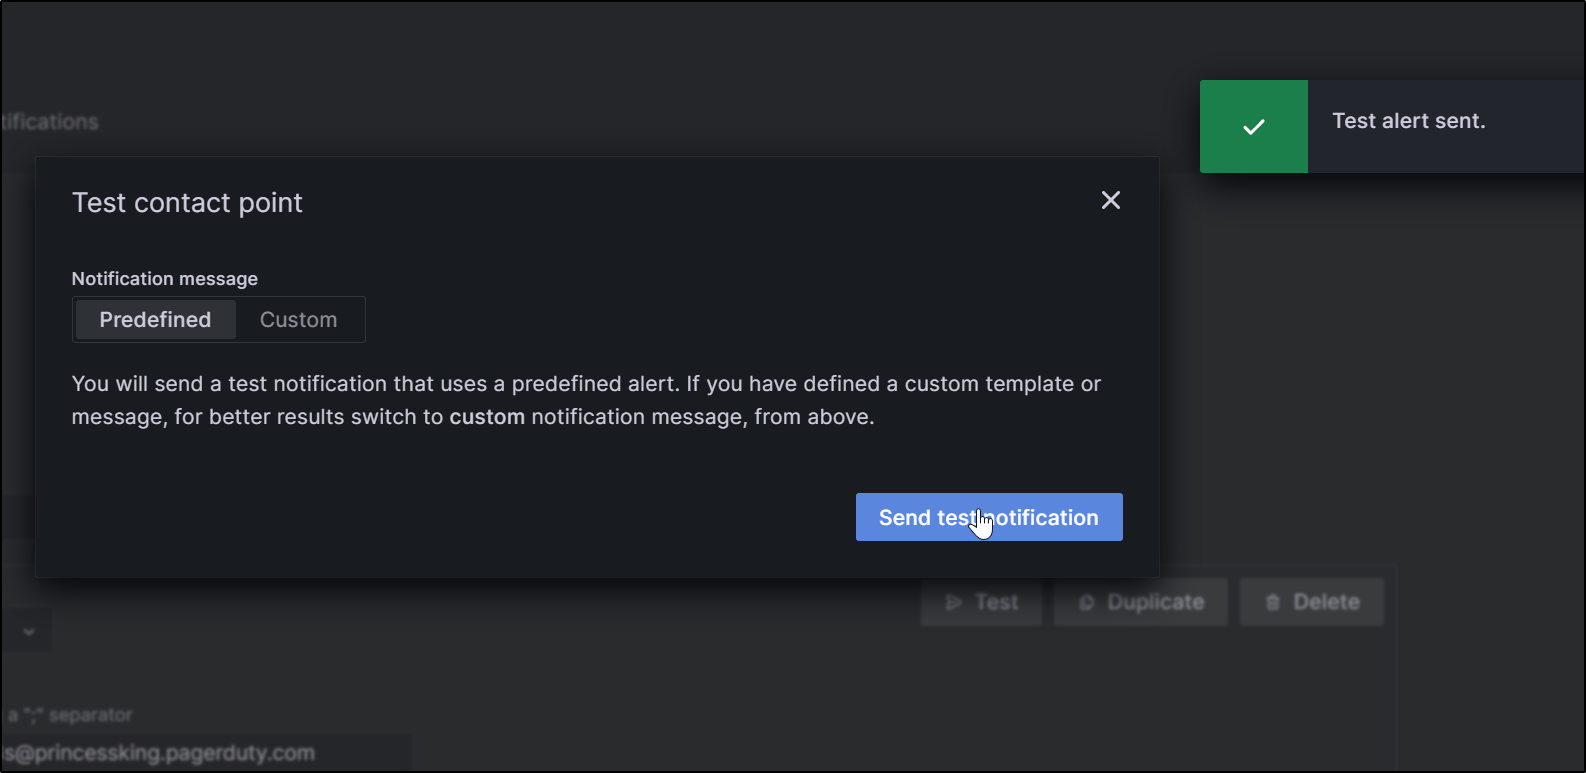
which then triggers Pagerduty
Now that we have this new Contact Point
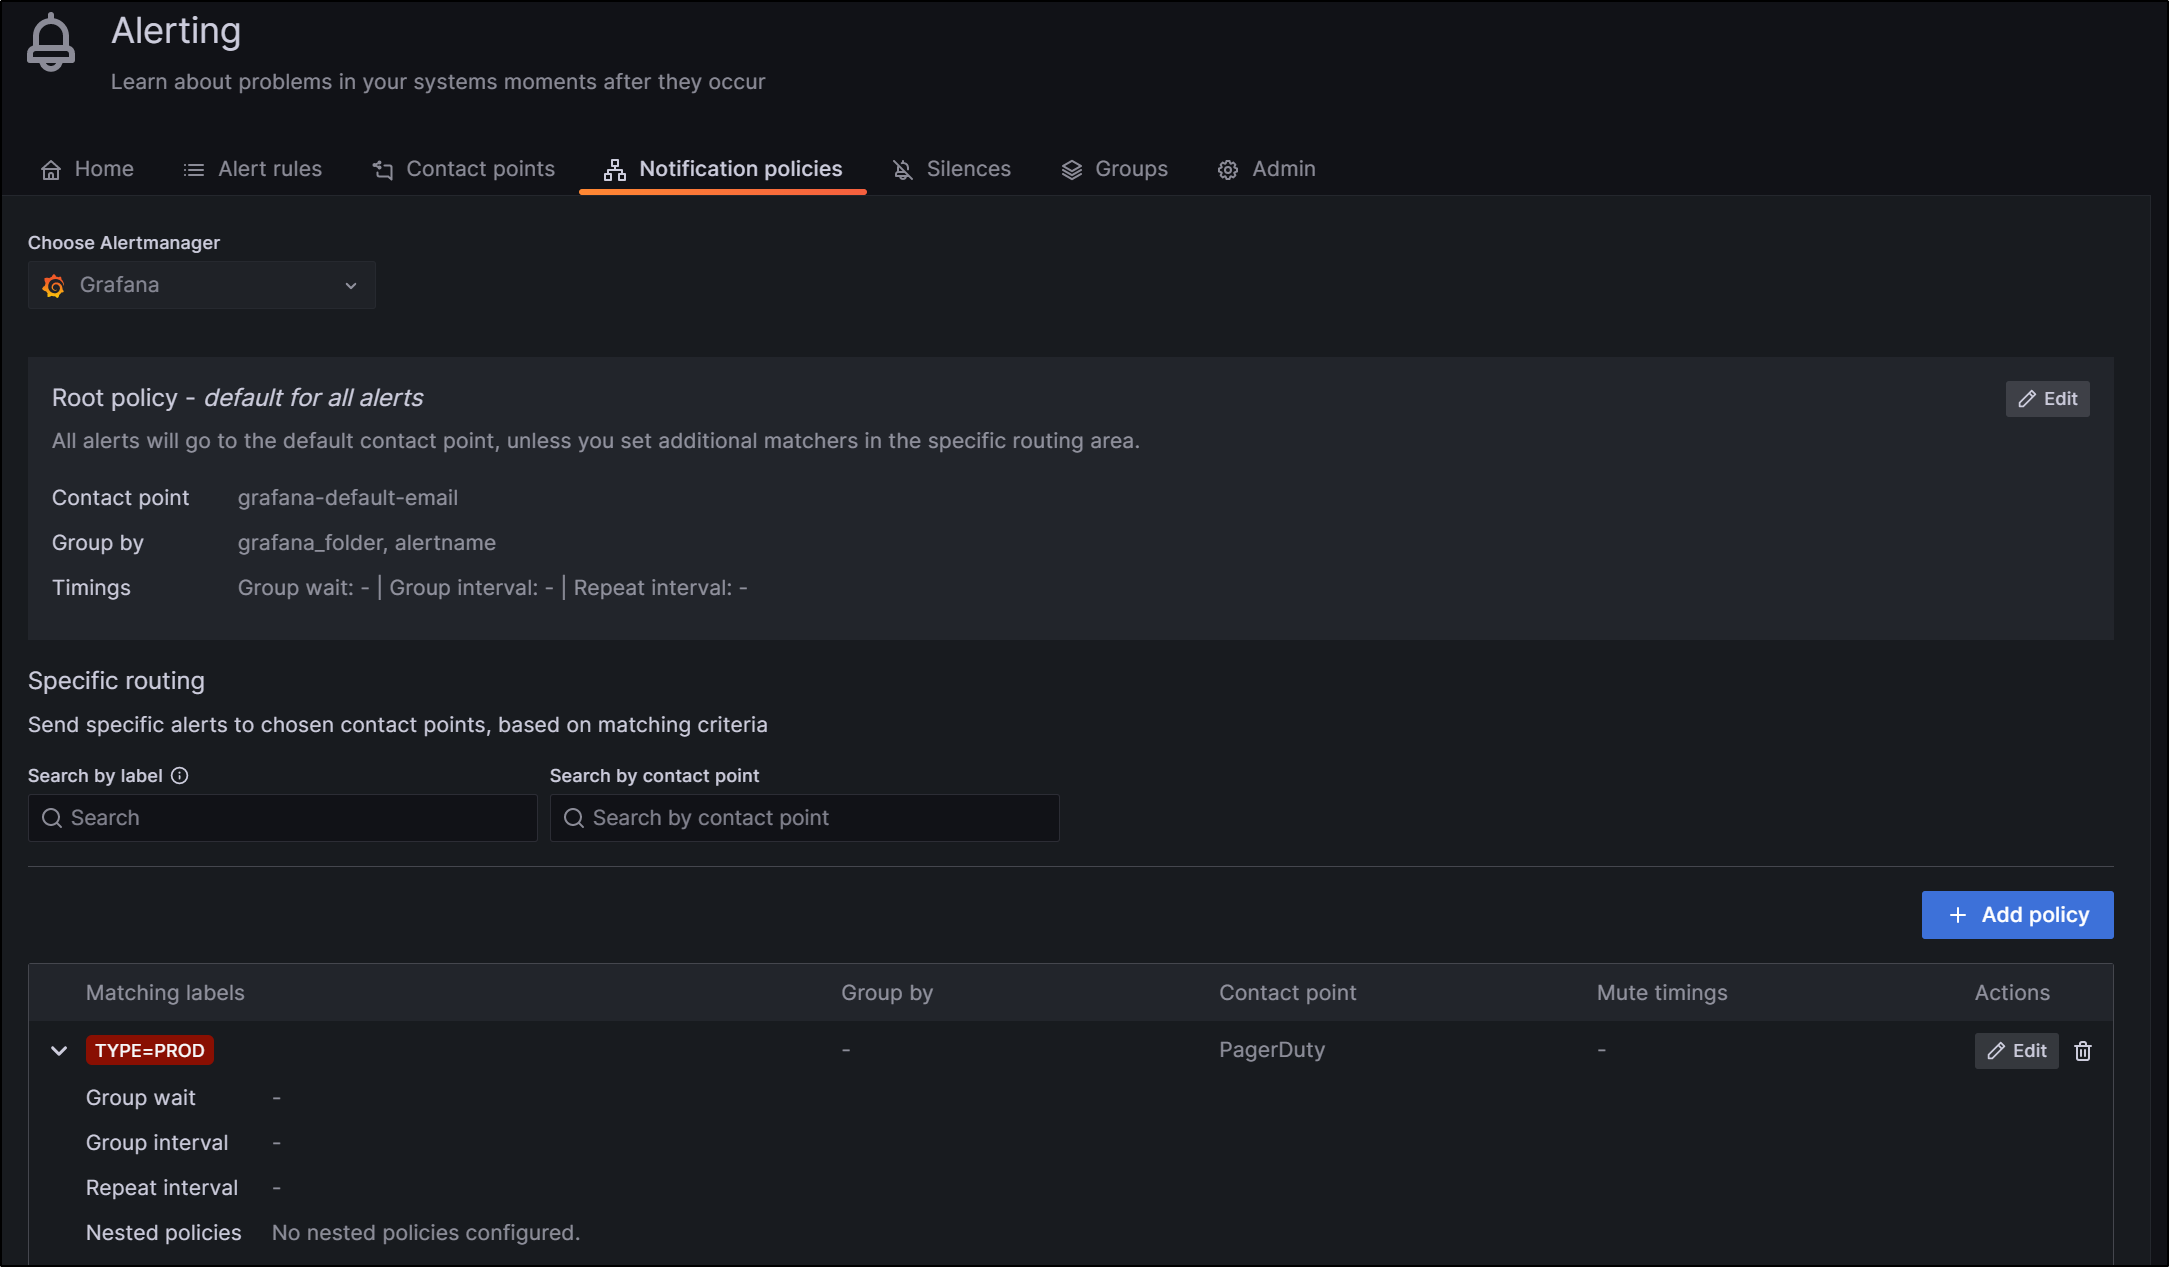
We cna use it in a new “Specific Policy” in Notification Policies
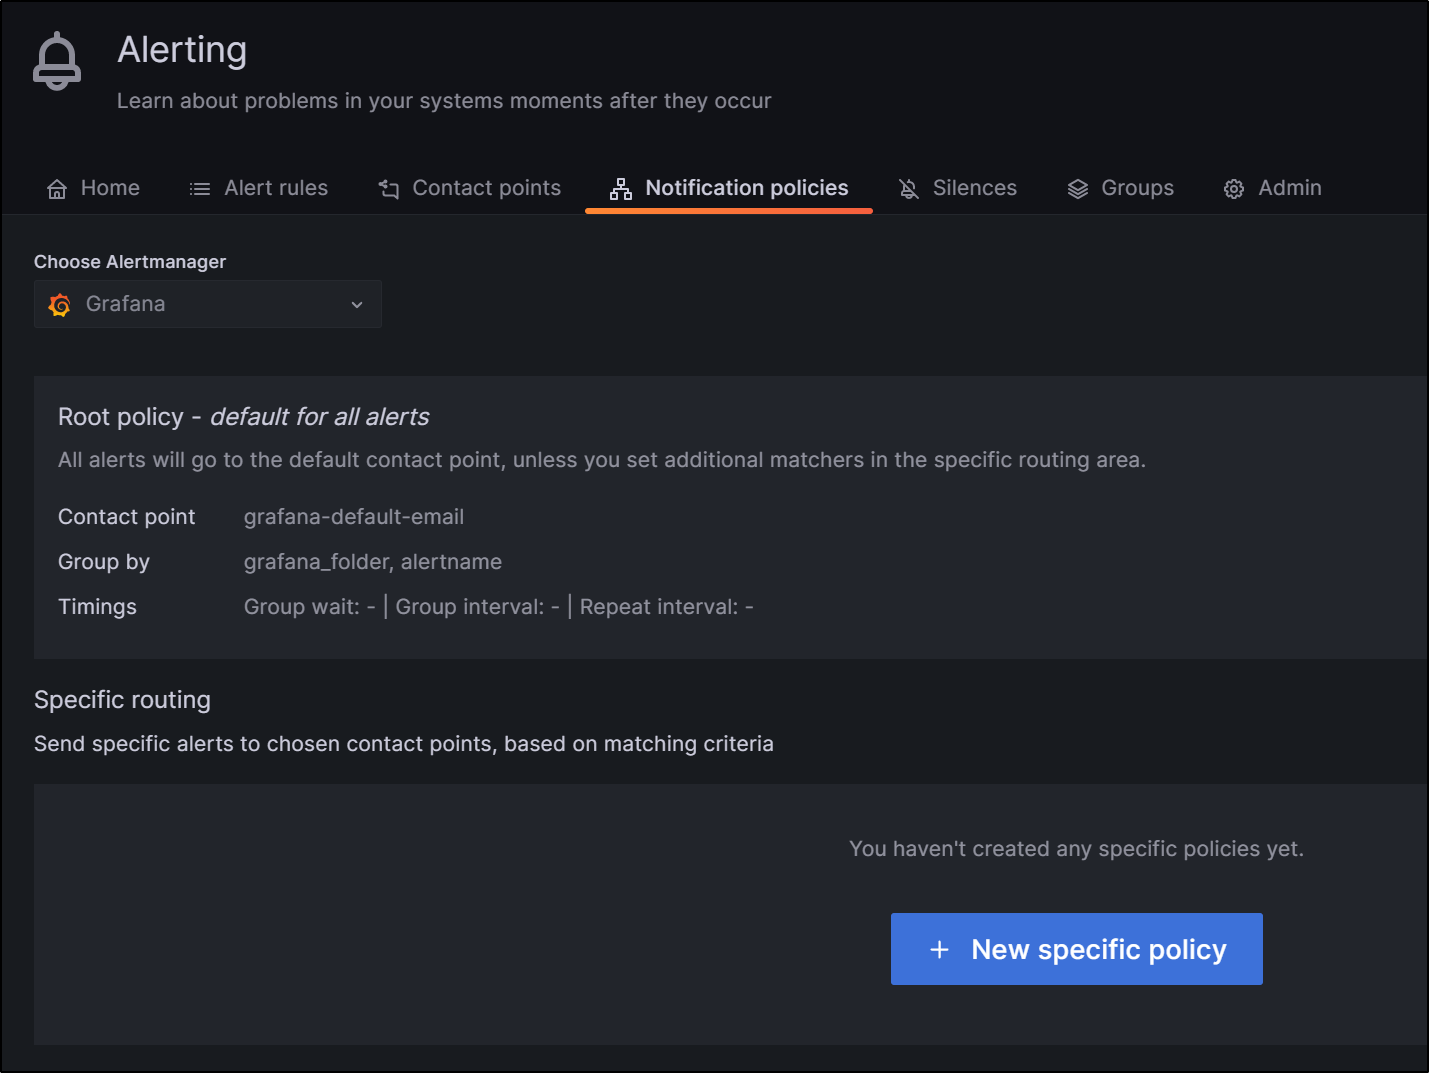
We can create a rule that if our alert sets a lable of “TYPE” to “PROD”, we kick off PD
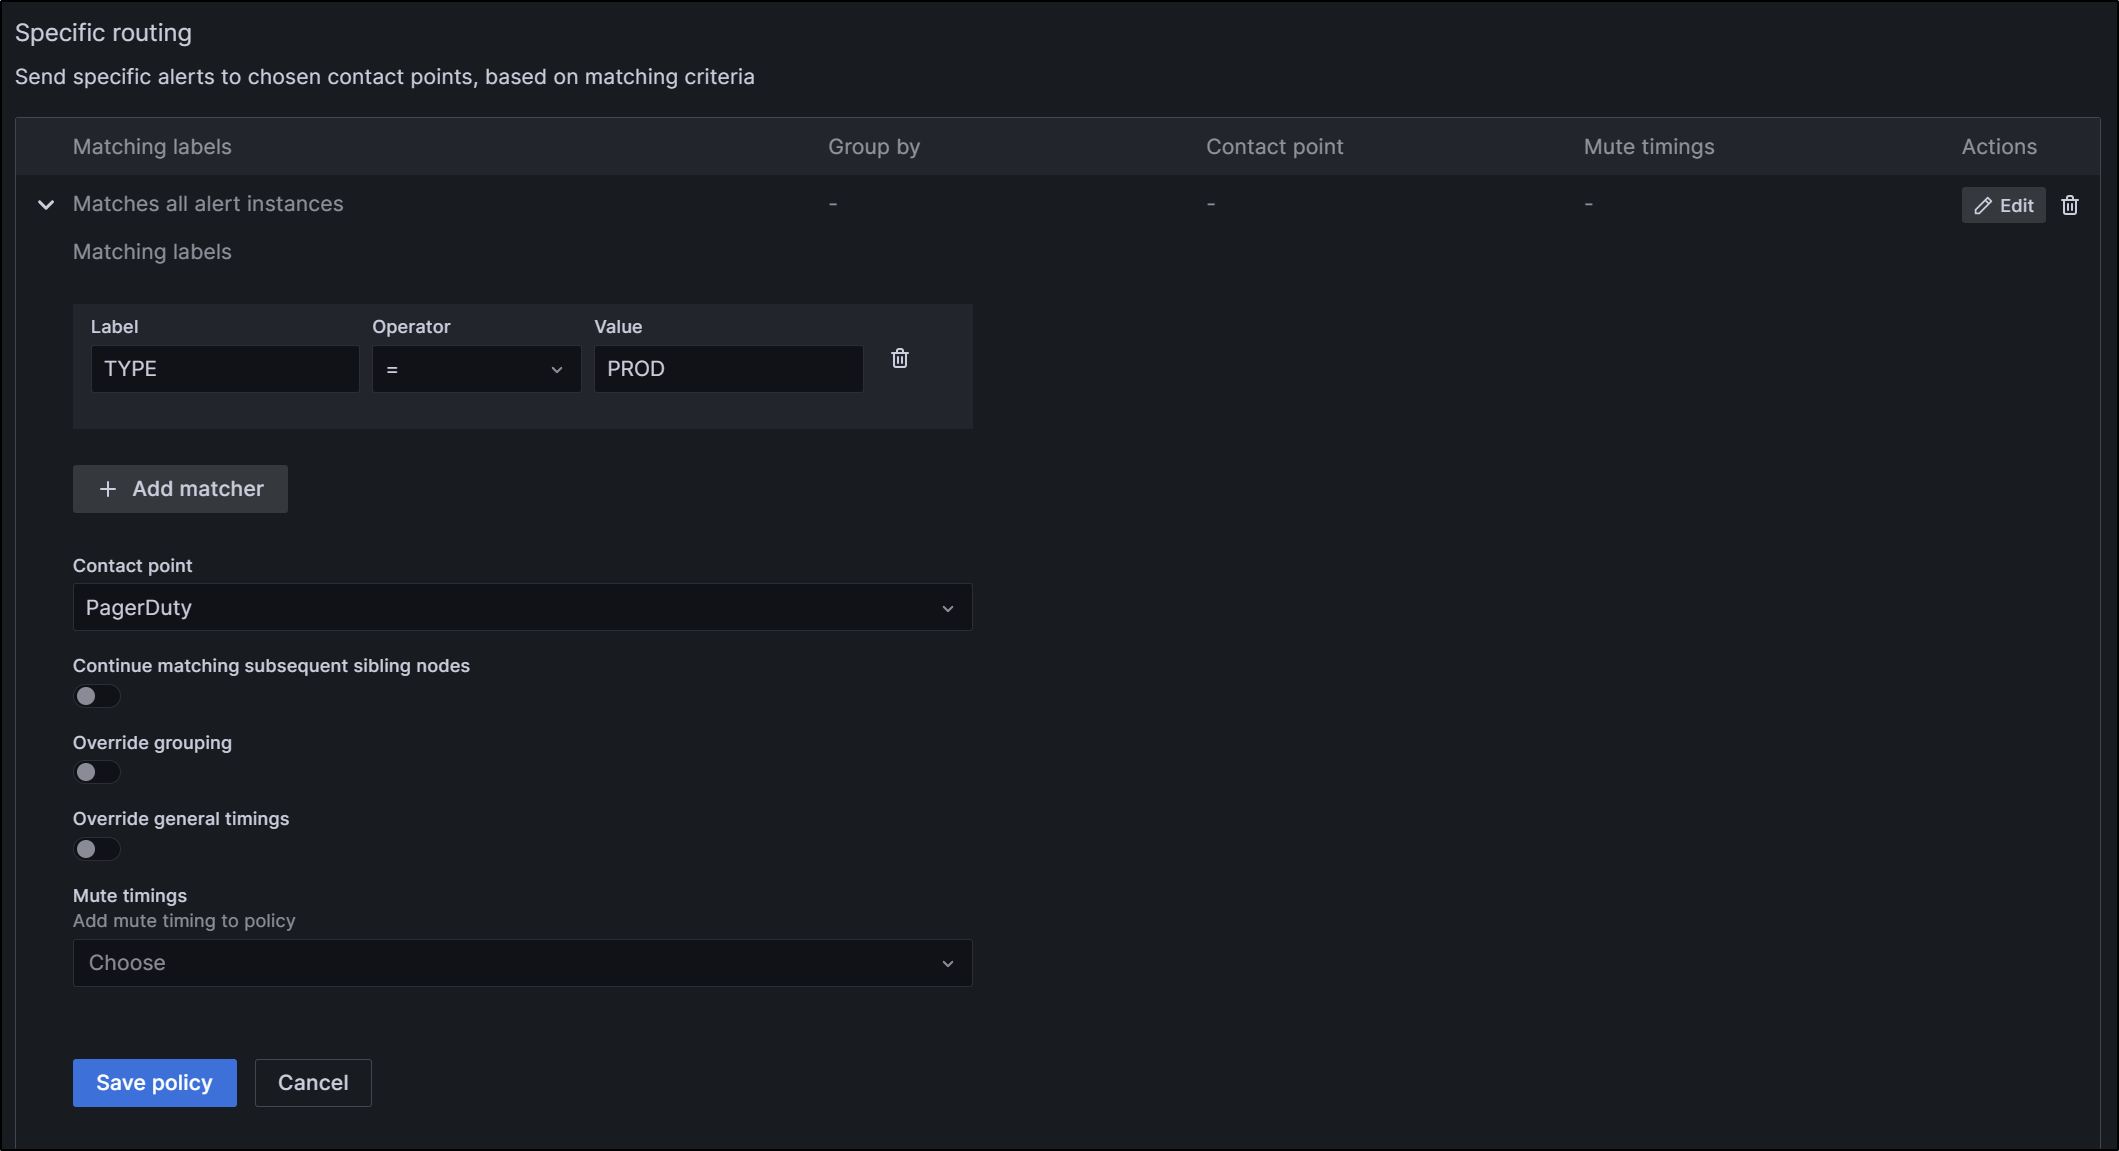
once saved
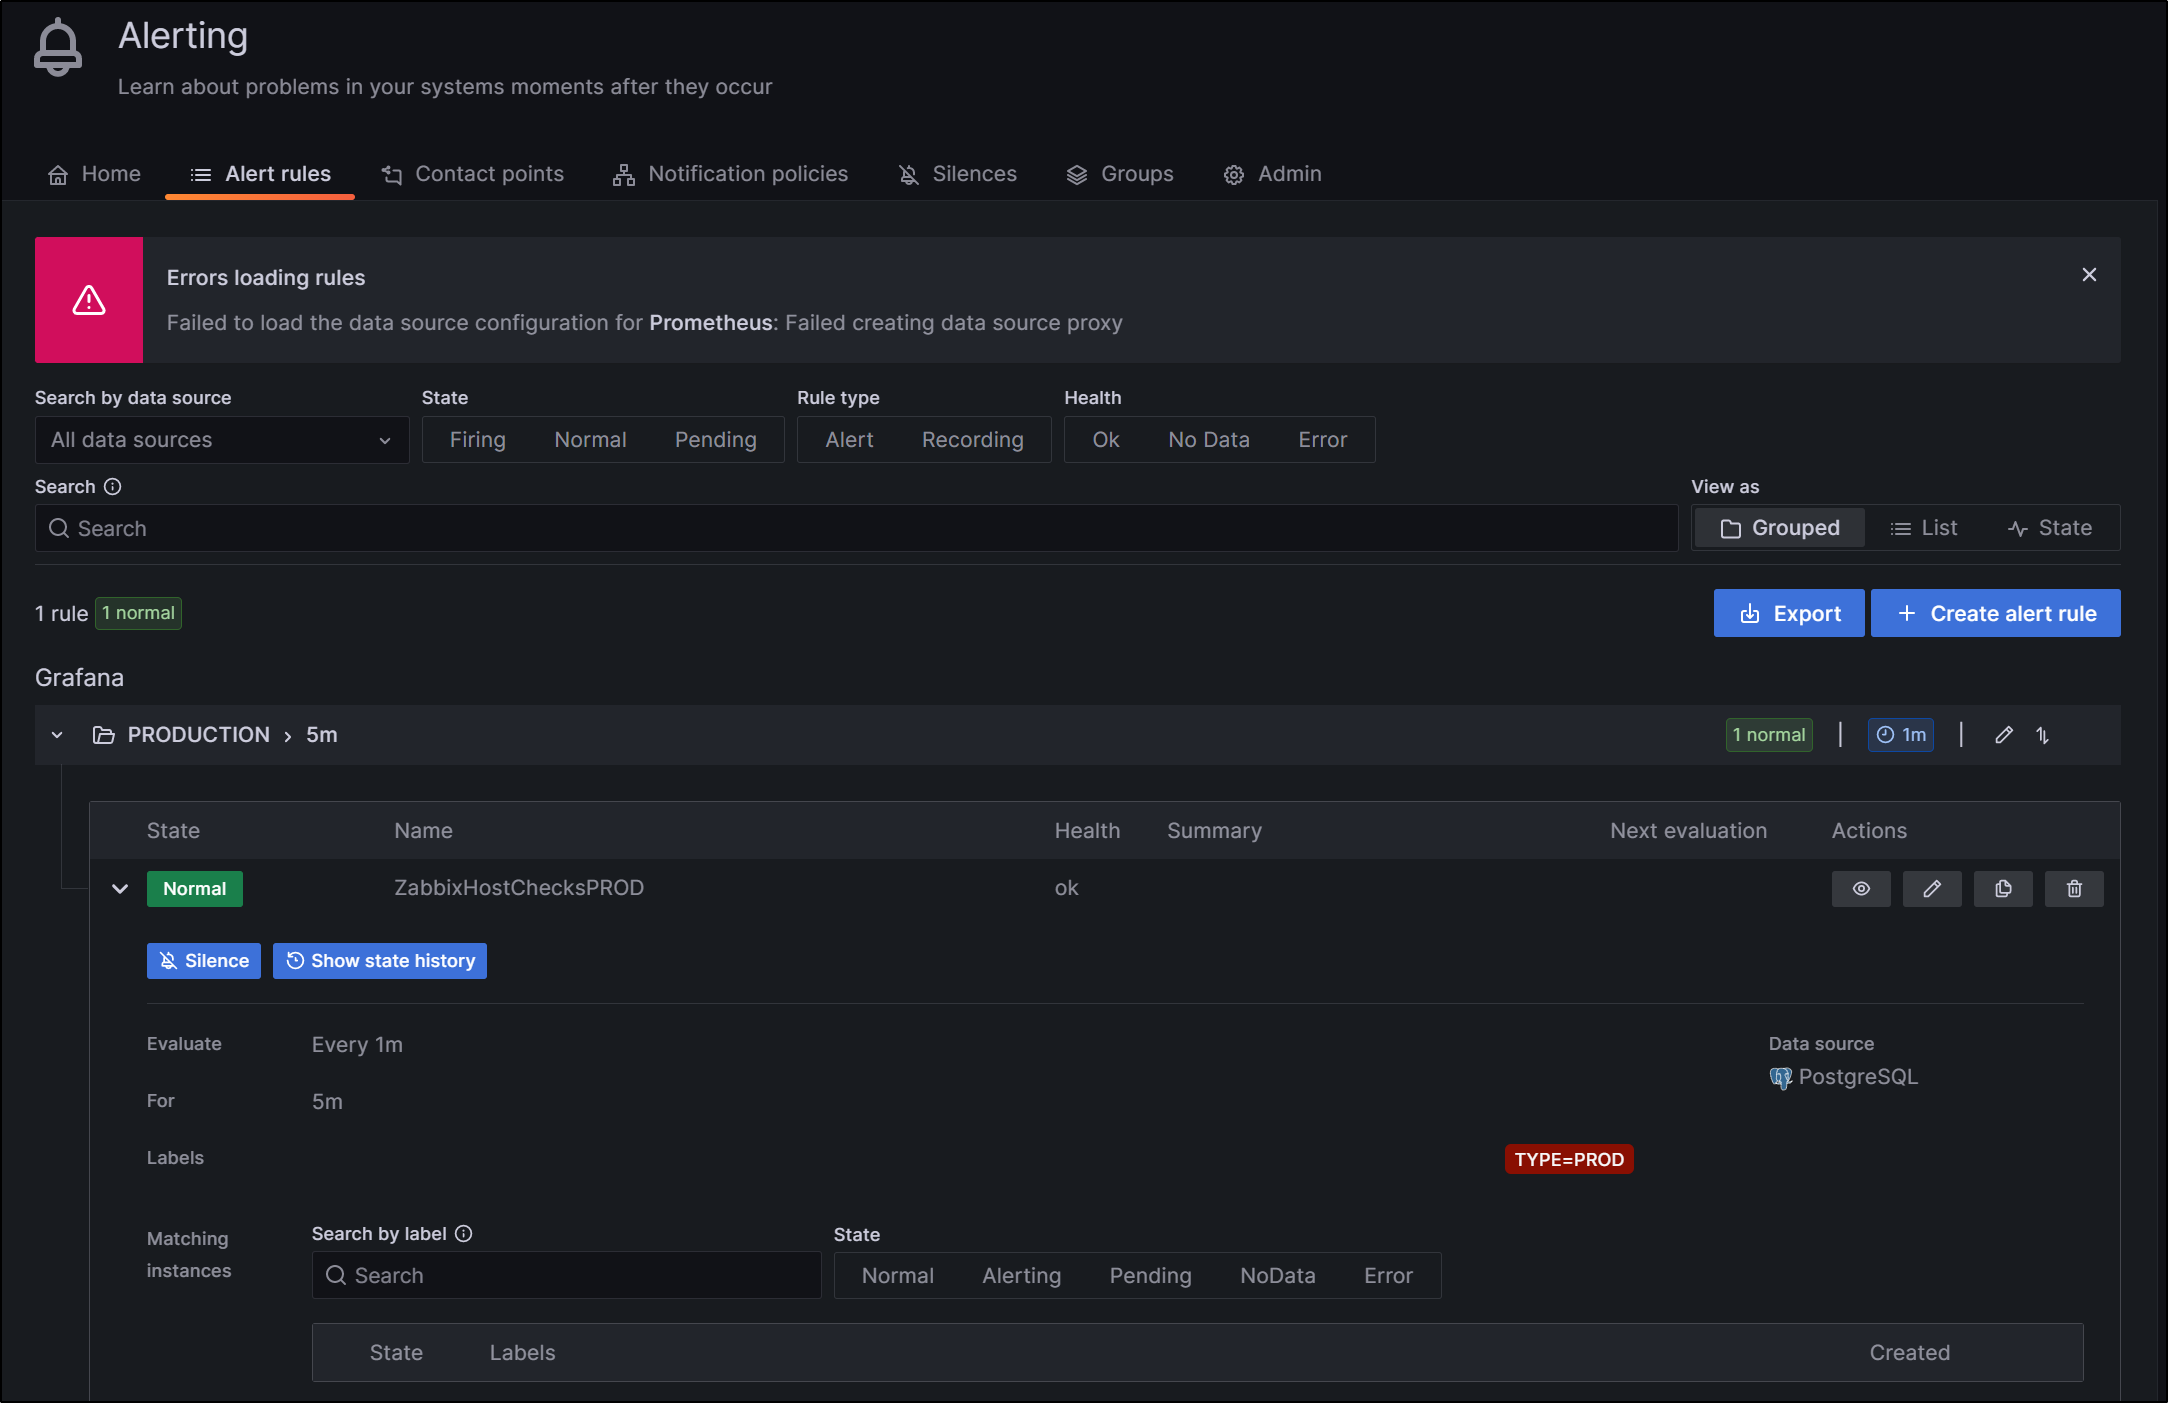
I could make an alert that checks for total zabbix hosts statii are, when counted, over zero
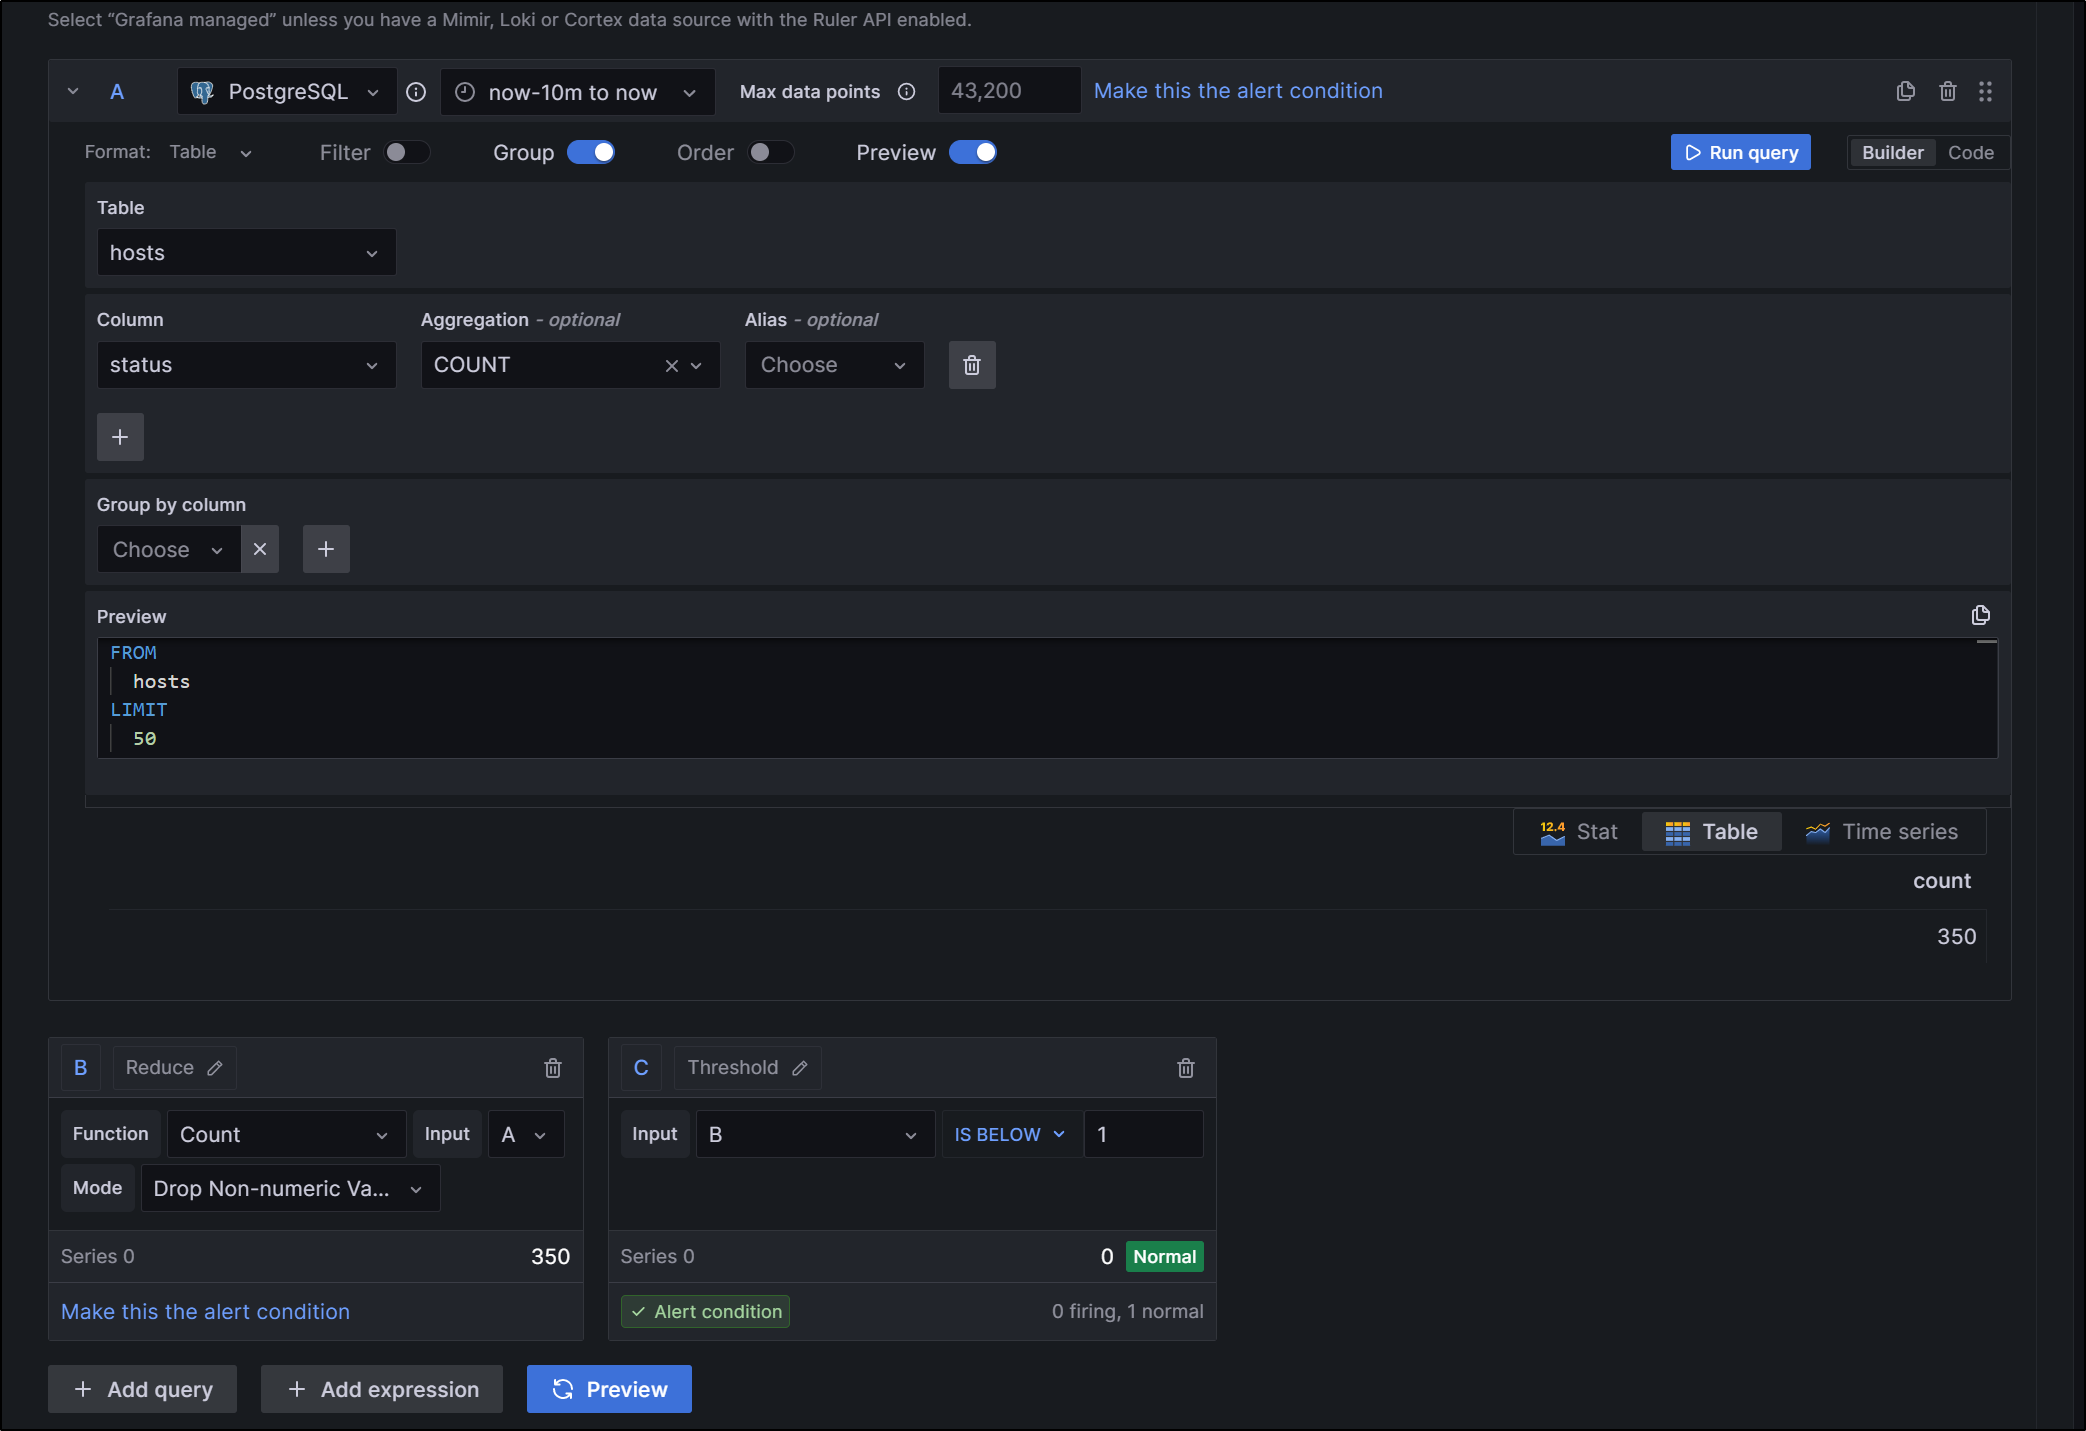
Then make sure to use that custom label to kick off to pagerduty
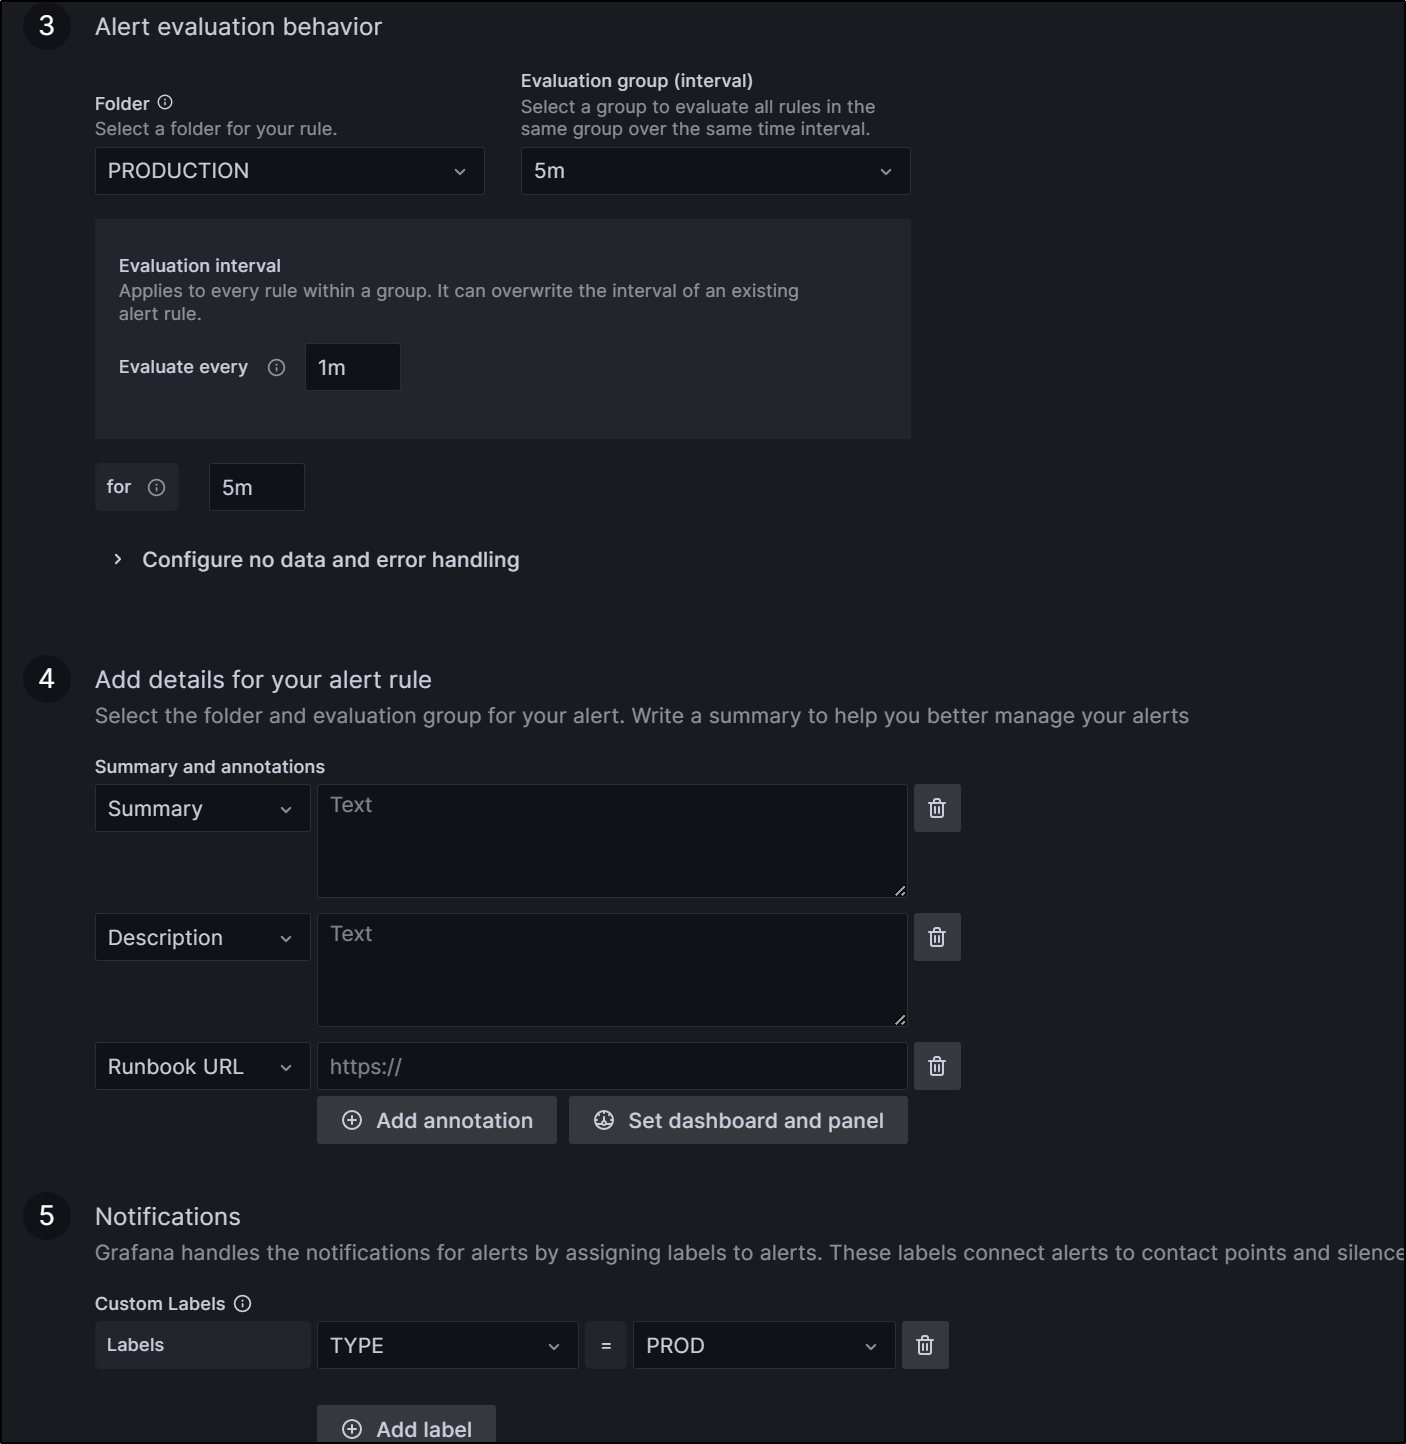
Now that I gave it name and saved it, we can see it in our list of Production Alerts
Summary
We really just scratched the surface with Grafana and Prometheus. We added Prometheus and KSM to our K8s cluster. We then added Grafana and configured it. We setup Postgres connections to Zabbix and the man Postgres DB. We then added Prometheus and Node Exporter to a Linux host and showed we could monitor VMs just as easily.
We explored alerting and contacts by adding teams then configuring email. We adding Cloud monitoring by way of an Azure integration that could monitor an ALM workspace for activity. Lastly, we discussed integrating Pagerduty using Email and how to setup Contacts, Notification Policies and Alert rules that leverage custom labels.
In a way, this setup in Grafana reminds me a lot of SumoLogic; there is a way of doing things with a collector and a query and if you can get comfortable building such things, you can really do amazing things.
On a whole, adding monitors to hosts requires a lot more setup than other tools. There is no simple helm chart or yum repo that just adds the monitor.
I will likely continue to explore Grafana as a reporting / dashboard, but not as an alerting tool.