Published: Apr 18, 2023 by Isaac Johnson
We spoke of Zabbix last week showing setup and basic usage. Let’s continue that into a more full formed implementation.
Today we’ll cover installing it on an on-prem Kubernetes cluster with helm after checking its demands using Datadog. As this is a production version, we’ll setup the PostgreSQL (and show you how to work around the PostgreSQL version requirement). We’ll expose it for HTTPS ingress and LetsEncrypt. For outgoing mail, we’ll configure Sendgrid and lastly, we’ll setup Pagerduty integrations.
The parts that are not fully working, but we’ll touch on are Github Integration and Auto-discovery.
Impact tracking with Datadog
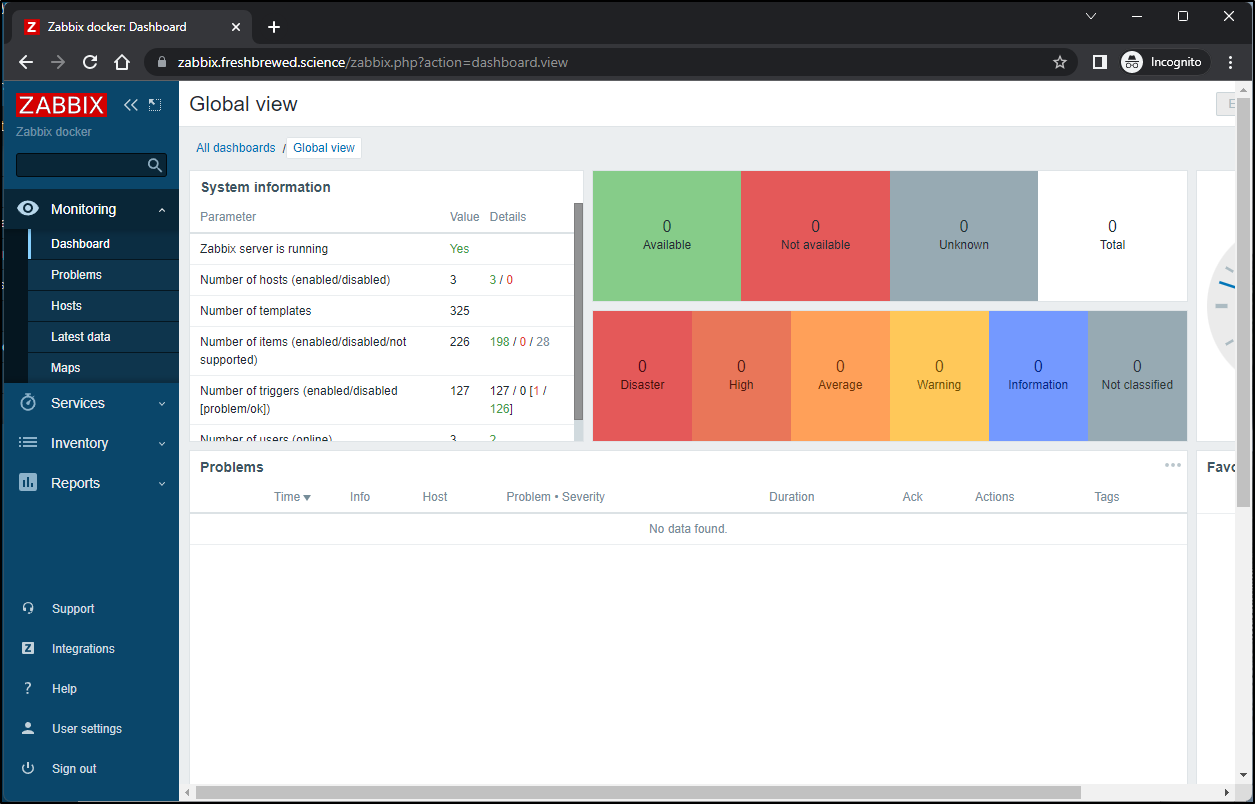
First, before I consider launching Zabbix into my primary cluster, let’s check Datadog to see how Zabbix is affecting my test cluster.
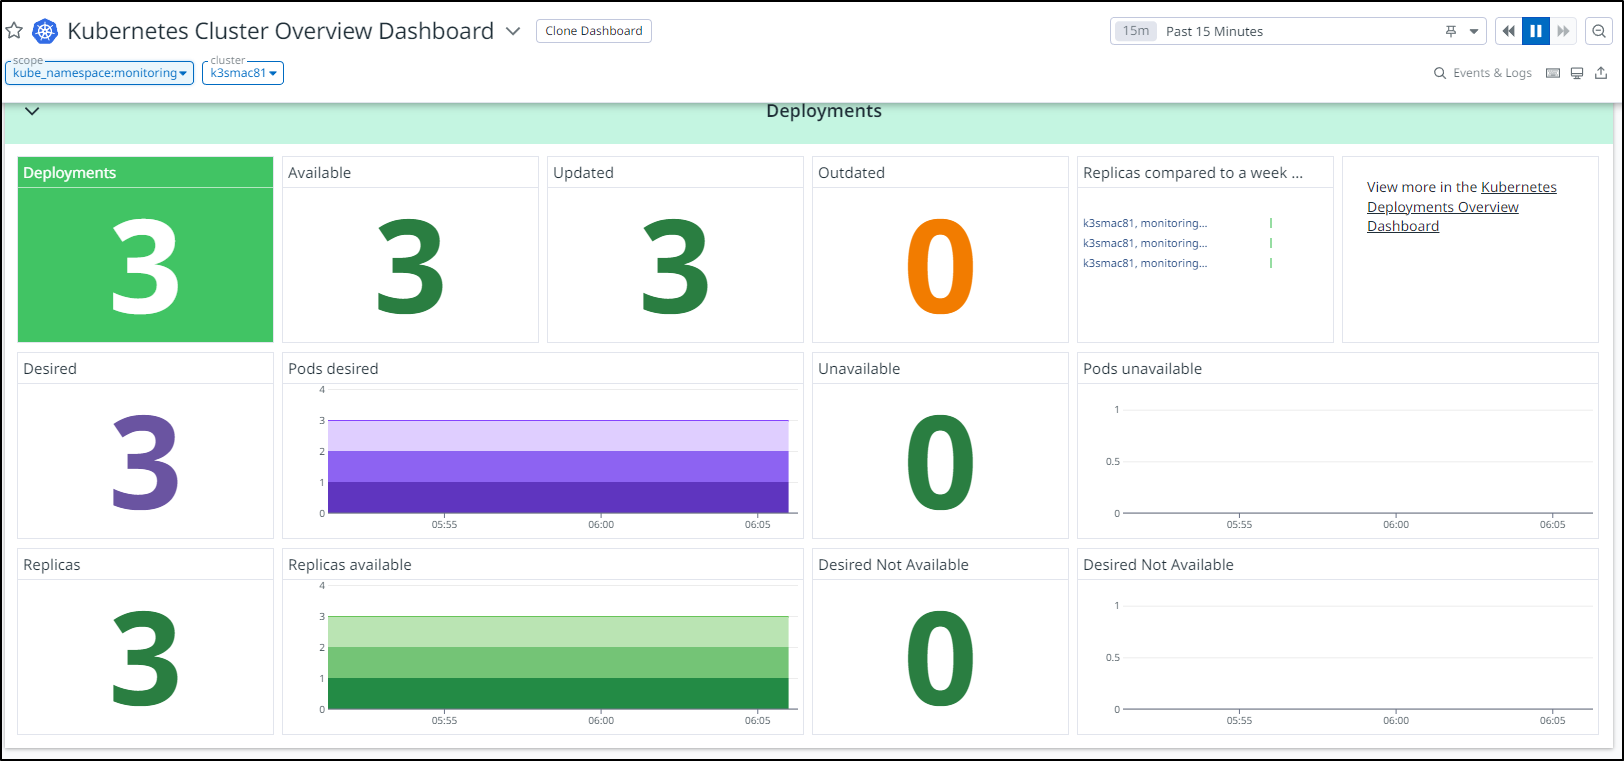
I can see from the namespace, all looks healthy
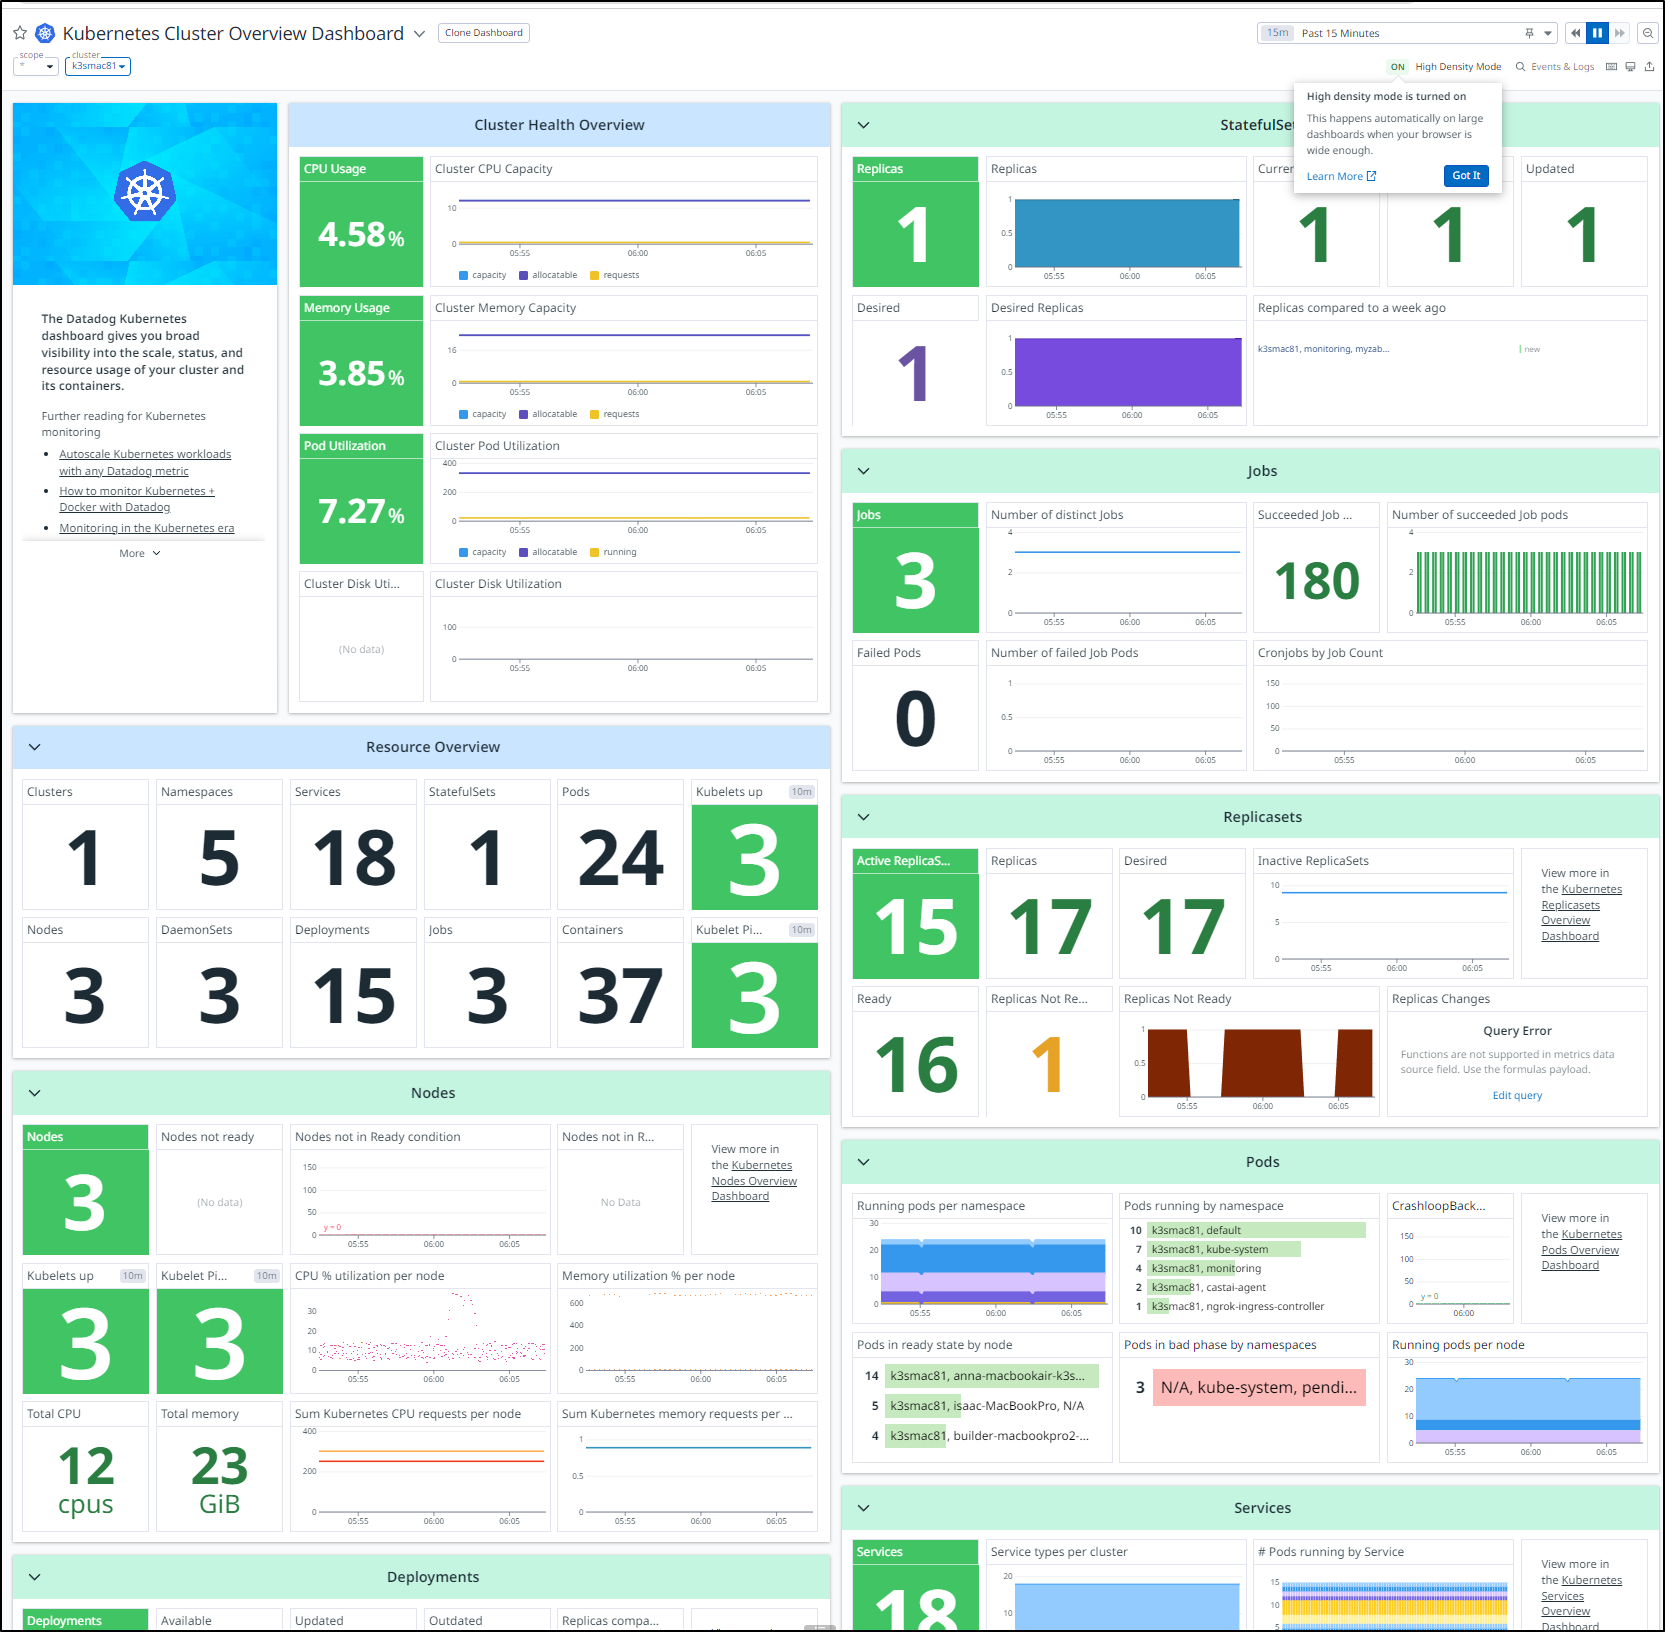
If I look at the cluster as a whole, I see only a spastic ingress controller having troubles (which in this disconnected cluster is not important)
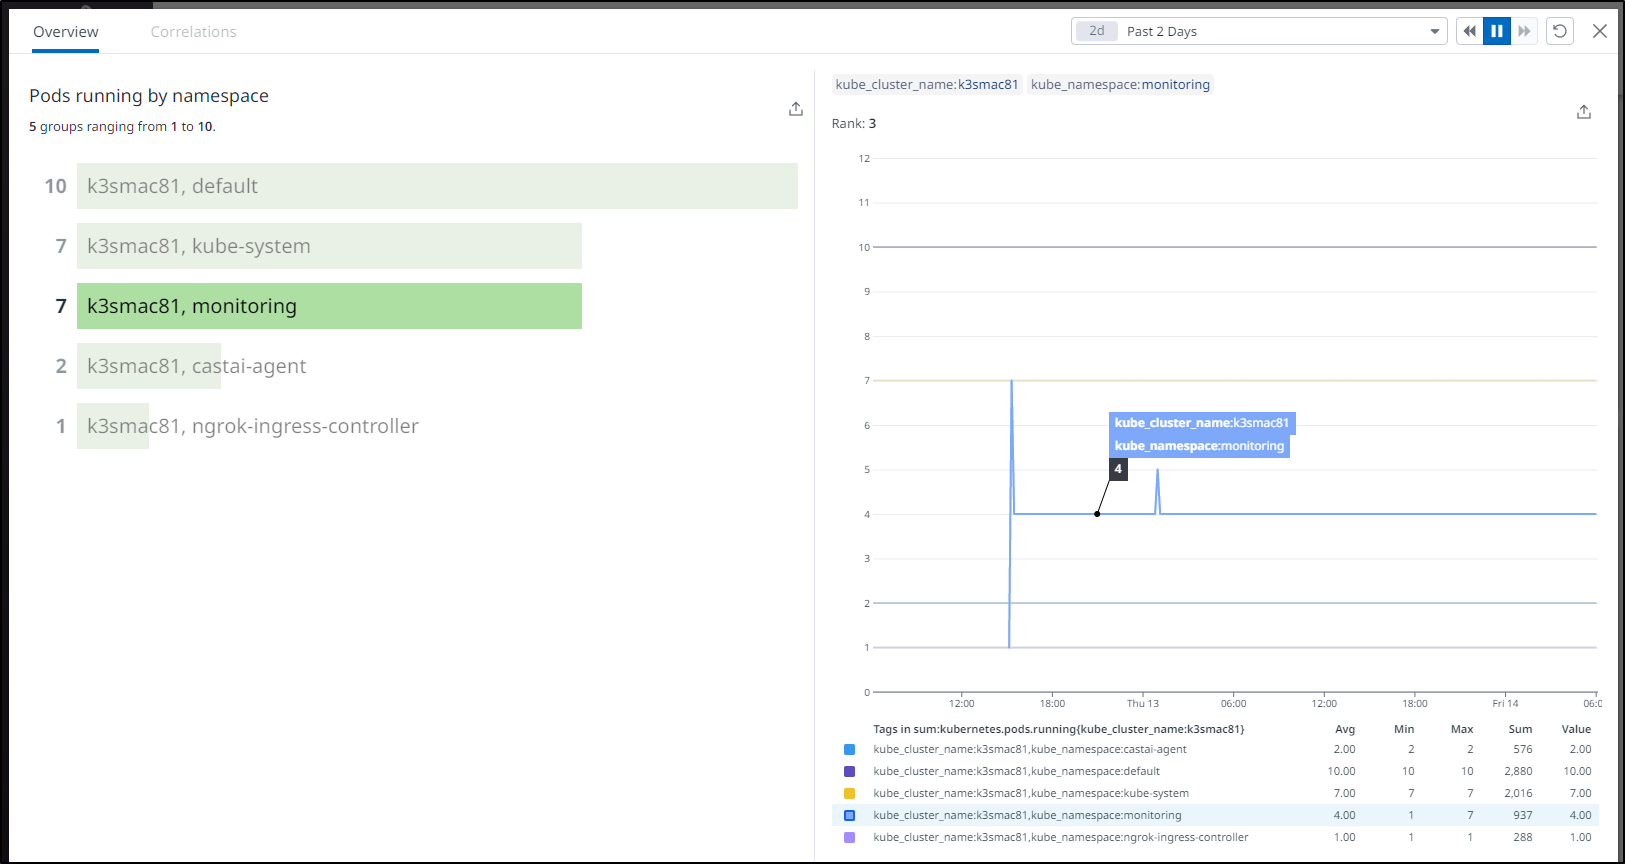
If I look at the last couple days, monitoring initially spiked to 7 pods, but otherwise Zabbix has been hanging out with 4
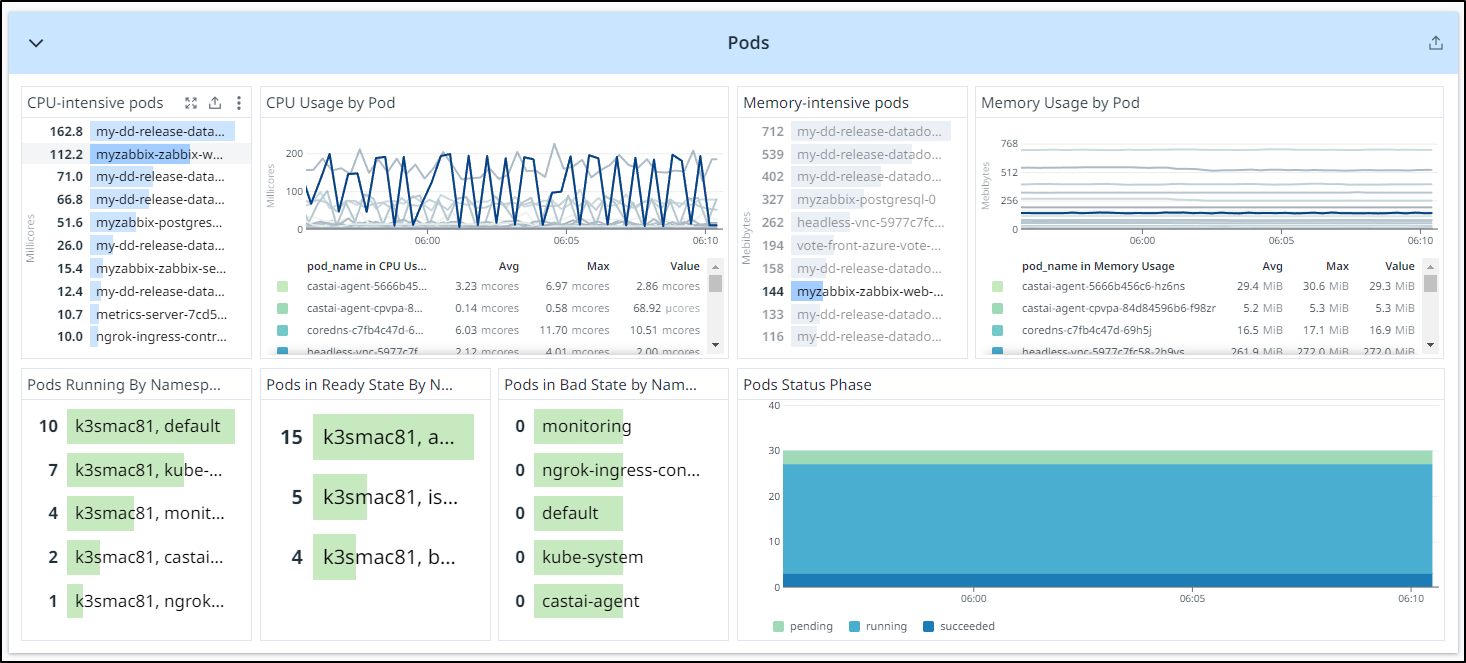
If I head over to my Pods dashboard, I can see Zabbix is a bit up there on CPU, but not the highest. And on memory, we can see the Zabbix Postgres host and web pod in the middle
At this point, I would feel comfortable launching it into the main cluster
Helm install
As before, I’ll install with Helm
First, I’ll switch my kube context to the main cluster
$ kubectx mac77
Switched to context "mac77".
$ kubectl get nodes
NAME                          STATUS   ROLES                  AGE    VERSION
hp-hp-elitebook-850-g2        Ready    <none>                 261d   v1.23.9+k3s1
builder-hp-elitebook-850-g1   Ready    <none>                 261d   v1.23.9+k3s1
builder-hp-elitebook-850-g2   Ready    <none>                 253d   v1.23.9+k3s1
isaac-macbookair              Ready    control-plane,master   262d   v1.23.9+k3s1
To be safe, I’ll add the Helm Repo (if absent) and update
$ helm repo add zabbix-community https://zabbix-community.github.io/helm-zabbix
"zabbix-community" already exists with the same configuration, skipping
$ helm repo update
Hang tight while we grab the latest from your chart repositories...
...Successfully got an update from the "hashicorp" chart repository
...Successfully got an update from the "azure-samples" chart repository
...Successfully got an update from the "novum-rgi-helm" chart repository
...Successfully got an update from the "adwerx" chart repository
...Successfully got an update from the "zabbix-community" chart repository
...Successfully got an update from the "kubecost" chart repository
...Successfully got an update from the "jfelten" chart repository
...Successfully got an update from the "kuma" chart repository
...Successfully got an update from the "dapr" chart repository
...Successfully got an update from the "ngrok" chart repository
...Successfully got an update from the "open-telemetry" chart repository
...Successfully got an update from the "uptime-kuma" chart repository
...Successfully got an update from the "longhorn" chart repository
...Successfully got an update from the "castai-helm" chart repository
...Successfully got an update from the "rhcharts" chart repository
...Successfully got an update from the "lifen-charts" chart repository
...Successfully got an update from the "epsagon" chart repository
...Successfully got an update from the "nginx-stable" chart repository
...Successfully got an update from the "rook-release" chart repository
...Successfully got an update from the "freshbrewed" chart repository
...Successfully got an update from the "elastic" chart repository
...Successfully got an update from the "myharbor" chart repository
...Successfully got an update from the "datadog" chart repository
...Successfully got an update from the "harbor" chart repository
...Successfully got an update from the "sonarqube" chart repository
...Successfully got an update from the "argo-cd" chart repository
...Successfully got an update from the "crossplane-stable" chart repository
...Successfully got an update from the "incubator" chart repository
...Successfully got an update from the "newrelic" chart repository
...Successfully got an update from the "gitlab" chart repository
...Successfully got an update from the "rancher-latest" chart repository
...Successfully got an update from the "bitnami" chart repository
...Successfully got an update from the "confluentinc" chart repository
...Successfully got an update from the "actions-runner-controller" chart repository
...Successfully got an update from the "sumologic" chart repository
Update Complete. ⎈Happy Helming!⎈
One thing I think I’ll do different is to create an externalized database for Zabbix.
I’ll need the ‘create.sql.gz’ that will set up the schema.
If we have installed Zabbix locally in linux(.e.g apt-get install zabbix-server-pgsql zabbix-frontend-php), we could find it in /usr/share/doc/zabbix-server-postgresql/
I had hope to pull from source but did not see where create_server.sql comes from. You can do a make dbschema on source to create it, however (see steps here).
Since I plan to launch the helm chart I just ran, I’ll just fetch from the last container.
I can see the create and timescale files in
zabbix@myzabbix-zabbix-server-5978d49678-znzfn:/usr/share/doc/zabbix-server-postgresql$ ls
create.sql.gz  timescaledb.sql
I’ll copy them locally
$ kubectl cp myzabbix-zabbix-server-5978d49678-znzfn:/usr/share/doc/zabbix-server-postgresql/create.sql.gz /tmp/create.sql.gz -n monitoring
Defaulted container "zabbix-server" out of: zabbix-server, zabbix-agent
tar: Removing leading `/' from member names
$ kubectl cp myzabbix-zabbix-server-5978d49678-znzfn:/usr/share/doc/zabbix-server-postgresql/timescaledb.sql /tmp/timescaledb.sql -n monitoring
Defaulted container "zabbix-server" out of: zabbix-server, zabbix-agent

$ ls -l /tmp/create.sql.gz
-rw-r--r-- 1 builder builder 3769355 Apr 14 06:38 /tmp/create.sql.gz
$ ls -l /tmp/timescaledb.sql
-rw-r--r-- 1 builder builder 3437 Apr 14 06:38 /tmp/timescaledb.sql
I’ll pop over to my PostgreSQL host to check the databases that exist
isaac@isaac-MacBookAir:~$ sudo su - postgres
[sudo] password for isaac:
postgres@isaac-MacBookAir:~$ psql
psql (12.14 (Ubuntu 12.14-0ubuntu0.20.04.1))
Type "help" for help.

postgres=# \l
                                    List of databases
     Name      |  Owner   | Encoding |   Collate   |    Ctype    |   Access privileges
---------------+----------+----------+-------------+-------------+-----------------------
 notary_server | postgres | UTF8     | en_US.UTF-8 | en_US.UTF-8 | =Tc/postgres         +
               |          |          |             |             | postgres=CTc/postgres+
               |          |          |             |             | harbor=CTc/postgres  +
               |          |          |             |             | instana=c/postgres
 notary_signer | postgres | UTF8     | en_US.UTF-8 | en_US.UTF-8 | =Tc/postgres         +
               |          |          |             |             | postgres=CTc/postgres+
               |          |          |             |             | harbor=CTc/postgres  +
               |          |          |             |             | instana=c/postgres
 postgres      | postgres | UTF8     | en_US.UTF-8 | en_US.UTF-8 | =Tc/postgres         +
               |          |          |             |             | postgres=CTc/postgres+
               |          |          |             |             | instana=CTc/postgres
 registry      | postgres | UTF8     | en_US.UTF-8 | en_US.UTF-8 | =Tc/postgres         +
               |          |          |             |             | postgres=CTc/postgres+
               |          |          |             |             | harbor=CTc/postgres  +
               |          |          |             |             | instana=c/postgres
 template0     | postgres | UTF8     | en_US.UTF-8 | en_US.UTF-8 | =c/postgres          +
               |          |          |             |             | postgres=CTc/postgres+
               |          |          |             |             | instana=c/postgres
 template1     | postgres | UTF8     | en_US.UTF-8 | en_US.UTF-8 | =c/postgres          +
               |          |          |             |             | postgres=CTc/postgres+
               |          |          |             |             | instana=c/postgres
(6 rows)
postgres=# \q
I’ll create a zabbix user first
isaac@isaac-MacBookAir:~$ sudo -u postgres createuser --pwprompt zabbix
[sudo] password for isaac:
Enter password for new role:
Enter it again:
Next, I’ll create a new Database on the cluster and grant ownership to zabbix
isaac@isaac-MacBookAir:~$ sudo -u postgres createdb -O zabbix -E Unicode -T template0 zabbix
Back on my main Linux, I’ll just copy those files over (had I done all this on the postgres box, we wouldn’t need to copy)
$ sftp isaac@192.168.1.78
isaac@192.168.1.78's password:
Connected to 192.168.1.78.
sftp> cd /tmp
sftp> put /tmp/create.sql.gz
Uploading /tmp/create.sql.gz to /tmp/create.sql.gz
/tmp/create.sql.gz                                                                                                                                    100% 3681KB  12.1MB/s   00:00
sftp> put /tmp/timescaledb.sql
Uploading /tmp/timescaledb.sql to /tmp/timescaledb.sql
/tmp/timescaledb.sql                                                                                                                                  100% 3437     1.7MB/s   00:00
sftp> quit
Now I can load the PSQL DB. This step takes some time
$ zcat /tmp/create.sql.gz |  psql -U zabbix -d zabbix -h localhost
... snip ...
INSERT 0 1
INSERT 0 1
COMMIT
isaac@isaac-MacBookAir:~$
I’ll now login to verify the tables were created
$ PGPASSWORD=asdfasdfasdf; psql -U zabbix -d zabbix -h localhost
psql (12.14 (Ubuntu 12.14-0ubuntu0.20.04.1))
SSL connection (protocol: TLSv1.3, cipher: TLS_AES_256_GCM_SHA384, bits: 256, compression: off)
Type "help" for help.

zabbix=> /l
                                    List of databases
     Name      |  Owner   | Encoding |   Collate   |    Ctype    |   Access privileges
---------------+----------+----------+-------------+-------------+-----------------------
 notary_server | postgres | UTF8     | en_US.UTF-8 | en_US.UTF-8 | =Tc/postgres         +
               |          |          |             |             | postgres=CTc/postgres+
               |          |          |             |             | harbor=CTc/postgres  +
               |          |          |             |             | instana=c/postgres
 notary_signer | postgres | UTF8     | en_US.UTF-8 | en_US.UTF-8 | =Tc/postgres         +
               |          |          |             |             | postgres=CTc/postgres+
               |          |          |             |             | harbor=CTc/postgres  +
               |          |          |             |             | instana=c/postgres
 postgres      | postgres | UTF8     | en_US.UTF-8 | en_US.UTF-8 | =Tc/postgres         +
               |          |          |             |             | postgres=CTc/postgres+
               |          |          |             |             | instana=CTc/postgres
 registry      | postgres | UTF8     | en_US.UTF-8 | en_US.UTF-8 | =Tc/postgres         +
               |          |          |             |             | postgres=CTc/postgres+
               |          |          |             |             | harbor=CTc/postgres  +
               |          |          |             |             | instana=c/postgres
 template0     | postgres | UTF8     | en_US.UTF-8 | en_US.UTF-8 | =c/postgres          +
               |          |          |             |             | postgres=CTc/postgres+
               |          |          |             |             | instana=c/postgres
 template1     | postgres | UTF8     | en_US.UTF-8 | en_US.UTF-8 | =c/postgres          +
               |          |          |             |             | postgres=CTc/postgres+
               |          |          |             |             | instana=c/postgres
 zabbix        | zabbix   | UTF8     | en_US.UTF-8 | en_US.UTF-8 |
(7 rows)

zabbix=> \c zabbix
SSL connection (protocol: TLSv1.3, cipher: TLS_AES_256_GCM_SHA384, bits: 256, compression: off)
You are now connected to database "zabbix" as user "zabbix".
zabbix=> \x
Expanded display is on.
zabbix=> \pset pager off
Pager usage is off.
zabbix=> \dt;
List of relations
-[ RECORD 1 ]----------------------
Schema | public
Name   | acknowledges
Type   | table
Owner  | zabbix
-[ RECORD 2 ]----------------------
Schema | public
Name   | actions
Type   | table
Owner  | zabbix
-[ RECORD 3 ]----------------------
Schema | public
Name   | alerts
Type   | table
Owner  | zabbix
-[ RECORD 4 ]----------------------
Schema | public
Name   | auditlog
Type   | table
Owner  | zabbix
-[ RECORD 5 ]----------------------
Schema | public
Name   | autoreg_host
Type   | table
Owner  | zabbix
-[ RECORD 6 ]----------------------
Schema | public
Name   | conditions
Type   | table
Owner  | zabbix
-[ RECORD 7 ]----------------------
Schema | public
Name   | config
Type   | table
Owner  | zabbix
-[ RECORD 8 ]----------------------
Schema | public
Name   | config_autoreg_tls
Type   | table
Owner  | zabbix
-[ RECORD 9 ]----------------------
Schema | public
Name   | corr_condition
Type   | table
Owner  | zabbix
-[ RECORD 10 ]---------------------
Schema | public
Name   | corr_condition_group
Type   | table
Owner  | zabbix
-[ RECORD 11 ]---------------------
Schema | public
Name   | corr_condition_tag
Type   | table
Owner  | zabbix
-[ RECORD 12 ]---------------------
Schema | public
Name   | corr_condition_tagpair
Type   | table
Owner  | zabbix
-[ RECORD 13 ]---------------------
Schema | public
Name   | corr_condition_tagvalue
Type   | table
Owner  | zabbix
-[ RECORD 14 ]---------------------
Schema | public
Name   | corr_operation
Type   | table
Owner  | zabbix
-[ RECORD 15 ]---------------------
Schema | public
Name   | correlation
Type   | table
Owner  | zabbix
-[ RECORD 16 ]---------------------
Schema | public
Name   | dashboard
Type   | table
Owner  | zabbix
-[ RECORD 17 ]---------------------
Schema | public
Name   | dashboard_page
Type   | table
Owner  | zabbix
-[ RECORD 18 ]---------------------
Schema | public
Name   | dashboard_user
Type   | table
Owner  | zabbix
-[ RECORD 19 ]---------------------
Schema | public
Name   | dashboard_usrgrp
Type   | table
Owner  | zabbix
-[ RECORD 20 ]---------------------
Schema | public
Name   | dbversion
Type   | table
Owner  | zabbix
-[ RECORD 21 ]---------------------
Schema | public
Name   | dchecks
Type   | table
Owner  | zabbix

... snip ...

-[ RECORD 171 ]--------------------
Schema | public
Name   | valuemap_mapping
Type   | table
Owner  | zabbix
-[ RECORD 172 ]--------------------
Schema | public
Name   | widget
Type   | table
Owner  | zabbix
-[ RECORD 173 ]--------------------
Schema | public
Name   | widget_field
Type   | table
Owner  | zabbix
zabbix=> \q
I tried to add timescale, but perhaps it’s not important. (One could install the extension)
isaac@isaac-MacBookAir:~$ cat /tmp/timescaledb.sql |  psql -U zabbix -d zabbix -h localhost
NOTICE:  PostgreSQL version 12.14 (Ubuntu 12.14-0ubuntu0.20.04.1) is valid
ERROR:  TimescaleDB extension is not installed
CONTEXT:  PL/pgSQL function inline_code_block line 42 at RAISE
we can now pass the database settings to our Helm command:
--set "postgressql.enabled=false" --set "db_access.db_server_host=192.168.1.78" --set "db_access.postgres_password=asdfasdfsadf" --set "db_access.postgres_user=zabbix"
If we use just ‘zabbix’ for the user and password;
$ helm upgrade --install myzabbix zabbix-community/zabbix --create-namespace -n monitoring --set "postgressql.enabled=false" --set "db_access.db_server_host=192.168.1.78"
Release "myzabbix" has been upgraded. Happy Helming!
NAME: myzabbix
LAST DEPLOYED: Fri Apr 14 07:03:52 2023
NAMESPACE: monitoring
STATUS: deployed
REVISION: 2
TEST SUITE: None
NOTES:
Get the application URL by running these commands:
  export POD_NAME=$(kubectl get pods --namespace monitoring -l "app=myzabbix-zabbix-web" -o jsonpath="{.items[0].metadata.name}")
  export CONTAINER_PORT=$(kubectl get pod --namespace monitoring $POD_NAME -o jsonpath="{.spec.containers[0].ports[0].containerPort}")
  echo "Visit http://127.0.0.1:8888 to use your application"
  kubectl --namespace monitoring port-forward $POD_NAME 8888:$CONTAINER_PORT
Note: one can also go back to using the embedded postgres container
$ helm upgrade --install myzabbix zabbix-community/zabbix --create-namespace -n monitoring --set "postgressql.enabled=true" --set "db_access.db_server_host=zabbix-postgresql"
Release "myzabbix" has been upgraded. Happy Helming!
NAME: myzabbix
LAST DEPLOYED: Fri Apr 14 07:08:53 2023
NAMESPACE: monitoring
STATUS: deployed
REVISION: 3
TEST SUITE: None
NOTES:
Get the application URL by running these commands:
  export POD_NAME=$(kubectl get pods --namespace monitoring -l "app=myzabbix-zabbix-web" -o jsonpath="{.items[0].metadata.name}")
  export CONTAINER_PORT=$(kubectl get pod --namespace monitoring $POD_NAME -o jsonpath="{.spec.containers[0].ports[0].containerPort}")
  echo "Visit http://127.0.0.1:8888 to use your application"
  kubectl --namespace monitoring port-forward $POD_NAME 8888:$CONTAINER_PORT
Installing:
$ helm upgrade --install myzabbix zabbix-community/zabbix --create-namespace -n monitoring --set postgressql.enabled=false --set db_access.db_server_host=192.168.1.78
Release "myzabbix" does not exist. Installing it now.
NAME: myzabbix
LAST DEPLOYED: Fri Apr 14 07:11:58 2023
NAMESPACE: monitoring
STATUS: deployed
REVISION: 1
TEST SUITE: None
NOTES:
Get the application URL by running these commands:
  export POD_NAME=$(kubectl get pods --namespace monitoring -l "app=myzabbix-zabbix-web" -o jsonpath="{.items[0].metadata.name}")
  export CONTAINER_PORT=$(kubectl get pod --namespace monitoring $POD_NAME -o jsonpath="{.spec.containers[0].ports[0].containerPort}")
  echo "Visit http://127.0.0.1:8888 to use your application"
  kubectl --namespace monitoring port-forward $POD_NAME 8888:$CONTAINER_PORT
When it didn’t install, I realized I had a CloudCustodian policy kicking in on required lables! Caught by my own protections!
$ kubectl get rs -n monitoring
NAME                                    DESIRED   CURRENT   READY   AGE
myzabbix-zabbix-webservice-7d96f65f66   1         0         0       51s
myzabbix-zabbix-server-5978d49678       1         0         0       51s
myzabbix-zabbix-web-7fd6d4db87          1         0         0       51s

$ kubectl describe rs myzabbix-zabbix-webservice-7d96f65f66 -n monitoring | tail -n5
  ReplicaFailure   True    FailedCreate
Events:
  Type     Reason        Age                  From                   Message
  ----     ------        ----                 ----                   -------
  Warning  FailedCreate  28s (x15 over 110s)  replicaset-controller  Error creating: admission webhook "admission.cloudcustodian.io" denied the request: Failed admission due to policies:[{"name": "missing-recommended-labels", "description": "Kubernetes recommmended the following labels from its docs:\napp.kubernetes.io/name\napp.kubernetes.io/instance\napp.kubernetes.io/version\napp.kubernetes.io/component\napp.kubernetes.io/part-of\napp.kubernetes.io/managed-by\nhttps://kubernetes.io/docs/concepts/overview/working-with-objects/common-labels/\n"}]
This cluster really didn’t need cloudcustodian limiting pods by lable. I’ll remove it for now
$ helm list -n c7n-system
NAME            NAMESPACE       REVISION        UPDATED                                 STATUS          CHART           APP VERSION
c7n-kube        c7n-system      1               2023-04-06 16:41:34.593818836 -0500 CDT deployed        c7n-kube-0.1.2  0.1.2
And i can see it unblock Zabbix
$ kubectl get pods -n monitoring
NAME                                          READY   STATUS              RESTARTS   AGE
myzabbix-postgresql-0                         1/1     Running             0          4m9s
myzabbix-zabbix-web-7fd6d4db87-mtxjc          0/1     ContainerCreating   0          3s
myzabbix-zabbix-webservice-7d96f65f66-99vl7   0/1     ContainerCreating   0          3s
myzabbix-zabbix-server-5978d49678-z9hl2       0/2     ContainerCreating   0          3s
I’m slightly confused as to why Postgres was added
$ helm list -n monitoring
NAME            NAMESPACE       REVISION        UPDATED                                 STATUS          CHART           APP VERSION
myzabbix        monitoring      1               2023-04-14 07:11:58.443324795 -0500 CDT deployed        zabbix-3.4.4    6.0.13
$ helm get values myzabbix -n monitoring
USER-SUPPLIED VALUES:
db_access:
  db_server_host: 192.168.1.78
postgressql:
  enabled: false
I immediately saw my fatfinger typo when I did a helm get values --all
... snip ...
postgresql:
  containerAnnotations: {}
  enabled: true
  extraContainers: []
  extraEnv: []
  extraInitContainers: []
  extraPodSpecs: {}
  extraRuntimeParameters:
    max_connections: 50
  extraVolumeMounts: []
  extraVolumes: []
  image:
    pullPolicy: IfNotPresent
    pullSecrets: []
    repository: postgres
    tag: 14
  persistence:
    enabled: false
    existing_claim_name: false
    storage_size: 5Gi
  service:
    annotations: {}
    clusterIP: null
    port: 5432
    type: ClusterIP
  statefulSetAnnotations: {}
postgressql:
  enabled: false
postgresql != postgressql….
I corrected the double “s” and upgraded
$ helm upgrade --install myzabbix zabbix-community/zabbix --create-namespace -n monitoring --set postgresql.enabled=false --set db_access.db_server_host=192.168.1.78
Release "myzabbix" has been upgraded. Happy Helming!
NAME: myzabbix
LAST DEPLOYED: Fri Apr 14 07:22:01 2023
NAMESPACE: monitoring
STATUS: deployed
REVISION: 2
TEST SUITE: None
NOTES:
Get the application URL by running these commands:
  export POD_NAME=$(kubectl get pods --namespace monitoring -l "app=myzabbix-zabbix-web" -o jsonpath="{.items[0].metadata.name}")
  export CONTAINER_PORT=$(kubectl get pod --namespace monitoring $POD_NAME -o jsonpath="{.spec.containers[0].ports[0].containerPort}")
  echo "Visit http://127.0.0.1:8888 to use your application"
  kubectl --namespace monitoring port-forward $POD_NAME 8888:$CONTAINER_PORT
That bounced the server and the Postgres container went away
$ kubectl get pods -n monitoring
NAME                                          READY   STATUS        RESTARTS   AGE
myzabbix-zabbix-webservice-7d96f65f66-99vl7   1/1     Running       0          5m12s
myzabbix-zabbix-web-7fd6d4db87-mtxjc          1/1     Running       0          5m12s
myzabbix-zabbix-web-5d55dfb47b-lk9nz          0/1     Running       0          38s
myzabbix-zabbix-server-5d54b57c97-dwnkx       2/2     Running       0          38s
myzabbix-zabbix-server-5978d49678-z9hl2       2/2     Terminating   0          5m12s
However, I suspect it is not picking up the right vars
$ kubectl logs myzabbix-zabbix-server-5d54b57c97-dwnkx -n monitoring
Defaulted container "zabbix-server" out of: zabbix-server, zabbix-agent
** Preparing Zabbix server
** Preparing database
** Using POSTGRES_USER variable from ENV
** Using POSTGRES_PASSWORD variable from ENV
********************
* DB_SERVER_HOST: myzabbix-postgresql
* DB_SERVER_PORT: 5432
* DB_SERVER_DBNAME: zabbix
* DB_SERVER_SCHEMA: public
********************
**** PostgreSQL server is not available. Waiting 5 seconds...
**** PostgreSQL server is not available. Waiting 5 seconds...
**** PostgreSQL server is not available. Waiting 5 seconds...
**** PostgreSQL server is not available. Waiting 5 seconds...
**** PostgreSQL server is not available. Waiting 5 seconds...
**** PostgreSQL server is not available. Waiting 5 seconds...
**** PostgreSQL server is not available. Waiting 5 seconds...
**** PostgreSQL server is not available. Waiting 5 seconds...
**** PostgreSQL server is not available. Waiting 5 seconds...
**** PostgreSQL server is not available. Waiting 5 seconds...
**** PostgreSQL server is not available. Waiting 5 seconds...
**** PostgreSQL server is not available. Waiting 5 seconds...
**** PostgreSQL server is not available. Waiting 5 seconds...
Indeed, the secret was not updated
$ kubectl get secret zabbixdb-pguser-zabbix -n monitoring -o yaml
apiVersion: v1
data:
  dbname: emFiYml4
  host: bXl6YWJiaXgtcG9zdGdyZXNxbA==
  password: OEhiak1pZ1U0enBJaEZTdg==
  port: NTQzMg==
  user: emFiYml4
kind: Secret
... snip ...

$ echo bXl6YWJiaXgtcG9zdGdyZXNxbA== | base64 --decode && echo
myzabbix-postgresql
$ echo  OEhiak1pZ1U0enBJaEZTdg== | base64 --decode && echo
8HbjMigU4zpIhFSv
$ echo NTQzMg== | base64 --decode && echo
5432
$ echo emFiYml4 | base64 --decode && echo
zabbix
I’ll correct manually.. i just need to base64 the secrets i used. e.g.
$ echo 192.168.1.78 | tr -d '\n' | base64
MTkyLjE2OC4xLjc4
I’ll apply and rotate the server pod
$ kubectl apply -f ./zabbix.db.settings.yaml
Warning: resource secrets/zabbixdb-pguser-zabbix is missing the kubectl.kubernetes.io/last-applied-configuration annotation which is required by kubectl apply. kubectl apply should only be used on resources created declaratively by either kubectl create --save-config or kubectl apply. The missing annotation will be patched automatically.
secret/zabbixdb-pguser-zabbix configured

$ kubectl delete pod myzabbix-zabbix-server-5d54b57c97-dwnkx -n monitoring
pod "myzabbix-zabbix-server-5d54b57c97-dwnkx" deleted
This crapped out because evidently Postresql 12 is not supported:
$ kubectl logs myzabbix-zabbix-server-5d54b57c97-hxwsg -n monitoring
Defaulted container "zabbix-server" out of: zabbix-server, zabbix-agent
** Preparing Zabbix server
** Preparing database
** Using POSTGRES_USER variable from ENV
** Using POSTGRES_PASSWORD variable from ENV
********************
* DB_SERVER_HOST: 192.168.1.78
* DB_SERVER_PORT: 5432
* DB_SERVER_DBNAME: zabbix
* DB_SERVER_SCHEMA: public
********************
** Table 'zabbix.dbversion' already exists.
** Preparing Zabbix server configuration file
** Updating '/etc/zabbix/zabbix_server.conf' parameter "ListenIP": ''...removed
... snip ...kubectl get
** Updating '/etc/zabbix/zabbix_server.conf' parameter "User": 'zabbix'...added
Starting Zabbix Server. Zabbix 6.0.13 (revision fdfa8ce).
Press Ctrl+C to exit.

     7:20230414:123102.951 Starting Zabbix Server. Zabbix 6.0.13 (revision fdfa8ce).
     7:20230414:123102.951 ****** Enabled features ******
     7:20230414:123102.951 SNMP monitoring:           YES
     7:20230414:123102.951 IPMI monitoring:           YES
     7:20230414:123102.951 Web monitoring:            YES
     7:20230414:123102.951 VMware monitoring:         YES
     7:20230414:123102.951 SMTP authentication:       YES
     7:20230414:123102.951 ODBC:                      YES
     7:20230414:123102.951 SSH support:               YES
     7:20230414:123102.951 IPv6 support:              YES
     7:20230414:123102.951 TLS support:               YES
     7:20230414:123102.951 ******************************
     7:20230414:123102.951 using configuration file: /etc/zabbix/zabbix_server.conf
     7:20230414:123103.018
     7:20230414:123103.018 Unable to start Zabbix server due to unsupported PostgreSQL database version (12.14).
     7:20230414:123103.018 Must be at least (13.0).
     7:20230414:123103.018 Use of supported database version is highly recommended.
     7:20230414:123103.018 Override by setting AllowUnsupportedDBVersions=1 in Zabbix server configuration file at your own risk.
     7:20230414:123103.018
I have one more try, one can change the variable in the conf to be “AllowUnsupportedDbVersions=1”, however, one can pass it in as an env var as well. Since our Config isn’t exposed as a CM, we’ll use the env var.
$ helm upgrade --install myzabbix zabbix-community/zabbix --create-namespace -n monitoring --set postgresql.enabled=false --set db_access.db_server_host=192.168.1.78 --set zabbixserver.extraEnv[0].name=ZBX_ALLOWUNSUPPORTEDDBVERSIONS,zabbixserver.extraEnv[0].value=1
Release "myzabbix" has been upgraded. Happy Helming!
NAME: myzabbix
LAST DEPLOYED: Fri Apr 14 07:42:10 2023
NAMESPACE: monitoring
STATUS: deployed
REVISION: 3
TEST SUITE: None
NOTES:
Get the application URL by running these commands:
  export POD_NAME=$(kubectl get pods --namespace monitoring -l "app=myzabbix-zabbix-web" -o jsonpath="{.items[0].metadata.name}")
  export CONTAINER_PORT=$(kubectl get pod --namespace monitoring $POD_NAME -o jsonpath="{.spec.containers[0].ports[0].containerPort}")
  echo "Visit http://127.0.0.1:8888 to use your application"
  kubectl --namespace monitoring port-forward $POD_NAME 8888:$CONTAINER_PORT
This seemed to work
$ kubectl logs myzabbix-zabbix-server-ff444849c-2zp2x -n monitoring
Defaulted container "zabbix-server" out of: zabbix-server, zabbix-agent
** Preparing Zabbix server
** Preparing database
** Using POSTGRES_USER variable from ENV
** Using POSTGRES_PASSWORD variable from ENV
********************
* DB_SERVER_HOST: 192.168.1.78
* DB_SERVER_PORT: 5432
* DB_SERVER_DBNAME: zabbix
* DB_SERVER_SCHEMA: public
********************
** Database 'zabbix' already exists. Please be careful with database owner!
** Table 'zabbix.dbversion' already exists.
** Preparing Zabbix server configuration file
** Updating '/etc/zabbix/zabbix_server.conf' parameter "ListenIP": ''...removed
** Updating '/etc/zabbix/zabbix_server.conf' parameter "ListenPort": ''...removed
** Updating '/etc/zabbix/zabbix_server.conf' parameter "ListenBacklog": ''...removed
** Updating '/etc/zabbix/zabbix_server.conf' parameter "SourceIP": ''...removed
** Updating '/etc/zabbix/zabbix_server.conf' parameter "LogType": 'console'...added
... snip ...
** Updating '/etc/zabbix/zabbix_server.conf' parameter "User": 'zabbix'...added
Starting Zabbix Server. Zabbix 6.0.13 (revision fdfa8ce).
Press Ctrl+C to exit.

     7:20230414:124218.123 Starting Zabbix Server. Zabbix 6.0.13 (revision fdfa8ce).
     7:20230414:124218.123 ****** Enabled features ******
     7:20230414:124218.123 SNMP monitoring:           YES
     7:20230414:124218.123 IPMI monitoring:           YES
     7:20230414:124218.123 Web monitoring:            YES
     7:20230414:124218.123 VMware monitoring:         YES
     7:20230414:124218.123 SMTP authentication:       YES
     7:20230414:124218.123 ODBC:                      YES
     7:20230414:124218.123 SSH support:               YES
     7:20230414:124218.123 IPv6 support:              YES
     7:20230414:124218.123 TLS support:               YES
     7:20230414:124218.123 ******************************
     7:20230414:124218.123 using configuration file: /etc/zabbix/zabbix_server.conf
     7:20230414:124218.182
     7:20230414:124218.182 Warning! Unsupported PostgreSQL database version (12.14).
     7:20230414:124218.182 Should be at least (13.0).
     7:20230414:124218.182 Use of supported database version is highly recommended.
     7:20230414:124218.182
     7:20230414:124218.250 current database version (mandatory/optional): 06000000/06000018
     7:20230414:124218.251 required mandatory version: 06000000
   202:20230414:124218.361 starting HA manager
   202:20230414:124218.403 HA manager started in active mode
     7:20230414:124218.404 server #0 started [main process]
Expose
Now I’ll add an A record so we can expose it
$ cat ./r53-zabbix.json
{
    "Comment": "CREATE zabbix fb.s A record ",
    "Changes": [
      {
        "Action": "CREATE",
        "ResourceRecordSet": {
          "Name": "zabbix.freshbrewed.science",
          "Type": "A",
          "TTL": 300,
          "ResourceRecords": [
            {
              "Value": "73.242.50.46"
            }
          ]
        }
      }
    ]
  }
and apply it
$ aws route53 change-resource-record-sets --hosted-zone-id Z39E8QFU0F9PZP --change-batch file://r53-zabbix.json
{
    "ChangeInfo": {
        "Id": "/change/C04745933CKMXVOAAWFIK",
        "Status": "PENDING",
        "SubmittedAt": "2023-04-14T12:47:35.116Z",
        "Comment": "CREATE zabbix fb.s A record "
    }
}
Then I just need to add an ingress file
$ cat ingress.zabbix.yaml
apiVersion: networking.k8s.io/v1
kind: Ingress
metadata:
  annotations:
    cert-manager.io/cluster-issuer: letsencrypt-prod
    ingress.kubernetes.io/proxy-body-size: "0"
    ingress.kubernetes.io/ssl-redirect: "true"
    kubernetes.io/ingress.class: nginx
    nginx.ingress.kubernetes.io/proxy-body-size: "0"
    nginx.ingress.kubernetes.io/proxy-read-timeout: "600"
    nginx.ingress.kubernetes.io/proxy-send-timeout: "600"
    nginx.ingress.kubernetes.io/ssl-redirect: "true"
    nginx.org/client-max-body-size: "0"
    nginx.org/proxy-connect-timeout: "600"
    nginx.org/proxy-read-timeout: "600"
  labels:
    app.kubernetes.io/name: zabbix
  name: zabbix
  namespace: monitoring
spec:
  defaultBackend:
    service:
      name: myzabbix-zabbix-web
      port:
        name: http
  rules:
  - host: zabbix.freshbrewed.science
    http:
      paths:
      - backend:
          service:
            name: myzabbix-zabbix-web
            port:
              name: http
        path: /
        pathType: ImplementationSpecific
  tls:
  - hosts:
    - zabbix.freshbrewed.science
    secretName: zabbix-tls
$ kubectl apply -f ./ingress.zabbix.yaml -n monitoring
ingress.networking.k8s.io/zabbix created

$ kubectl get ingress -n monitoring
NAME     CLASS    HOSTS                        ADDRESS                                                PORTS     AGE
zabbix   <none>   zabbix.freshbrewed.science   192.168.1.215,192.168.1.36,192.168.1.57,192.168.1.78   80, 443   42ss
I got some errors until I fixed the port to 80 instead of http. I really cannot explain why my Nginx seemed unhappy with http when it means the same
$ cat ingress.zabbix.yaml.3
apiVersion: networking.k8s.io/v1
kind: Ingress
metadata:
  annotations:
    cert-manager.io/cluster-issuer: letsencrypt-prod
    field.cattle.io/publicEndpoints: '[{"addresses":["192.168.1.215","192.168.1.36","192.168.1.57","192.168.1.78"],"port":443,"protocol":"HTTPS","serviceName":"monitoring:myzabbix-zabbix-web","ingressName":"monitoring:zabbix","hostname":"zabbix.freshbrewed.science","path":"/","allNodes":false}]'
    ingress.kubernetes.io/proxy-body-size: "0"
    ingress.kubernetes.io/ssl-redirect: "true"
    kubectl.kubernetes.io/last-applied-configuration: |
      {"apiVersion":"networking.k8s.io/v1","kind":"Ingress","metadata":{"annotations":{"cert-manager.io/cluster-issuer":"letsencrypt-prod","field.cattle.io/publicEndpoints":"[{\"addresses\":[\"192.168.1.215\",\"192.168.1.36\",\"192.168.1.57\",\"192.168.1.78\"],\"port\":443,\"protocol\":\"HTTPS\",\"serviceName\":\"monitoring:myzabbix-zabbix-web\",\"ingressName\":\"monitoring:zabbix\",\"hostname\":\"zabbix.freshbrewed.science\",\"path\":\"/\",\"allNodes\":false}]","ingress.kubernetes.io/proxy-body-size":"0","ingress.kubernetes.io/ssl-redirect":"true","kubernetes.io/ingress.class":"nginx","nginx.ingress.kubernetes.io/proxy-body-size":"0","nginx.ingress.kubernetes.io/proxy-read-timeout":"600","nginx.ingress.kubernetes.io/proxy-send-timeout":"600","nginx.ingress.kubernetes.io/ssl-redirect":"true","nginx.org/client-max-body-size":"0","nginx.org/proxy-connect-timeout":"600","nginx.org/proxy-read-timeout":"600"},"creationTimestamp":"2023-04-14T12:50:28Z","generation":1,"labels":{"app.kubernetes.io/name":"zabbix"},"name":"zabbix","namespace":"monitoring","resourceVersion":"116075932","uid":"02117543-6aa1-4752-9e96-3bb895f60544"},"spec":{"defaultBackend":{"service":{"name":"myzabbix-zabbix-web","port":{"number":8080}}},"rules":[{"host":"zabbix.freshbrewed.science","http":{"paths":[{"backend":{"service":{"name":"myzabbix-zabbix-web","port":{"number":8080}}},"path":"/","pathType":"ImplementationSpecific"}]}}],"tls":[{"hosts":["zabbix.freshbrewed.science"],"secretName":"zabbix-tls"}]},"status":{"loadBalancer":{"ingress":[{"ip":"192.168.1.215"},{"ip":"192.168.1.36"},{"ip":"192.168.1.57"},{"ip":"192.168.1.78"}]}}}
    kubernetes.io/ingress.class: nginx
    nginx.ingress.kubernetes.io/proxy-body-size: "0"
    nginx.ingress.kubernetes.io/proxy-read-timeout: "600"
    nginx.ingress.kubernetes.io/proxy-send-timeout: "600"
    nginx.ingress.kubernetes.io/ssl-redirect: "true"
    nginx.org/client-max-body-size: "0"
    nginx.org/proxy-connect-timeout: "600"
    nginx.org/proxy-read-timeout: "600"
  creationTimestamp: "2023-04-14T12:50:28Z"
  generation: 2
  labels:
    app.kubernetes.io/name: zabbix
  name: zabbix
  namespace: monitoring
  resourceVersion: "116079466"
  uid: 02117543-6aa1-4752-9e96-3bb895f60544
spec:
  rules:
  - host: zabbix.freshbrewed.science
    http:
      paths:
      - backend:
          service:
            name: myzabbix-zabbix-web
            port:
              number: 80
        path: /
        pathType: ImplementationSpecific
  tls:
  - hosts:
    - zabbix.freshbrewed.science
    secretName: zabbix-tls
status:
  loadBalancer:
    ingress:
    - ip: 192.168.1.215
    - ip: 192.168.1.36
    - ip: 192.168.1.57
    - ip: 192.168.1.78

$ kubectl apply -f ingress.zabbix.yaml.3 -n monitoring
ingress.networking.k8s.io/zabbix configured
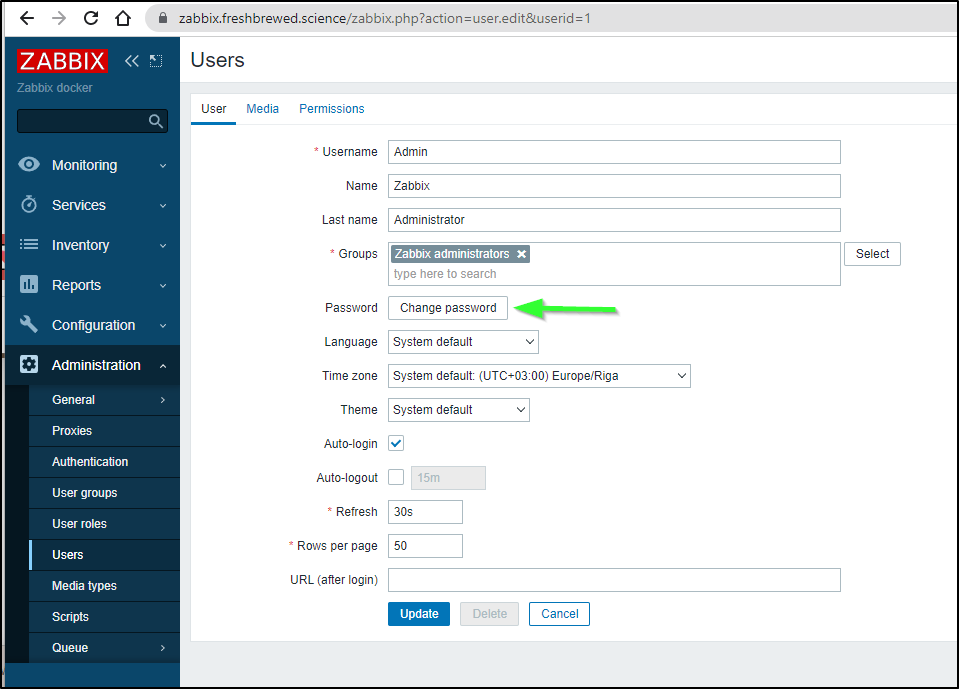
The first thing to do, now that we exposed our endpoint, is to change the password of the admin user
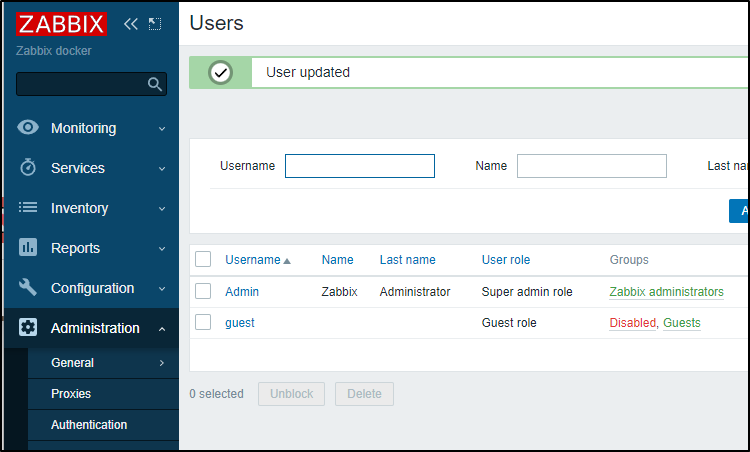
And we can save and see it updated
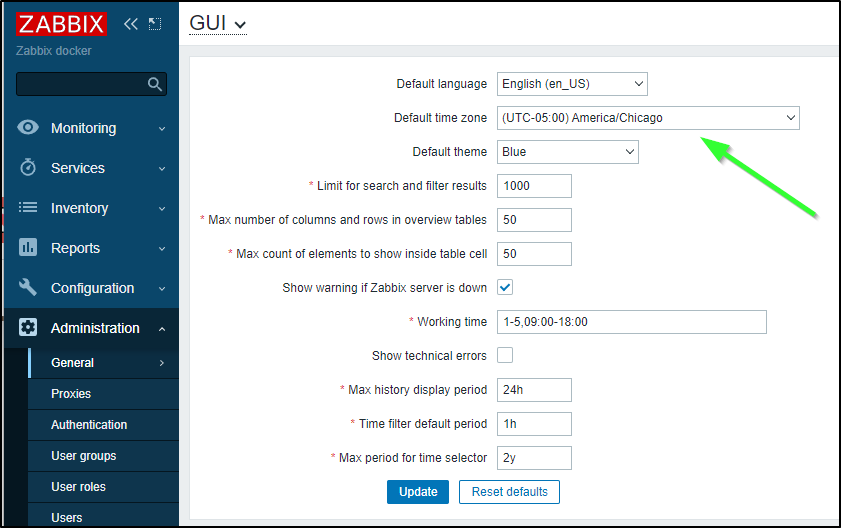
The default timezone is Riga, Latvia. So I’ll change that next
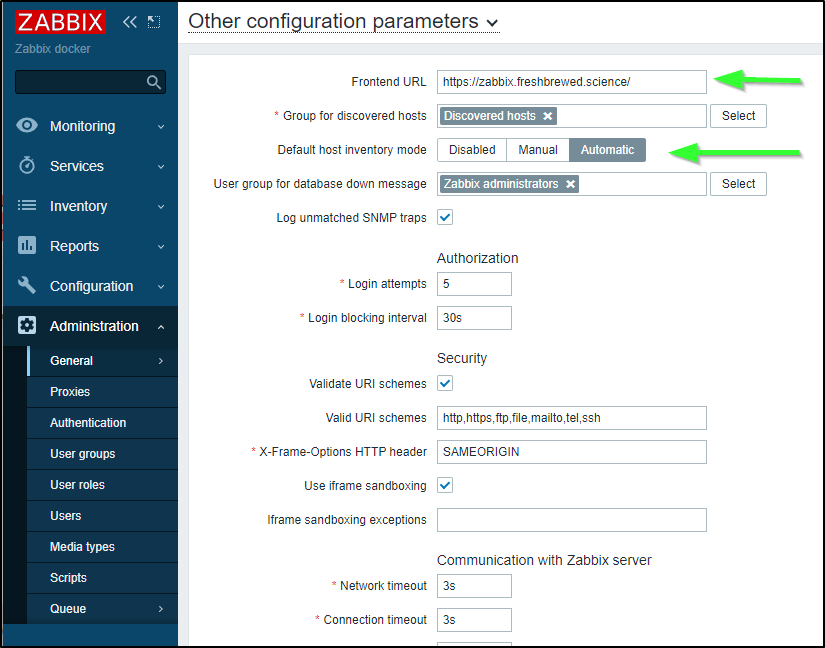
Under Administration, General, Other I’ll give our Frontend URL and set Host Inventory mode to Automatic
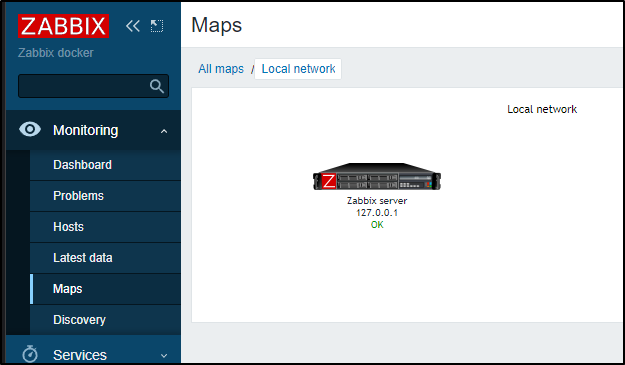
In maps, I want to make my “Local network” a favourite
which will now give us a link to the local network map
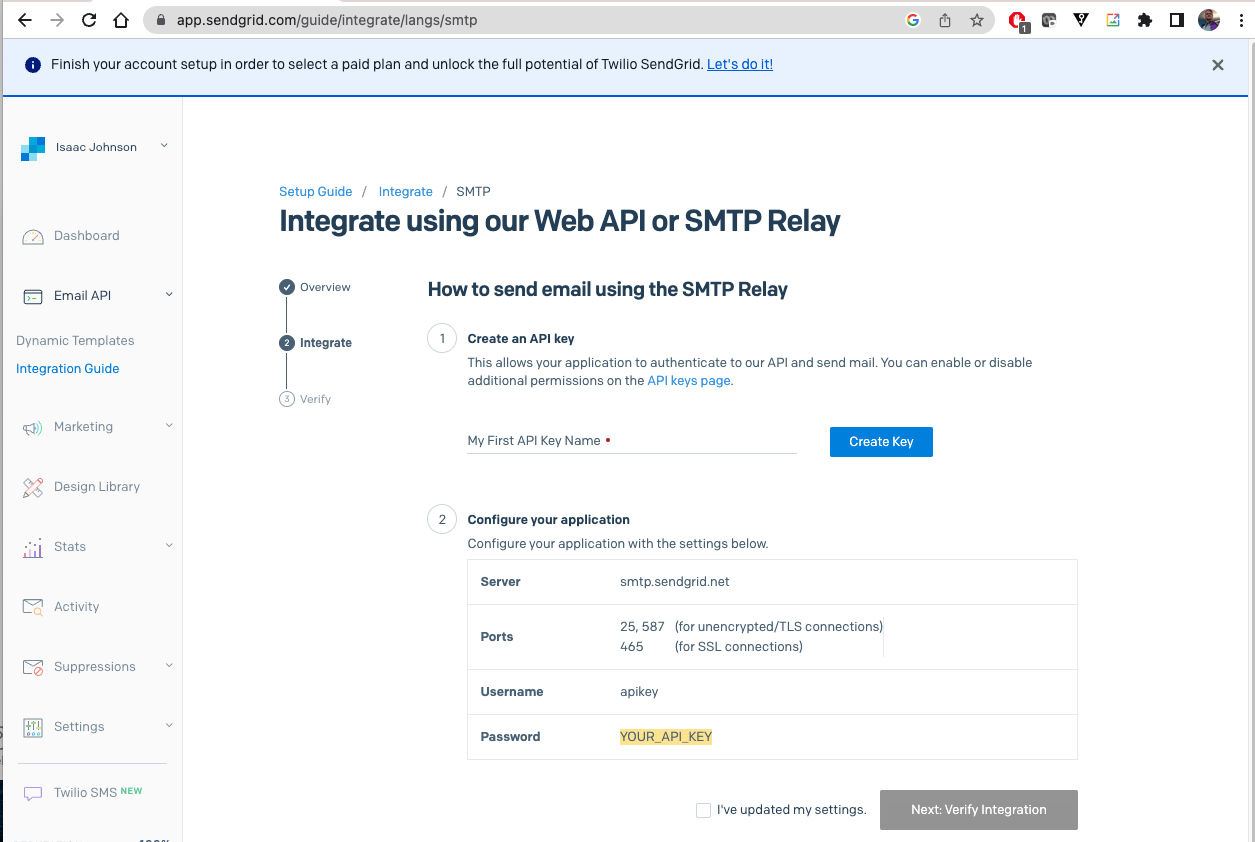
Sendgrid
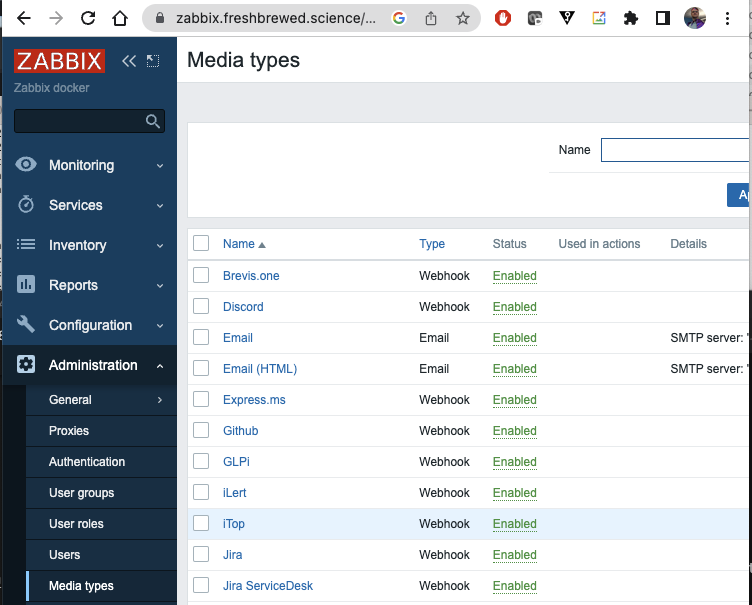
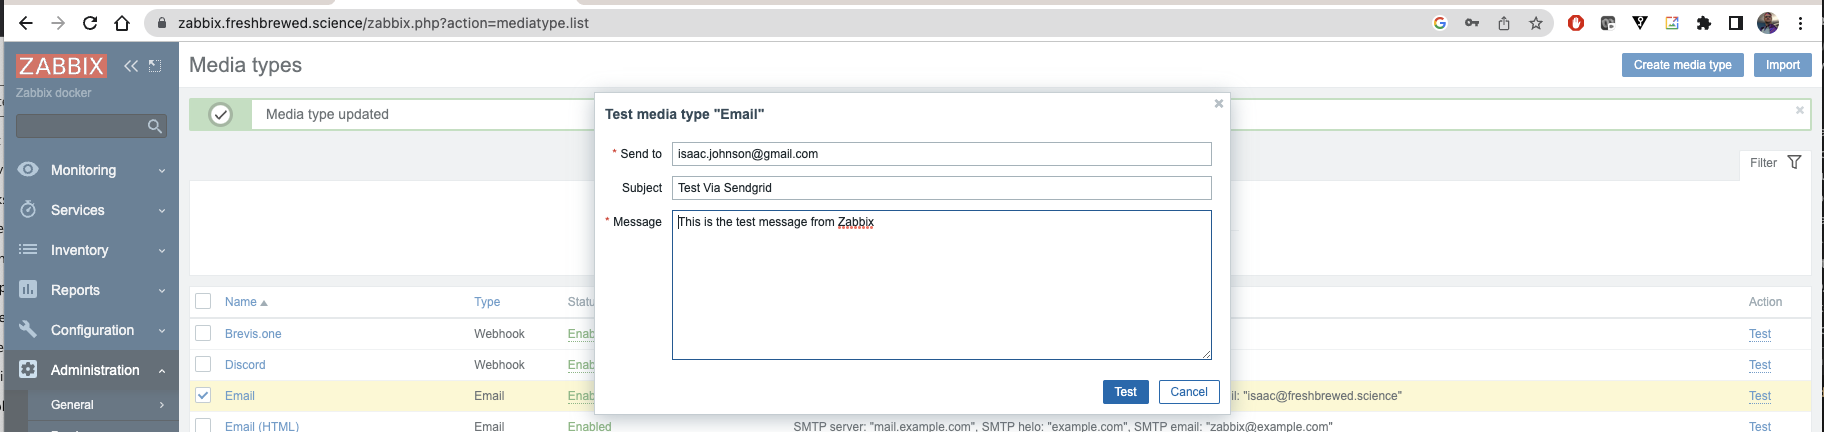
We need to go to “Administration/Media Types” to find “Email” and “Email (HTML)”
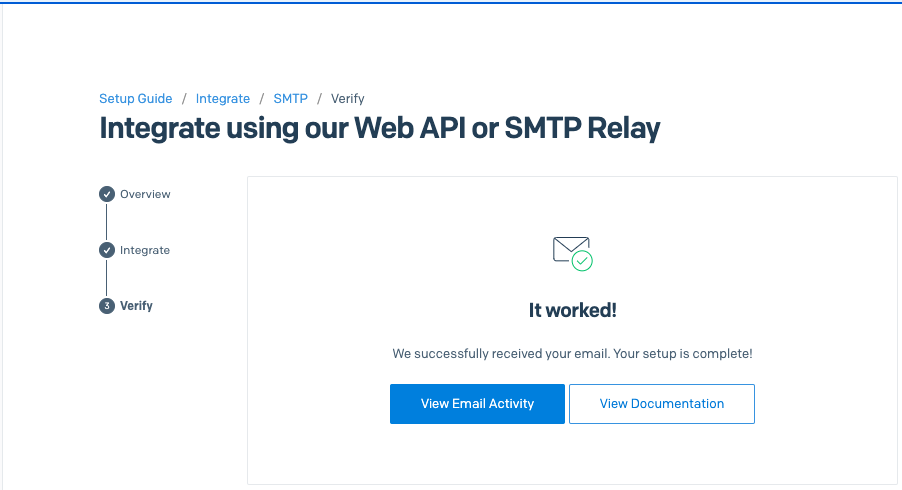
In SendGrid, we can go to the SMTP Relay settings
Now let’s test
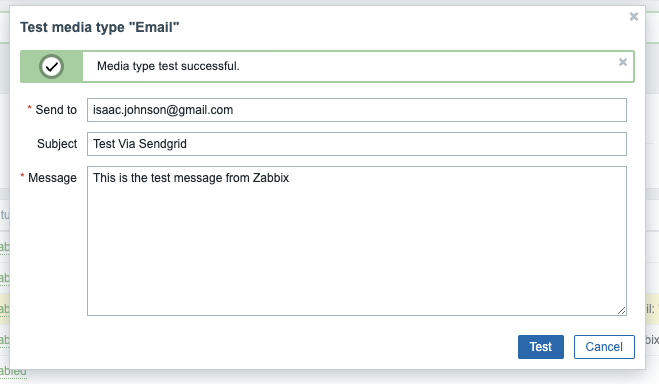
I see it was a success in Zabbix
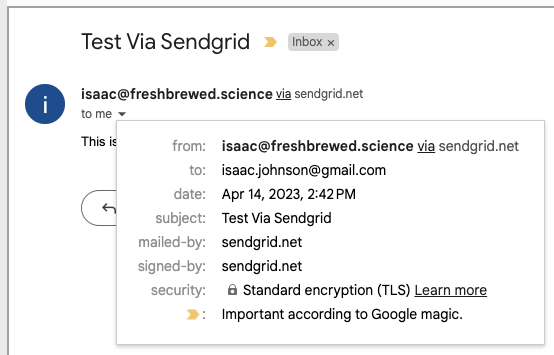
I see the verification in Sendgrid
And I can see the email in Gmail
Hosts
Adding a NAS
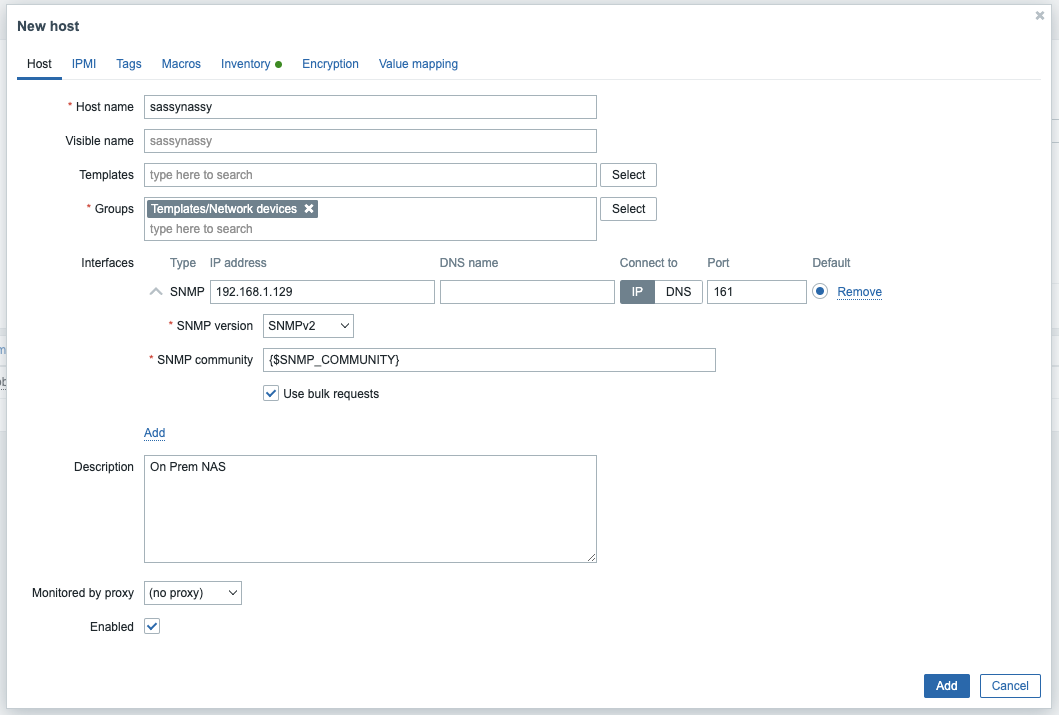
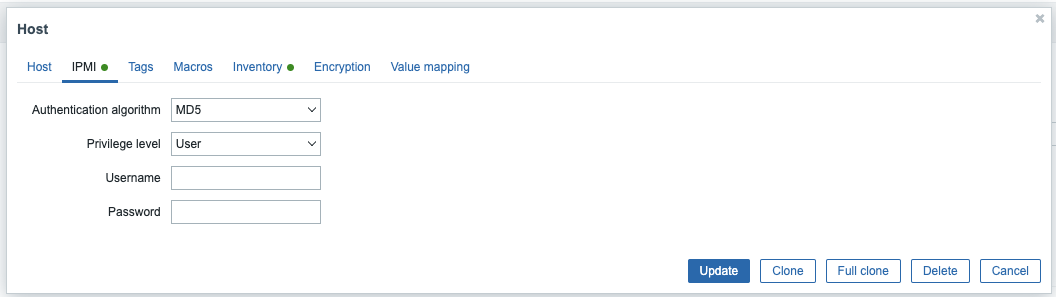
I added a IPMI user as MD5, but no login details
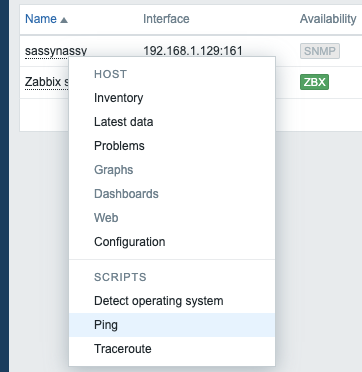
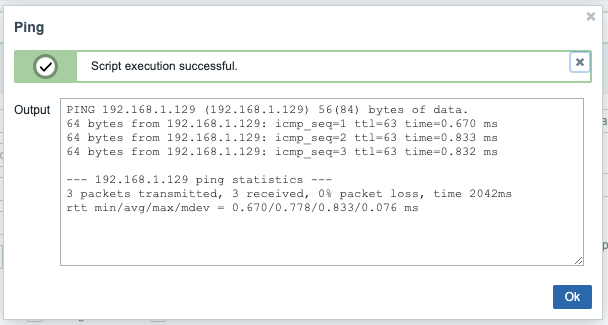
Then I could show ICMP details now
which worked
Adding a Linux VM Host
Just as before, we can add a host
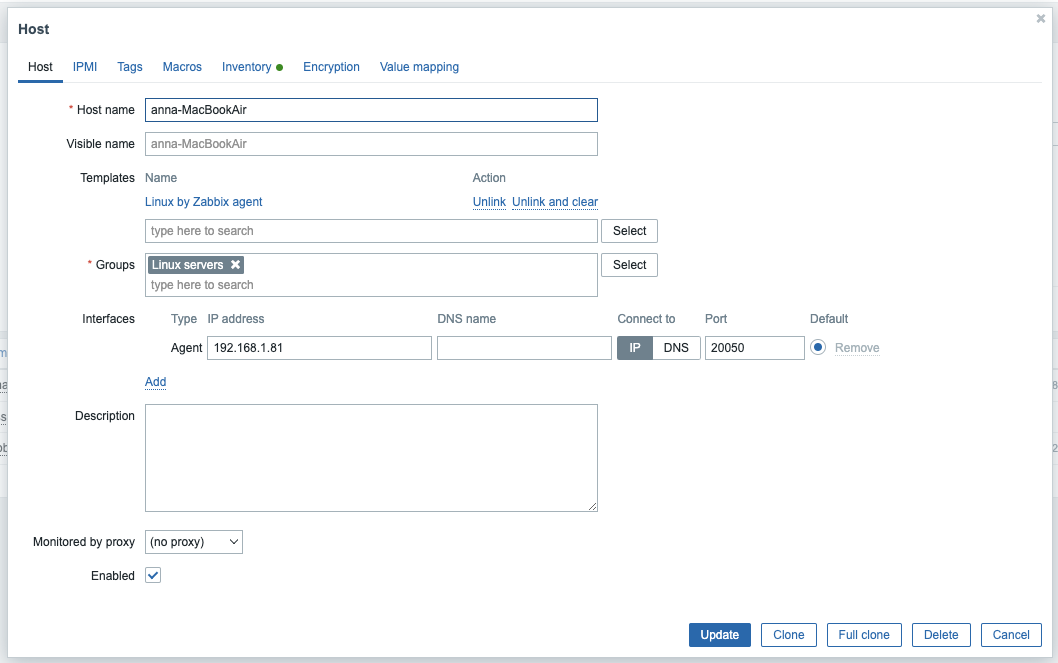
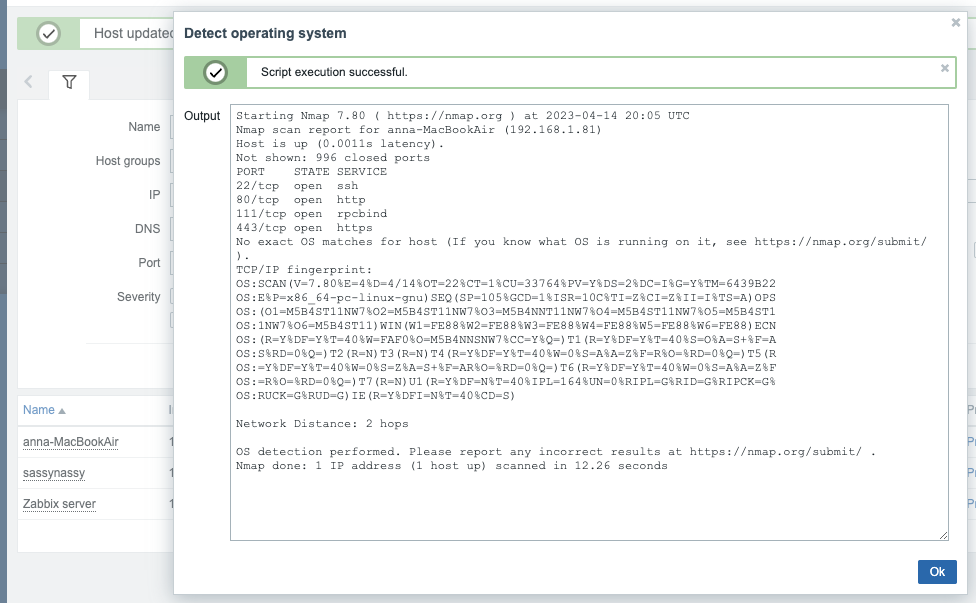
Then “Detect Operating System”
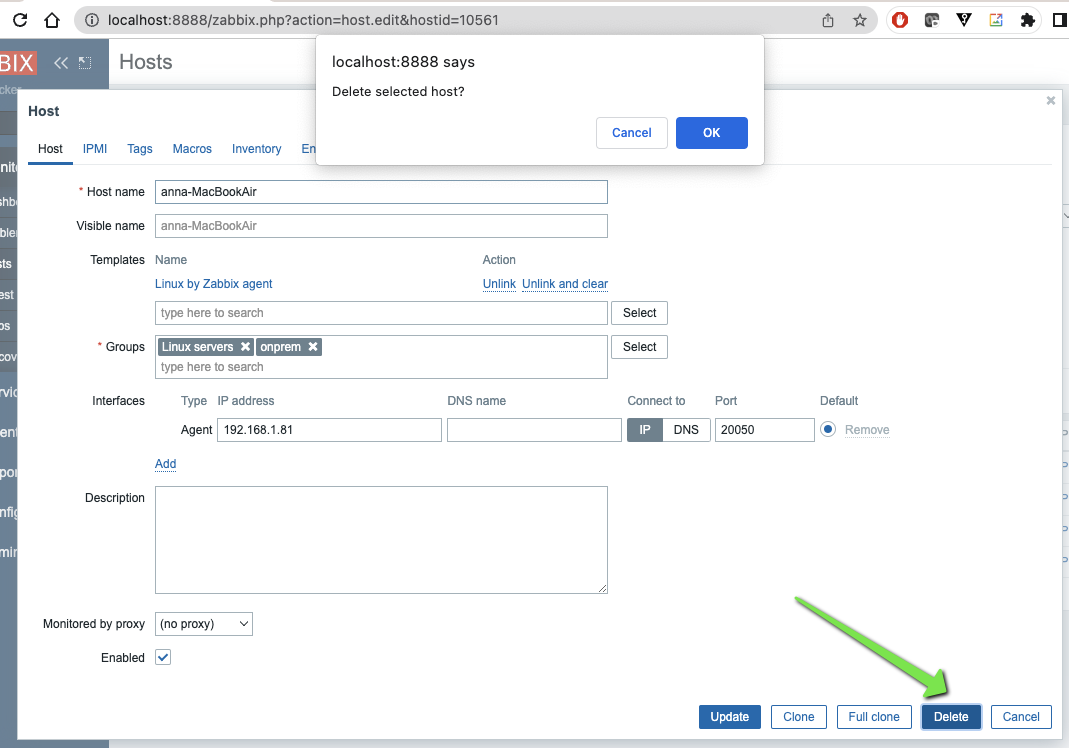
One thing, we will need to remove the monitoring by the test Zabbix instance as it’s unneccessary to track in both
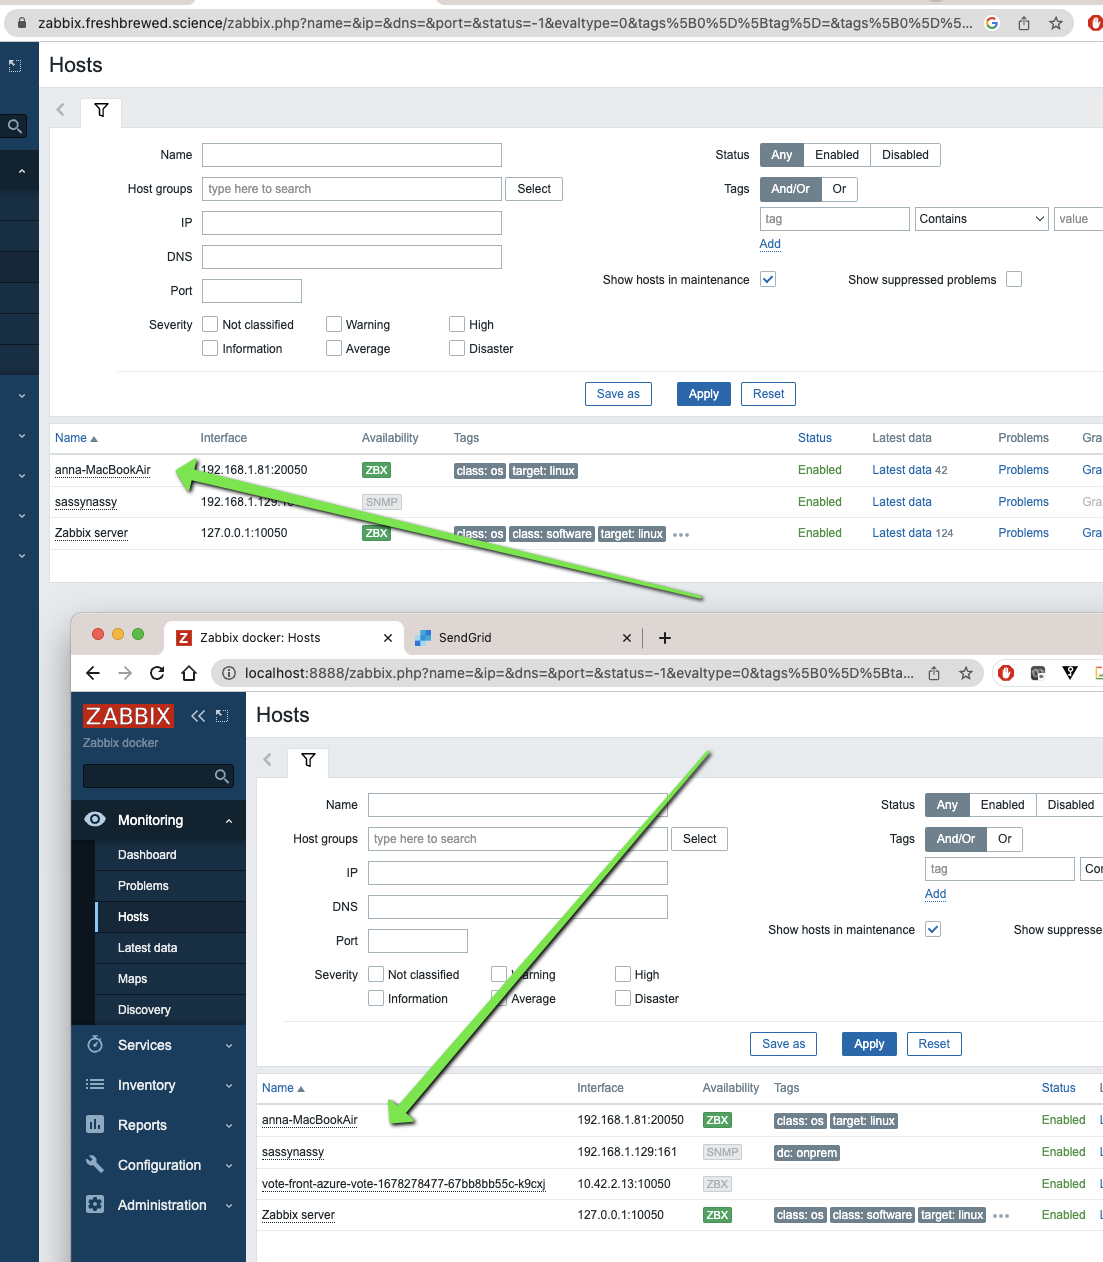
So we delete from the ‘test’ instance:
Discovery
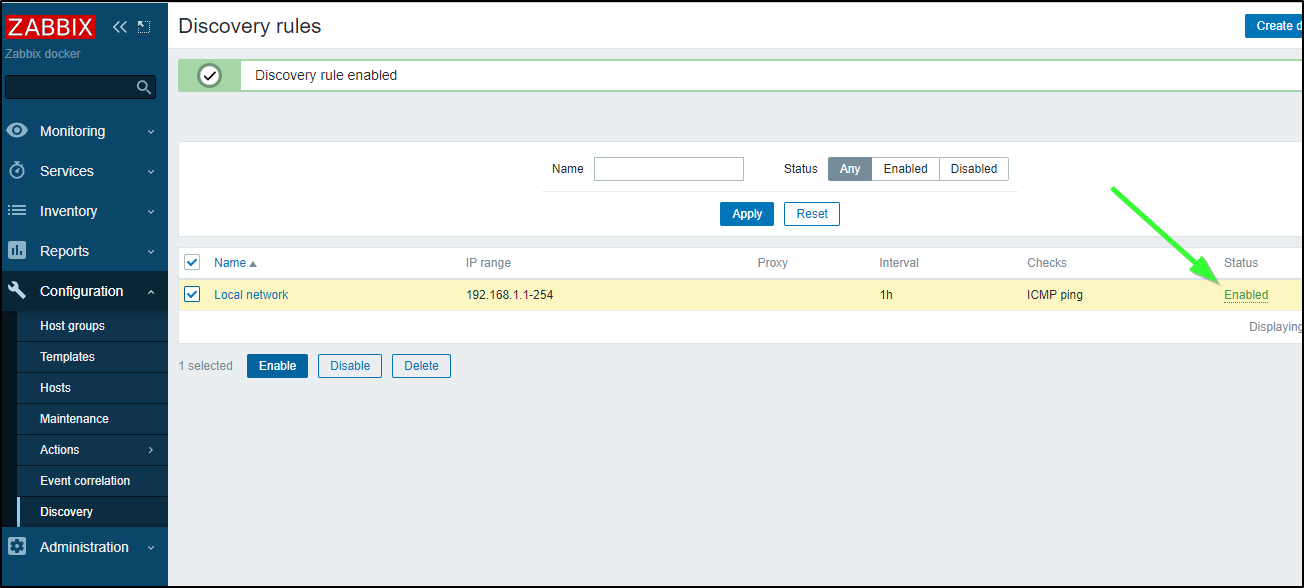
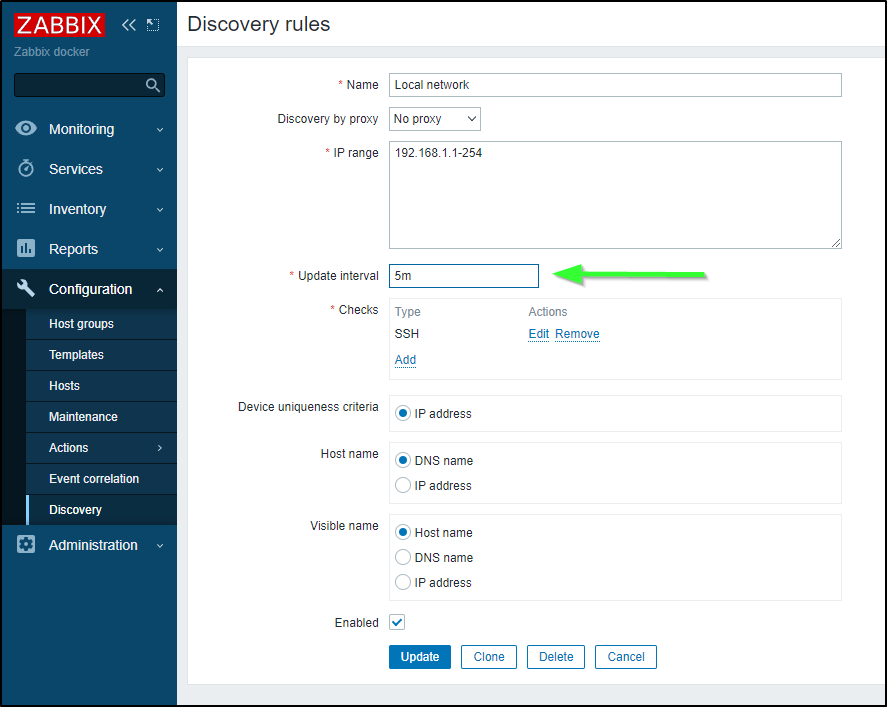
I checked Discovery under Configuration and ensured it was enabled.
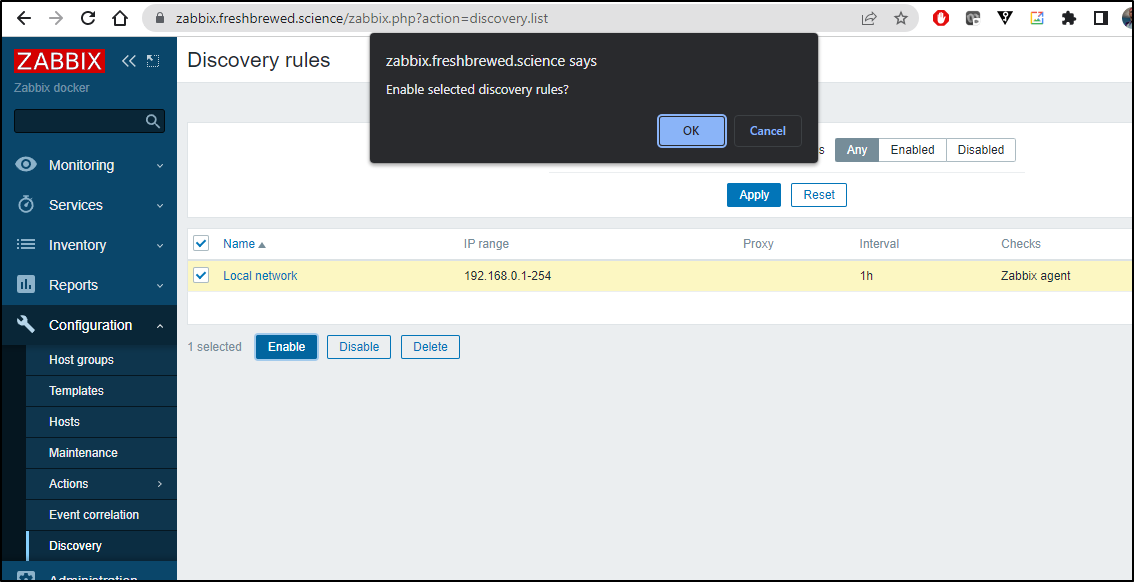
But then it Dawned on my that my network was 192.168.1.0/24 not 192.168.0.0/24 which is why nothing had been picked up.
I then changed my rules accordingly and saved
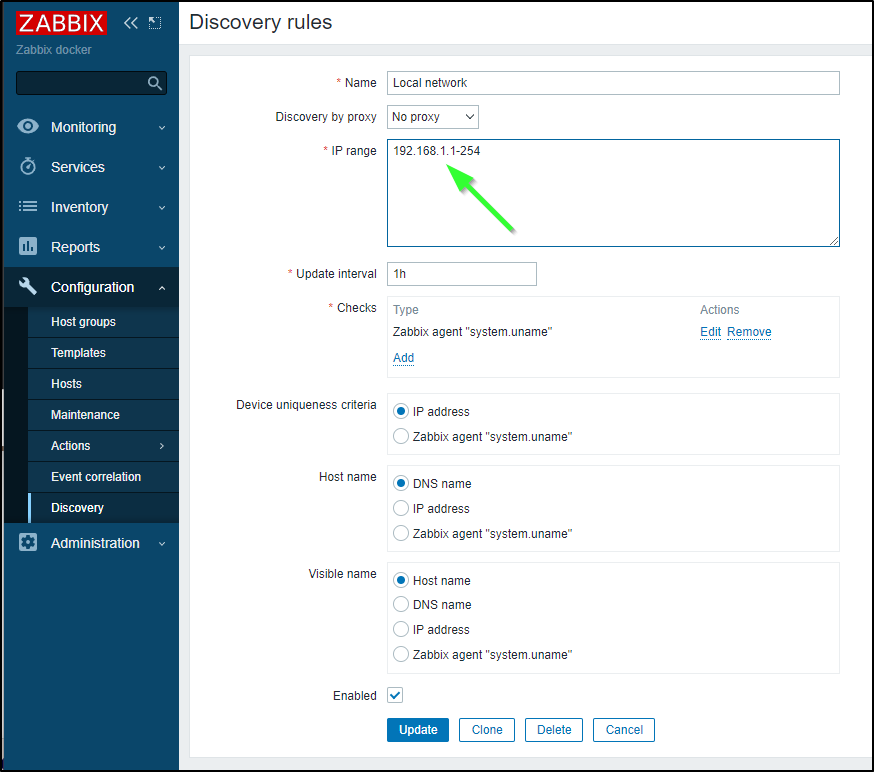
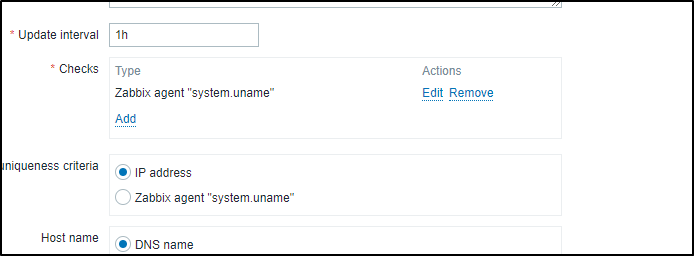
I should add that later I decided limiting to only hosts with the Zabbix agent wouldn’t suffice
So I changed it to ICMP ping
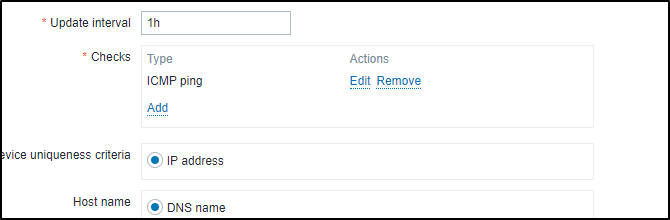
And verified it was enabled
Discovery
For Linux hosts, we will want Auto Discovery enabled as well.
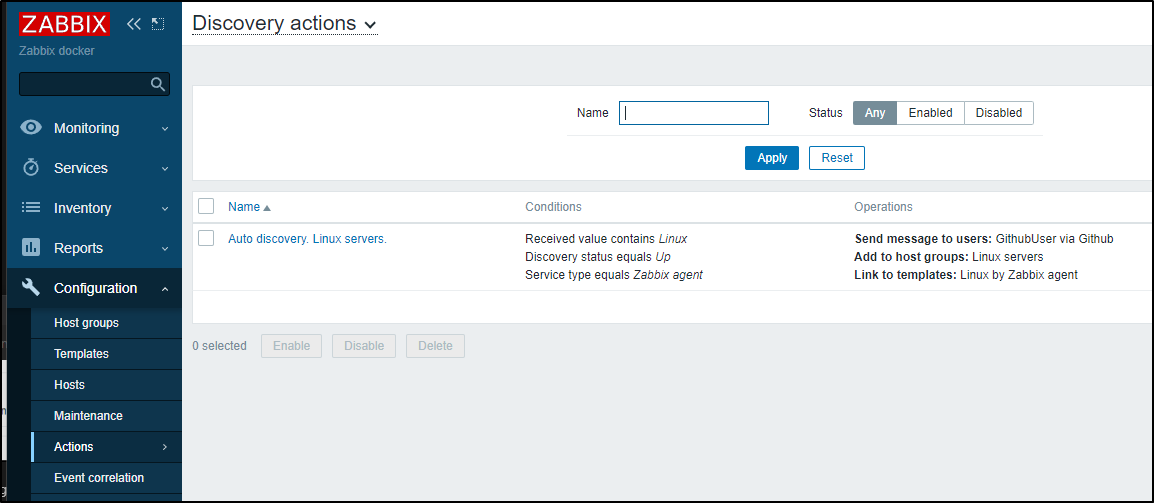
Go to Configuration/Actions/Discovery actions. Here we see the “Auto discovery. Linux servers” is disabled by default
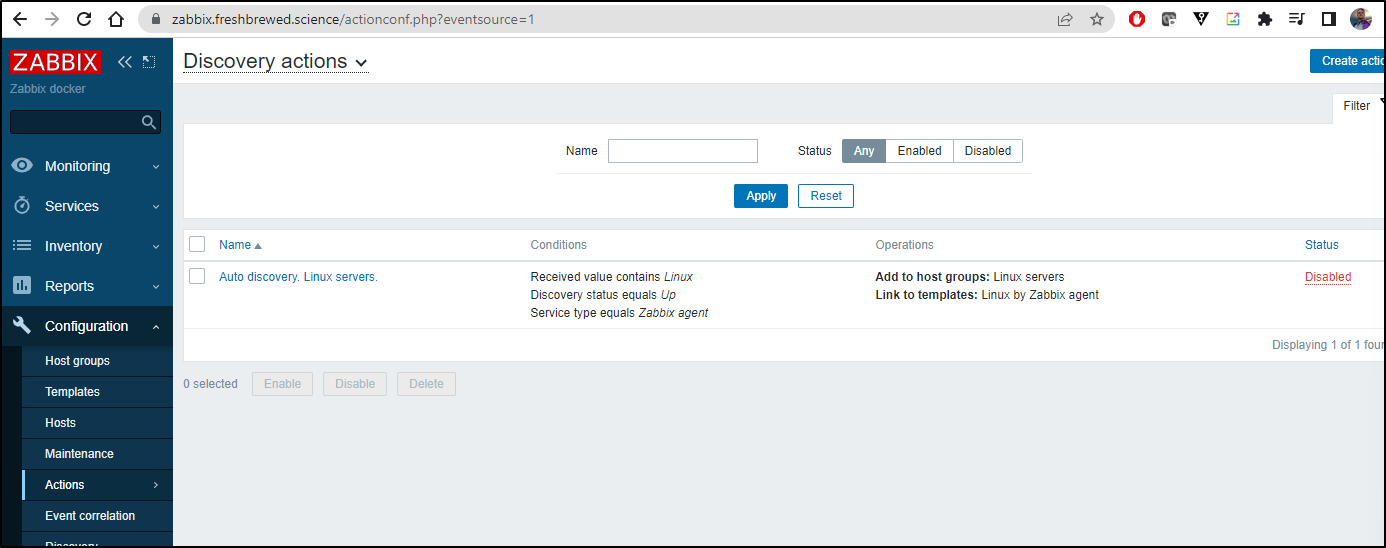
I’ll enable it
I can also verify it’s actions
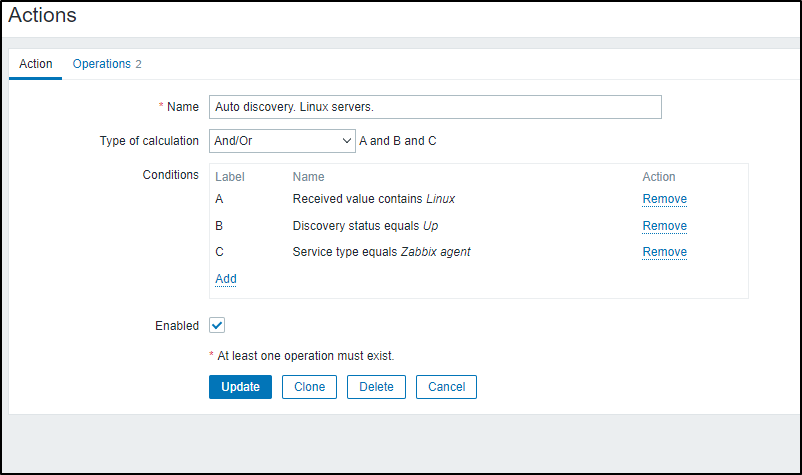
The mistake I initially made is that why I added afew Operations, I missed the most important one.
I came back and saw the Discovered Hosts
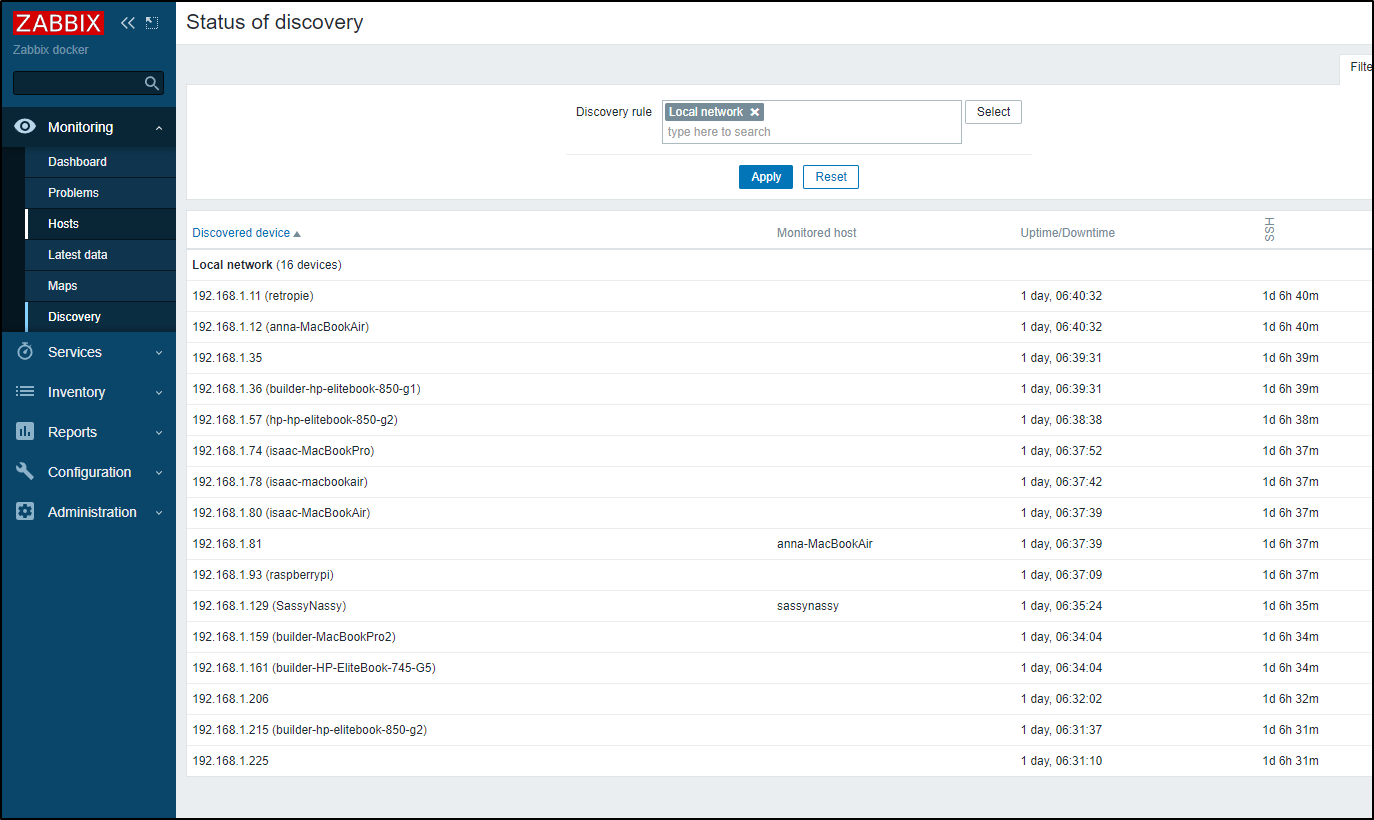
But none were actually added as “Hosts” in my dashboard.
Going to Actions/Discovery Actions, I immediately saw the mistake in “Operations”.
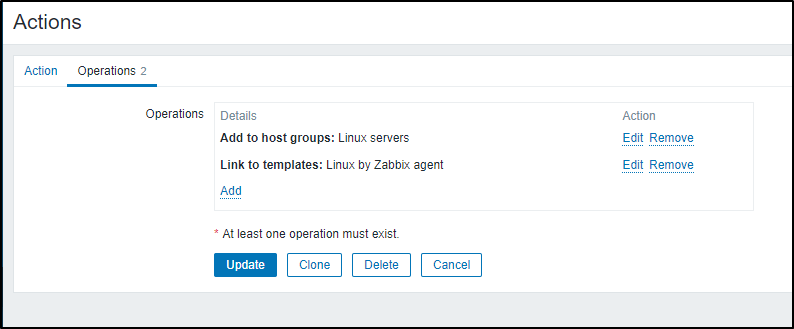
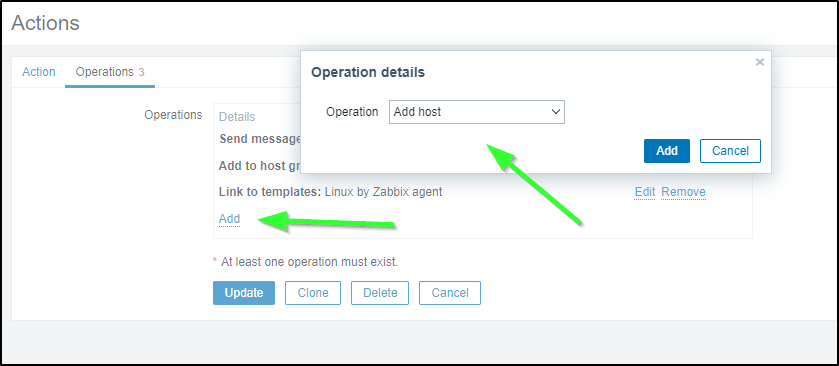
I opened the “Auto discovery. Linux servers.” rule, and went to Operations, there I added the (doh!) “Add Host” action
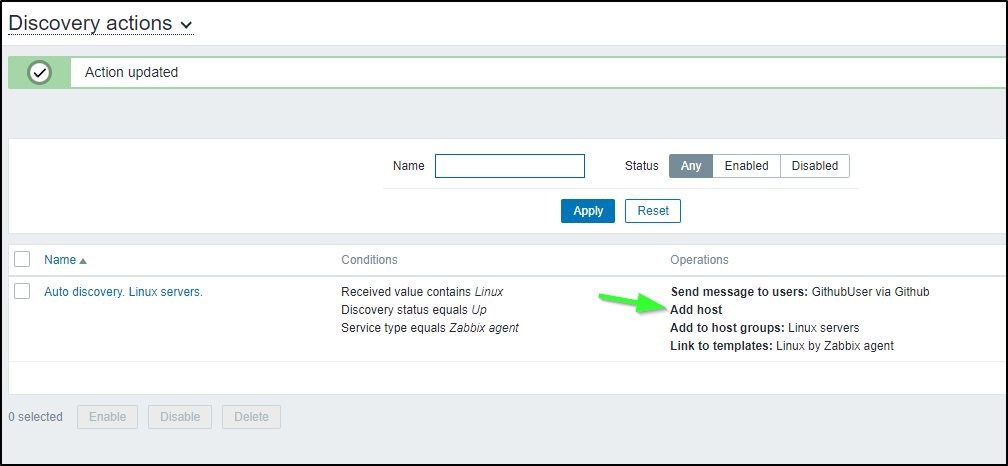
I saved the Discovery Action, noting the added Operation
I then set it to a 5m schedule to get it to kick off sooner
Guest Access
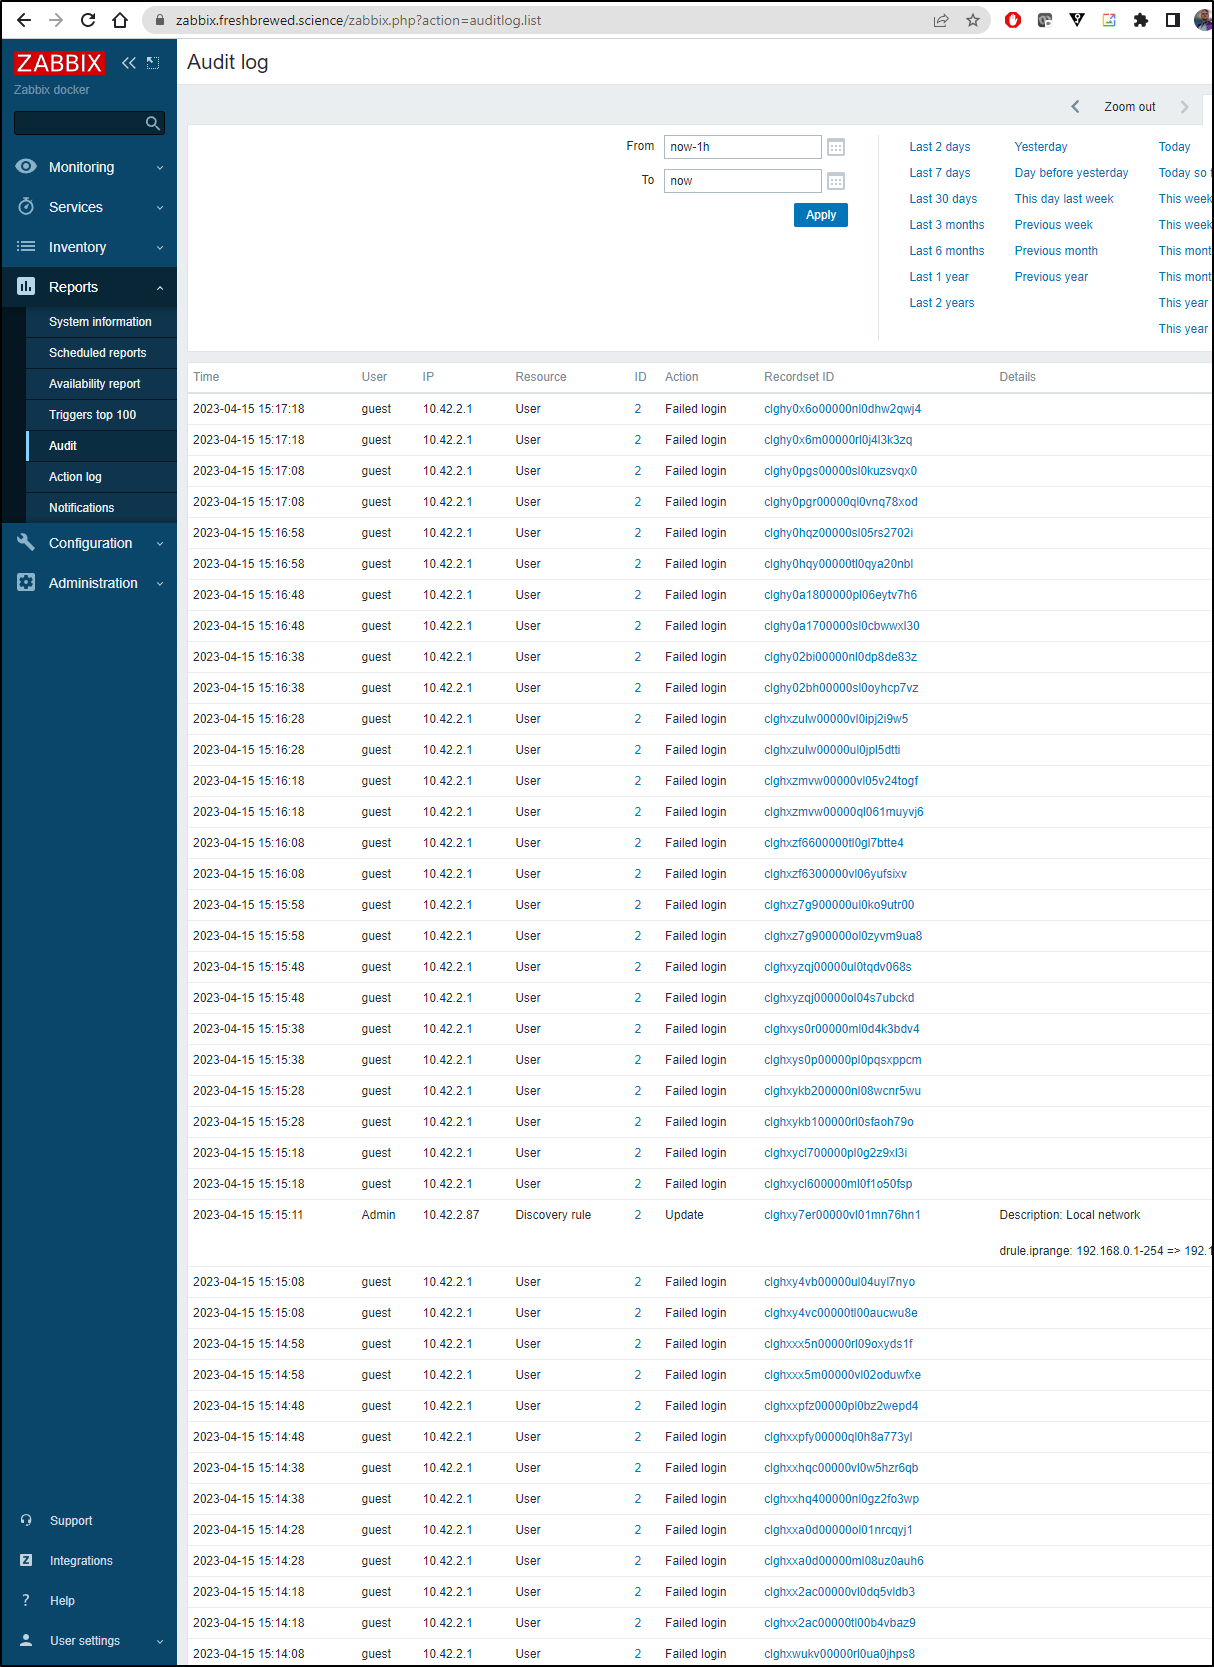
I checked my Audit log and was surprised to see some one or system had been hammering my login as guest endlessly since I exposed Zabbix externally
Guest, by default, is disabled
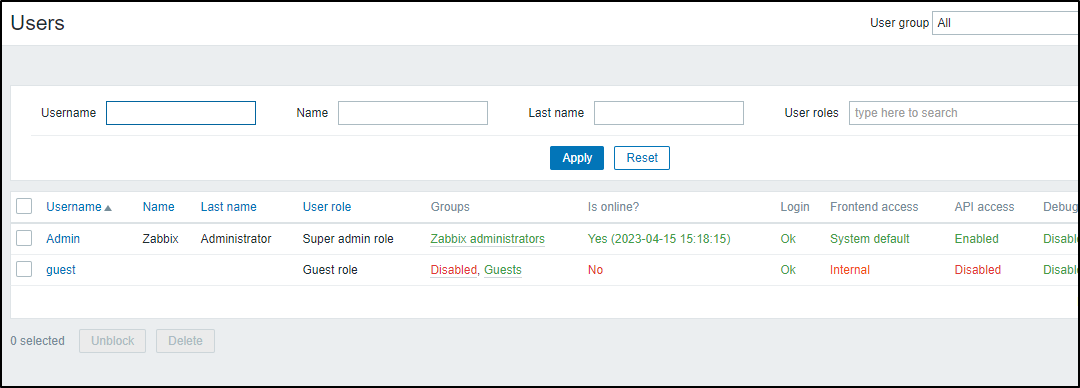
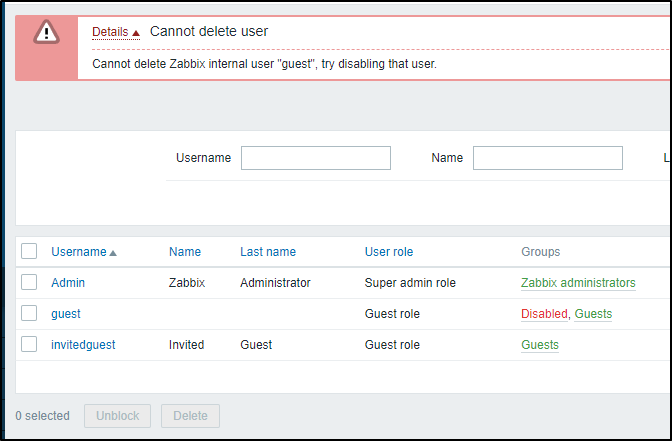
What I decided would be best is to create a new ‘Invited Guest’ account (with a password).
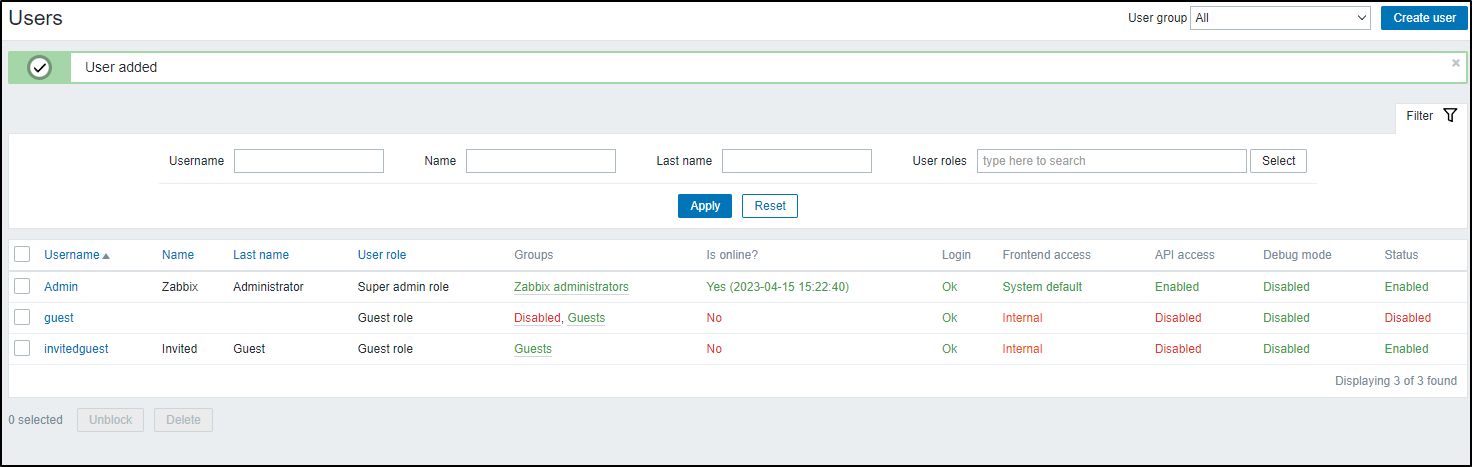
This user can view things, but no administration.
I then just deleted the default ‘guest’ as that will only cause issues if unblocked…
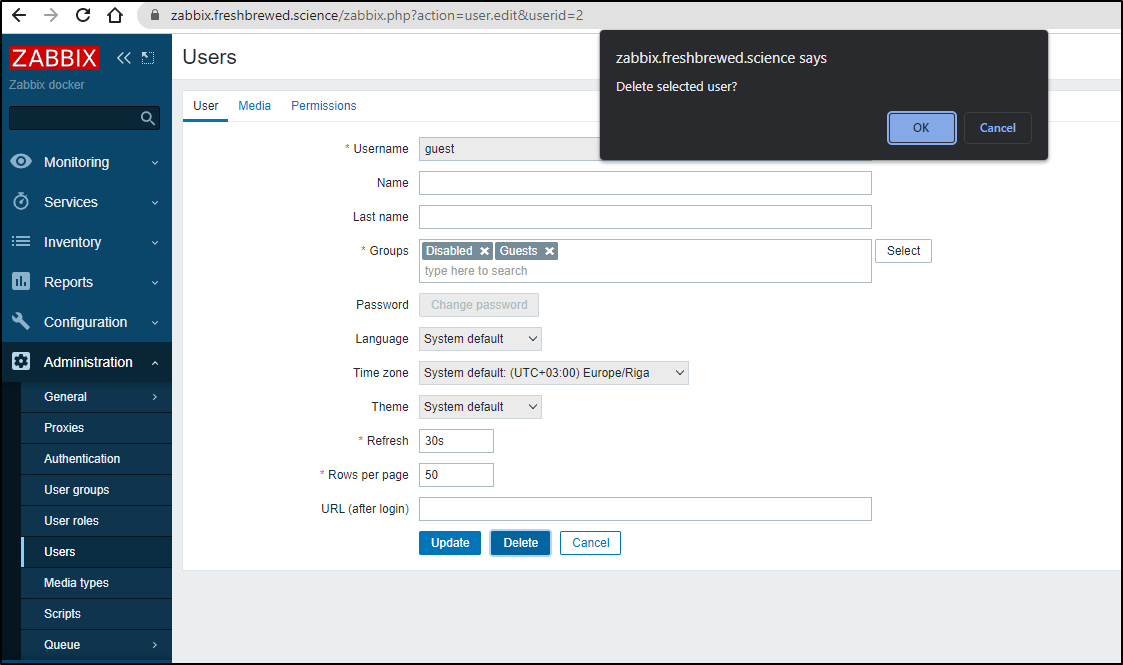
Interestingly, one cannot remove guest - I did not expect that…
Notifications
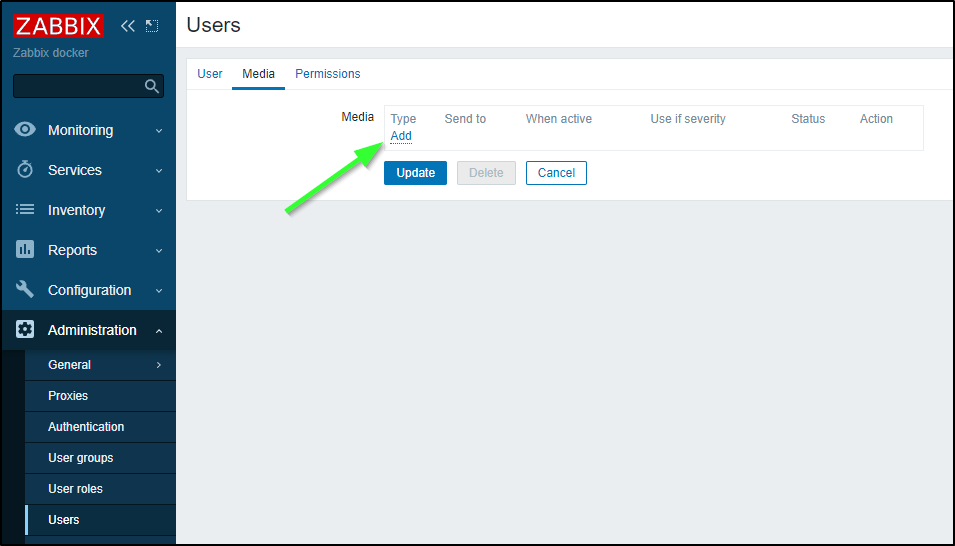
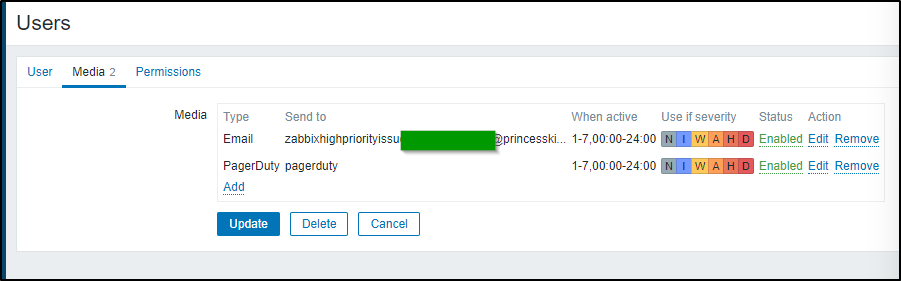
If I wish to get, say, email Notifications, then I need to add a “Media Type” on my Admin user
I love how we have a “When active” cron style field
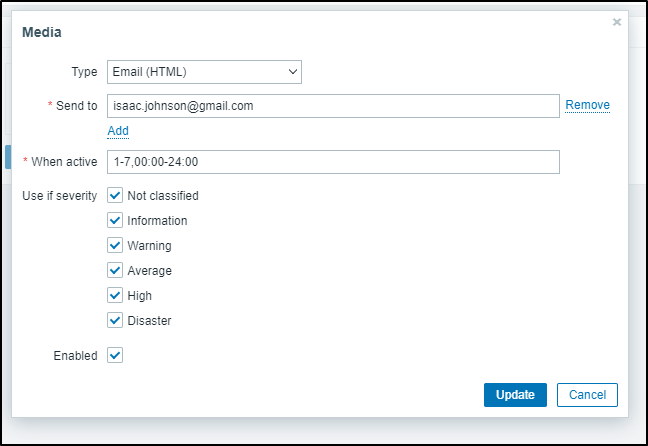
I cannot recall another tool (outside Pagerduty, perhaps) that let’s us only notify people by hour ranges. It does seem obvious, but in many cases, people don’t really want to get woken up due to a High CPU system if they aren’t on-call or working at those hours.
One really clever thing is we could setup a very nice Pagerduty off-hours alerting system on severe issues.
Pagerduty by email
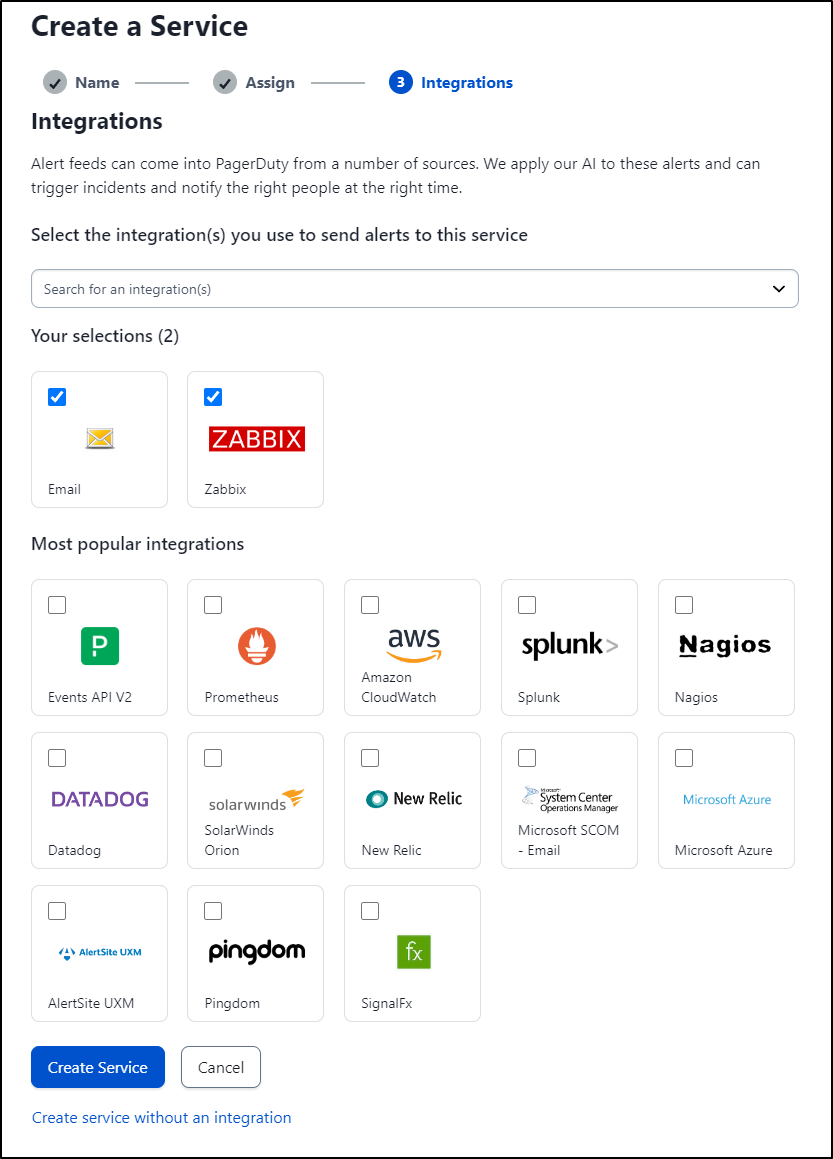
I can go to Pagerduty Services and select a service or create a new one
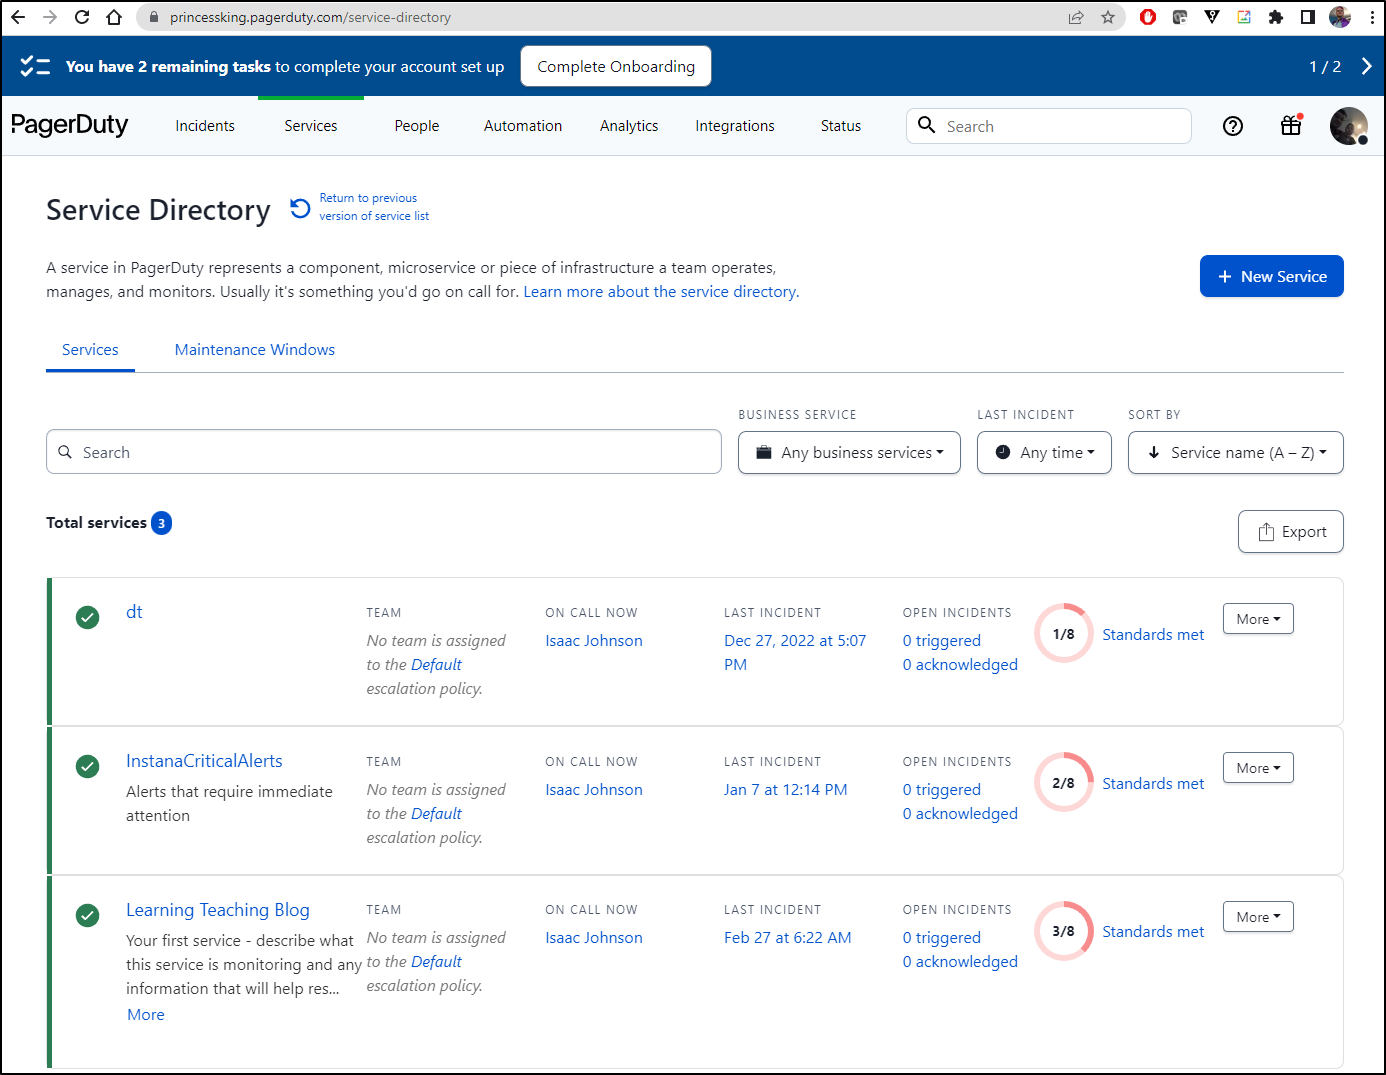
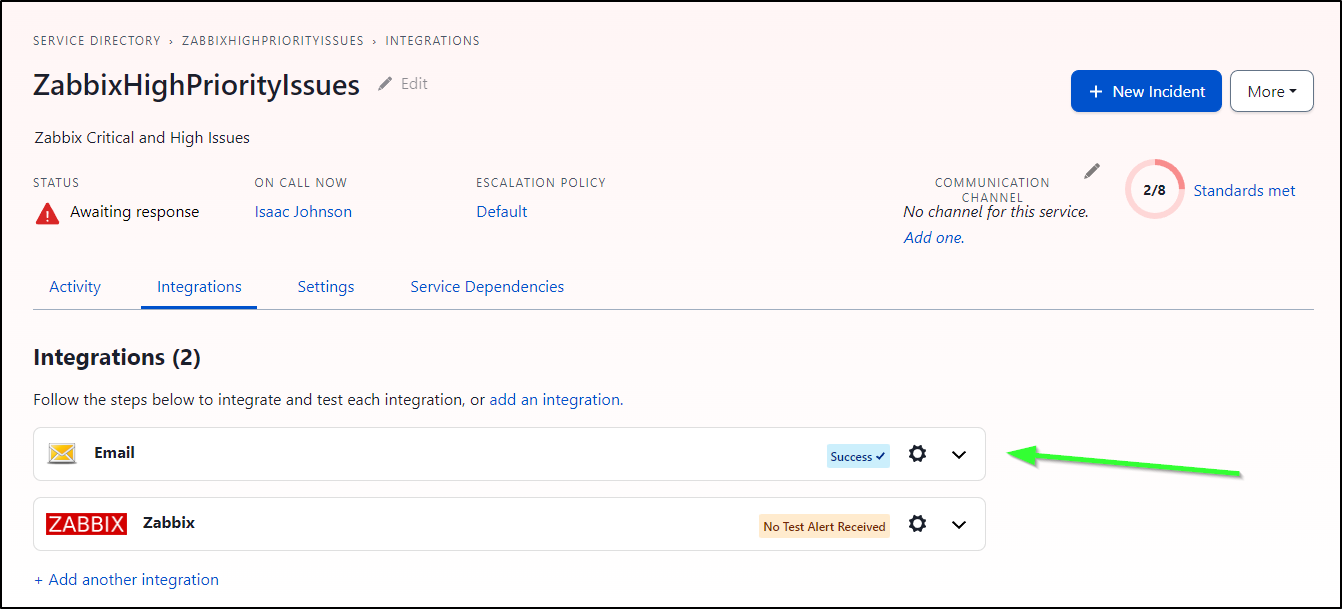
I think for this I’ll create a new service called “ZabbixHighPriorityIssues”
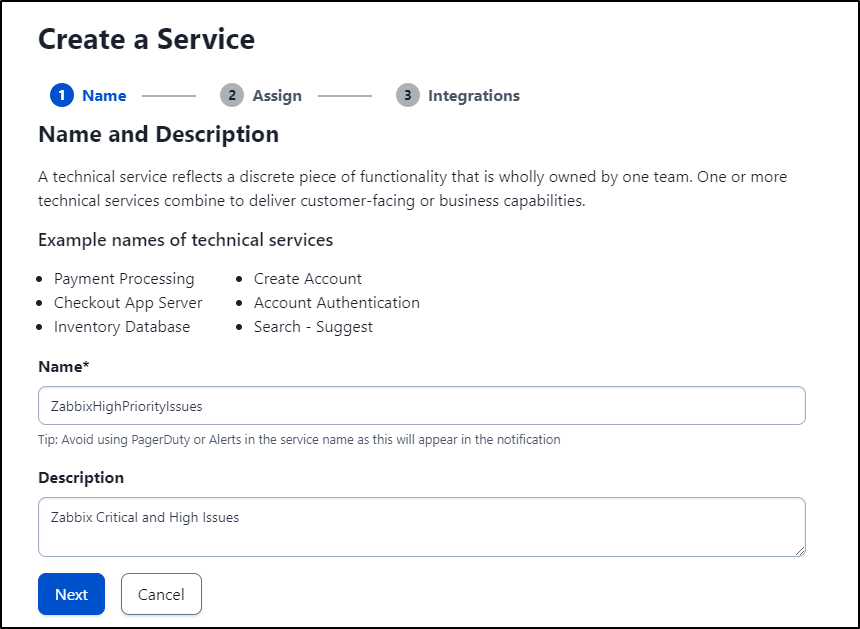
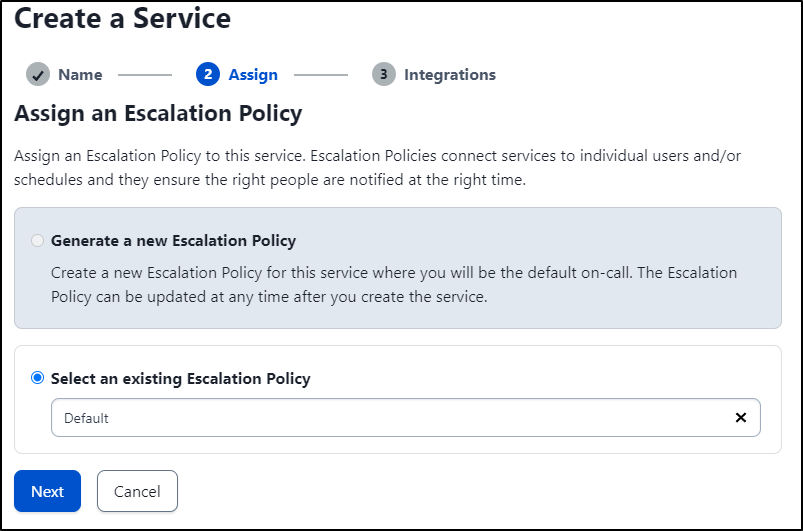
I’ll leave the default Policy
Then I’ll create a Zabbix and Email integration
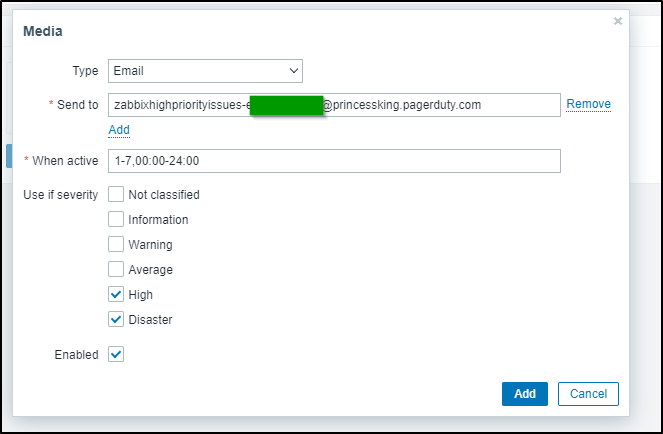
I’ll first add by email which I can copy from the “Integration Email” field
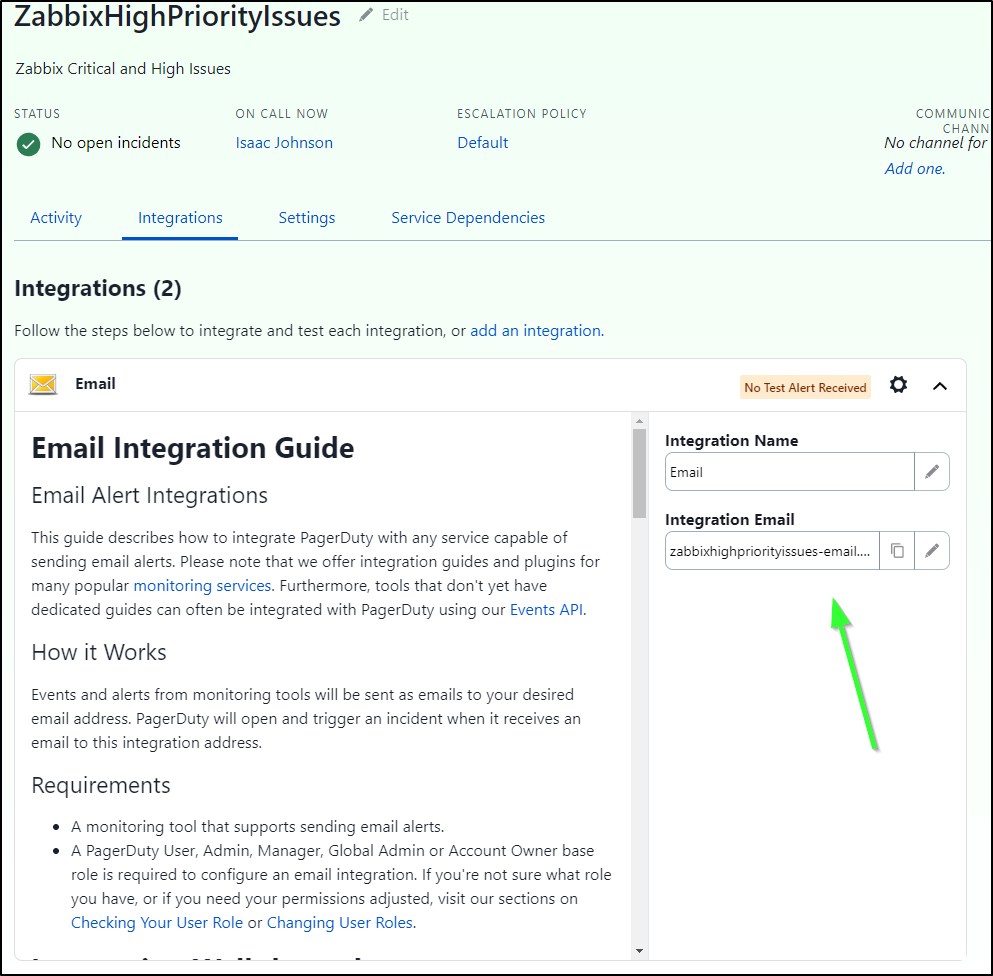
It will look something like zabbixhighpriorityissues-email.asdfasdfasdfasfd@princessking.pagerduty.com
When I add it, I’ll make sure to set it to High and Disaster only
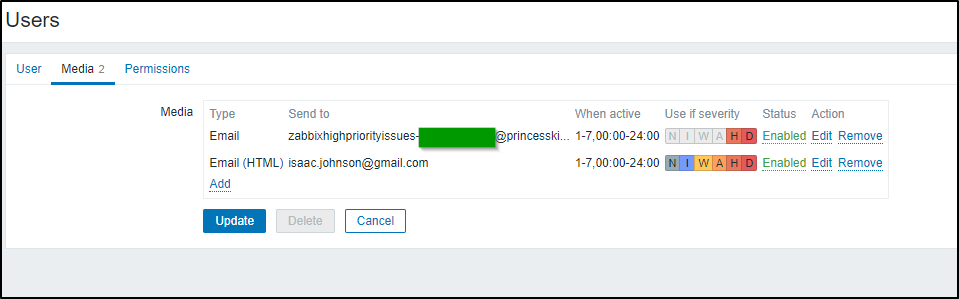
Once saved, I can now see I have proper email type of escalation through to PagerDuty if the severity is high enough
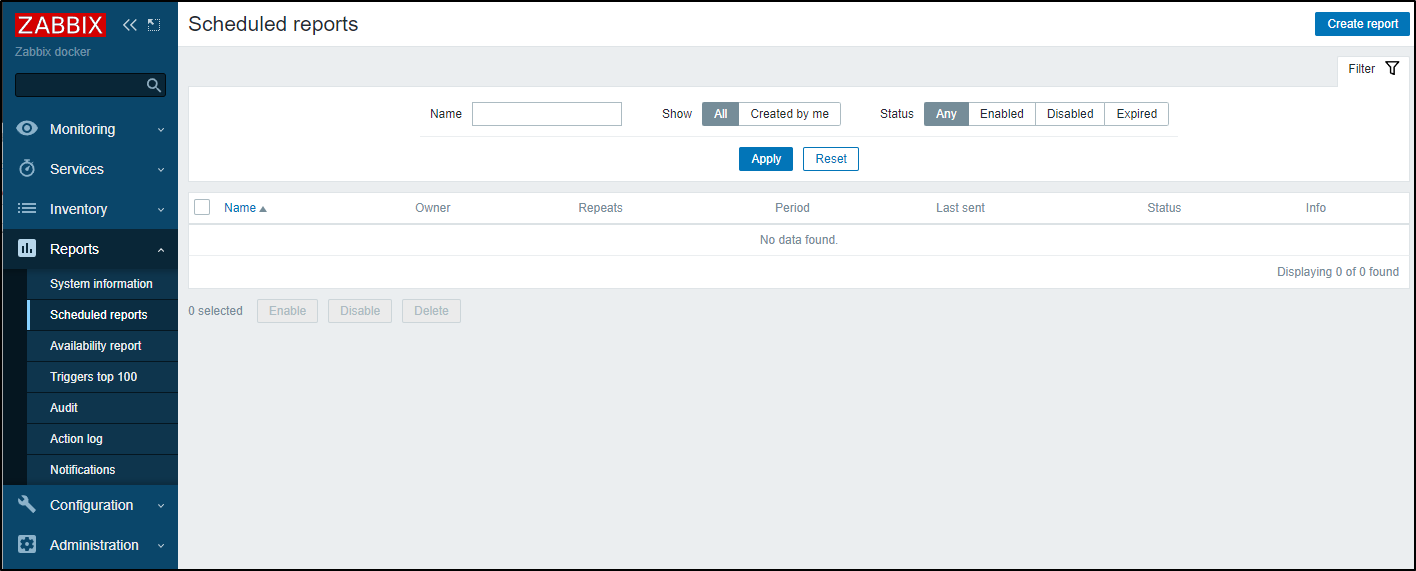
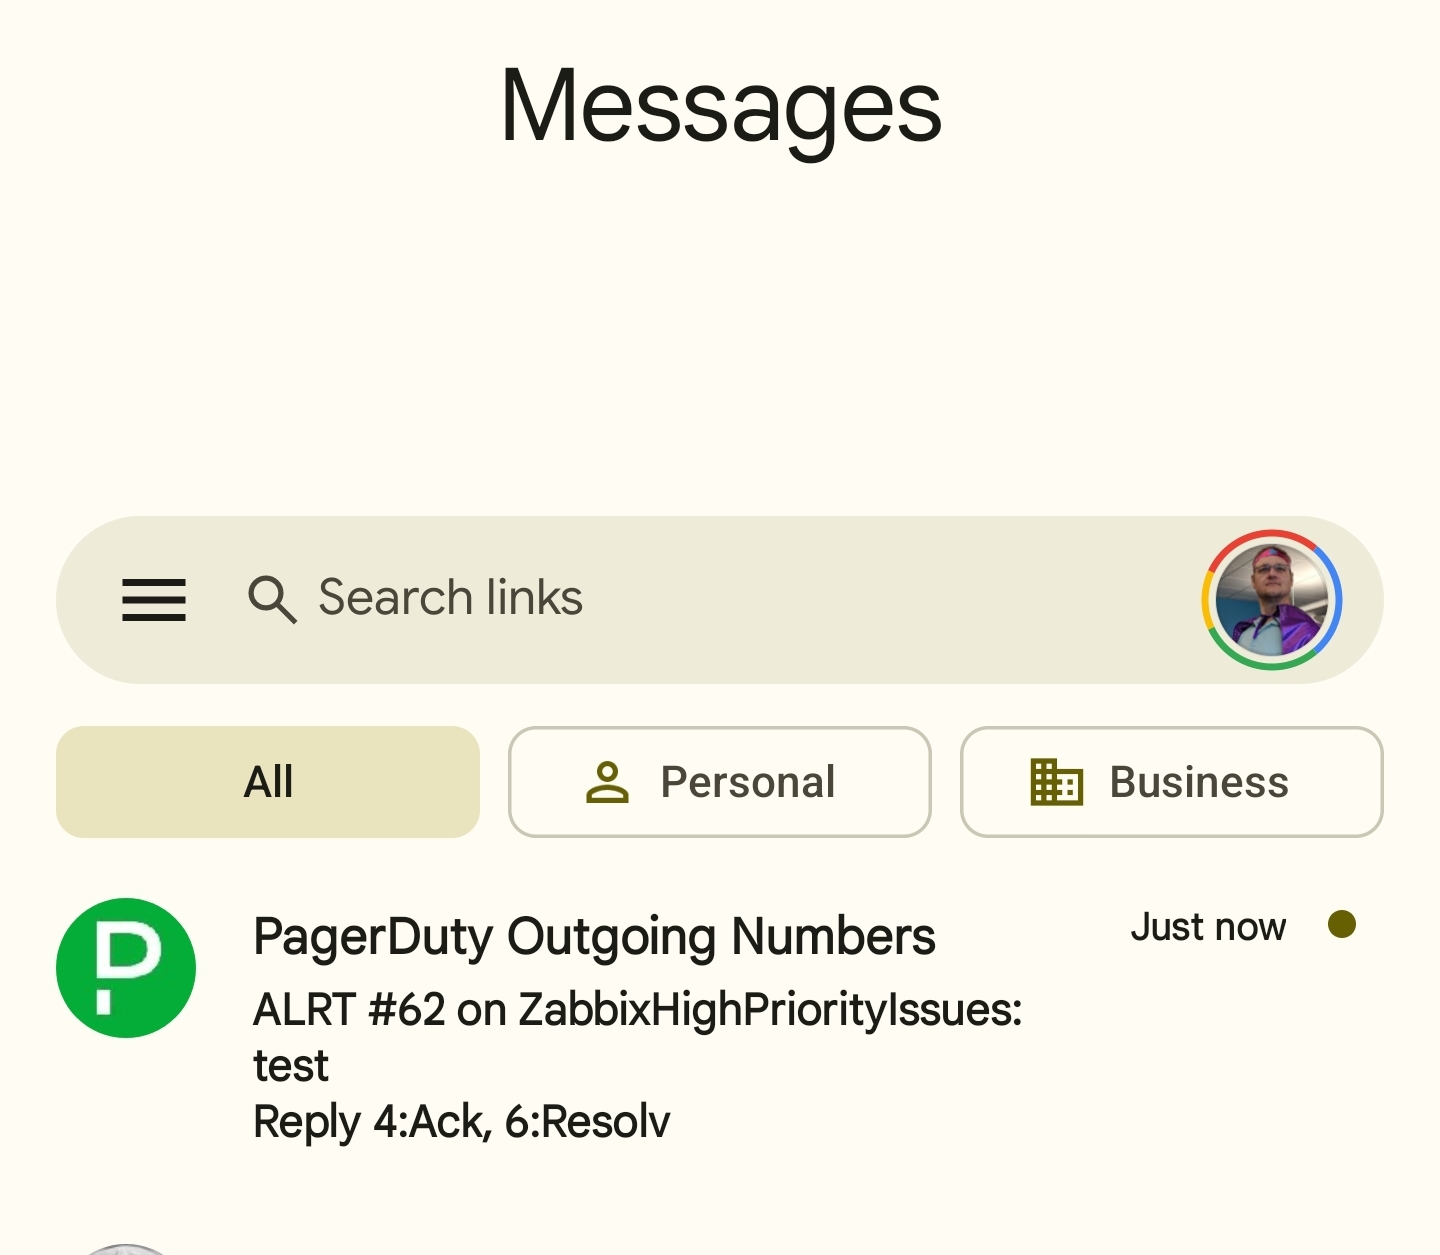
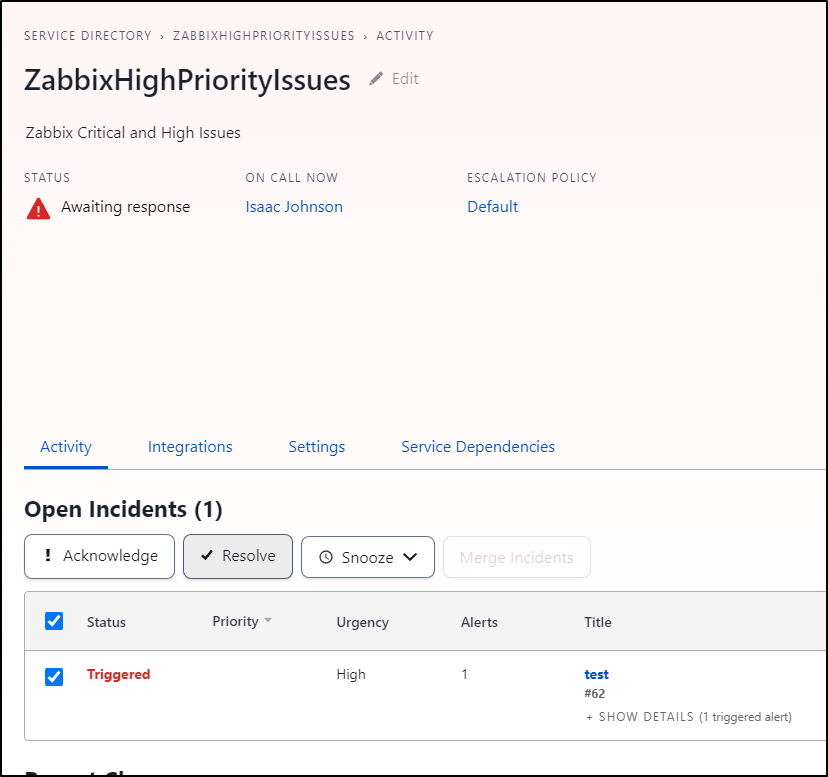
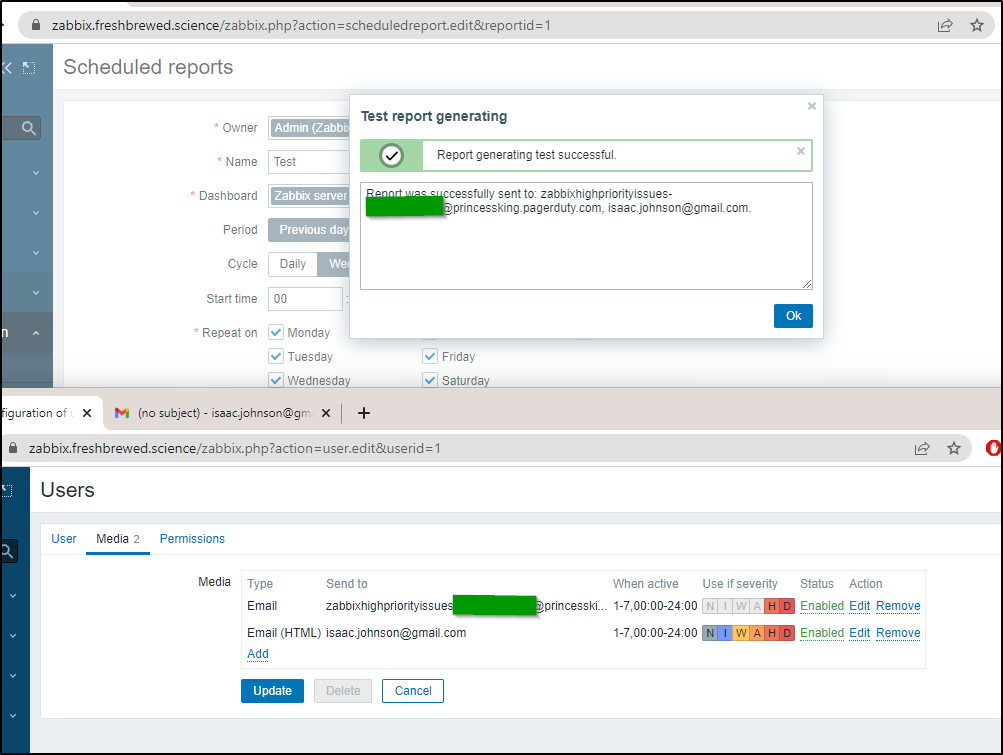
To test this, I’ll set the severity to all, then go to Scheduled reports
In “scheduled reports” I’ll create a report
Add the Pagerduty User and a report to send
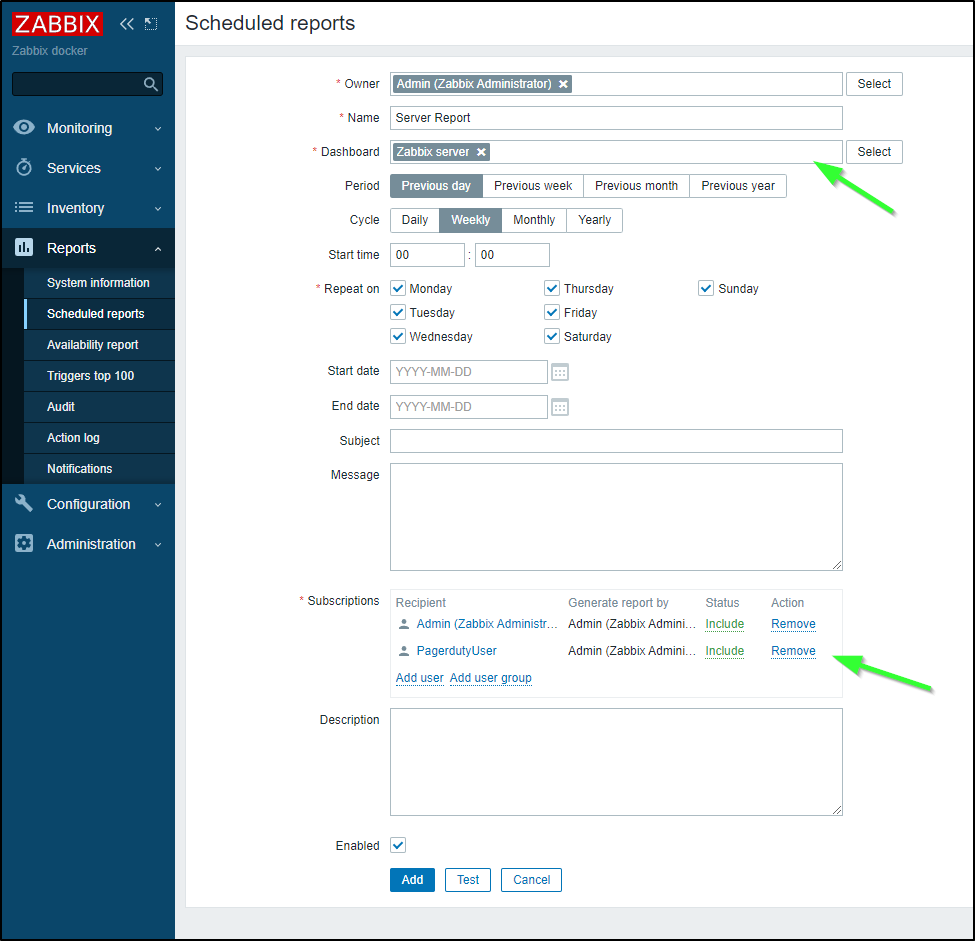
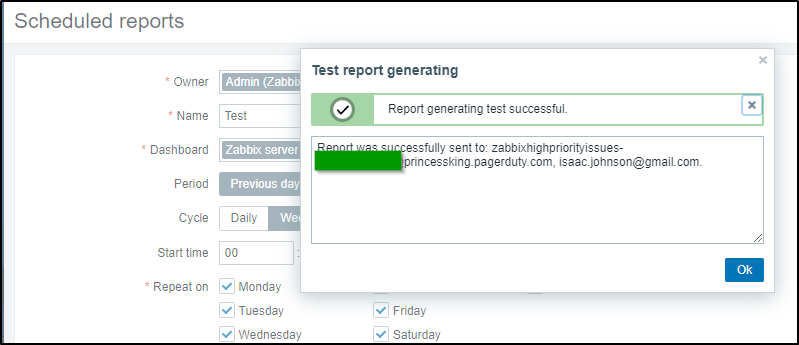
Then we can click “Test”. I can see it sent to gmail and Pagerduty
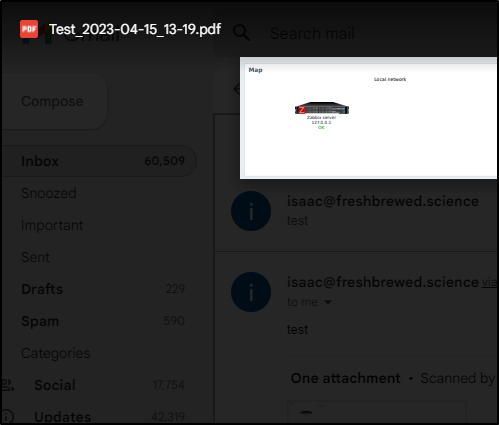
I can see the server report in GMail
And Pagerduty
As well as my Phone
I’ll resolve the issue in PD so it isn’t in alert
If you had done as I and set the Pagerduty email in Admin to all types, make sure to go change that back so regular reports do not trigger Pagerduty
Actually, in testing this, it seems it sent them ANYWAYS
In our next section, we will create a Pagerduty user. I’ll move the PD email to that user and off of admin just to ensure I don’t pages on scheduled reports:
Pagerduty by Integration
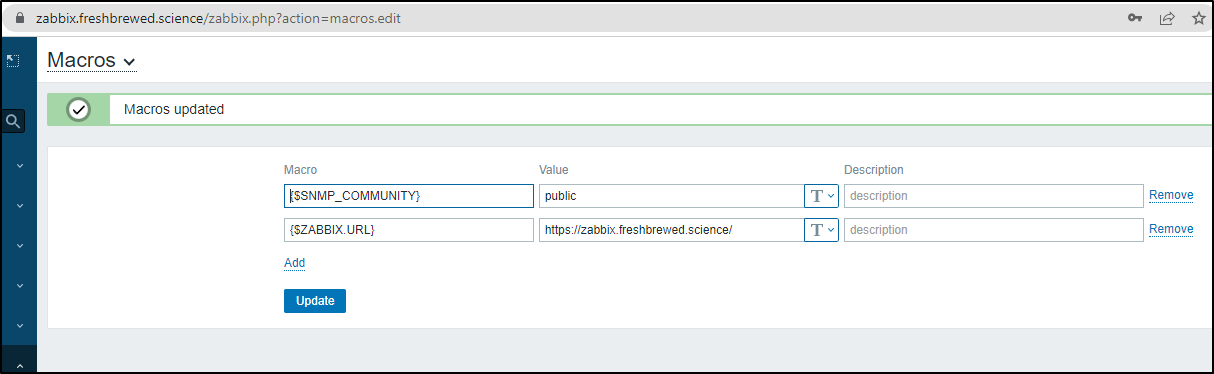
Before we add the Zabbix PD integration, we need to add a “ZABBIX.URL” macro.
Go to Administration/General/Macros
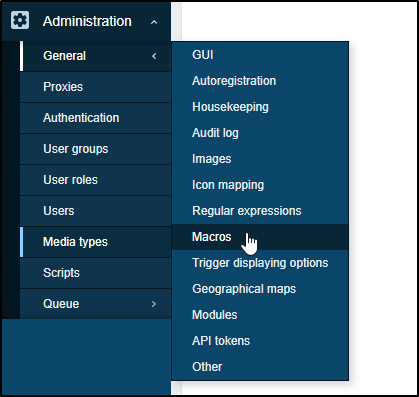
and I’ll add {$ZABBIX.URL} to the value of my Front end URL. That could be HTTPS or something like http://192.168.1.123:8888 depending on your setup.
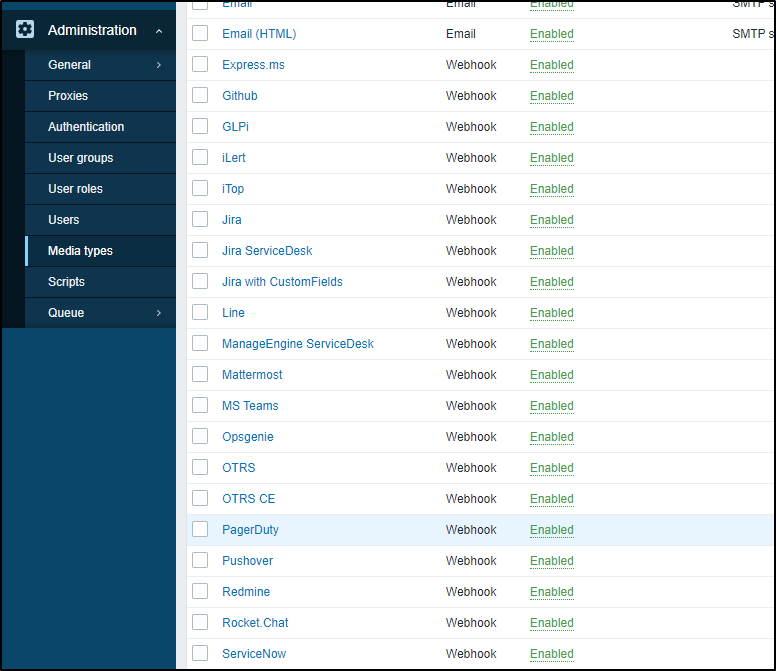
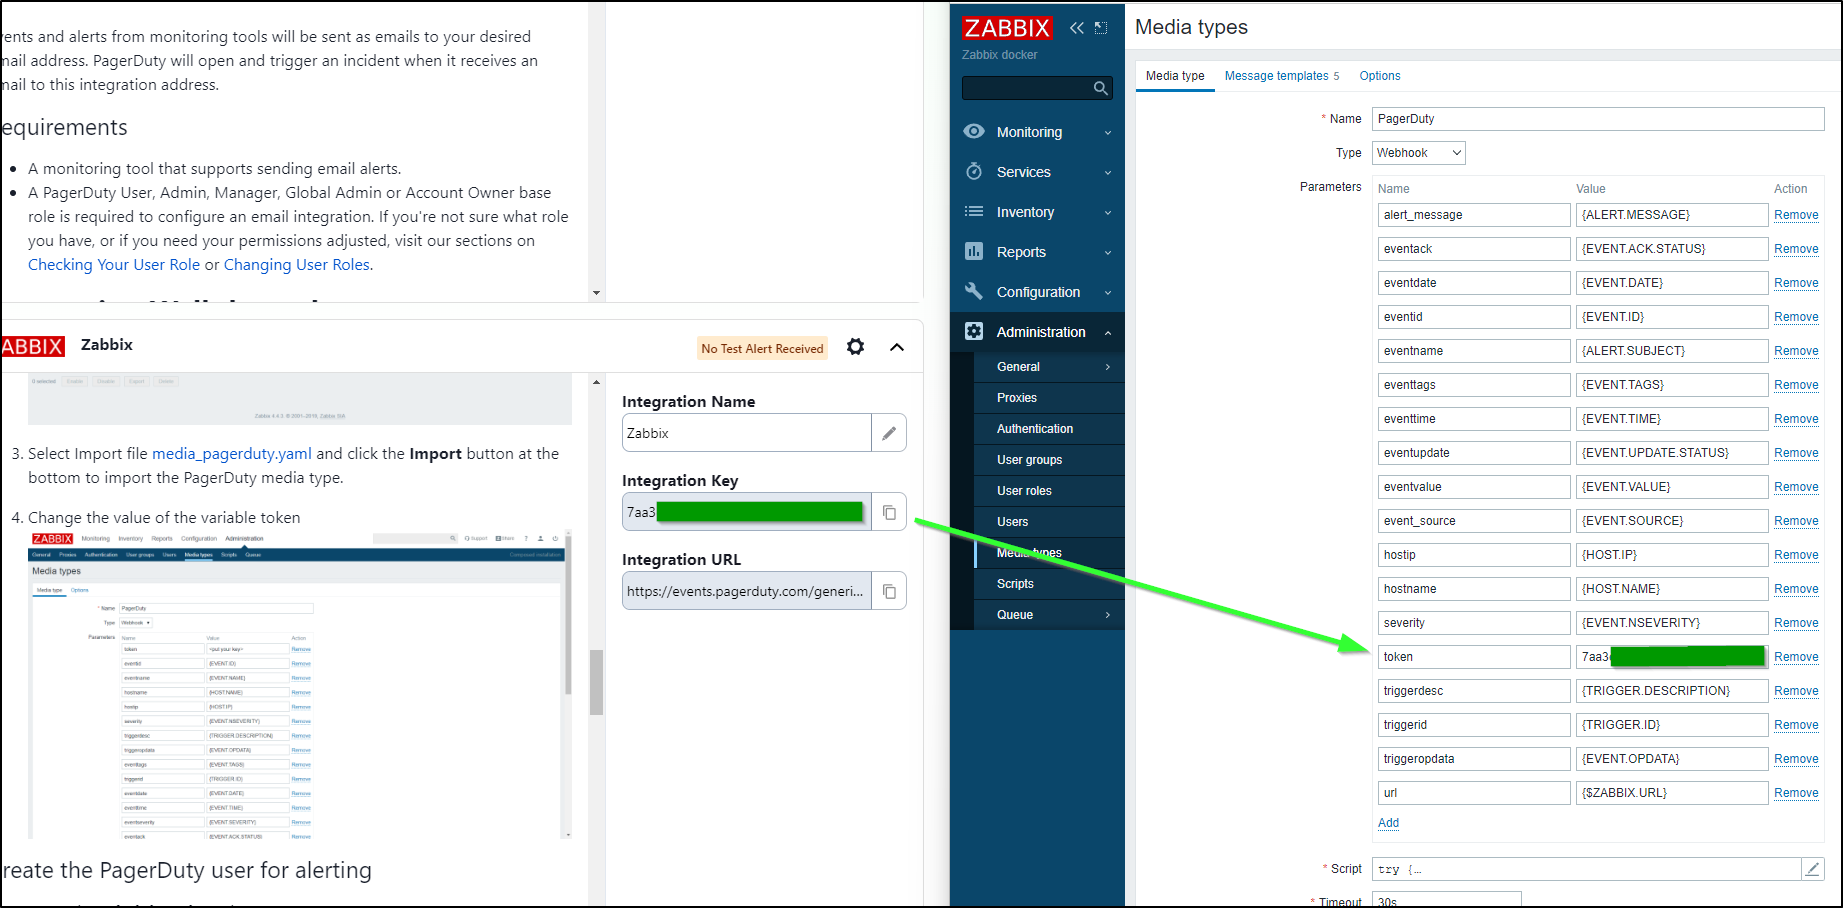
Next, we go to Administration/Media Types and click on PagerDuty. If you don’t have it, you can get the file here to import.
Next, I’ll copy the “Integration Key” into the “Token” variable
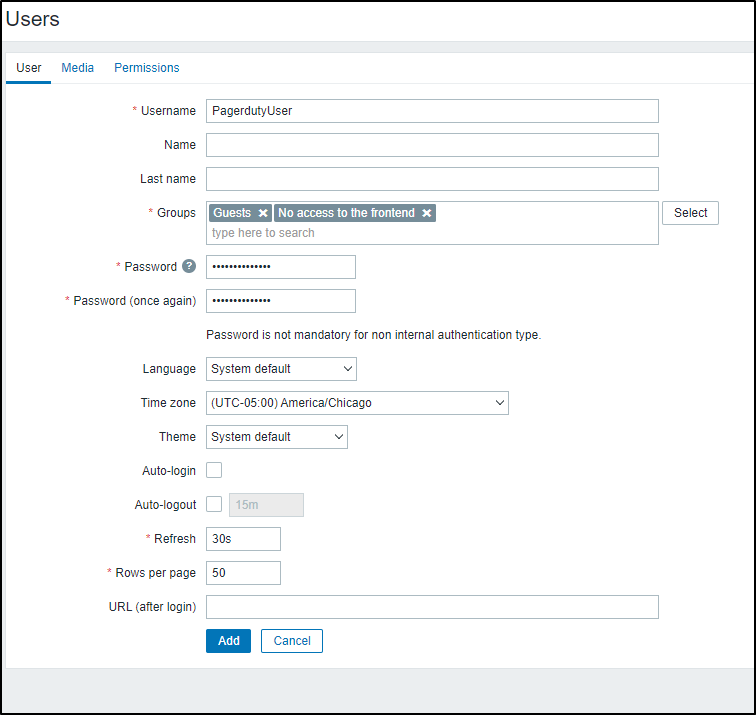
While I could add PD to my one Admin user, I’ll create a new “Pagerduty User” just for PD alerts.
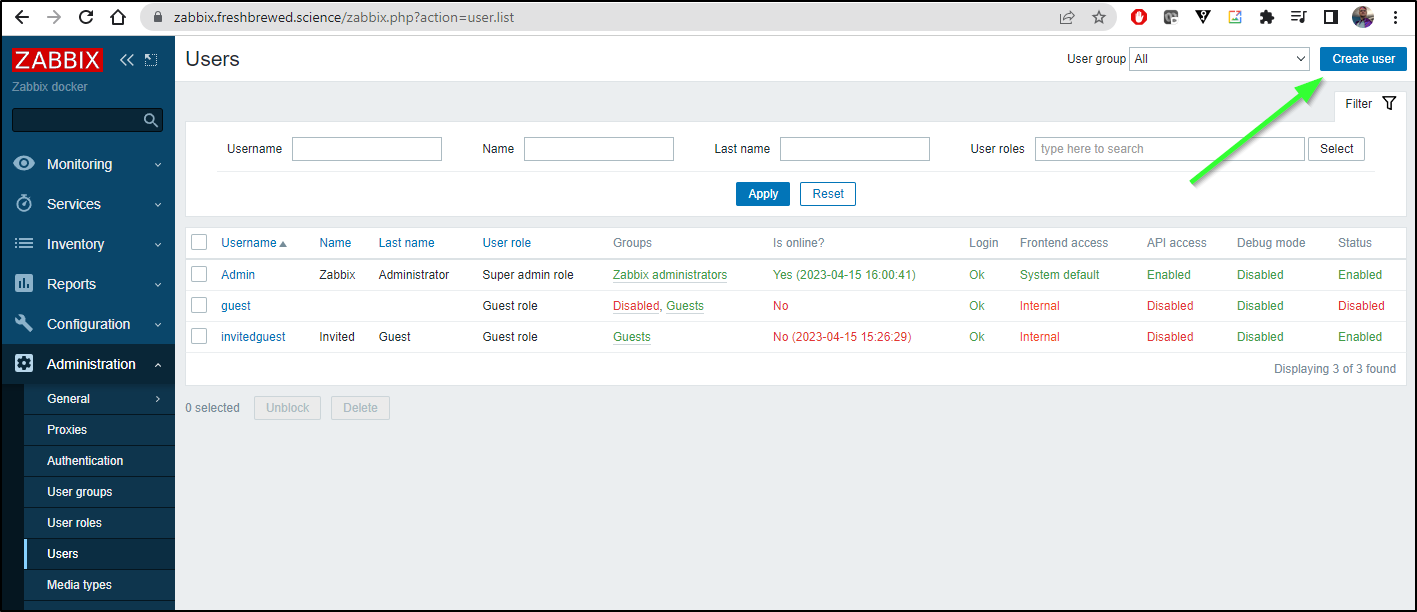
I’ll add to “Guests” (so it can view things) and to “No Access to the Frontend” to ensure it is just for API calls
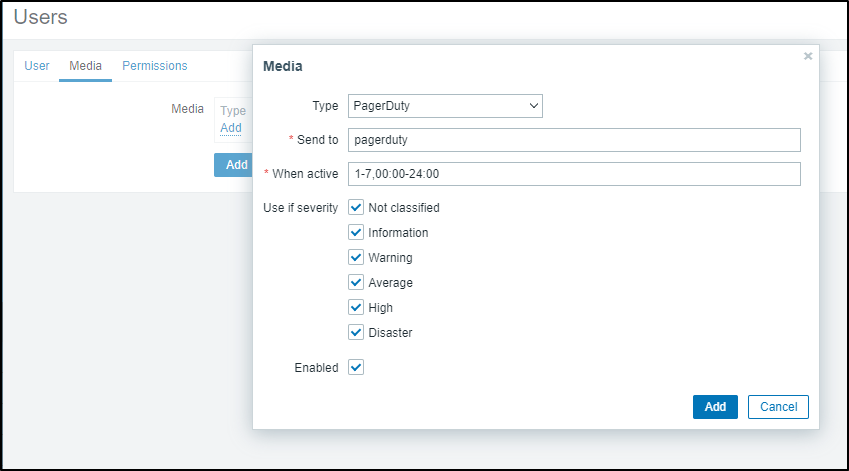
In Media Types, we’ll add Pagerduty. The “Send to” is not used, but is required to be set to something.
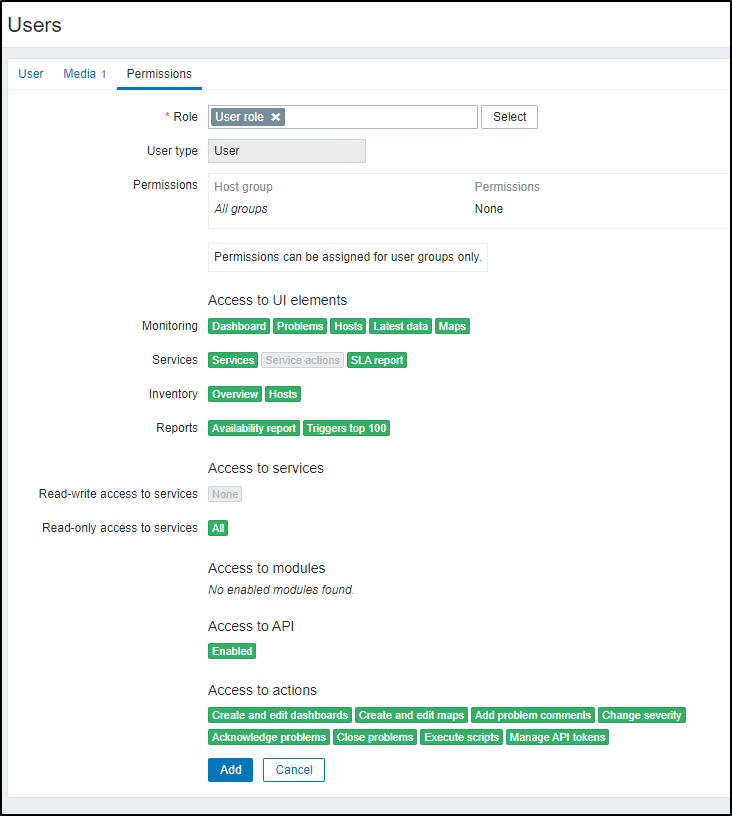
Lastly, I’ll set the role to “User” so it can view things
As I mentioned in the prior section, I’ll move the Pagerduty email to this user as well (for reports)
Github
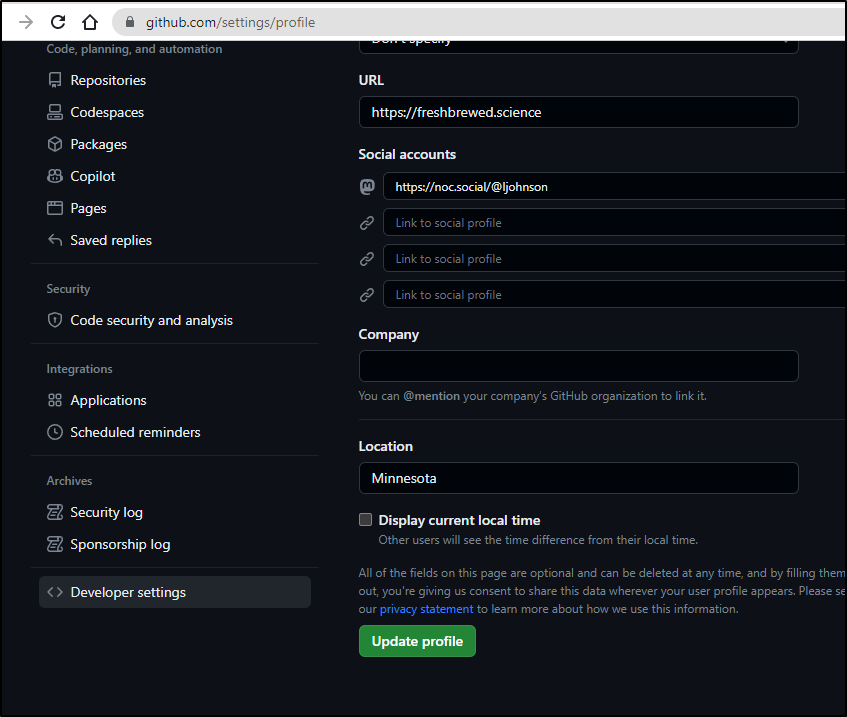
In the “Github” Media Type, we need to set a Github Token (Usually start with GHP_)
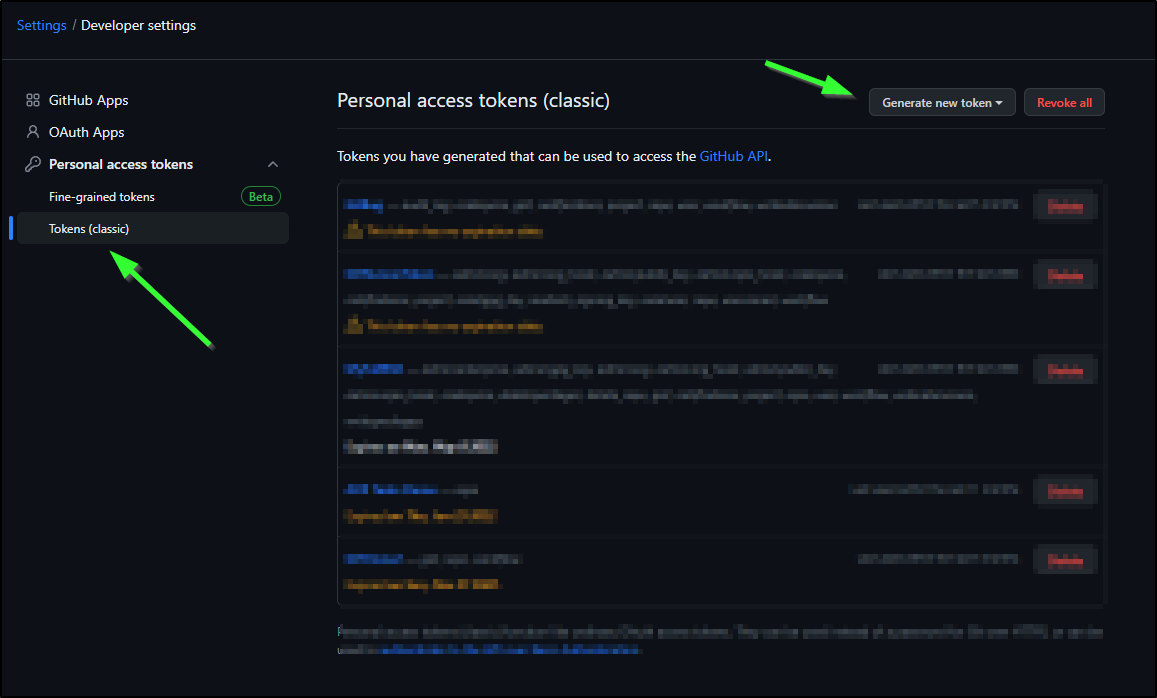
You can create a PAT in Settings, Developer Settings for your Github user
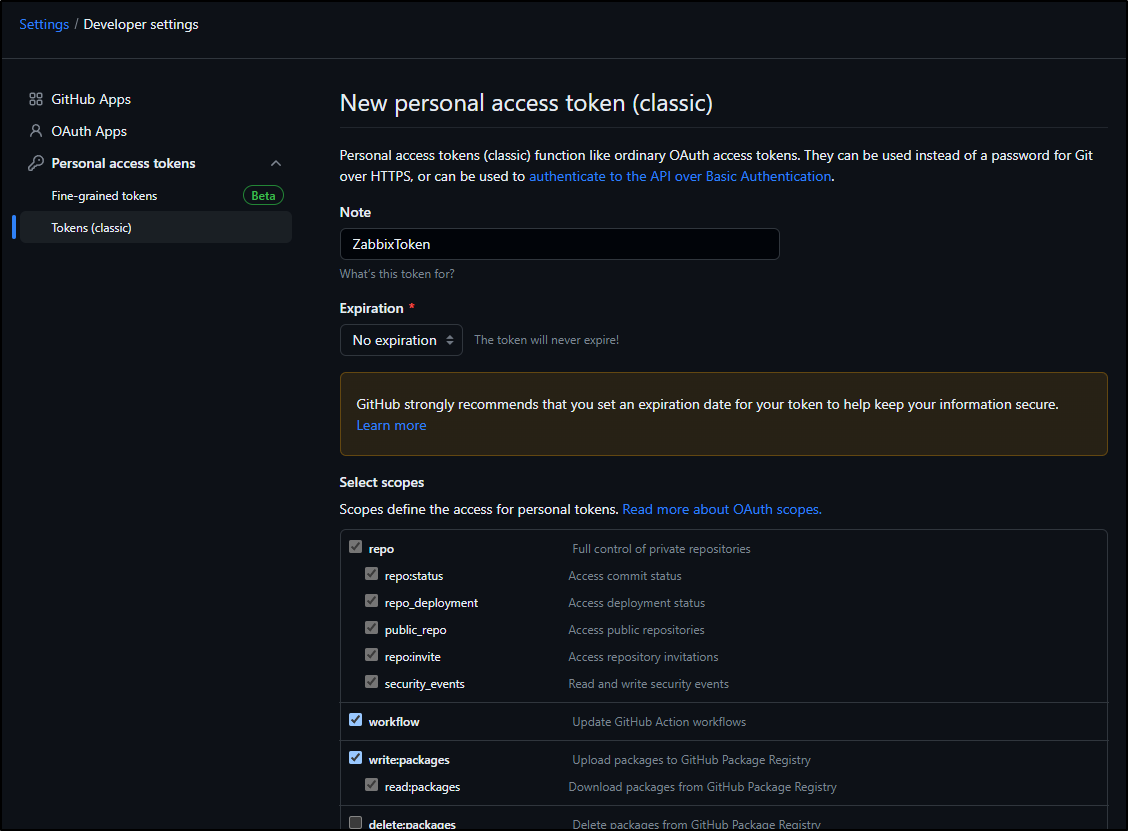
Here we can create a new Classic token
I gave it a lot of read and write perms, but not delete
When saved, you’ll see the token displayed once.
In Zabbix, Administration/Media Types/Github we can set the Token there
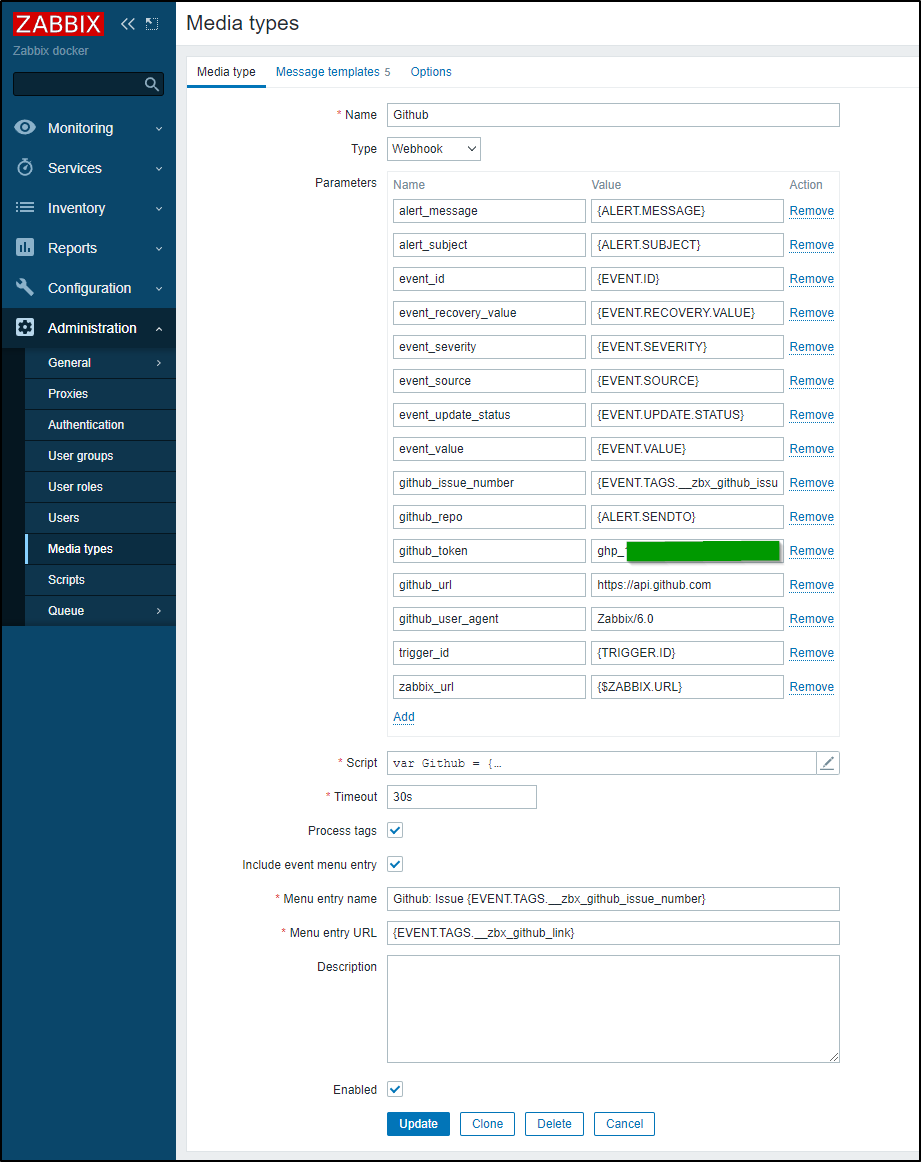
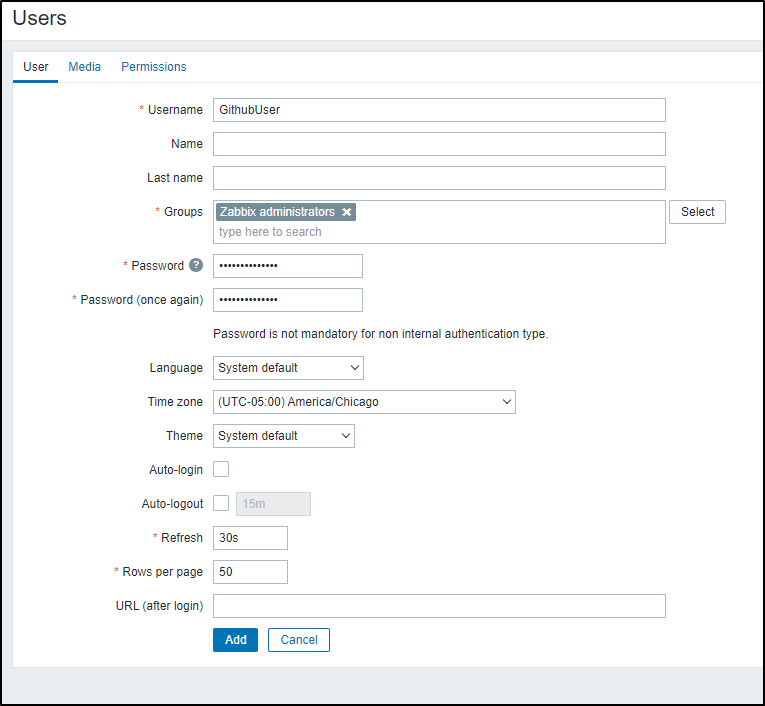
I’ll then create a Github User in the Users area
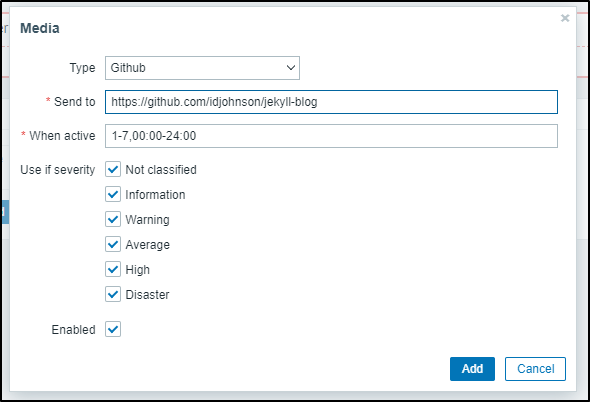
The “Send to” is our Github Repo where Issues will be created
Defaults
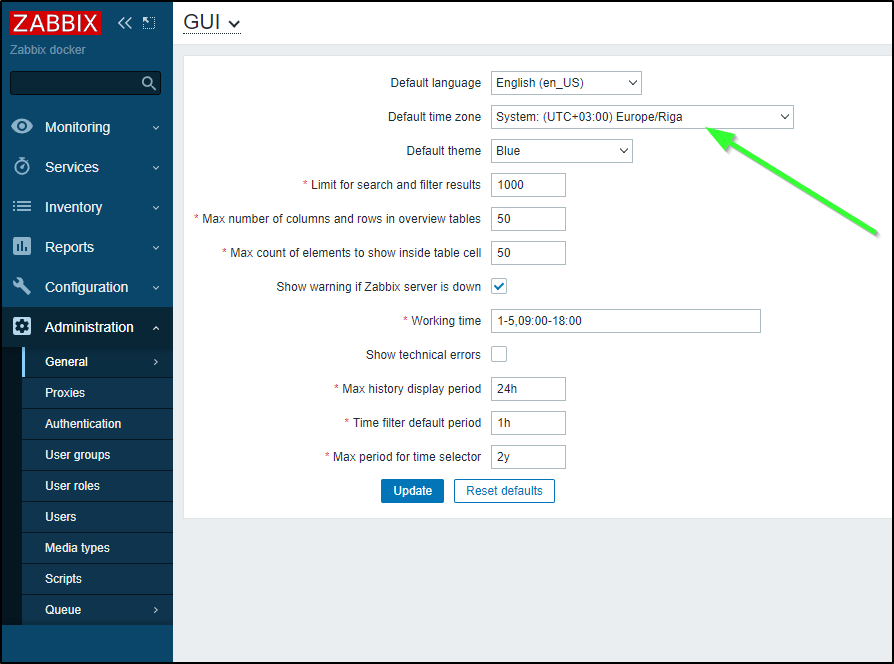
One thing I had to keep doing in my rules was to set the time. If you want to stop messing with that, go to Administration/General and change the default time zone from Riga, Latvia
I also wanted to tweak the Dashboard.
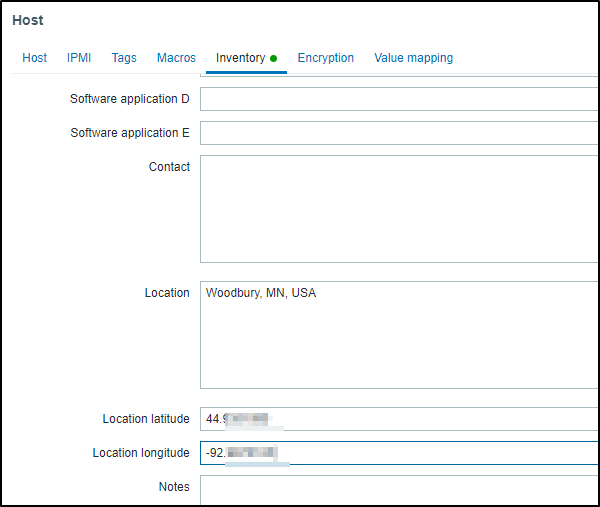
I made sure at least one host had a Lat/Long
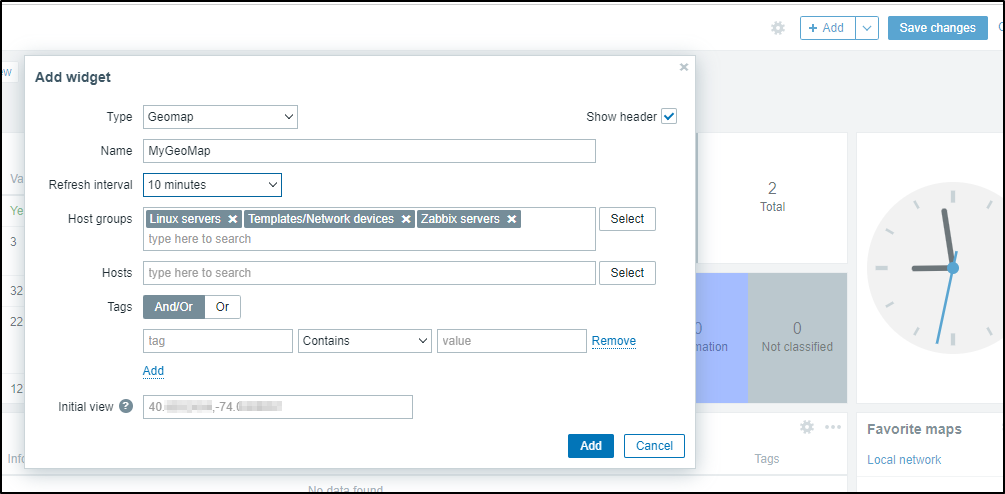
Then on the main dashboard, I clicked Edit and “+ Add” to add a widget. There I used type “Geomap”
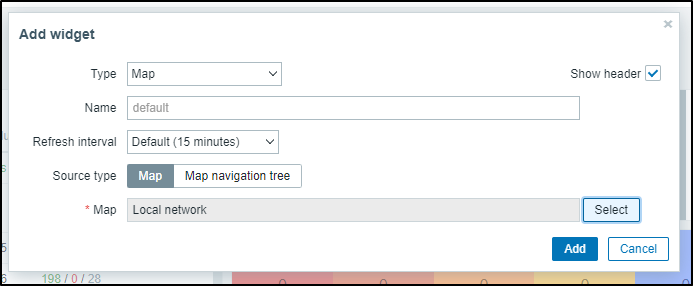
I’ll also add a Map for the Local Network
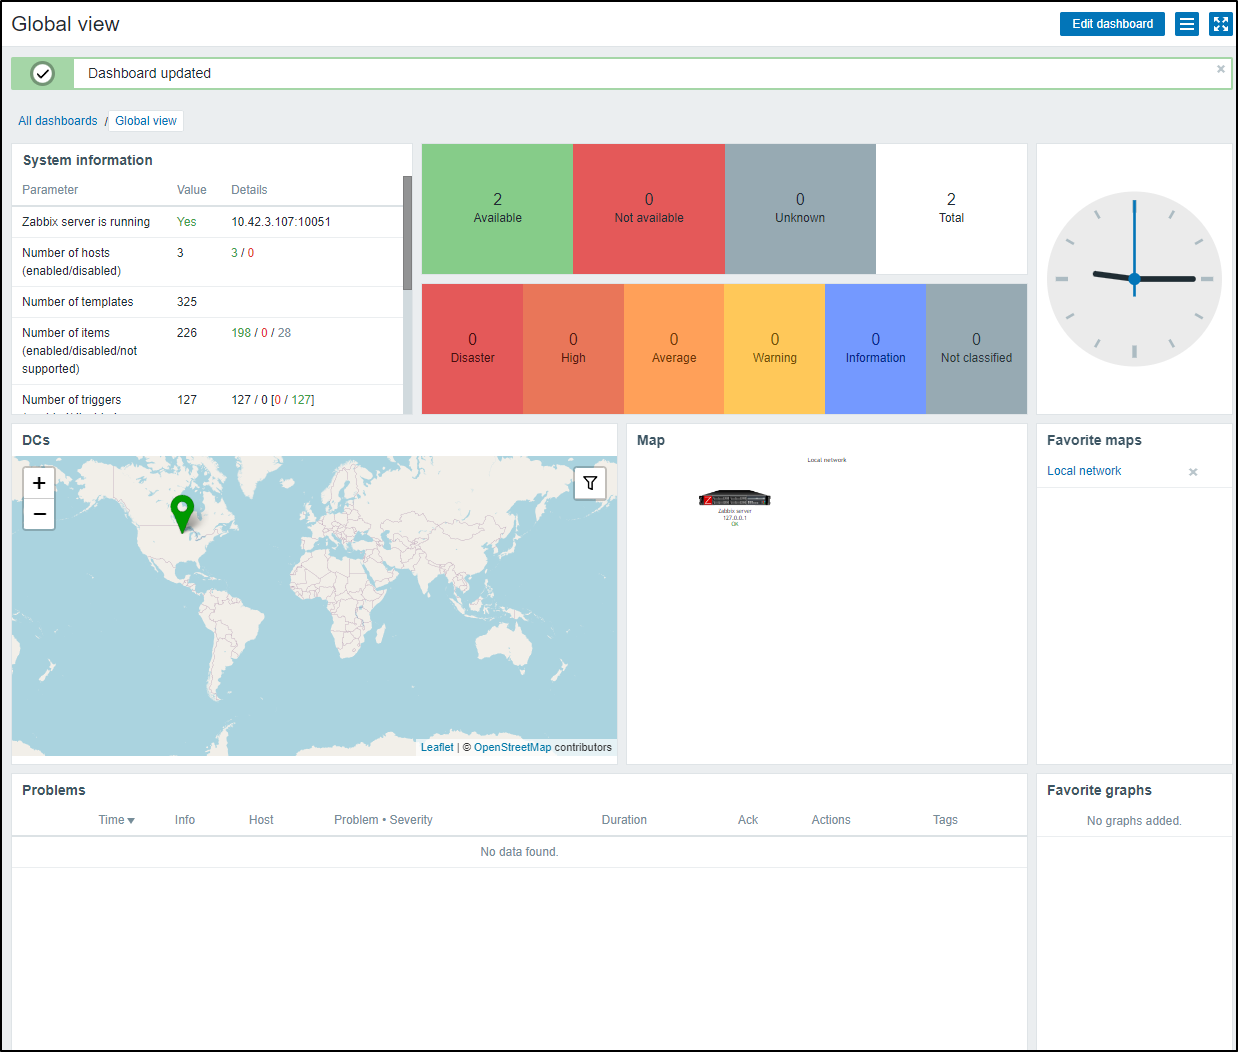
When saved, I now have a Dashboard with hosts and maps
Alternatively, you can just change the Timezone for your user and leave the system default alone (I did this as I found changing the System Timezone away from Riga then broke auto-discovery)
API
The REST API is fairly easy with which to engage.
We can check our version without auth
$ curl --request POST --url 'https://zabbix.freshbrewed.science/api_jsonrpc.php' --header 'Content-Type: application/json-rpc' --data '{"jsonrpc":"2.0","method":"apiinfo.version","params":{},"id":1}' && echo
{"jsonrpc":"2.0","result":"6.0.13","id":1}
Or if you are port-forwarding to the local instance
$ curl --request POST --url 'http://localhost:8888/api_jsonrpc.php' --header 'Content-Type: application/json-rpc' --data '{"jsonrpc":"2.0","method":"apiinfo.version","params":{},"id":1}' && echo {"jsonrpc":"2.0","result":"6.0.13","id":1}
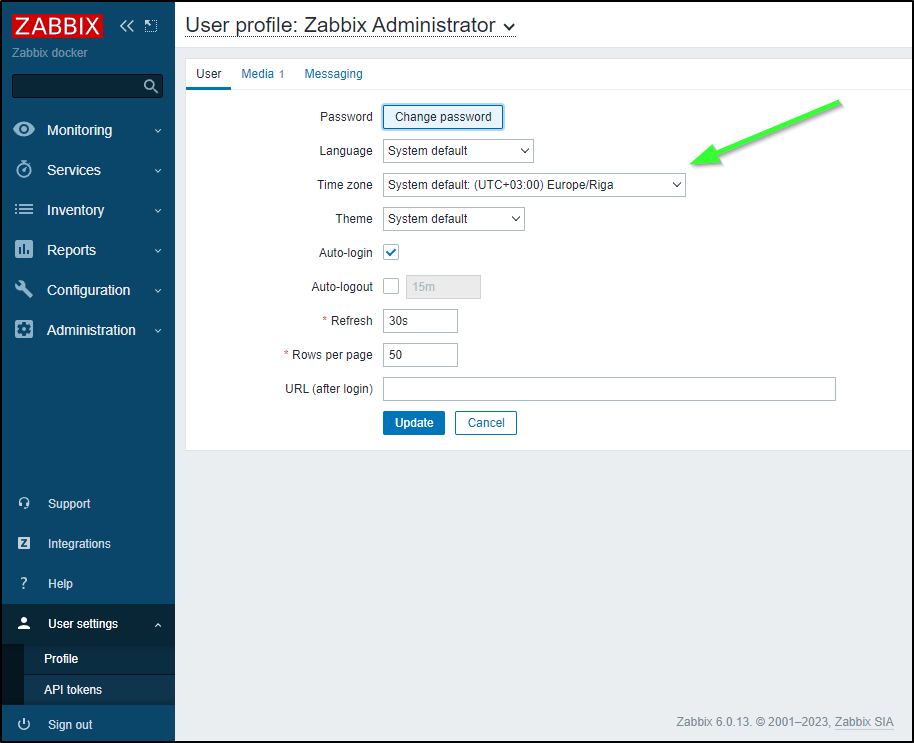
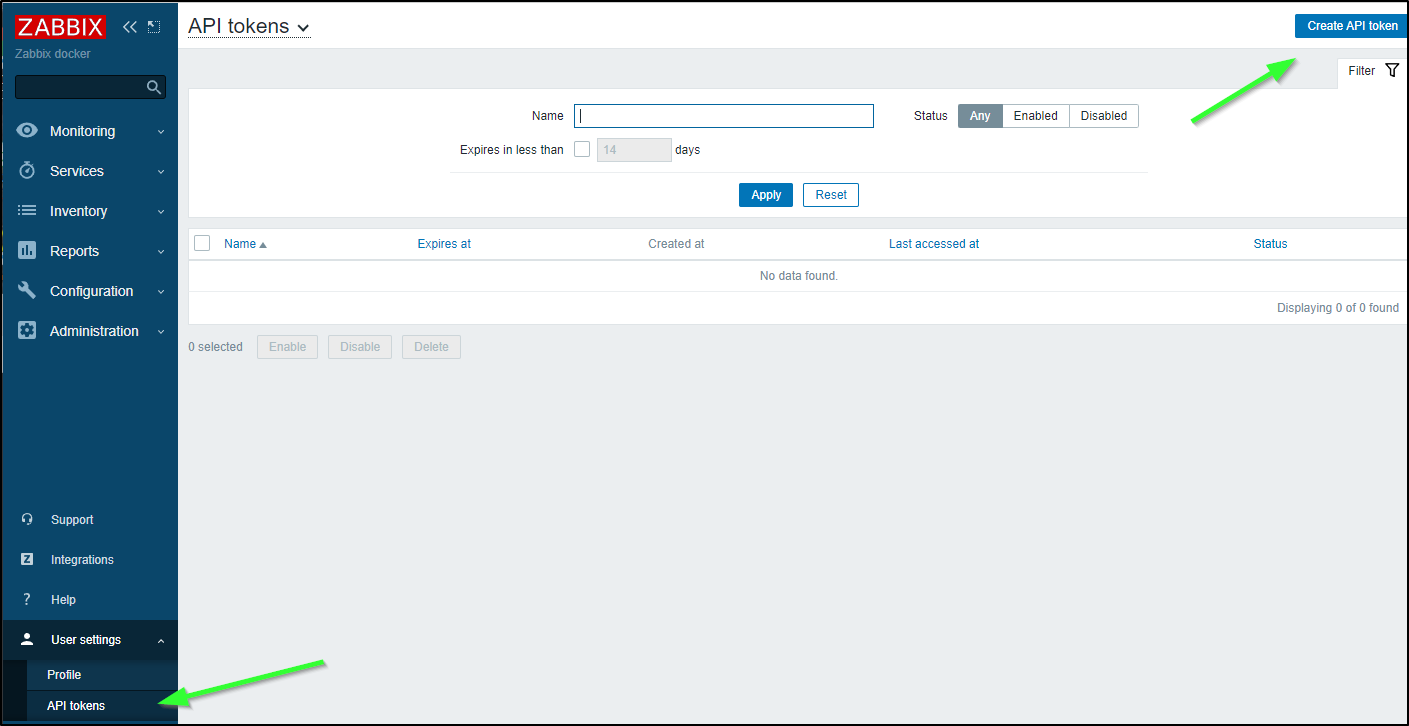
If we want to do anything interesting, we’ll need an API token.
We can get to that under User Settings/API Tokens, then clicking “Create API Token”
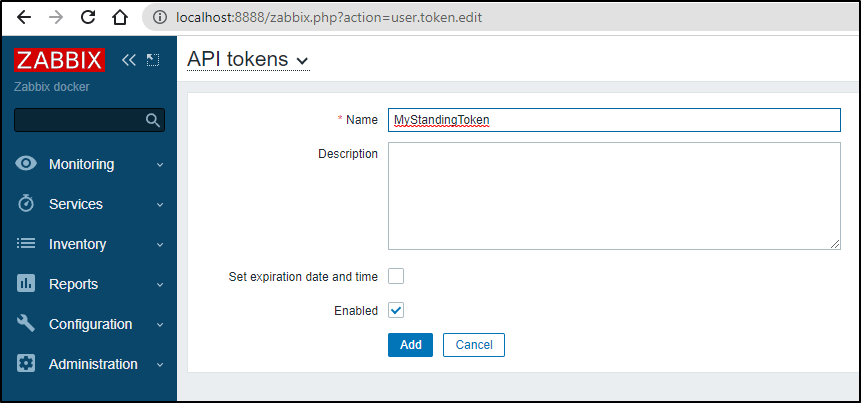
Since this is a test instance, I’ll not use Token Expiration and give it a name, then click “Add”
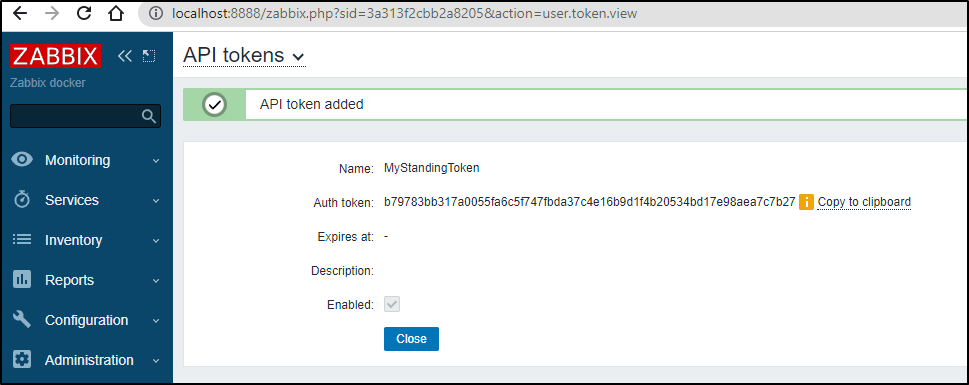
I now have an API Token we’ll use in a moment (b79783bb317a0055fa6c5f747fbda37c4e16b9d1f4b20534bd17e98aea7c7b27)
We can now use that API token for the “auth” block in our payload
$ curl --request POST --url 'http://localhost:8888/api_jsonrpc.php' --header 'Content-Type: application/json-rpc' --data '{ "jsonrpc": "2.0", "method": "host.get", "params": { "output": [     "hostid", "host" ], "selectInterfaces": [ "interfaceid", "ip" ] }, "auth": "b79783bb317a0055fa6c5f747fbda37c4e16b9d1f4b20534bd17e98aea7c7b27",  "id": 2 }' && echo
{"jsonrpc":"2.0","result":[{"hostid":"10084","host":"Zabbix server","interfaces":[{"interfaceid":"1","ip":"127.0.0.1"}]},{"hostid":"10559","host":"sassynassy","interfaces":[{"interfaceid":"15","ip":"192.168.1.129"}]},{"hostid":"10560","host":"vote-front-azure-vote-1678278477-67bb8bb55c-k9cxj","interfaces":[{"interfaceid":"16","ip":"10.42.2.13"}]}],"id":2}
In future versions, this will move to Bearer token as we see in the API Documentation
However, in all my testing, at least for the version I’m running (6.0.13), it does not seem to work
$ curl --request POST --url 'http://localhost:8888/api_jsonrpc.php' --header 'Content-Type: application/json-rpc' --header 'Authorization: Bearer b79783bb317a0055fa6c5f747fbda37c4e16b9d1f4b20534bd17e98aea7c7b27' --data '{ "jsonrpc": "2.0", "method": "host.get", "params": { "output": [     "hostid", "host" ], "selectInterfaces": [ "interfaceid", "ip" ] }, "id": 2 }' && echo
{"jsonrpc":"2.0","error":{"code":-32602,"message":"Invalid params.","data":"Not authorized."},"id":2}
After googling a lot to see if I’m missing some part of the flow, ChatGPT confirmed the way I was try to use it:
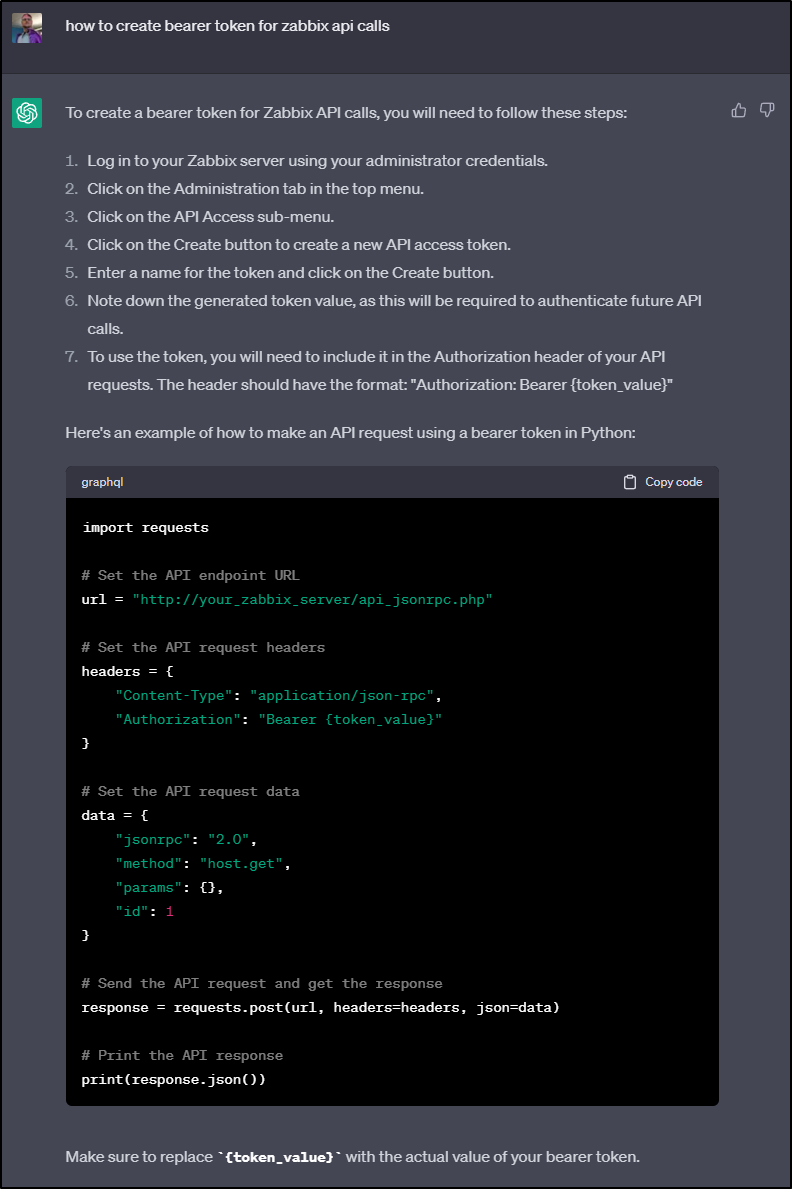
import requests

# Set the API endpoint URL
url = "http://your_zabbix_server/api_jsonrpc.php"

# Set the API request headers
headers = {
    "Content-Type": "application/json-rpc",
    "Authorization": "Bearer {token_value}"
}

# Set the API request data
data = {
    "jsonrpc": "2.0",
    "method": "host.get",
    "params": {},
    "id": 1
}

# Send the API request and get the response
response = requests.post(url, headers=headers, json=data)

# Print the API response
print(response.json())
Using API
We can get a list of hosts, for instance:
$ cat data.json
{
    "jsonrpc": "2.0",
    "method": "hostgroup.get",
    "params": {
        "output": "extend",
        "filter": {
            "name": [
                "Zabbix servers",
                "Linux servers"
            ]
        }
    },
    "auth": "b79783bb317a0055fa6c5f747fbda37c4e16b9d1f4b20534bd17e98aea7c7b27",
    "id": 1
}
And see the results
$ curl --request POST --url 'http://localhost:8888/api_jsonrpc.php' --header 'Content-Type: application/json-rpc' --data @data.json | jq
  % Total    % Received % Xferd  Average Speed   Time    Time     Time  Current
                                 Dload  Upload   Total   Spent    Left  Speed
100   569    0   252  100   317   1737   2186 --:--:-- --:--:-- --:--:--  3924
{
  "jsonrpc": "2.0",
  "result": [
    {
      "groupid": "2",
      "name": "Linux servers",
      "internal": "0",
      "flags": "0",
      "uuid": "dc579cd7a1a34222933f24f52a68bcd8"
    },
    {
      "groupid": "4",
      "name": "Zabbix servers",
      "internal": "0",
      "flags": "0",
      "uuid": "6f6799aa69e844b4b3918f779f2abf08"
    }
  ],
  "id": 1
}
I can see some real discovered hosts using my production endpoint
$ cat data2.json
{
    "jsonrpc": "2.0",
    "method": "dhost.get",
    "params": {
        "output": "extend",
        "selectDServices": "extend",
        "druleids": "2"
    },
    "auth": "asdfasdfasdfasdfasdfasdfasdfasdfasdfsadfasdfasdfb",
    "id": 1
}
and Using
builder@DESKTOP-QADGF36:/mnt/c/Users/isaac/Downloads/zabbix-master@89a9e3ebe91$ curl --request POST --url 'https://zabbix.freshbrewed.science/api_jsonrpc.php' --header 'Content-Type: application/json-rpc' --data @data2.json | jq
  % Total    % Received % Xferd  Average Speed   Time    Time     Time  Current
                                 Dload  Upload   Total   Spent    Left  Speed
100  4476    0  4230  100   246  16145    938 --:--:-- --:--:-- --:--:-- 17019
{
  "jsonrpc": "2.0",
  "result": [
    {
      "dhostid": "97",
      "druleid": "2",
      "status": "0",
      "lastup": "1681733022",
      "lastdown": "0",
      "dservices": [
        {
          "dserviceid": "97",
          "dhostid": "97",
          "value": "",
          "port": "22",
          "status": "0",
          "lastup": "1681733022",
          "lastdown": "0",
          "dcheckid": "8",
          "ip": "192.168.1.11",
          "dns": "retropie"
        }
      ]
    },
    {
      "dhostid": "98",
      "druleid": "2",
      "status": "0",
      "lastup": "1681733023",
      "lastdown": "0",
      "dservices": [
        {
          "dserviceid": "98",
          "dhostid": "98",
          "value": "",
          "port": "22",
          "status": "0",
          "lastup": "1681733023",
          "lastdown": "0",
          "dcheckid": "8",
          "ip": "192.168.1.12",
          "dns": ""
        }
      ]
    },

    ... snip ...
  ],
  "id": 1
}
We can feed this to jq to get just IPs or just DNS names
$ curl --request POST --url 'https://zabbix.freshbrewed.science/api_jsonrpc.php' --header 'Content-Type: application/json-rpc' --data @data2.json | jq '.result[] | .dservices[] | .dns'
  % Total    % Received % Xferd  Average Speed   Time    Time     Time  Current
                                 Dload  Upload   Total   Spent    Left  Speed
100  4476    0  4230  100   246  24736   1438 --:--:-- --:--:-- --:--:-- 26175
"retropie"
""
"builder-HP-EliteBook-745-G5"
"builder-hp-elitebook-850-g1"
"hp-hp-elitebook-850-g2"
""
"isaac-macbookair"
""
"anna-MacBookAir"
"raspberrypi"
"SassyNassy"
"builder-MacBookPro2"
""
"isaac-MacBookPro"
"builder-hp-elitebook-850-g2"
""
My next steps will likely be to write a bridge that will take the Discovered hosts and add them to my hosts (using host.create). This is because I cannot seem to get the already discovered hosts to re-trigger discovery rules, thus those that were found before I added “create host” to my discovery trigger are rather hung in Limbo.
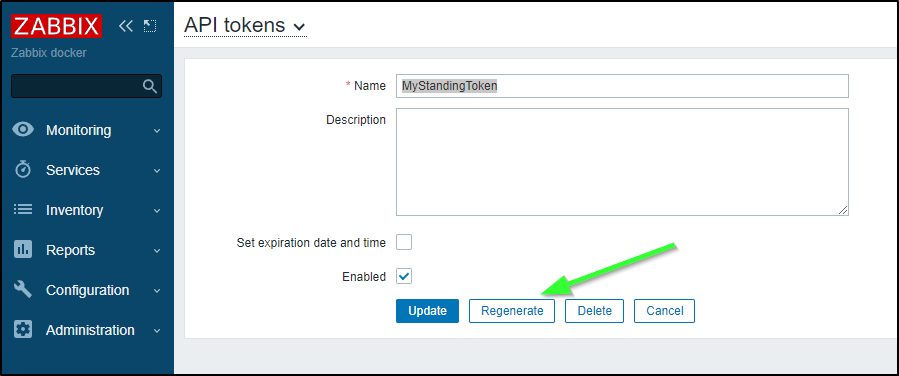
Changing, Disabling, and Deleting Tokens
If one comprimises an API token (say they paste it in a blog), one can rotate it via the API menu:
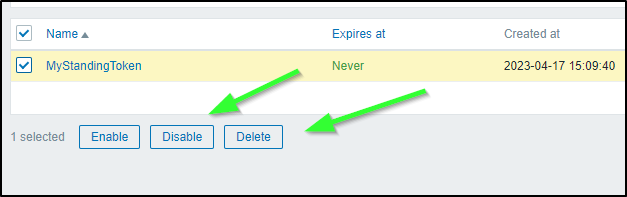
One can also delete or disable via the API tokens menu as well
Summary
Today we setup Zabbix in Kubernetes running in an on-prem K3s cluster. We exposed it to outside traffic using an NGinx ingress controller and LetsEncrypt certs via cert-manager. We then secured it and set the basic settings (like on-prem CIDRs and Timezones). We explored adding hosts, auto-discovery, Sendgrid setup and Pagerduty/Github integrations. We wrapped by touching on using the REST API backend.
There is more, much much more, to do with Zabbix. I have more ideas like getting the Github Issue integration working (or using JIRA), setting up more monitors (like web and synthetic tests) and configuring more usable alerts.
I think Zabbix is a pretty slick, albeit old, tool for monitoring things. One really gets a lot for free out of the box, provided one wants to invest the time in configuring. I think that is were the Zabbix paid-implementation add-ons make sense. Arguably it was the model that Sun tried to pursue with Java - make the money on certifications and professional services.
There is a subtle challenge, however, in a system where the orchestrator calls out - it means to monitor ‘things’ our Zabbix server fundamentally needs some form of network access to the ‘thing’ to which it wants to monitor. If we think about all other systems out there, the destinations, in general, have monitors that call back out to the orchestrator. That means that APM suites like Datadog, New Relic, Dynatrace, Mezmo, Sumo Logic, etc all have local agents that send collected data up to the collectors. Here we have a system that scans and asks an agent for data.
In a way, that isn’t bad - it puts the burden on the main Zabbix instance, not the collector. But then there is a time shift on data and (possibly) the delay in adding host. I plan to explore that in a future article (could we not use the REST API to ‘self-register’ newly created hosts? seems a job for a provisioner).