Published: Jan 27, 2023 by Isaac Johnson
As I alluded to in my last post, problems happen. In my case, my network starting getting flaky so I rebooted the Wi-Fi router. During this time, I discovered my master/primary K3s node lost its lease on the IP and changed on a reboot. This caused endless downstream issues as it not only served as the primary HTTPS endpoint for my NGinx Ingress Controller (and thus exposed globally), but it meant all the worker nodes couldn’t connect. Lastly, I had always assumed it was the safest host to hold the Harbor PostgreSQL database. When it changed, even when I reattached workers, Harbor couldn’t get to its database.
Harbor and Postgres
My first check was to see if I did any damage to the database.
I logged in directly using psql
$ psql postgresql://harbor:MYPASSWORD@192.168.1.78/postgres
psql (12.12 (Ubuntu 12.12-0ubuntu0.20.04.1))
SSL connection (protocol: TLSv1.3, cipher: TLS_AES_256_GCM_SHA384, bits: 256, compression: off)
Type "help" for help.

postgres=# \l
                                    List of databases
     Name      |  Owner   | Encoding |   Collate   |    Ctype    |   Access privileges
---------------+----------+----------+-------------+-------------+-----------------------
 notary_server | postgres | UTF8     | en_US.UTF-8 | en_US.UTF-8 | =Tc/postgres         +
               |          |          |             |             | postgres=CTc/postgres+
               |          |          |             |             | harbor=CTc/postgres  +
               |          |          |             |             | instana=c/postgres
 notary_signer | postgres | UTF8     | en_US.UTF-8 | en_US.UTF-8 | =Tc/postgres         +
               |          |          |             |             | postgres=CTc/postgres+
               |          |          |             |             | harbor=CTc/postgres  +
               |          |          |             |             | instana=c/postgres
 postgres      | postgres | UTF8     | en_US.UTF-8 | en_US.UTF-8 | =Tc/postgres         +
               |          |          |             |             | postgres=CTc/postgres+
               |          |          |             |             | instana=CTc/postgres
 registry      | postgres | UTF8     | en_US.UTF-8 | en_US.UTF-8 | =Tc/postgres         +
               |          |          |             |             | postgres=CTc/postgres+
               |          |          |             |             | harbor=CTc/postgres  +
               |          |          |             |             | instana=c/postgres
 template0     | postgres | UTF8     | en_US.UTF-8 | en_US.UTF-8 | =c/postgres          +
               |          |          |             |             | postgres=CTc/postgres+
               |          |          |             |             | instana=c/postgres
 template1     | postgres | UTF8     | en_US.UTF-8 | en_US.UTF-8 | =c/postgres          +
               |          |          |             |             | postgres=CTc/postgres+
               |          |          |             |             | instana=c/postgres
(6 rows)
Now that I see the databases are still present, I’m guessing a quick fix on the harbor chart will sort me out
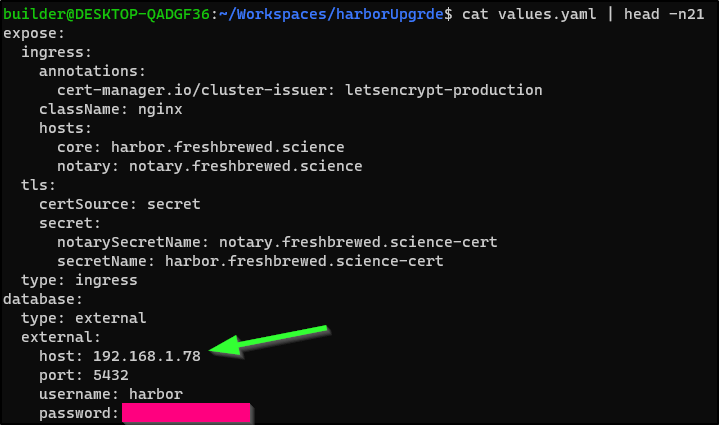
I just updated the values.yaml to use “192.168.1.78” instead of “192.168.1.77” and upgraded
$ helm upgrade -f values.yaml harbor-registry2 ./harbor
Release "harbor-registry2" has been upgraded. Happy Helming!
NAME: harbor-registry2
LAST DEPLOYED: Wed Jan 25 08:23:10 2023
NAMESPACE: default
STATUS: deployed
REVISION: 2
TEST SUITE: None
NOTES:
Please wait for several minutes for Harbor deployment to complete.
Then you should be able to visit the Harbor portal at https://harbor.freshbrewed.science
For more details, please visit https://github.com/goharbor/harbor
Some pods hung on the upgrade and I had to cycle them to get them to come back
$ kubectl delete pod harbor-registry2-core-6bd7984ffb-zzz74 & kubectl delete pod harbor-registry2-core-75b8d6b5d8-cc6bk &
[1] 19047
[2] 19048
$ kubectl delete  pod "harbor-registry2-core-75b8d6b5d8-cc6bk" deleted
pod "harbor-registry2-core-6bd7984ffb-zzz74" deleted
$ kubectl get pods | grep harbor
harbor-registry2-portal-7878768b86-r9qgw                 1/1     Running             92 (157m ago)    86d
harbor-registry2-registry-78fd5b8f56-fgnn7               2/2     Running             198 (157m ago)   86d
harbor-registry2-trivy-0                                 1/1     Running             0                77m
harbor-registry2-redis-0                                 1/1     Running             0                77m
harbor-registry2-notary-server-6b4b47bb86-vzz6f          0/1     ContainerCreating   0                71m
harbor-registry2-exporter-648f957c7c-jdfw7               0/1     ContainerCreating   0                71m
harbor-registry2-jobservice-57bfcc8bc8-wndc9             0/1     ContainerCreating   0                71m
harbor-registry2-notary-server-58756765d-q5gm9           0/1     ContainerCreating   0                61m
harbor-registry2-registry-d887cbd98-tsskv                0/2     ContainerCreating   0                61m
harbor-registry2-chartmuseum-6f8c4dd89f-4f52d            1/1     Running             0                61m
harbor-registry2-notary-signer-b5fff86f7-jq9l2           1/1     Running             0                61m
harbor-registry2-jobservice-865f8f8b67-dnrpf             0/1     CrashLoopBackOff    15 (2m5s ago)    61m
harbor-registry2-core-75b8d6b5d8-8hw59                   1/1     Running             0                28s

$ kubectl get pods | grep harbor
harbor-registry2-portal-7878768b86-r9qgw                 1/1     Running             92 (159m ago)    86d
harbor-registry2-registry-78fd5b8f56-fgnn7               2/2     Running             198 (159m ago)   86d
harbor-registry2-trivy-0                                 1/1     Running             0                79m
harbor-registry2-redis-0                                 1/1     Running             0                78m
harbor-registry2-registry-d887cbd98-tsskv                0/2     ContainerCreating   0                63m
harbor-registry2-chartmuseum-6f8c4dd89f-4f52d            1/1     Running             0                63m
harbor-registry2-notary-signer-b5fff86f7-jq9l2           1/1     Running             0                63m
harbor-registry2-core-75b8d6b5d8-8hw59                   1/1     Running             0                2m13s
harbor-registry2-notary-server-58756765d-vt544           1/1     Running             0                80s
harbor-registry2-jobservice-57bfcc8bc8-fdnrf             0/1     Running             0                18s
harbor-registry2-jobservice-865f8f8b67-5t8lq             0/1     Running             0                18s
harbor-registry2-exporter-648f957c7c-8fzzr               0/1     Running             0                18s

$ kubectl get pods | grep harbor
harbor-registry2-portal-7878768b86-r9qgw                 1/1     Running             92 (161m ago)    86d
harbor-registry2-trivy-0                                 1/1     Running             0                81m
harbor-registry2-redis-0                                 1/1     Running             0                80m
harbor-registry2-chartmuseum-6f8c4dd89f-4f52d            1/1     Running             0                64m
harbor-registry2-notary-signer-b5fff86f7-jq9l2           1/1     Running             0                64m
harbor-registry2-core-75b8d6b5d8-8hw59                   1/1     Running             0                4m7s
harbor-registry2-notary-server-58756765d-vt544           1/1     Running             0                3m14s
harbor-registry2-jobservice-865f8f8b67-5t8lq             1/1     Running             0                2m12s
harbor-registry2-exporter-648f957c7c-8fzzr               1/1     Running             0                2m12s
harbor-registry2-registry-d887cbd98-cgkdd                2/2     Running             0                96s
harbor-registry2-registry-78fd5b8f56-fgnn7               0/2     Terminating         198 (161m ago)   86d
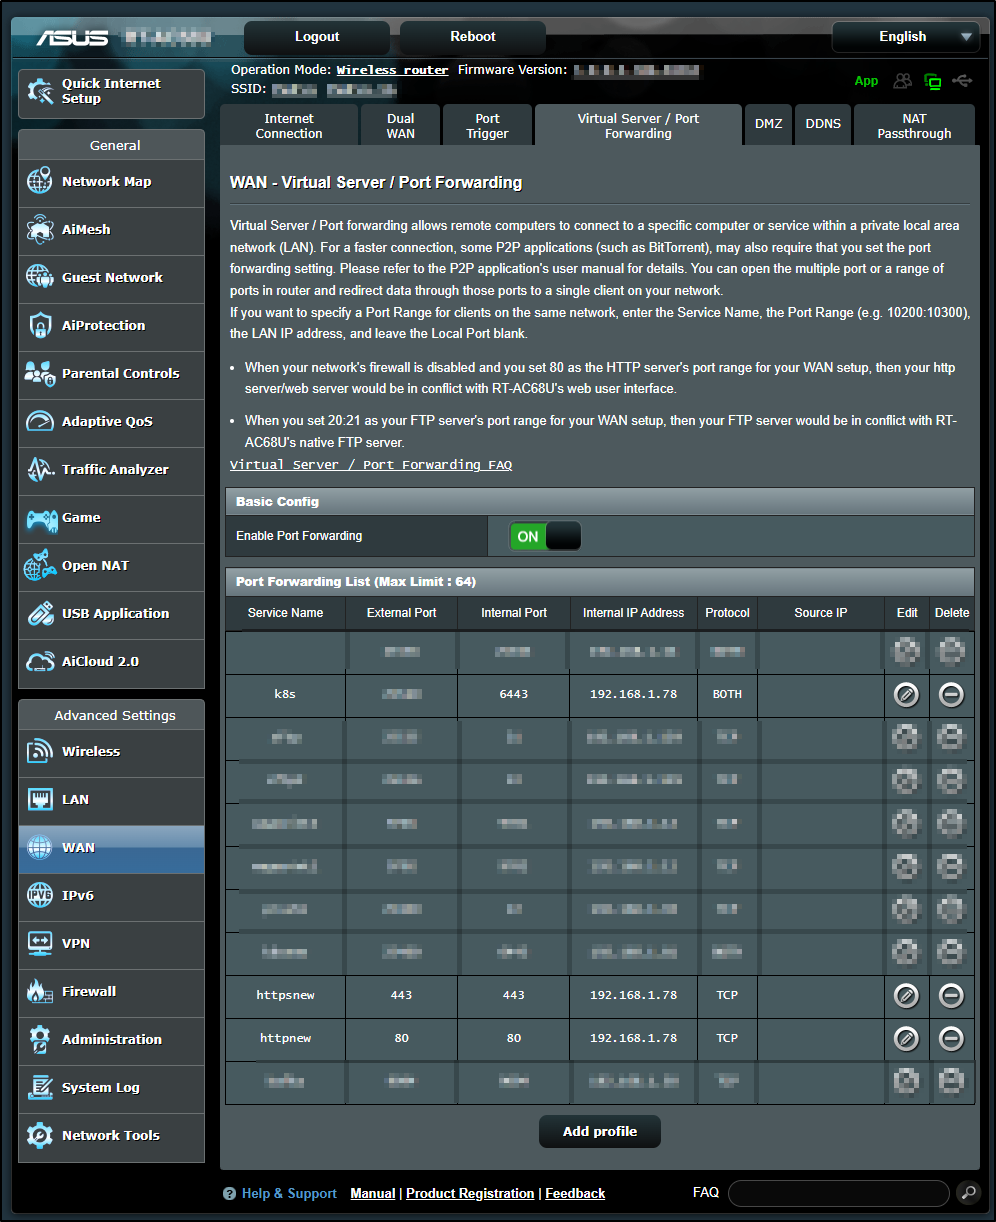
Once I updated the Router to ingress to the right IP (78 instead of 77)
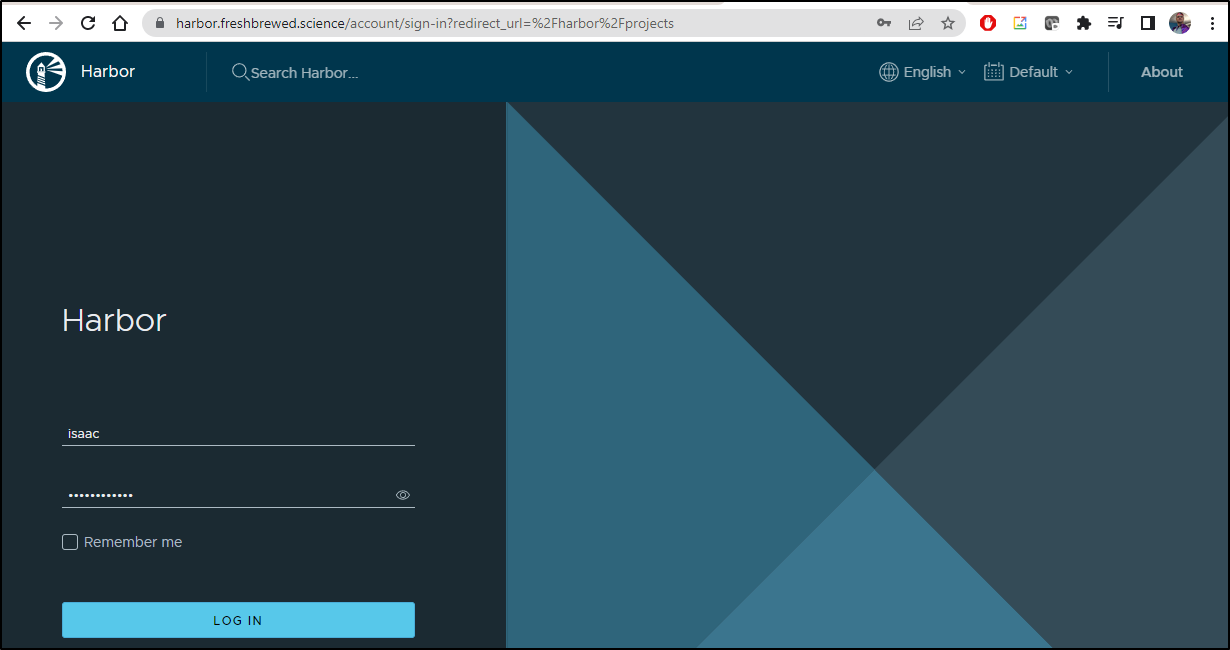
I could then verify I could login
I then moved on to tweaking the RunnerDeployment to try and get a working Github Runner so I could finish the last post
$ kubectl get runnerdeployment new-jekyllrunner-deployment
NAME                          DESIRED   CURRENT   UP-TO-DATE   AVAILABLE   AGE
new-jekyllrunner-deployment   11        11        11           11          2d11h
Adding back the Nodes
I found one node in particular was dropping all the Pods sent to it
$ kubectl get pods | grep ContainerCreating | sed 's/ .*//' | sed 's/^\(.*\)/kubectl describe pod \1 | grep Node:/g' | sh -
Node:           hp-hp-elitebook-850-g2/192.168.1.57
Node:           hp-hp-elitebook-850-g2/192.168.1.57
Node:           hp-hp-elitebook-850-g2/192.168.1.57
Node:           hp-hp-elitebook-850-g2/192.168.1.57
Node:           hp-hp-elitebook-850-g2/192.168.1.57
Node:           hp-hp-elitebook-850-g2/192.168.1.57
Node:           hp-hp-elitebook-850-g2/192.168.1.57
Node:           hp-hp-elitebook-850-g2/192.168.1.57
Node:           hp-hp-elitebook-850-g2/192.168.1.57
Node:           hp-hp-elitebook-850-g2/192.168.1.57
Node:           hp-hp-elitebook-850-g2/192.168.1.57
Node:           hp-hp-elitebook-850-g2/192.168.1.57
Node:           hp-hp-elitebook-850-g2/192.168.1.57
Node:           hp-hp-elitebook-850-g2/192.168.1.57
Node:           hp-hp-elitebook-850-g2/192.168.1.57
Node:           hp-hp-elitebook-850-g2/192.168.1.57
Node:           hp-hp-elitebook-850-g2/192.168.1.57
Taking down the node
This then shows it to be offline when checking the Cluster
$ kubectl get nodes
NAME                          STATUS     ROLES                  AGE    VERSION
builder-hp-elitebook-850-g2   Ready      <none>                 175d   v1.23.9+k3s1
builder-hp-elitebook-850-g1   Ready      <none>                 183d   v1.23.9+k3s1
hp-hp-elitebook-850-g2        NotReady   <none>                 183d   v1.23.9+k3s1
isaac-macbookair              Ready      control-plane,master   184d   v1.23.9+k3s1
I first have to kill the old processes on the host
$ sudo /usr/local/bin/k3s-agent-uninstall.sh &
$ ps -ef
$ sudo kill 3379616
$ ps -ef
$ sudo /usr/local/bin/k3s-agent-uninstall.sh &
$ ps -ef
$ sudo kill 3379823
$ ps -ef
$ sudo /usr/local/bin/k3s-agent-uninstall.sh &
$ ps -ef
$ sudo kill 3379924
As you see, i use the ps -ef to find the locked up containerd mounts and kill the umount command (which will hang forever).
I then rebooted with sudo reboot now.
I decided it would be best to Upgrade to the latest OS. We can use
$ sudo do-release-upgrade
And follow the prompts or check using the Ubuntu OS tool
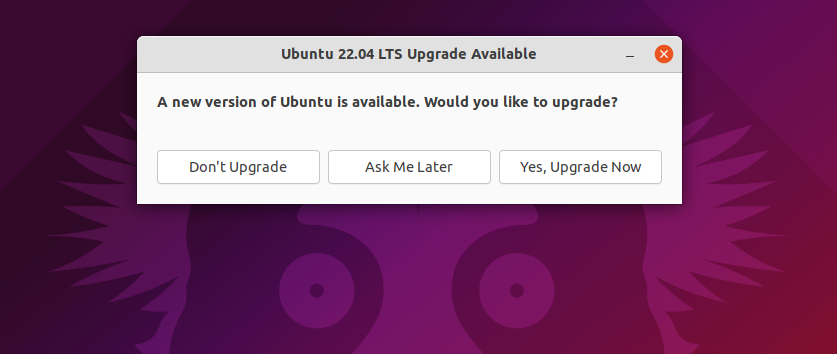 (source: Ubuntu Guide)
Adding Node Back
Now that I upgraded the Ubuntu worker node, I’m hoping this solves the CNI issues around k3s.io containerd errors.
Since (at the moment) I’m remote, I’ll fire an interactive Ubuntu pod on the cluster that I can use as a shell to get to VMs in my home network
$ kubectl run my-shell -i --tty --image ubuntu -- bash
By default, the Ubuntu container will be missing the ssh client, so we’ll want to add that first
root@my-shell:/# apt update && apt install -y openssh-client
Then I can SSH to it
root@my-shell:/# ssh hp@192.168.1.57
The authenticity of host '192.168.1.57 (192.168.1.57)' can't be established.
ED25519 key fingerprint is SHA256:mib5HejHKnhzbAVBxPJ6U2Gv70/nrQmcUmT1AdeVfV4.
This key is not known by any other names
Are you sure you want to continue connecting (yes/no/[fingerprint])? yes
Warning: Permanently added '192.168.1.57' (ED25519) to the list of known hosts.
hp@192.168.1.57's password:
Welcome to Ubuntu 22.04.1 LTS (GNU/Linux 5.15.0-58-generic x86_64)

 * Documentation:  https://help.ubuntu.com
 * Management:     https://landscape.canonical.com
 * Support:        https://ubuntu.com/advantage

0 updates can be applied immediately.

Last login: Wed Jan 25 22:17:58 2023 from 192.168.1.160
hp@hp-HP-EliteBook-850-G2:~$
My first check is to see if we made it to 22.x
hp@hp-HP-EliteBook-850-G2:~$ lsb_release -a
No LSB modules are available.
Distributor ID: Ubuntu
Description:    Ubuntu 22.04.1 LTS
Release:        22.04
Codename:       jammy
I’ll double check that the rancher folder that had the stuck mounts is empty and no service exists
hp@hp-HP-EliteBook-850-G2:~$ ls /var/lib/rancher/
hp@hp-HP-EliteBook-850-G2:~$
hp@hp-HP-EliteBook-850-G2:~$ sudo service k3s-agent status
[sudo] password for hp:
Unit k3s-agent.service could not be found.
I can also double check to see if any newer releases exist (they do not at this point)
hp@hp-HP-EliteBook-850-G2:~$ sudo do-release-upgrade
Checking for a new Ubuntu release
There is no development version of an LTS available.
To upgrade to the latest non-LTS development release
set Prompt=normal in /etc/update-manager/release-upgrades.
Install back the k3s-agent
Here we’ll install the agent, noting of course, the new master node IP (.78)
hp@hp-HP-EliteBook-850-G2:~$ curl -sfL https://get.k3s.io | INSTALL_K3S_VERSION=v1.23.9+k3s1 K3S_URL=https://192.168.1.78:6443 K3S_TOKEN=K107d8e80976d8e1258a502cc802d2ad6c4c35cc2f16a36161e32417e87738014a8::server:581be6c9da1c56ea3d8d5d776979585a sh -
[INFO]  Using v1.23.9+k3s1 as release
[INFO]  Downloading hash https://github.com/k3s-io/k3s/releases/download/v1.23.9+k3s1/sha256sum-amd64.txt
[INFO]  Skipping binary downloaded, installed k3s matches hash
[INFO]  Skipping installation of SELinux RPM
[INFO]  Creating /usr/local/bin/kubectl symlink to k3s
[INFO]  Creating /usr/local/bin/crictl symlink to k3s
[INFO]  Creating /usr/local/bin/ctr symlink to k3s
[INFO]  Creating killall script /usr/local/bin/k3s-killall.sh
[INFO]  Creating uninstall script /usr/local/bin/k3s-agent-uninstall.sh
[INFO]  env: Creating environment file /etc/systemd/system/k3s-agent.service.env
[INFO]  systemd: Creating service file /etc/systemd/system/k3s-agent.service
[INFO]  systemd: Enabling k3s-agent unit
Created symlink /etc/systemd/system/multi-user.target.wants/k3s-agent.service → /etc/systemd/system/k3s-agent.service.
[INFO]  systemd: Starting k3s-agent
I can already see that it looks way more healthy than before
hp@hp-HP-EliteBook-850-G2:~$ sudo service k3s-agent status
● k3s-agent.service - Lightweight Kubernetes
     Loaded: loaded (/etc/systemd/system/k3s-agent.service; enabled; vendor preset: enabled)
     Active: active (running) since Thu 2023-01-26 19:14:13 EST; 36s ago
       Docs: https://k3s.io
    Process: 2150160 ExecStartPre=/bin/sh -xc ! /usr/bin/systemctl is-enabled --quiet nm-cloud-setup.service (code=exited, status=0/SUCCESS)
    Process: 2150162 ExecStartPre=/sbin/modprobe br_netfilter (code=exited, status=0/SUCCESS)
    Process: 2150165 ExecStartPre=/sbin/modprobe overlay (code=exited, status=0/SUCCESS)
   Main PID: 2150166 (k3s-agent)
      Tasks: 61
     Memory: 1.6G
        CPU: 24.869s
     CGroup: /system.slice/k3s-agent.service
             ├─2150166 "/usr/local/bin/k3s agent"
             ├─2150276 containerd -c /var/lib/rancher/k3s/agent/etc/containerd/config.toml -a /run/k3s/containerd/containerd.sock --state /run/k3s/containerd --root /var/lib/rancher/k3s/agent/containerd
             ├─2151378 /var/lib/rancher/k3s/data/2949af7261ce923f6a5091396d266a0e9d9436dcee976fcd548edc324eb277bb/bin/containerd-shim-runc-v2 -namespace k8s.io -id ada88343afcafa6ffba76e9675fab9bd03842e9058420>
             └─2151408 /var/lib/rancher/k3s/data/2949af7261ce923f6a5091396d266a0e9d9436dcee976fcd548edc324eb277bb/bin/containerd-shim-runc-v2 -namespace k8s.io -id 7eb1bdd19facbf70fe08456e9a04ed152f18dbcafc9a7>

Jan 26 19:14:20 hp-HP-EliteBook-850-G2 k3s[2150166]: I0126 19:14:20.366444 2150166 kubelet_volumes.go:160] "Cleaned up orphaned pod volumes dir" podUID=f0a71fd1-dea6-47e7-bea8-06c88ca78fe5 path="/var/lib/kubel>
Jan 26 19:14:22 hp-HP-EliteBook-850-G2 k3s[2150166]: I0126 19:14:22.374413 2150166 kubelet_volumes.go:160] "Cleaned up orphaned pod volumes dir" podUID=0d6119bb-c14a-45cf-94e4-e7ba3a10caaa path="/var/lib/kubel>
Jan 26 19:14:22 hp-HP-EliteBook-850-G2 k3s[2150166]: I0126 19:14:22.375584 2150166 kubelet_volumes.go:160] "Cleaned up orphaned pod volumes dir" podUID=43bda7cd-57a4-4f1f-9fb8-52ed49626dff path="/var/lib/kubel>
Jan 26 19:14:22 hp-HP-EliteBook-850-G2 k3s[2150166]: I0126 19:14:22.376745 2150166 kubelet_volumes.go:160] "Cleaned up orphaned pod volumes dir" podUID=69fd59e3-7e3f-4e0b-85dd-18c0c14049cf path="/var/lib/kubel>
Jan 26 19:14:22 hp-HP-EliteBook-850-G2 k3s[2150166]: I0126 19:14:22.377830 2150166 kubelet_volumes.go:160] "Cleaned up orphaned pod volumes dir" podUID=a7f9a077-4213-4e46-b85b-ba17279f013e path="/var/lib/kubel>
Jan 26 19:14:23 hp-HP-EliteBook-850-G2 k3s[2150166]: I0126 19:14:23.402950 2150166 kubelet_node_status.go:70] "Attempting to register node" node="hp-hp-elitebook-850-g2"
Jan 26 19:14:24 hp-HP-EliteBook-850-G2 k3s[2150166]: I0126 19:14:24.084834 2150166 kubelet_node_status.go:108] "Node was previously registered" node="hp-hp-elitebook-850-g2"
Jan 26 19:14:24 hp-HP-EliteBook-850-G2 k3s[2150166]: I0126 19:14:24.084939 2150166 kubelet_node_status.go:73] "Successfully registered node" node="hp-hp-elitebook-850-g2"
Jan 26 19:14:24 hp-HP-EliteBook-850-G2 k3s[2150166]: I0126 19:14:24.357803 2150166 kubelet_volumes.go:160] "Cleaned up orphaned pod volumes dir" podUID=7ee0ef98-ae0c-4406-b50e-6925ac5e1147 path="/var/lib/kubel>
Jan 26 19:14:47 hp-HP-EliteBook-850-G2 k3s[2150166]: W0126 19:14:47.072988 2150166 manager.go:1176] Failed to process watch event {EventType:0 Name:/kubepods.slice/kubepods-besteffort.slice/kubepods-besteffo
I continued to see these errors
Jan 26 19:14:53 hp-HP-EliteBook-850-G2 k3s[2150166]: I0126 19:14:53.898318 2150166 log.go:184] http: TLS handshake error from 10.42.1.3:46370: local error: tls: bad record MAC
Jan 26 19:15:13 hp-HP-EliteBook-850-G2 k3s[2150166]: I0126 19:15:13.871083 2150166 log.go:184] http: TLS handshake error from 10.42.1.3:57458: local error: tls: bad record MAC
Jan 26 19:15:33 hp-HP-EliteBook-850-G2 k3s[2150166]: I0126 19:15:33.870129 2150166 log.go:184] http: TLS handshake error from 10.42.1.3:41956: local error: tls: bad record MAC
Jan 26 19:15:53 hp-HP-EliteBook-850-G2 k3s[2150166]: I0126 19:15:53.875564 2150166 log.go:184] http: TLS handshake error from 10.42.1.3:38584: local error: tls: bad record MAC
The 10.42.1.0/24 is my CNI range. I can see that from my network addresses
hp@hp-HP-EliteBook-850-G2:~$ ifconfig
cni0: flags=4163<UP,BROADCAST,RUNNING,MULTICAST>  mtu 1450
        inet 10.42.1.1  netmask 255.255.255.0  broadcast 10.42.1.255
        inet6 fe80::f8d9:2ff:feed:3a9a  prefixlen 64  scopeid 0x20<link>
        ether fa:d9:02:ed:3a:9a  txqueuelen 1000  (Ethernet)
        RX packets 1660  bytes 550545 (550.5 KB)
        RX errors 0  dropped 0  overruns 0  frame 0
        TX packets 1785  bytes 2763295 (2.7 MB)
        TX errors 0  dropped 0 overruns 0  carrier 0  collisions 0

enp0s25: flags=4163<UP,BROADCAST,RUNNING,MULTICAST>  mtu 1500
        inet 192.168.1.57  netmask 255.255.255.0  broadcast 192.168.1.255
        inet6 fd39:b4c2:d84b:5bba:bd12:cee:86b4:14b1  prefixlen 64  scopeid 0x0<global>
        inet6 fd39:b4c2:d84b:5bba:37b0:f389:db17:33f1  prefixlen 64  scopeid 0x0<global>
        inet6 fe80::70a3:acc2:81ba:378a  prefixlen 64  scopeid 0x20<link>
        ether fc:3f:db:88:b7:3b  txqueuelen 1000  (Ethernet)
        RX packets 522077  bytes 374219682 (374.2 MB)
        RX errors 0  dropped 62  overruns 0  frame 0
        TX packets 113148  bytes 15624443 (15.6 MB)
        TX errors 0  dropped 0 overruns 0  carrier 0  collisions 0
        device interrupt 20  memory 0xc1300000-c1320000

flannel.1: flags=4163<UP,BROADCAST,RUNNING,MULTICAST>  mtu 1450
        inet 10.42.1.0  netmask 255.255.255.255  broadcast 0.0.0.0
        inet6 fe80::6c41:12ff:fe80:f260  prefixlen 64  scopeid 0x20<link>
        ether 6e:41:12:80:f2:60  txqueuelen 0  (Ethernet)
        RX packets 828  bytes 71189 (71.1 KB)
        RX errors 0  dropped 0  overruns 0  frame 0
        TX packets 739  bytes 68842 (68.8 KB)
        TX errors 0  dropped 300 overruns 0  carrier 0  collisions 0
I waited a bit and did see pods get scheduled and run on the node.
I also popped over to another working node and noted it too showed the MAC TLS error
Jan 26 18:31:28 builder-HP-EliteBook-850-G1 k3s[2323]: I0126 18:31:28.305611    2323 log.go:184] http: TLS handshake error from 10.42.2.6:32904: local error: tls: bad record MAC
Jan 26 18:31:35 builder-HP-EliteBook-850-G1 k3s[2323]: E0126 18:31:35.335893    2323 pod_workers.go:951] "Error syncing pod, skipping" err="failed to \"StartContainer\" for \"nginx\" with ImagePullBackOff: \"B>
Jan 26 18:31:48 builder-HP-EliteBook-850-G1 k3s[2323]: I0126 18:31:48.294783    2323 log.go:184] http: TLS handshake error from 10.42.2.6:40022: local error: tls: bad record MAC
Jan 26 18:31:50 builder-HP-EliteBook-850-G1 k3s[2323]: E0126 18:31:50.334046    2323 pod_workers.go:951] "Error syncing pod, skipping" err="failed to \"StartContainer\" for \"nginx\" with ImagePullBackOff: \"B>
Jan 26 18:32:03 builder-HP-EliteBook-850-G1 k3s[2323]: E0126 18:32:03.334571    2323 pod_workers.go:951] "Error syncing pod, skipping" err="failed to \"StartContainer\" for \"nginx\" with ImagePullBackOff: \"B>
Jan 26 18:32:08 builder-HP-EliteBook-850-G1 k3s[2323]: I0126 18:32:08.290088    2323 log.go:184] http: TLS handshake error from 10.42.2.6:47204: local error: tls: bad record MAC
Jan 26 18:32:14 builder-HP-EliteBook-850-G1 k3s[2323]: E0126 18:32:14.334020    2323 pod_workers.go:951] "Error syncing pod, skipping" err="failed to \"StartContainer\" for \"ngi
Updating Datadog
I did some digging, as it came from one pod, which traces back to my-dd-release-datadog
I do have a dated Datadog release at this point
$ helm list | grep ^[Nm][Ay]
NAME                                    NAMESPACE       REVISION        UPDATED                                 STATUS          CHART                           APP VERSION
my-dd-release                           default         1               2022-07-26 06:45:46.544985422 -0500 CDT deployed        datadog-2.36.6                  7
I’ll save my install values
$ helm get values -o yaml my-dd-release > dd-release.yaml
I’ll add the Datadog Helm Chart repo and update
builder@DESKTOP-72D2D9T:~/Workspaces/jekyll-blog$ helm repo add datadog https://helm.datadoghq.com
"datadog" already exists with the same configuration, skipping
builder@DESKTOP-72D2D9T:~/Workspaces/jekyll-blog$ helm repo update datadog
Hang tight while we grab the latest from your chart repositories...
...Successfully got an update from the "datadog" chart repository
Update Complete. ⎈Happy Helming!⎈
The upgrade pointed out some changes
$ helm upgrade my-dd-release -f dd-release.yaml datadog/datadog
Release "my-dd-release" has been upgraded. Happy Helming!
NAME: my-dd-release
LAST DEPLOYED: Thu Jan 26 18:43:35 2023
NAMESPACE: default
STATUS: deployed
REVISION: 2
TEST SUITE: None
NOTES:
Datadog agents are spinning up on each node in your cluster. After a few
minutes, you should see your agents starting in your event stream:
    https://app.datadoghq.com/event/explorer
You disabled creation of Secret containing API key, therefore it is expected
that you create Secret named 'dd-secret' which includes a key called 'api-key' containing the API key.

The Datadog Agent is listening on port 8126 for APM service.

#################################################################
####               WARNING: Deprecation notice               ####
#################################################################

The option `datadog.apm.enabled` is deprecated, please use `datadog.apm.portEnabled` to enable TCP communication to the trace-agent.
The option `datadog.apm.socketEnabled` is enabled by default and can be used to rely on unix socket or name-pipe communication.

###################################################################################
####   WARNING: Cluster-Agent should be deployed in high availability mode     ####
###################################################################################

The Cluster-Agent should be in high availability mode because the following features
are enabled:
* Admission Controller
* External Metrics Provider

To run in high availability mode, our recommendation is to update the chart
configuration with:
* set `clusterAgent.replicas` value to `2` replicas .
* set `clusterAgent.createPodDisruptionBudget` to `true`.
I can see the agents are now updated and cycled over my nodes.
$ kubectl get pods --all-namespaces | grep my-dd
default                 my-dd-release-datadog-blp8l                                4/4     Running            4                 184d
default                 my-dd-release-datadog-p4577                                4/4     Running            0                 21h
default                 my-dd-release-datadog-cluster-agent-fb559db75-zg46g        1/1     Running            0                 2m
default                 my-dd-release-datadog-clusterchecks-59cd8bcdc8-zg2rw       1/1     Running            0                 2m
default                 my-dd-release-datadog-cluster-agent-fb559db75-xmpx8        1/1     Running            0                 89s
default                 my-dd-release-datadog-kb694                                3/4     Running            0                 36s
default                 my-dd-release-datadog-cluster-agent-5d464b56d6-6qmhg       0/1     Running            0                 39s
default                 my-dd-release-datadog-clusterchecks-db754b6ff-z6hbk        1/1     Running            0                 39s
default                 my-dd-release-datadog-wfjwt                                4/4     Running            0                 35s
default                 my-dd-release-datadog-clusterchecks-db754b6ff-b4hsp        0/1     Running            0                 7s
One can also look at settings in the Datadog Helm docs
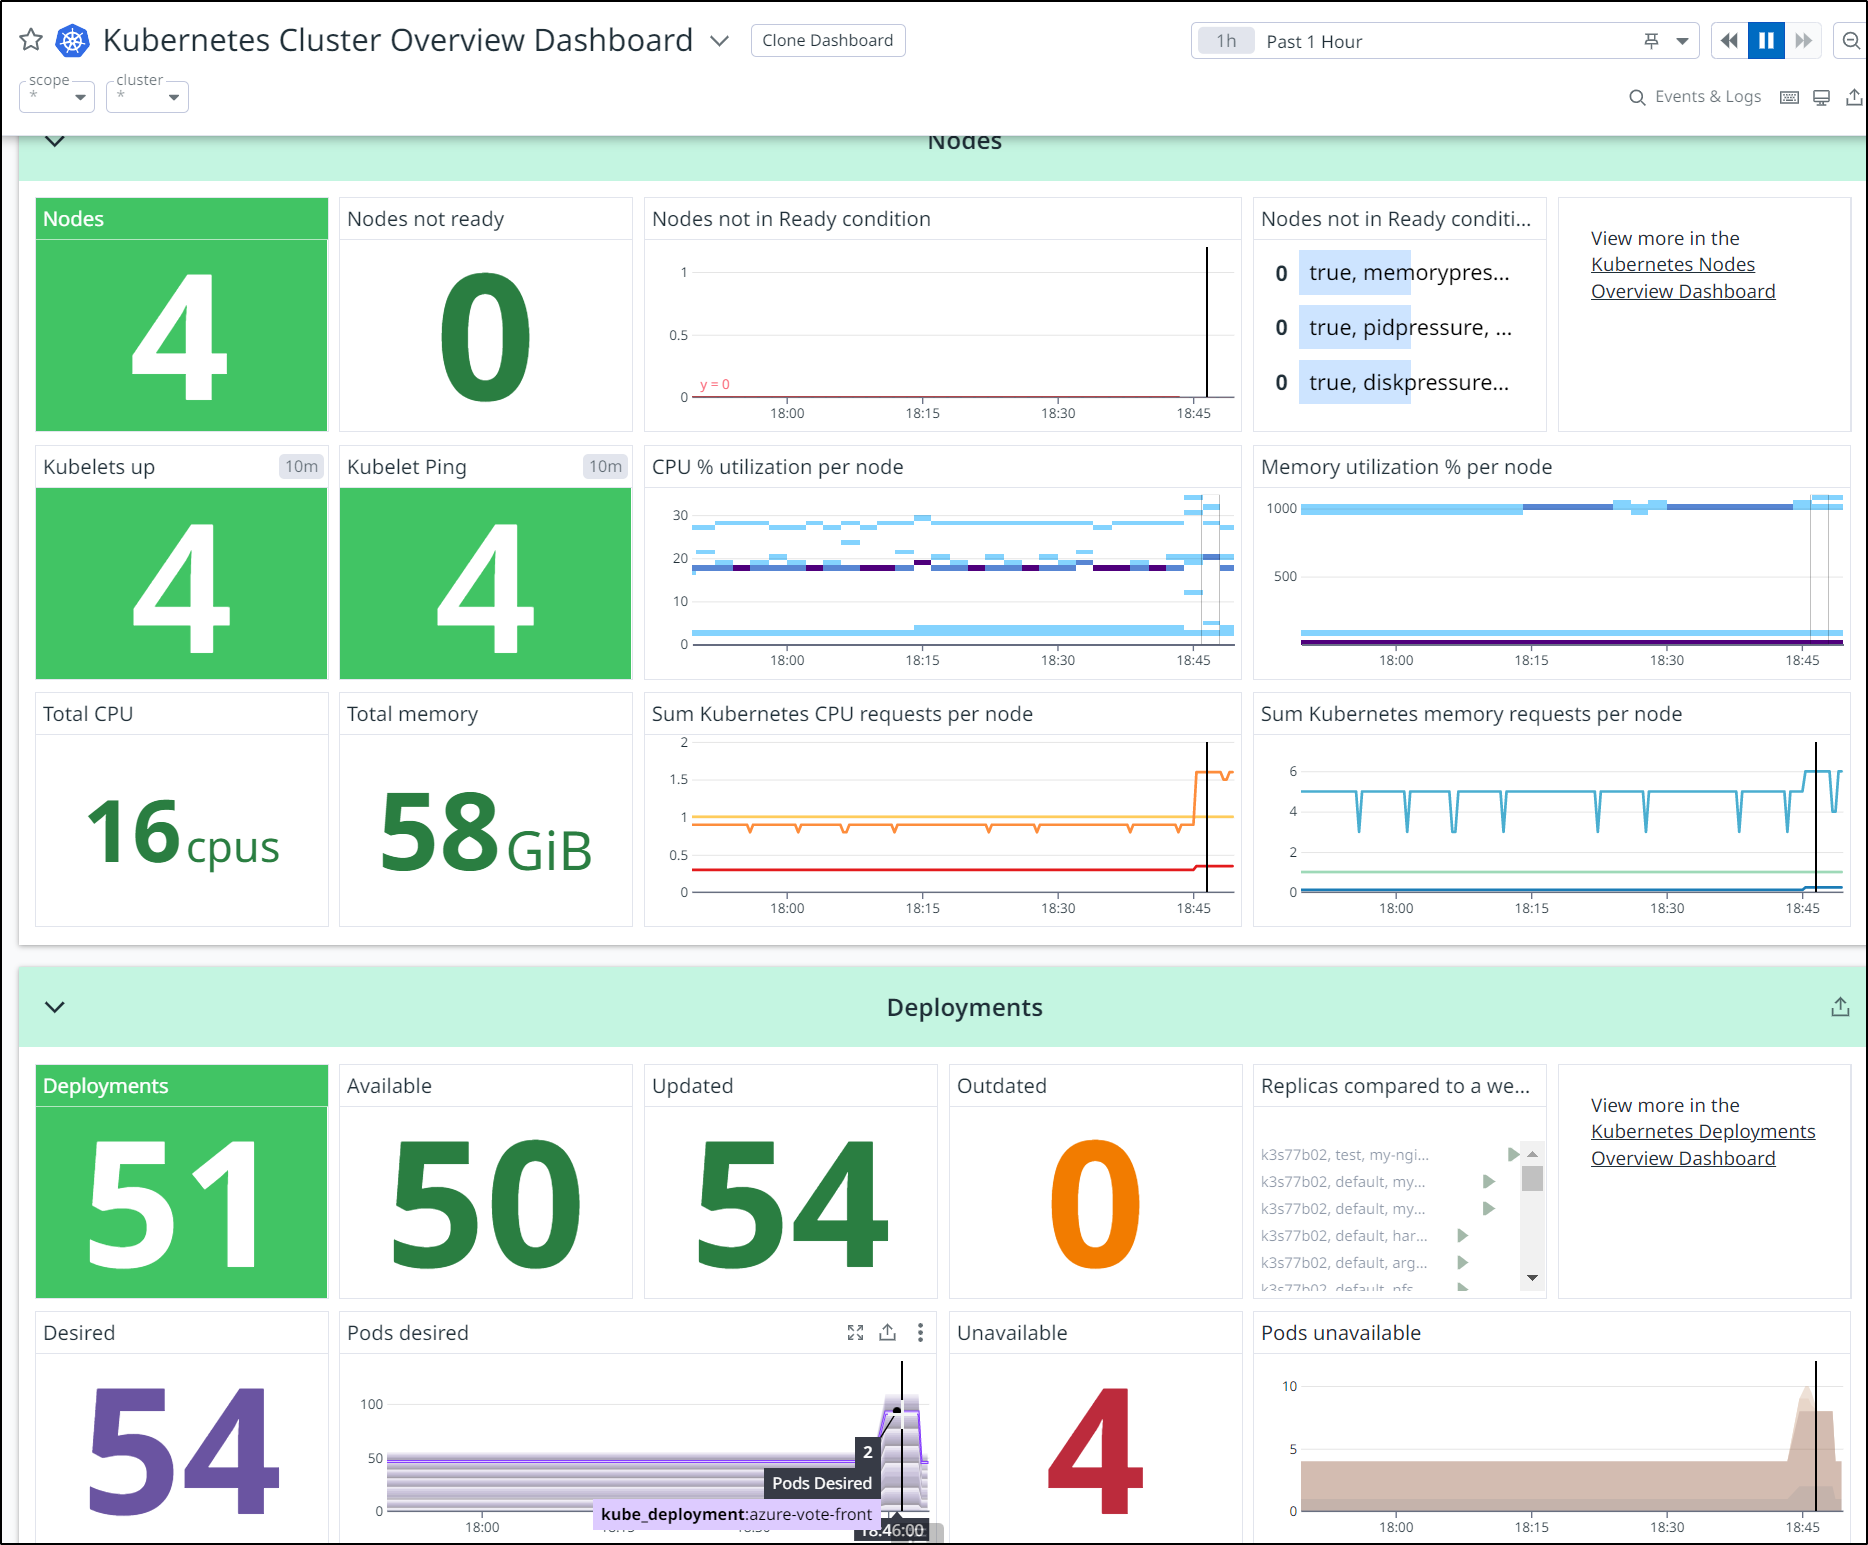
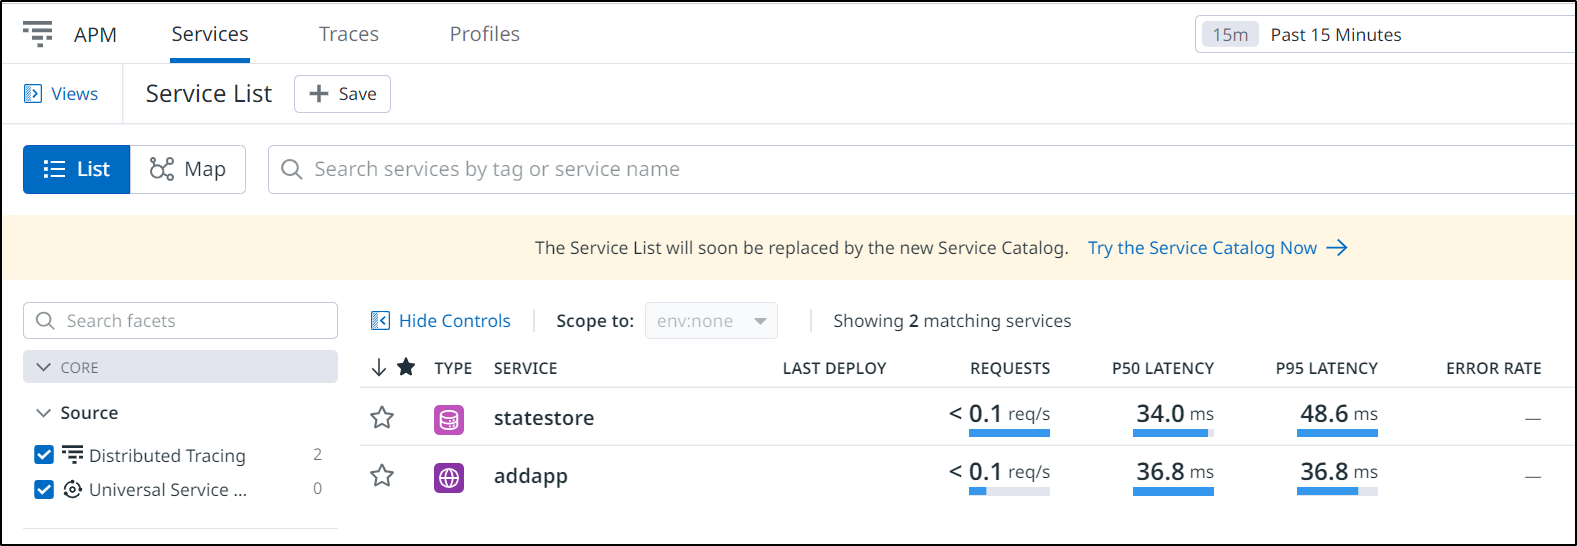
I can pop over to Datadog to see the update reflected on the dashboard
I’m hoping this can sort out my Zipkin traces to APM which were not working a week or so ago when I demoed Dapr and COBOL
I can see two services presently set up to receive Zipkin traces:
$ kubectl get svc | grep 9411
otelcol-opentelemetry-collector                            ClusterIP      10.43.189.247   <none>                                                 6831/UDP,14250/TCP,14268/TCP,4317/TCP,4318/TCP,9411/TCP
                                           15d
zipkin                                                     ClusterIP      10.43.45.140    <none>                                                 9411/TCP
                                           15d
Presently, we can see I’m sending trace data from Dapr through to the zipkin service locally
$ kubectl get configuration appconfig -o yaml
apiVersion: dapr.io/v1alpha1
kind: Configuration
metadata:
  annotations:
    kubectl.kubernetes.io/last-applied-configuration: |
      {"apiVersion":"dapr.io/v1alpha1","kind":"Configuration","metadata":{"annotations":{},"creationTimestamp":"2023-01-11T12:45:43Z","generation":2,"name":"appconfig","namespace":"default","resourceVersion":"67058695","uid":"facbfb87-7972-4fd6-97ea-74e6d92bac19"},"spec":{"metric":{"enabled":true},"tracing":{"samplingRate":"1","zipkin":{"endpointAddress":"http://zipkin.default.svc.cluster.local:9411/api/v2/spans"}}}}
  creationTimestamp: "2023-01-11T12:45:43Z"
  generation: 3
  name: appconfig
  namespace: default
  resourceVersion: "67081908"
  uid: facbfb87-7972-4fd6-97ea-74e6d92bac19
spec:
  metric:
    enabled: true
  tracing:
    samplingRate: "1"
    zipkin:
      endpointAddress: http://zipkin.default.svc.cluster.local:9411/api/v2/spans
I’ll change the Dapr collector endpoint back to OTel
builder@DESKTOP-72D2D9T:~/Workspaces/jekyll-blog$ kubectl get configuration appconfig -o yaml > ac.yaml
builder@DESKTOP-72D2D9T:~/Workspaces/jekyll-blog$ vi ac.yaml
builder@DESKTOP-72D2D9T:~/Workspaces/jekyll-blog$ kubectl get configuration appconfig -o yaml > ac.yaml.bak
dibuilder@DESKTOP-72D2D9T:~/Workspaces/jekyll-blog$ diff ac.yaml ac.yaml.bak
19c19
<       endpointAddress: http://otel-collector.default.svc.cluster.local:9411/api/v2/spans
---
>       endpointAddress: http://zipkin.default.svc.cluster.local:9411/api/v2/spans
builder@DESKTOP-72D2D9T:~/Workspaces/jekyll-blog$ kubectl apply -f ac.yaml
configuration.dapr.io/appconfig configured
We can now rotate the pods with just the appconfig annotation
$ kubectl delete pods `kubectl get po -o=jsonpath='{.items[?(@.metadata.annotations.dapr\.io/config=="appconfig")].metadata.name}'`
pod "divideapp-585848cf4d-nmpnf" deleted
pod "addapp-549c9cbfdd-8bhcv" deleted
pod "calculator-front-end-6694bbfdf-rgxxk" deleted
pod "multiplyapp-bdbdf4b5-crnsl" deleted
pod "subtractapp-6c449d8cb9-zm957" deleted
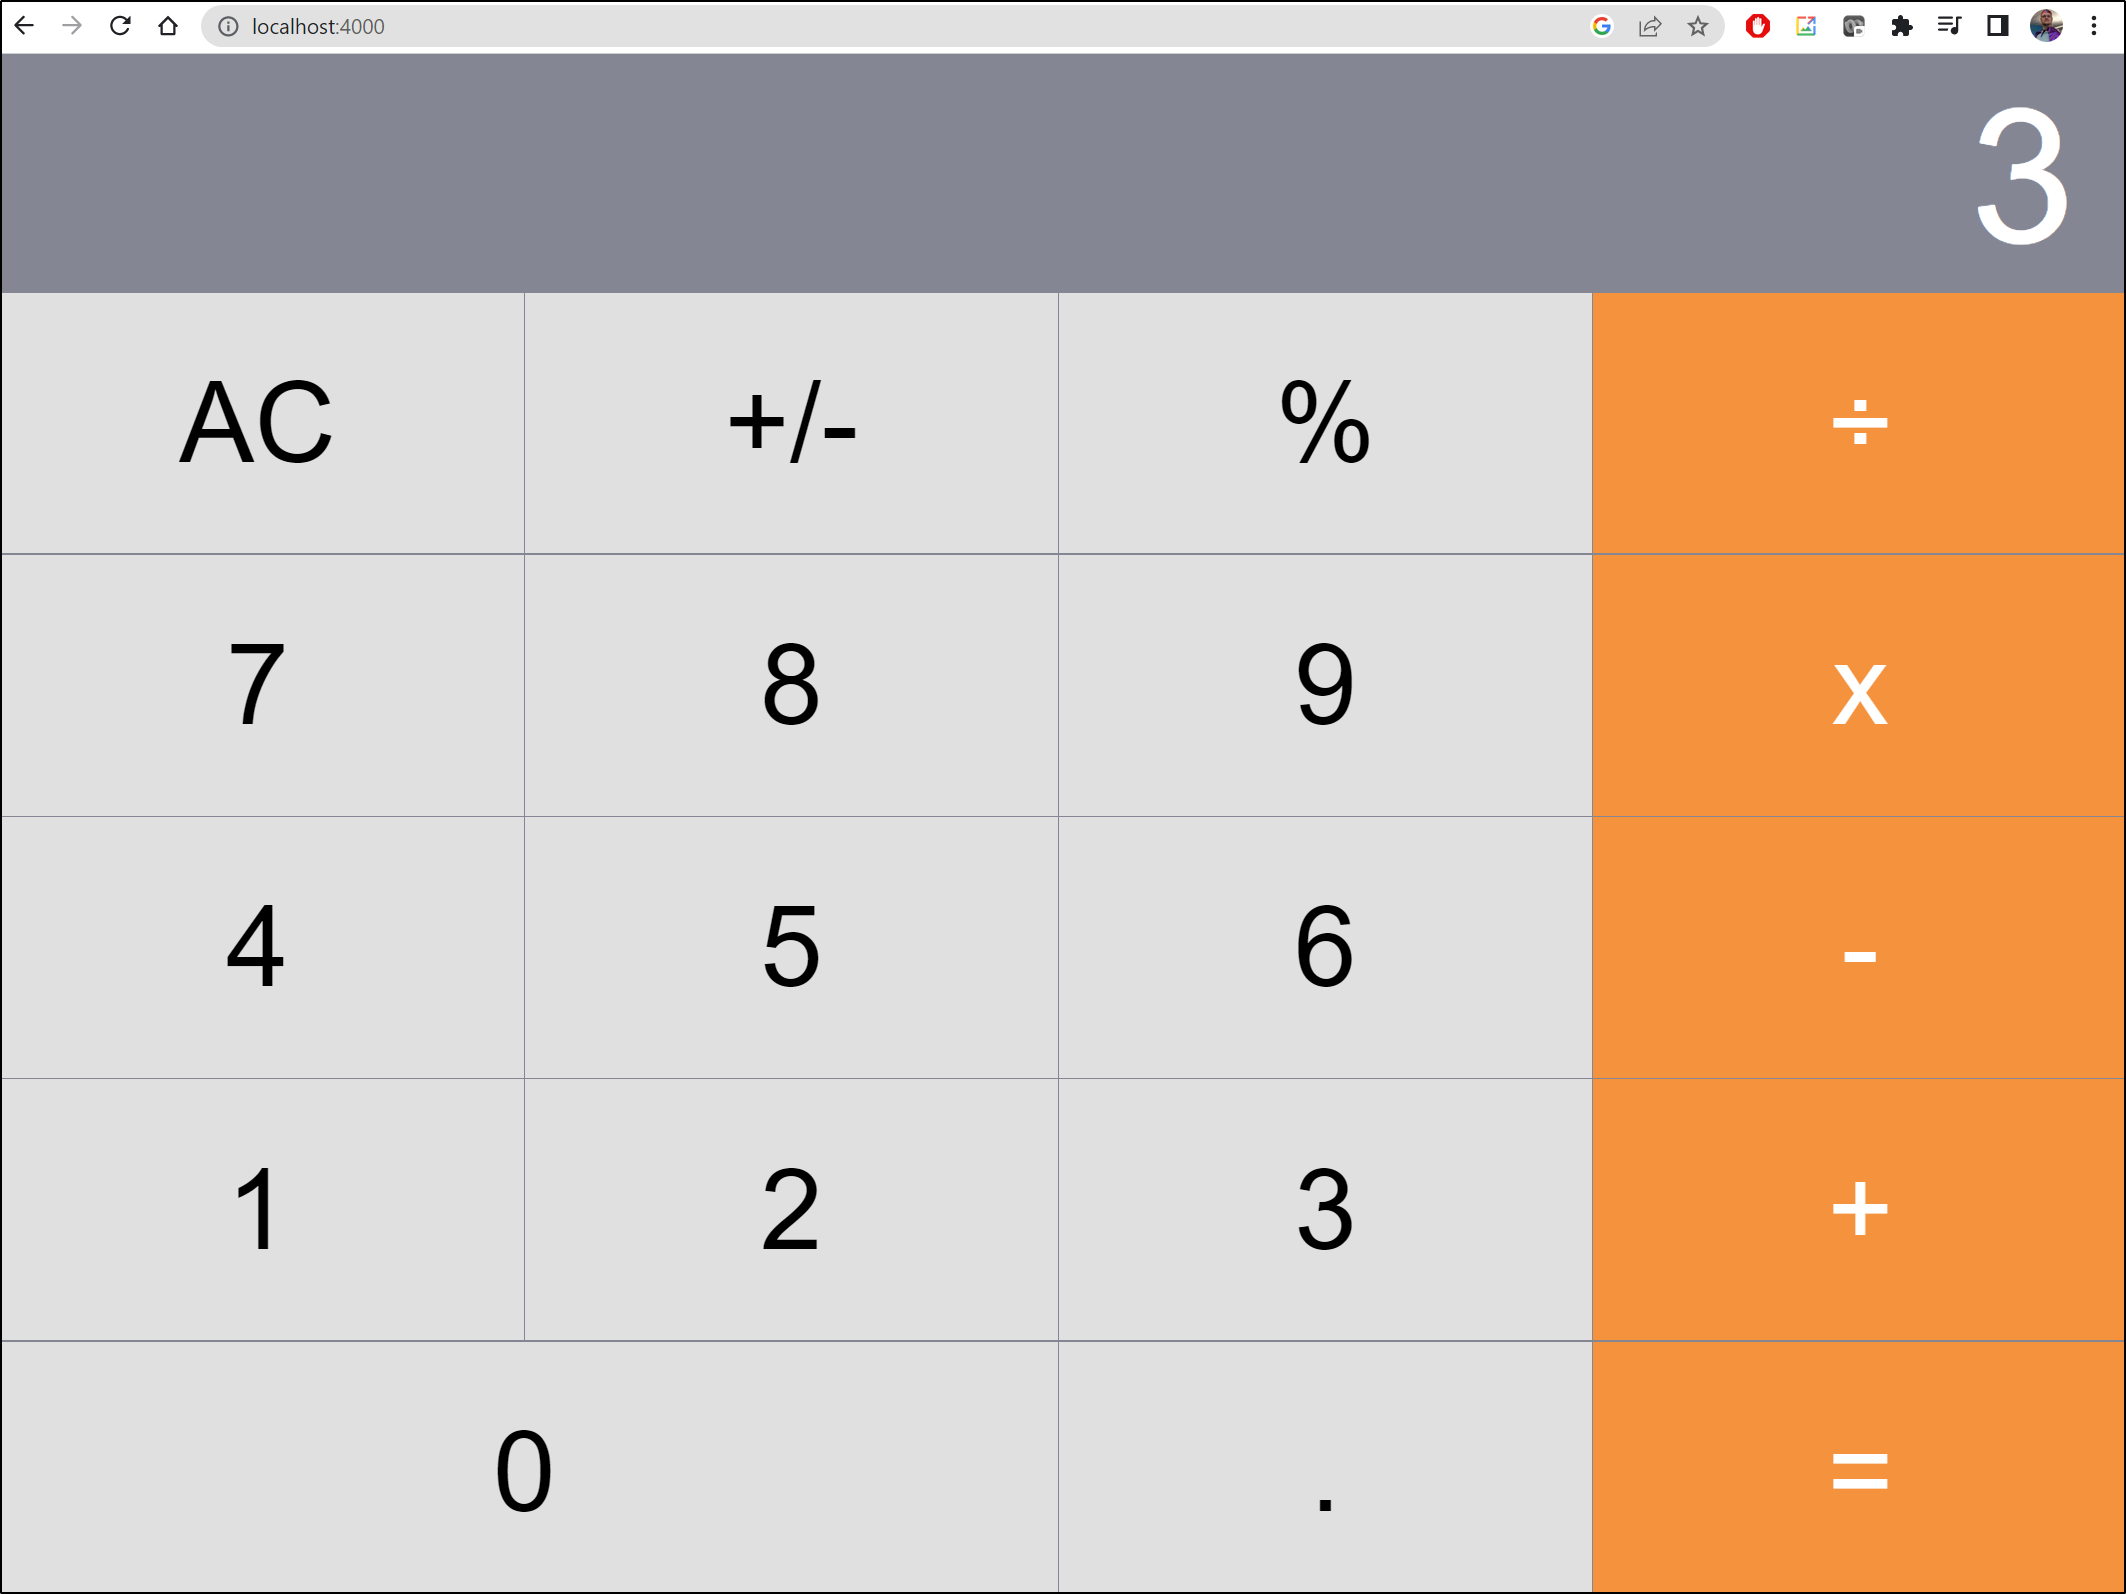
I can now try using it
$ kubectl port-forward svc/calculator-front-end 4000:80
Forwarding from 127.0.0.1:4000 -> 8080
Forwarding from [::1]:4000 -> 8080
Handling connection for 4000
Handling connection for 4000
Handling connection for 4000
Then I’ll do some calculations
My OTel collector only shows metrics
2023-01-26T21:59:38.606Z        info    metadata/metadata.go:216        Sent host metadata      {"kind": "exporter", "data_type": "metrics", "name": "datadog"}
2023-01-26T22:29:38.605Z        info    metadata/metadata.go:216        Sent host metadata      {"kind": "exporter", "data_type": "metrics", "name": "datadog"}
2023-01-26T22:59:38.643Z        info    metadata/metadata.go:216        Sent host metadata      {"kind": "exporter", "data_type": "metrics", "name": "datadog"}
2023-01-26T23:29:38.620Z        info    metadata/metadata.go:216        Sent host metadata      {"kind": "exporter", "data_type": "metrics", "name": "datadog"}
2023-01-26T23:59:38.614Z        info    metadata/metadata.go:216        Sent host metadata      {"kind": "exporter", "data_type": "metrics", "name": "datadog"}
2023-01-27T00:29:38.593Z        info    metadata/metadata.go:216        Sent host metadata      {"kind": "exporter", "data_type": "metrics", "name": "datadog"}
2023-01-27T00:59:38.614Z        info    metadata/metadata.go:216        Sent host metadata      {"kind": "exporter", "data_type": "metrics", "name": "datadog"}
2023-01-27T01:29:38.588Z        info    metadata/metadata.go:216        Sent host metadata      {"kind": "exporter", "data_type": "metrics", "name": "datadog"}
It took me longer than I would like to admit, but the issue was the wrong OTel service URL was used
I had used “otel-collector” at some time in the past, but the actual service name, in my deployment, is “otelcol-opentelemetry-collector”
$ kubectl get svc | grep tel
otelcol-opentelemetry-collector                            ClusterIP      10.43.189.247   <none>                                                 6831/UDP,14250/TCP,14268/TCP,4317/TCP,4318/TCP,9411/TCP                                                     15d
I could immediately see where I went wrong:
builder@DESKTOP-72D2D9T:~/Workspaces/jekyll-blog$ diff appconfig.yaml.bak ac.yaml | tail -n4
41c19
<       endpointAddress: http://otel-collector.default.svc.cluster.local:9411/api/v2/spans
---
>       endpointAddress: http://otelcol-opentelemetry-collector.default.svc.cluster.local:9411/api/v2/spans
I pulled down the latest appconfig and changed endpoints
builder@DESKTOP-72D2D9T:~/Workspaces/jekyll-blog$ kubectl get configuration appconfig -o yaml > ac.yaml
builder@DESKTOP-72D2D9T:~/Workspaces/jekyll-blog$ vi ac.yaml
builder@DESKTOP-72D2D9T:~/Workspaces/jekyll-blog$ diff ac.yaml ac.yaml.bak | tail -n 4
19c19
<       endpointAddress: http://otelcol-opentelemetry-collector.default.svc.cluster.local:9411/api/v2/spans
---
>       endpointAddress: http://zipkin.default.svc.cluster.local:9411/api/v2/spans
builder@DESKTOP-72D2D9T:~/Workspaces/jekyll-blog$ kubectl apply -f ac.yaml
configuration.dapr.io/appconfig configured
We need to rotate our Dapr instrumented Pods that use “appconfig”
builder@DESKTOP-72D2D9T:~/Workspaces/jekyll-blog$ !1345
kubectl delete pods `kubectl get po -o=jsonpath='{.items[?(@.metadata.annotations.dapr\.io/config=="appconfig")].metadata.name}'`
pod "divideapp-585848cf4d-z5ls5" deleted
pod "multiplyapp-bdbdf4b5-fcwwg" deleted
pod "subtractapp-6c449d8cb9-n7nhw" deleted
pod "addapp-549c9cbfdd-ddcgv" deleted
pod "calculator-front-end-6694bbfdf-qghj9" deleted
Lastly, I fired up the calculator to do some operations
builder@DESKTOP-72D2D9T:~/Workspaces/jekyll-blog$
builder@DESKTOP-72D2D9T:~/Workspaces/jekyll-blog$ !1347
kubectl port-forward svc/calculator-front-end 4000:80
Forwarding from 127.0.0.1:4000 -> 8080
Forwarding from [::1]:4000 -> 8080
Handling connection for 4000
Handling connection for 4000
Handling connection for 4000
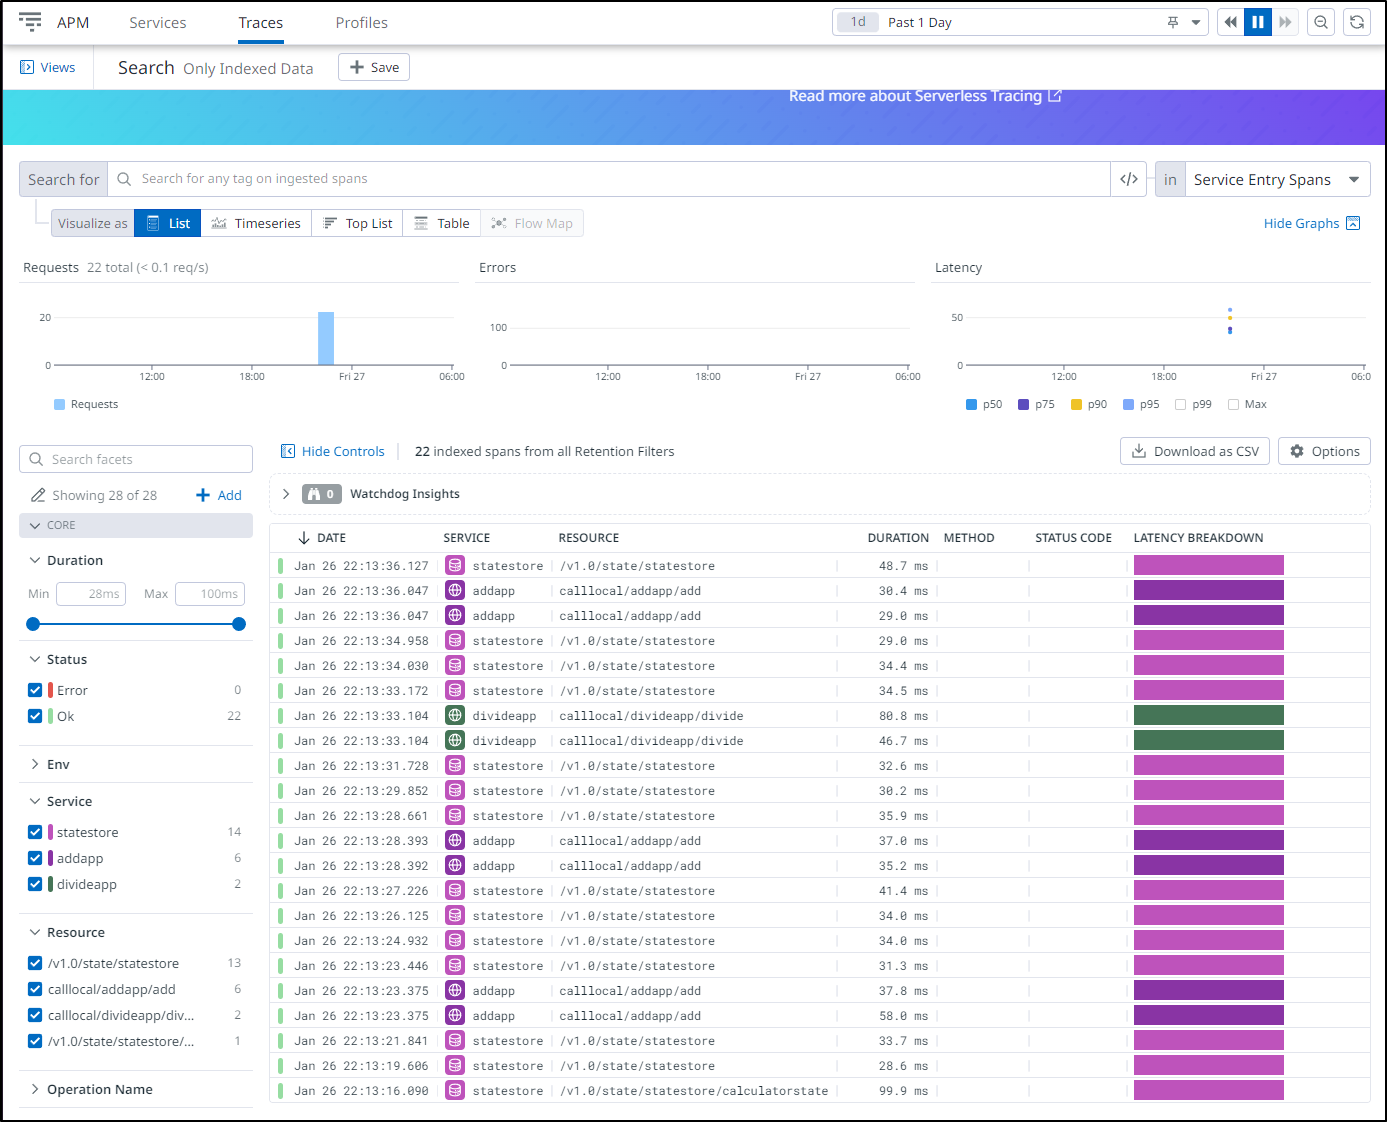
I can see plenty of traces now as well
And if we question their origin, clicking a trace will show us it came from Dapr
Cleanups
Now that things are running, I can trim back my Github Runners
$ kubectl get runnerdeployment new-jekyllrunner-deployment
NAME                          DESIRED   CURRENT   UP-TO-DATE   AVAILABLE   AGE
new-jekyllrunner-deployment   11        11        11           11          2d11h

$ kubectl get pods -l runner-deployment-name=new-jekyllrunner-deployment
NAME                                      READY   STATUS    RESTARTS   AGE
new-jekyllrunner-deployment-wt5j7-xm7vv   2/2     Running   0          33h
new-jekyllrunner-deployment-wt5j7-sgh87   2/2     Running   0          33h
new-jekyllrunner-deployment-wt5j7-hv68c   2/2     Running   0          33h
new-jekyllrunner-deployment-wt5j7-2tsng   2/2     Running   0          33h
new-jekyllrunner-deployment-wt5j7-njhdt   2/2     Running   0          33h
new-jekyllrunner-deployment-wt5j7-vbnlx   2/2     Running   0          33h
new-jekyllrunner-deployment-wt5j7-8jm57   2/2     Running   0          33h
new-jekyllrunner-deployment-wt5j7-5hvww   2/2     Running   0          32h
new-jekyllrunner-deployment-wt5j7-j5vvn   2/2     Running   0          32h
new-jekyllrunner-deployment-wt5j7-jdbk9   2/2     Running   0          32h
new-jekyllrunner-deployment-wt5j7-c4bnc   2/2     Running   0          32h
Let’s scale back to a more reasonable 5 on standby
builder@DESKTOP-QADGF36:~/Workspaces/harborUpgrde$ kubectl get runnerdeployment new-jekyllrunner-deployment -o yaml > activerunners.yaml
builder@DESKTOP-QADGF36:~/Workspaces/harborUpgrde$ kubectl get runnerdeployment new-jekyllrunner-deployment -o yaml > activerunners.yaml.bak
builder@DESKTOP-QADGF36:~/Workspaces/harborUpgrde$ vi activerunners.yaml
builder@DESKTOP-QADGF36:~/Workspaces/harborUpgrde$ diff activerunners.yaml activerunners.yaml.bak
15c15
<   replicas: 5
---
>   replicas: 11
$ kubectl apply -f activerunners.yaml
runnerdeployment.actions.summerwind.dev/new-jekyllrunner-deployment configured
I can immediately see the cleanup
$ kubectl get pods -l runner-deployment-name=new-jekyllrunner-deployment
NAME                                      READY   STATUS        RESTARTS   AGE
new-jekyllrunner-deployment-wt5j7-8jm57   2/2     Running       0          33h
new-jekyllrunner-deployment-wt5j7-5hvww   2/2     Running       0          32h
new-jekyllrunner-deployment-wt5j7-j5vvn   2/2     Running       0          32h
new-jekyllrunner-deployment-wt5j7-jdbk9   2/2     Running       0          32h
new-jekyllrunner-deployment-wt5j7-c4bnc   2/2     Running       0          32h
new-jekyllrunner-deployment-wt5j7-vbnlx   2/2     Terminating   0          33h
new-jekyllrunner-deployment-wt5j7-2tsng   2/2     Terminating   0          33h
new-jekyllrunner-deployment-wt5j7-njhdt   2/2     Terminating   0          33h
new-jekyllrunner-deployment-wt5j7-hv68c   2/2     Terminating   0          33h
new-jekyllrunner-deployment-wt5j7-sgh87   2/2     Terminating   0          33h
new-jekyllrunner-deployment-wt5j7-xm7vv   2/2     Terminating   0          33h
Cluster Upgrade
One of my clusters was still having issues. Before I respun the whole thing, I decided to try two things.
Removing Unusued Monitoring
First, uninstall the APM I was not actively using
$ kubectl delete -f https://github.com/Dynatrace/dynatrace-operator/releases/download/v0.10.0/kubernetes.yaml && kubectl delete ns dynatrace &
Upgrade Dapr
I upgraded to the latest Dapr version for the cluster
$ dapr upgrade -k --runtime-version=1.9.5
ℹ️  Container images will be pulled from Docker Hub
ℹ️  Dapr control plane version 1.9.5 detected in namespace dapr-system
ℹ️  Starting upgrade...
✅  Dapr control plane successfully upgraded to version 1.9.5. Make sure your deployments are restarted to pick up the latest sidecar version.
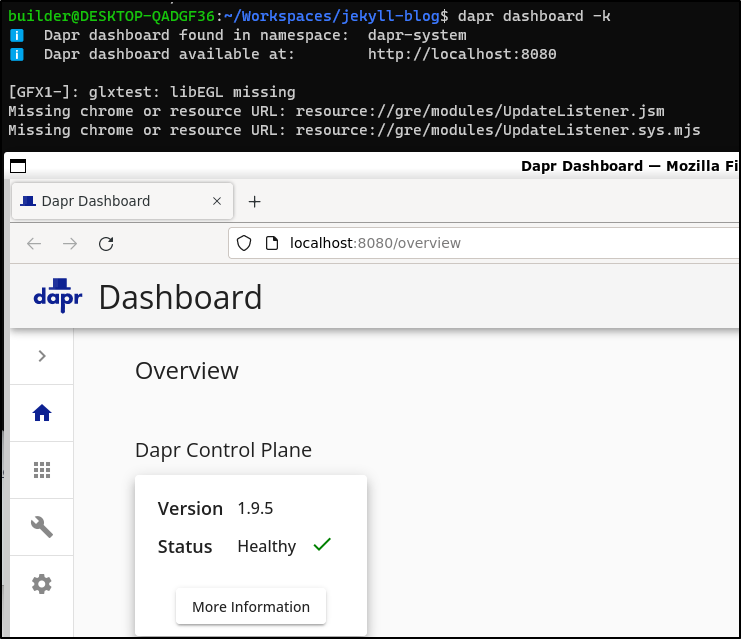
We can use dapr dashboard -k to show the Dapr version
Upgrade K3s
We can use the automated upgrade to easily (albeit slowly) upgrade a cluster.
First add the Rancher upgrade controller
$ kubectl apply -f https://github.com/rancher/system-upgrade-controller/releases/latest/download/system-upgrade-controller.yaml
namespace/system-upgrade created
serviceaccount/system-upgrade created
clusterrolebinding.rbac.authorization.k8s.io/system-upgrade created
configmap/default-controller-env created
deployment.apps/system-upgrade-controller created
Then apply the plan. Here I’ll go to 1.24.6
$ cat k3s.1246.plan.yaml
apiVersion: upgrade.cattle.io/v1
kind: Plan
metadata:
  name: server-plan
  namespace: system-upgrade
spec:
  concurrency: 1
  cordon: true
  nodeSelector:
    matchExpressions:
    - key: node-role.kubernetes.io/master
      operator: In
      values:
      - "true"
  serviceAccountName: system-upgrade
  upgrade:
    image: rancher/k3s-upgrade
  version: v1.24.6+k3s1
---
# Agent plan
apiVersion: upgrade.cattle.io/v1
kind: Plan
metadata:
  name: agent-plan
  namespace: system-upgrade
spec:
  concurrency: 1
  cordon: true
  nodeSelector:
    matchExpressions:
    - key: node-role.kubernetes.io/master
      operator: DoesNotExist
  prepare:
    args:
    - prepare
    - server-plan
    image: rancher/k3s-upgrade
  serviceAccountName: system-upgrade
  upgrade:
    image: rancher/k3s-upgrade
  version: v1.24.6+k3s1
Then Apply
builder@DESKTOP-QADGF36:~/Workspaces/jekyll-blog$ vi k3s.1246.plan.yaml
builder@DESKTOP-QADGF36:~/Workspaces/jekyll-blog$ kubectl apply -f k3s.1246.plan.yaml
plan.upgrade.cattle.io/server-plan created
plan.upgrade.cattle.io/agent-plan created
And when done
$ kubectl get nodes
NAME                  STATUS   ROLES                  AGE   VERSION
anna-macbookair       Ready    control-plane,master   42d   v1.24.6+k3s1
builder-macbookpro2   Ready    <none>                 42d   v1.24.6+k3s1
isaac-macbookpro      Ready    <none>                 42d   v1.24.6+k3s1
Dapr was still crashing, giving no error message as to why
$ kubectl get pods
NAME                                                   READY   STATUS             RESTARTS           AGE
zipkin-57797dd5db-lqvcg                                1/1     Running            1 (2d ago)         15d
vote-back-azure-vote-1672065561-7667b49cf6-wqdm7       1/1     Running            1 (2d ago)         31d
vote-front-azure-vote-1672065561-6b4f7dcb7d-xf6vd      1/1     Running            1 (2d ago)         31d
my-dd-release-datadog-t2948                            4/4     Running            0                  73m
my-dd-release-datadog-clusterchecks-869f58b848-2njz5   1/1     Running            0                  73m
redis-master-0                                         1/1     Running            1 (2d ago)         42d
my-dd-release-datadog-clusterchecks-869f58b848-x7n4b   1/1     Running            0                  73m
my-dd-release-datadog-xrh5t                            4/4     Running            0                  73m
my-dd-release-datadog-cluster-agent-6445dfc8c9-6dhlq   1/1     Running            0                  73m
my-dd-release-datadog-cluster-agent-6445dfc8c9-q4bbh   1/1     Running            0                  73m
my-dd-release-datadog-dcbzv                            4/4     Running            0                  73m
csharp-subscriber-66b7c5bcbc-d6s8d                     1/2     CrashLoopBackOff   1019 (4m35s ago)   27d
react-form-764468d8b-9j6tl                             1/2     CrashLoopBackOff   1019 (4m23s ago)   27d
my-opentelemetry-collector-5854db788f-cxcrv            0/1     CrashLoopBackOff   17 (3m36s ago)     32m
redis-replicas-1                                       0/1     CrashLoopBackOff   743 (3m ago)       42d
python-subscriber-79986596f9-cjkll                     1/2     CrashLoopBackOff   1026 (2m51s ago)   27d
redis-replicas-2                                       0/1     CrashLoopBackOff   750 (2m48s ago)    42d
pythonapp-7c9b7f7966-q7dh6                             1/2     CrashLoopBackOff   1023 (2m47s ago)   27d
node-subscriber-6d99bd4bd7-nbf9l                       1/2     CrashLoopBackOff   1024 (92s ago)     27d
nodeapp-679885bdf8-92wqz                               1/2     CrashLoopBackOff   1023 (61s ago)     27d
calculator-front-end-6694bbfdf-4p8kn                   1/2     CrashLoopBackOff   5 (37s ago)        4m2s
addapp-677b754f58-n94sg                                1/2     CrashLoopBackOff   5 (25s ago)        4m2s
divideapp-585848cf4d-rp4kk                             1/2     CrashLoopBackOff   5 (25s ago)        4m2s
multiplyapp-bdbdf4b5-44bl4                             1/2     CrashLoopBackOff   5 (25s ago)        4m2s
subtractapp-6c449d8cb9-kjkz4                           1/2     Running            6 (97s ago)        4m2s
redis-replicas-0                                       0/1     Running            803 (3m10s ago)    42d
I decided to backup the configs then uninstall Dapr
$ kubectl get component orderpubsub -o yaml > dapr.mac81.orderpubsub.yaml
$ kubectl get component pubsub -o yaml > dapr.mac81.pubsub.yaml
$ kubectl get component statestore -o yaml > dapr.mac81.statestore.yaml
$ kubectl get configuration appconfig -o yaml > dapr.mac81.appconfig.yaml
$ dapr uninstall -k
ℹ️  Removing Dapr from your cluster...
✅  Dapr has been removed successfully
I can then re-install Dapr
builder@DESKTOP-QADGF36:~/Workspaces/jekyll-blog$ dapr init -k
⌛  Making the jump to hyperspace...
ℹ️  Note: To install Dapr using Helm, see here: https://docs.dapr.io/getting-started/install-dapr-kubernetes/#install-with-helm-advanced

ℹ️  Container images will be pulled from Docker Hub
✅  Deploying the Dapr control plane to your cluster...
✅  Success! Dapr has been installed to namespace dapr-system. To verify, run `dapr status -k' in your terminal. To get started, go here: https://aka.ms/dapr-getting-started
builder@DESKTOP-QADGF36:~/Workspaces/jekyll-blog$ dapr status -k
  NAME                   NAMESPACE    HEALTHY  STATUS                       REPLICAS  VERSION  AGE  CREATED
  dapr-sidecar-injector  dapr-system  False    Running                      1         1.9.5    4s   2023-01-27 08:05.41
  dapr-dashboard         dapr-system  False    Waiting (ContainerCreating)  1         0.11.0   4s   2023-01-27 08:05.41
  dapr-operator          dapr-system  False    Waiting (ContainerCreating)  1         1.9.5    5s   2023-01-27 08:05.41
  dapr-sentry            dapr-system  False    Running                      1         1.9.5    5s   2023-01-27 08:05.41
  dapr-placement-server  dapr-system  False    Running                      1         1.9.5    5s   2023-01-27 08:05.41

$ dapr status -k
  NAME                   NAMESPACE    HEALTHY  STATUS   REPLICAS  VERSION  AGE  CREATED
  dapr-sentry            dapr-system  True     Running  1         1.9.5    36s  2023-01-27 08:05.41
  dapr-placement-server  dapr-system  True     Running  1         1.9.5    36s  2023-01-27 08:05.41
  dapr-operator          dapr-system  True     Running  1         1.9.5    36s  2023-01-27 08:05.41
  dapr-dashboard         dapr-system  True     Running  1         0.11.0   36s  2023-01-27 08:05.41
  dapr-sidecar-injector  dapr-system  True     Running  1         1.9.5    36s  2023-01-27 08:05.41
I rotated all the Dapr instrumented pods
$ kubectl delete pods `kubectl get po -o=jsonpath='{.items[?(@.metadata.annotations.dapr\.io/enabled=="true")].metadata.name}'`
pod "csharp-subscriber-66b7c5bcbc-d6s8d" deleted
pod "react-form-764468d8b-9j6tl" deleted
pod "subtractapp-6c449d8cb9-f9tbz" deleted
pod "addapp-677b754f58-q6cbx" deleted
pod "calculator-front-end-6694bbfdf-sgdrv" deleted
pod "divideapp-585848cf4d-7dlvz" deleted
pod "multiplyapp-bdbdf4b5-btt4d" deleted
pod "python-subscriber-79986596f9-cjkll" deleted
pod "pythonapp-7c9b7f7966-q7dh6" deleted
pod "node-subscriber-6d99bd4bd7-nbf9l" deleted
pod "nodeapp-679885bdf8-92wqz" deleted
I will wait and see if I can restore the pods. So far they keep failing, as does Otel
$ kubectl get pods
NAME                                                   READY   STATUS             RESTARTS          AGE
zipkin-57797dd5db-lqvcg                                1/1     Running            1 (2d1h ago)      15d
vote-back-azure-vote-1672065561-7667b49cf6-wqdm7       1/1     Running            1 (2d1h ago)      31d
vote-front-azure-vote-1672065561-6b4f7dcb7d-xf6vd      1/1     Running            1 (2d ago)        31d
my-dd-release-datadog-t2948                            4/4     Running            0                 106m
my-dd-release-datadog-clusterchecks-869f58b848-2njz5   1/1     Running            0                 106m
redis-master-0                                         1/1     Running            1 (2d ago)        42d
my-dd-release-datadog-clusterchecks-869f58b848-x7n4b   1/1     Running            0                 106m
my-dd-release-datadog-xrh5t                            4/4     Running            0                 106m
my-dd-release-datadog-cluster-agent-6445dfc8c9-6dhlq   1/1     Running            0                 106m
my-dd-release-datadog-cluster-agent-6445dfc8c9-q4bbh   1/1     Running            0                 106m
my-dd-release-datadog-dcbzv                            4/4     Running            0                 106m
redis-replicas-1                                       0/1     CrashLoopBackOff   751 (4m37s ago)   42d
redis-replicas-2                                       0/1     CrashLoopBackOff   758 (4m32s ago)   42d
my-opentelemetry-collector-6775c5b8c9-srw95            0/1     CrashLoopBackOff   8 (2m8s ago)      14m
my-opentelemetry-collector-7f57d8db64-8pm7v            0/1     CrashLoopBackOff   6 (54s ago)       6m34s
redis-replicas-0                                       0/1     Running            811 (86s ago)     42d
calculator-front-end-6694bbfdf-6n8t8                   1/2     CrashLoopBackOff   3 (26s ago)       2m3s
addapp-677b754f58-g5skl                                1/2     CrashLoopBackOff   3 (27s ago)       2m3s
react-form-764468d8b-z8fnm                             1/2     Running            2 (33s ago)       2m3s
divideapp-585848cf4d-gbgdj                             1/2     Running            2 (32s ago)       2m3s
csharp-subscriber-66b7c5bcbc-6qkrs                     1/2     CrashLoopBackOff   3 (20s ago)       2m3s
node-subscriber-6d99bd4bd7-rph2q                       1/2     Running            2 (27s ago)       2m3s
pythonapp-7c9b7f7966-pftm7                             1/2     Running            5 (8s ago)        2m3s
subtractapp-6c449d8cb9-mrkmc                           1/2     Running            5 (8s ago)        2m3s
nodeapp-679885bdf8-mfjdx                               1/2     Running            2 (26s ago)       2m3s
python-subscriber-79986596f9-jkvfp                     1/2     Running            5 (3s ago)        2m3s
multiplyapp-bdbdf4b5-jfvs6                             1/2     Running            5 (2s ago)        2m3s
I always have the option of resetting the cluster as mac81 is my demo cluster
Summary
This was just a quick post to cover some of the troubles I had resetting my system.
We talked about updating Harbor when the database moves, covered updating nodes when the master k3s changes IP, and fixing APM settings for Datadog. We also showed how to find and fix problematic nodes. We attempted to fix a secondary cluster by upgrading everything - from Dapr to the K3s version itself.
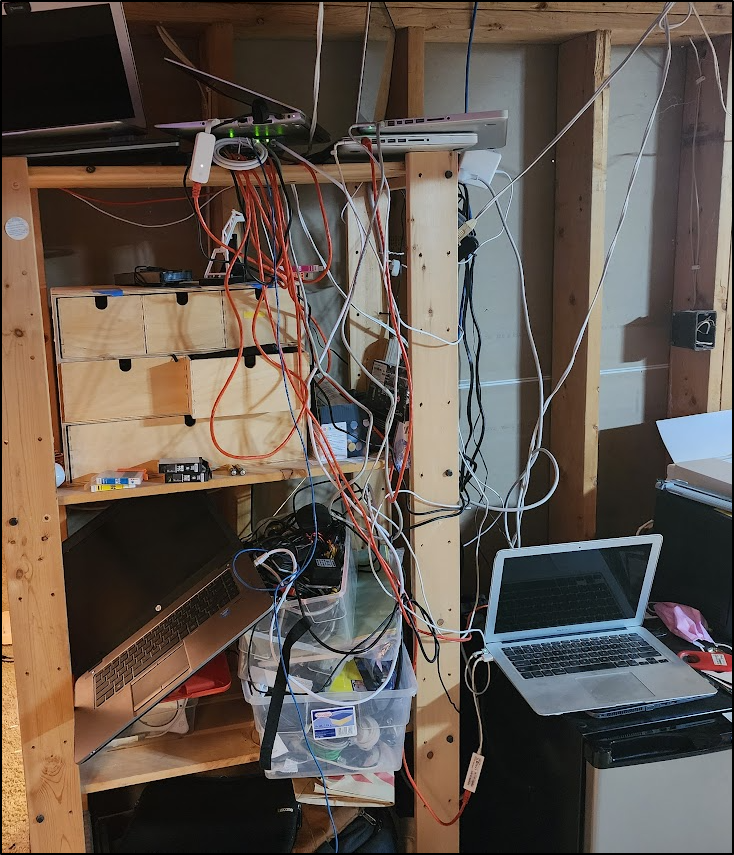
I should note, there is something to be said about organizing a rack as well. Over time, the space had gotten out of control:
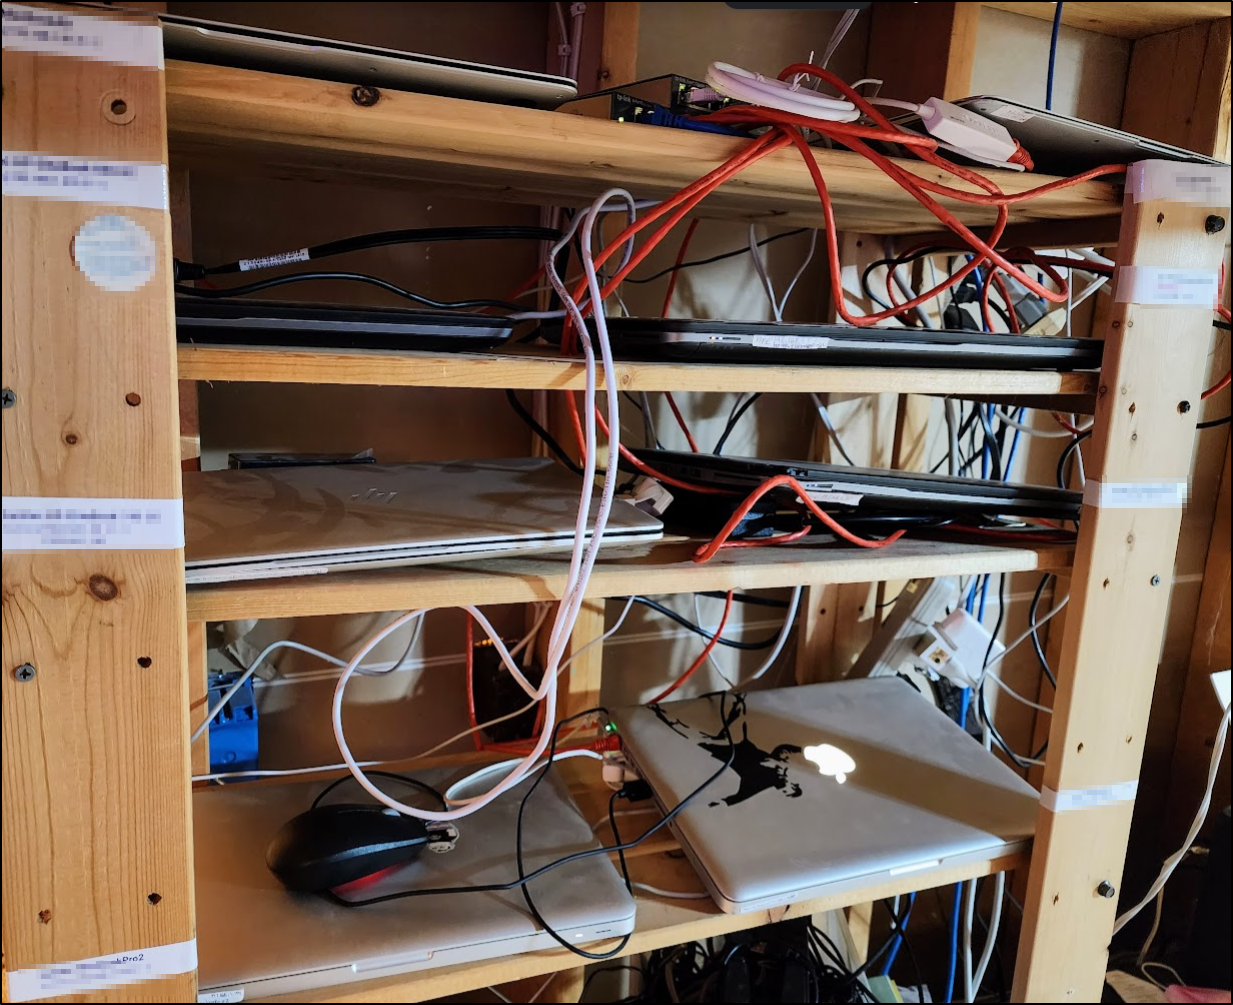
I stopped, built up new shelves, and reorganized the machines with proper lables
It is now much easier to access and address individual machines and I’m glad I took a short amount of time to improve it.


