Published: Jan 3, 2023 by Isaac Johnson
We’ve covered much of Dynatrace in our last two posts, but we have yet to use in production. Today we’ll install into a primary cluster and test.
We will look at profiling and optimization, then alerting with PagerDuty, MS Teams, and the mobile app. Lastly, we’ll wrap the series discussing usage and thoughts on costs and “buy now”.
Testing on Production Cluster
Having seen that I was able to remove the test cluster, I’ll apply to my production cluster
$ kubectl create namespace dynatrace
namespace/dynatrace created

$ kubectl apply -f https://github.com/Dynatrace/dynatrace-operator/releases/download/v0.10.0/kubernetes.yaml
poddisruptionbudget.policy/dynatrace-webhook created
serviceaccount/dynatrace-activegate created
serviceaccount/dynatrace-kubernetes-monitoring created
serviceaccount/dynatrace-dynakube-oneagent-privileged created
serviceaccount/dynatrace-dynakube-oneagent-unprivileged created
serviceaccount/dynatrace-operator created
serviceaccount/dynatrace-webhook created
customresourcedefinition.apiextensions.k8s.io/dynakubes.dynatrace.com created
clusterrole.rbac.authorization.k8s.io/dynatrace-kubernetes-monitoring created
clusterrole.rbac.authorization.k8s.io/dynatrace-operator created
clusterrole.rbac.authorization.k8s.io/dynatrace-webhook created
clusterrolebinding.rbac.authorization.k8s.io/dynatrace-kubernetes-monitoring created
clusterrolebinding.rbac.authorization.k8s.io/dynatrace-operator created
clusterrolebinding.rbac.authorization.k8s.io/dynatrace-webhook created
role.rbac.authorization.k8s.io/dynatrace-operator created
role.rbac.authorization.k8s.io/dynatrace-webhook created
rolebinding.rbac.authorization.k8s.io/dynatrace-operator created
rolebinding.rbac.authorization.k8s.io/dynatrace-webhook created
service/dynatrace-webhook created
deployment.apps/dynatrace-operator created
deployment.apps/dynatrace-webhook created
mutatingwebhookconfiguration.admissionregistration.k8s.io/dynatrace-webhook created
validatingwebhookconfiguration.admissionregistration.k8s.io/dynatrace-webhook created

$ kubectl -n dynatrace wait pod --for=condition=ready --selector=app.kubernetes.io/name=dynatrace-operator,app.kubernetes.io/component=webhook --timeout=300s
pod/dynatrace-webhook-b9c6bd86b-lgwnx condition met
pod/dynatrace-webhook-b9c6bd86b-4fxvl condition met

$ kubectl apply -f /mnt/c/Users/isaac/Downloads/dynakube77.yaml
secret/k3smac77 created
dynakube.dynatrace.com/k3smac77 created
My first test will be to see that the GH Actions runner works (frankly by pushing this commit).
I can see all the pods are fine
$ kubectl get pods --all-namespaces
NAMESPACE NAME READY STATUS RESTARTS AGE
test kaniko 0/1 Completed 0 146d
kube-system svclb-azure-vote-front-789db446-6dqnj 0/1 Pending 0 152d
kube-system svclb-azure-vote-front-789db446-qks9x 0/1 Pending 0 152d
kube-system svclb-azure-vote-front-789db446-rrt74 0/1 Pending 0 145d
kube-system svclb-sonarqube-ce-bc1d9b4c-znxdd 0/2 Pending 0 94d
kube-system svclb-react-form-25f016ef-bthrm 0/1 Pending 0 145d
kube-system svclb-react-form-25f016ef-th7xl 0/1 Pending 0 153d
kube-system svclb-sonarqube-ce-bc1d9b4c-r47p4 0/2 Pending 0 94d
kube-system svclb-react-form-25f016ef-lvghd 0/1 Pending 0 153d
kube-system svclb-sonarqube-ce-bc1d9b4c-mt55s 0/2 Pending 0 94d
kube-system svclb-sonarqube-ce-bc1d9b4c-2hqc7 0/2 Pending 0 94d
kube-system svclb-azure-vote-front-789db446-jpq9t 0/1 Pending 0 152d
dapr-system dapr-dashboard-9445ffcb5-2tws5 1/1 Running 0 153d
default nginx-ingress-release-nginx-ingress-5bb8867c98-pjdkr 1/1 Running 0 151d
default vote-front-azure-vote-7ddd5967c8-s4zvn 1/1 Running 0 152d
default node-subscriber-6d99bd4bd7-42wnw 2/2 Running 0 152d
default react-form-764468d8b-fjfmz 2/2 Running 0 152d
default my-dd-release-datadog-blp8l 4/4 Running 0 153d
default new-kafka-release-0 1/1 Running 1 (152d ago) 152d
default azure-vote-back-6fcdc5cbd5-wgj8q 1/1 Running 0 151d
default redis-replicas-0 1/1 Running 14 (25d ago) 153d
default argo-cd-argocd-repo-server-75c6f9c555-b9cwf 1/1 Running 0 51d
kube-system local-path-provisioner-6c79684f77-9qvpf 1/1 Running 0 151d
kube-system svclb-next-kafka-release-0-external-3983744f-gzdq2 1/1 Running 0 36d
dapr-system dapr-placement-server-0 1/1 Running 0 153d
test my-nginx-5dc8c6c4cd-qpbt4 1/1 Running 0 146d
default argo-cd-argocd-redis-75f748669c-9gcng 1/1 Running 0 51d
dapr-system dapr-sentry-74cdff5467-n6zdb 1/1 Running 0 153d
loft loft-844859c9c7-xfdq5 1/1 Running 0 51d
default new-kafka-release-zookeeper-0 1/1 Running 0 152d
kube-system coredns-d76bd69b-k57p5 1/1 Running 0 151d
default new-kafka-release-client 1/1 Running 0 39d
dapr-system dapr-sidecar-injector-85bc6b4597-gml88 1/1 Running 0 153d
kube-system svclb-nginx-ingress-release-nginx-ingress-d0903822-5xlqt 2/2 Running 0 153d
default my-dd-release-datadog-clusterchecks-854946dcd8-5b7n7 1/1 Running 0 151d
kube-system svclb-react-form-25f016ef-8k27h 0/1 Pending 0 153d
vcluster-codefresh-working-2-p5gby nginx-ingress-release-nginx-ingress-5bb8867c98-6s7kr-15fb39c8aa 1/1 Running 5 (51d ago) 51d
default next-kafka-release-0 1/1 Running 1 (36d ago) 36d
default next-kafka-release-zookeeper-0 1/1 Running 0 36d
default python-subscriber-79986596f9-78pcd 2/2 Running 0 152d
default harbor-registry2-core-6bd7984ffb-ffzff 1/1 Running 0 56d
default next-kafka-release-client 1/1 Running 0 36d
default argo-cd-argocd-server-55d686dbcb-g2b7z 1/1 Running 0 51d
default my-dd-release-datadog-cluster-agent-6d7c4cdcd4-cgx6g 1/1 Running 4 (51d ago) 153d
default redis-master-0 1/1 Running 0 153d
default harbor-registry2-chartmuseum-7577686667-pkbqp 1/1 Running 0 56d
default azure-vote-front-5f4b8d498-7dj5v 1/1 Running 0 151d
default harbor-registry2-exporter-648f957c7c-zs2cw 1/1 Running 0 56d
kube-system svclb-next-kafka-release-0-external-3983744f-d6pcl 1/1 Running 0 36d
test my-nginx-5dc8c6c4cd-9hhbc 1/1 Running 0 146d
default my-dd-release-datadog-clusterchecks-854946dcd8-h9xxp 1/1 Running 0 153d
default harbor-registry2-jobservice-57bfcc8bc8-zcsm7 1/1 Running 0 56d
default csharp-subscriber-66b7c5bcbc-gpt4c 2/2 Running 0 153d
cert-manager cert-manager-webhook-6c9dd55dc8-gdwsv 1/1 Running 0 151d
default harbor-registry2-redis-0 1/1 Running 0 56d
kube-system svclb-nginx-ingress-release-nginx-ingress-d0903822-9gcxr 2/2 Running 0 153d
default my-dd-release-datadog-hnbl4 4/4 Running 0 153d
default redis-replicas-1 1/1 Running 13 (25d ago) 153d
default harbor-registry2-notary-signer-845658c5bc-s2cf8 1/1 Running 0 51d
default kasarest-deployment-85d4cfbc94-ltcg8 1/1 Running 0 55d
default my-dd-release-kube-state-metrics-6754b98bfd-lxkw9 1/1 Running 0 153d
default vote-back-azure-vote-7ffdcdbb9d-gpqw5 1/1 Running 0 152d
default ubuntu 1/1 Running 0 35d
default my-dd-release-datadog-4l6sw 4/4 Running 8 (35d ago) 145d
kube-system svclb-next-kafka-release-0-external-3983744f-pnqzk 1/1 Running 0 35d
kube-system svclb-nginx-ingress-release-nginx-ingress-d0903822-22662 2/2 Running 4 (35d ago) 145d
default harbor-registry2-trivy-0 1/1 Running 0 35d
default gbwebui-7d8986b8b8-jdjpd 1/1 Running 0 22d
default mypostgres-postgresql-0 1/1 Running 2 (22d ago) 35d
default sonarqube-ce-7f4d8997cb-zrlqr 1/1 Running 7558 (22d ago) 51d
cert-manager cert-manager-64d9bc8b74-kpkjk 1/1 Running 60 (10d ago) 151d
default my-redis-release-redis-cluster-1 0/1 Running 3123 (52d ago) 151d
kube-system svclb-nginx-ingress-release-nginx-ingress-d0903822-jdgtv 2/2 Running 6 (10d ago) 153d
kube-system metrics-server-7cd5fcb6b7-5pq7t 1/1 Running 0 151d
default harbor-registry2-portal-7878768b86-r9qgw 1/1 Running 33 (10d ago) 56d
default kafka-release-2-client 0/1 Unknown 0 39d
kube-system svclb-next-kafka-release-0-external-3983744f-xz9ld 1/1 Running 1 (10d ago) 36d
default nfs-server-provisioner-1658802767-0 1/1 Running 244 (10d ago) 56d
actions-runner-system actions-runner-controller-6d64557877-f5rkc 2/2 Running 204 (10d ago) 51d
default harbor-registry2-registry-78fd5b8f56-fgnn7 2/2 Running 77 (10d ago) 56d
default argo-cd-argocd-application-controller-7f4bd87d6f-gvqb6 1/1 Running 60 (10d ago) 51d
vcluster-codefresh-working-2-p5gby codefresh-working-2-etcd-0 1/1 Running 6 (10d ago) 145d
default nfs-client-provisioner-544798bc88-vkv4d 1/1 Running 215 (10d ago) 51d
loft loft-agent-85d5b44d8b-rd9jt 1/1 Running 90 (10d ago) 145d
default my-dd-release-datadog-62n4p 4/4 Running 20 (10d ago) 153d
vcluster-codefresh-working-2-p5gby codefresh-working-2-controller-6b76577759-bv5ck 1/1 Running 4 (10d ago) 145d
cert-manager cert-manager-cainjector-6db6b64d5f-5dtxc 1/1 Running 140 (10d ago) 151d
default harbor-registry2-notary-server-6b4b47bb86-wlpj8 1/1 Running 12 (10d ago) 56d
vcluster-codefresh-working-2-p5gby codefresh-working-2-api-7f56ccd68f-n5gj9 1/1 Running 24 (10d ago) 145d
vcluster-codefresh-working-2-p5gby codefresh-working-2-75987c48b4-624xw 1/1 Running 328 (10d ago) 145d
default my-redis-release-redis-cluster-3 1/1 Running 11 (10d ago) 151d
adwerx adwerxawx-postgresql-0 1/1 Running 130 (10d ago) 35d
default redis-replicas-2 1/1 Running 12 (10d ago) 151d
default my-redis-release-redis-cluster-5 0/1 Running 13 (10d ago) 151d
default my-redis-release-redis-cluster-2 0/1 Running 8 (10d ago) 151d
vcluster-codefresh-working-2-p5gby coredns-5df468b6b7-6jtvk-x-kube-system-x-codefresh-working-2 1/1 Running 99 (10d ago) 145d
default my-redis-release-redis-cluster-0 0/1 Running 12 (10d ago) 151d
adwerx adwerxawx-68889fdd67-6ch9f 3/3 Running 3 (10d ago) 51d
dapr-system dapr-operator-747cd9748-kdt88 1/1 Running 683 (10d ago) 153d
default python-crfunction-7d44797b8b-g6bfh 2/2 Running 44 (10d ago) 51d
default my-redis-release-redis-cluster-4 0/1 CreateContainerError 3123 (10d ago) 151d
default new-jekyllrunner-deployment-tbq6z-z9q7t 2/2 Running 0 5d2h
default new-jekyllrunner-deployment-tbq6z-dqqjv 2/2 Running 0 40h
default my-dd-release-datadog-cluster-agent-6d7c4cdcd4-vt6j7 1/1 Running 5 (16h ago) 151d
test my-nginx-5dc8c6c4cd-hdfnh 0/1 ImagePullBackOff 0 (52d ago) 146d
dynatrace dynatrace-webhook-b9c6bd86b-9g899 1/1 Running 0 2m8s
dynatrace dynatrace-operator-766c7f4778-2vbpt 1/1 Running 0 2m8s
dynatrace dynatrace-webhook-b9c6bd86b-9sh7h 1/1 Running 0 2m8s
In running the test before, it was my GH Runner that fell down, so I’ll check my pods
$ kubectl get pods --all-namespaces | grep runner
actions-runner-system                actions-runner-controller-6d64557877-f5rkc                        2/2     Running                204 (10d ago)    51d
default                              new-jekyllrunner-deployment-tbq6z-dqqjv                           2/2     Running                0                40h
default                              new-jekyllrunner-deployment-tbq6z-h9svg                           2/2     Running                0                77s

# checking mid build

$ kubectl get pods --all-namespaces | grep runner
actions-runner-system                actions-runner-controller-6d64557877-f5rkc                        2/2     Running                204 (10d ago)    51d
default                              new-jekyllrunner-deployment-tbq6z-dqqjv                           2/2     Running                0                40h
default                              new-jekyllrunner-deployment-tbq6z-h9svg                           2/2     Running                0                3m24s
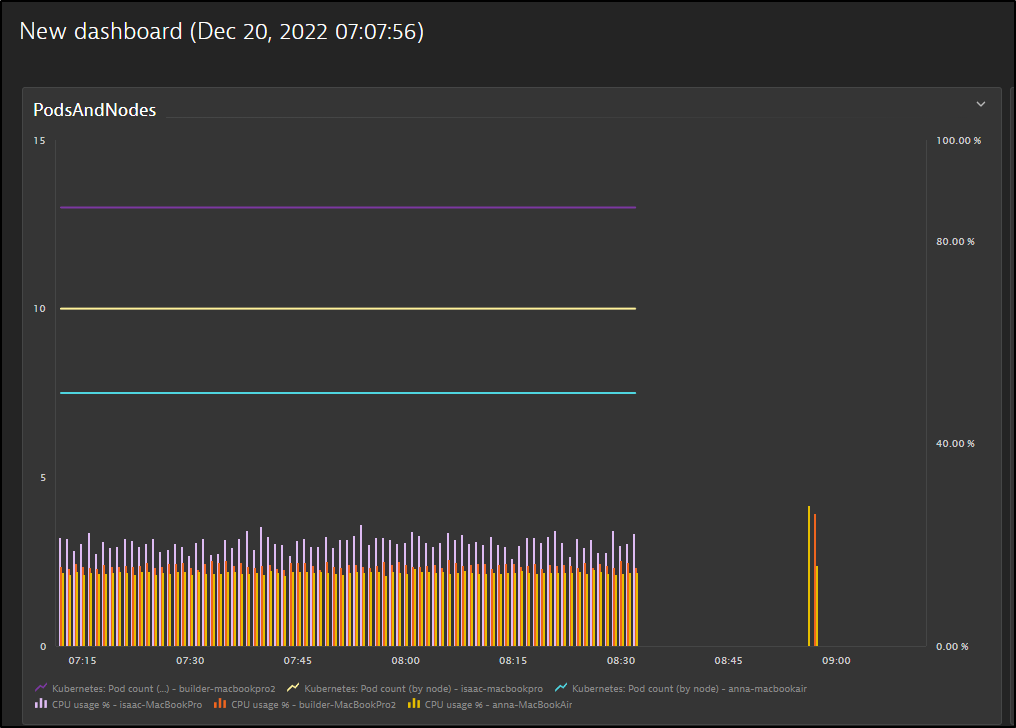
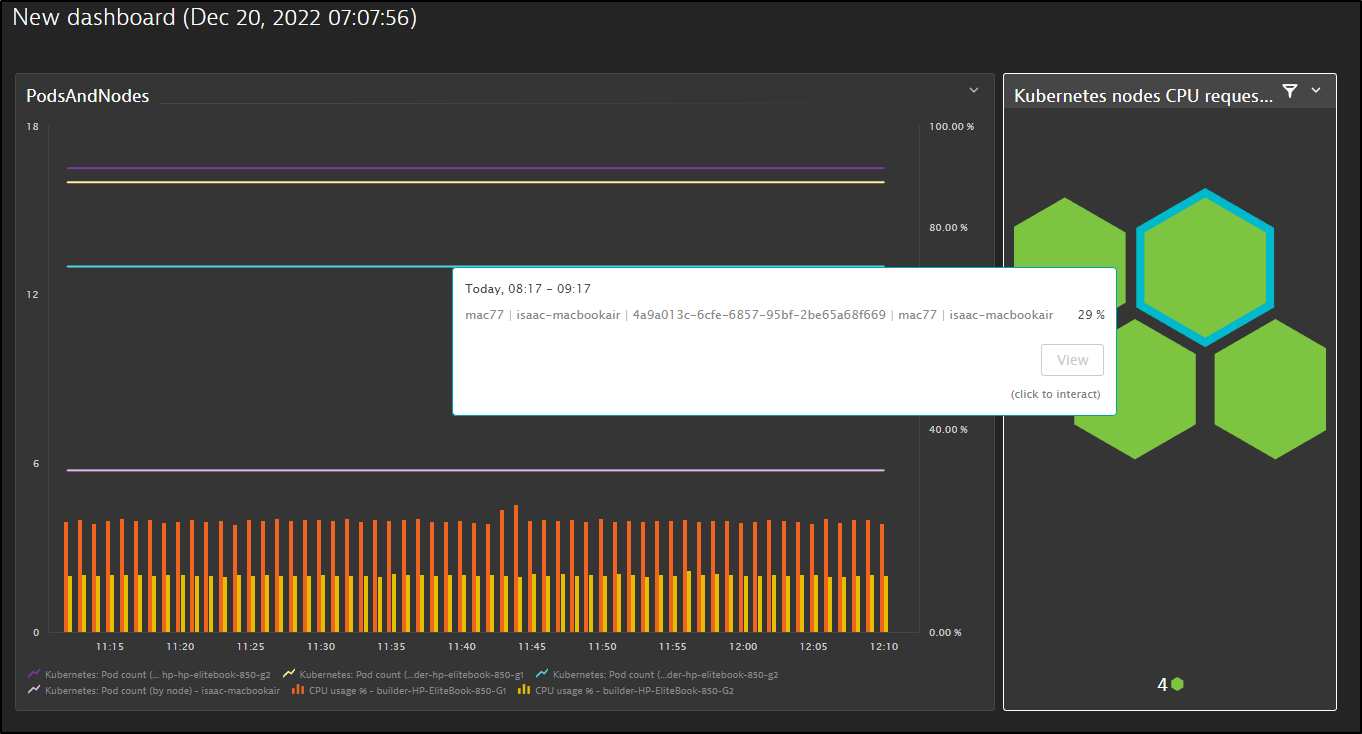
I can see the old cluster stopping and the new cluster starting in my Dynatrace dashboard
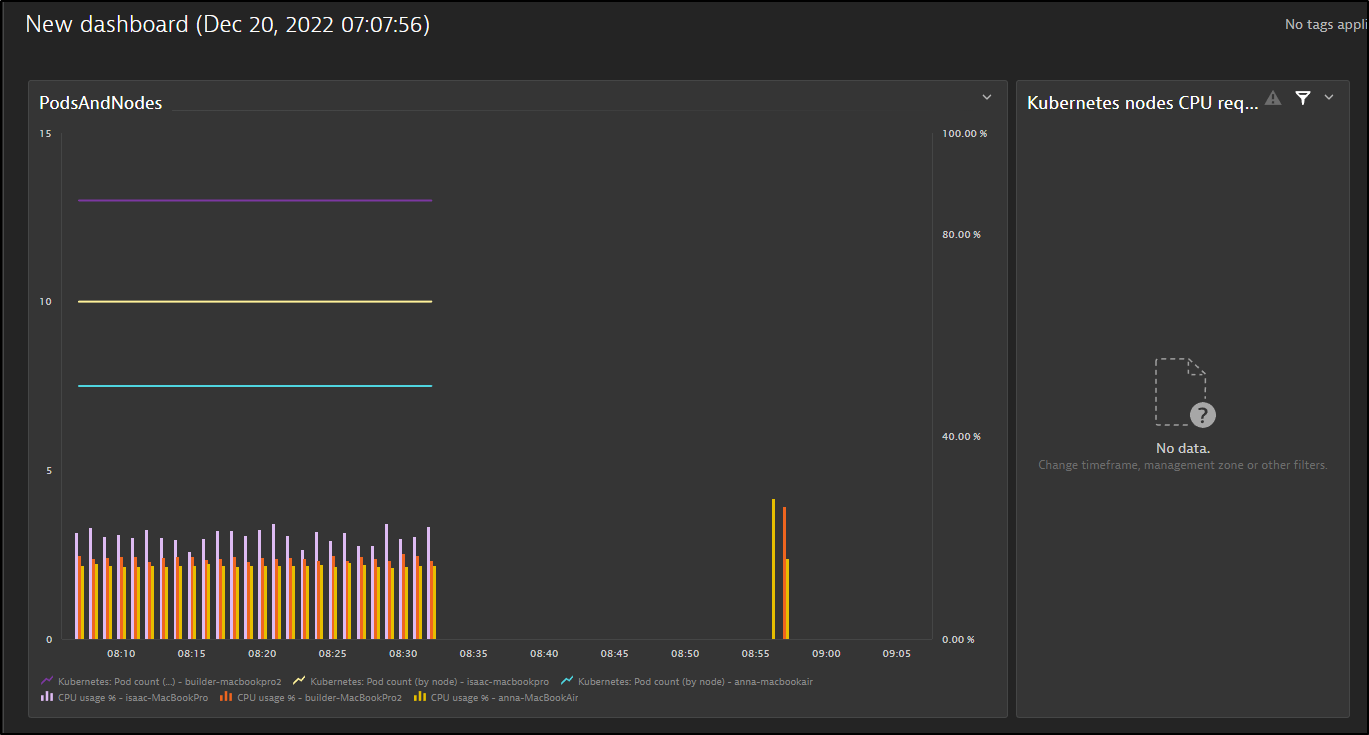
That said, after a while, I did not see data coming in
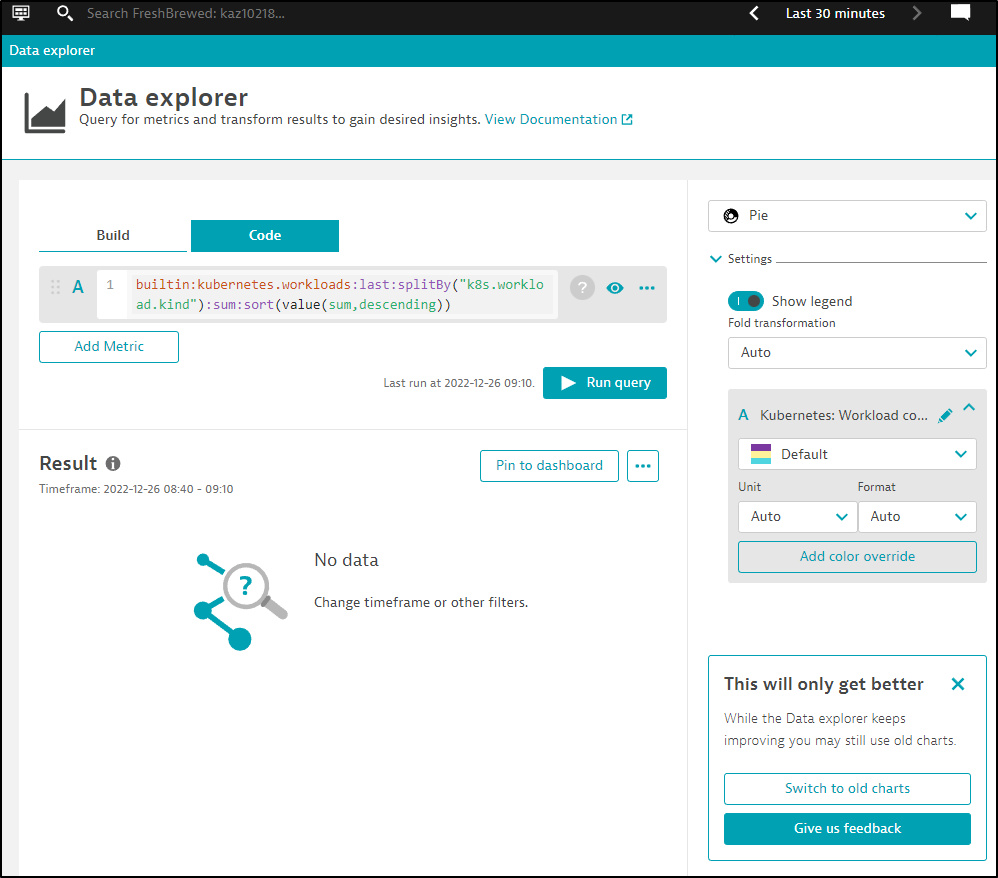
Perhaps I need to use the wizard to add a fresh cluster. I would have assumed I could reuse tokens.
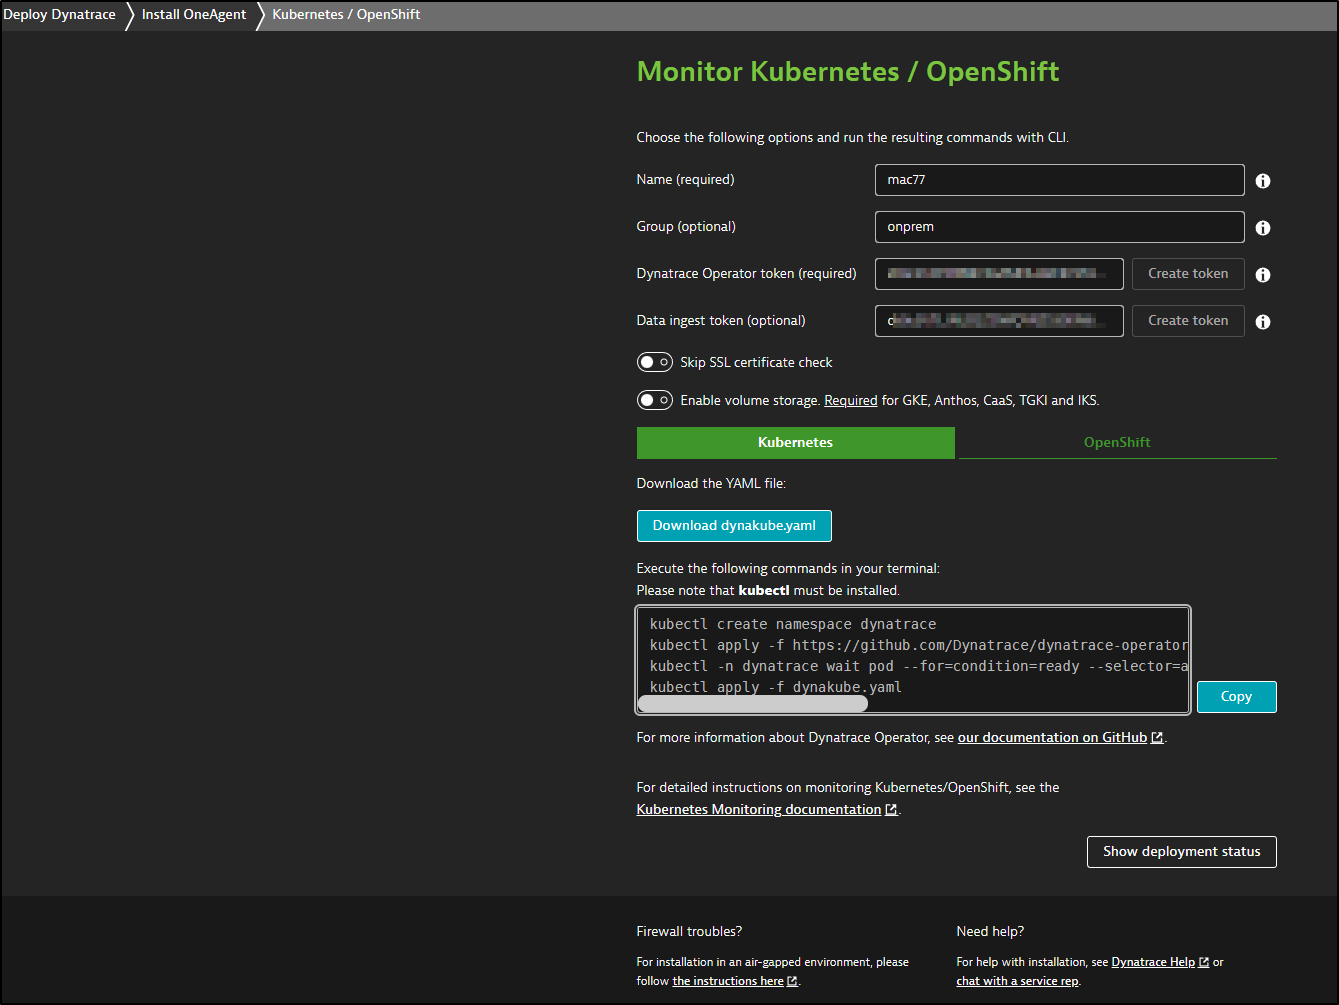
Then I’ll apply it
$ kubectl apply -f /mnt/c/Users/isaac/Downloads/dynakube\ \(1\).yaml
secret/mac77 created
dynakube.dynatrace.com/mac77 created
This time it took
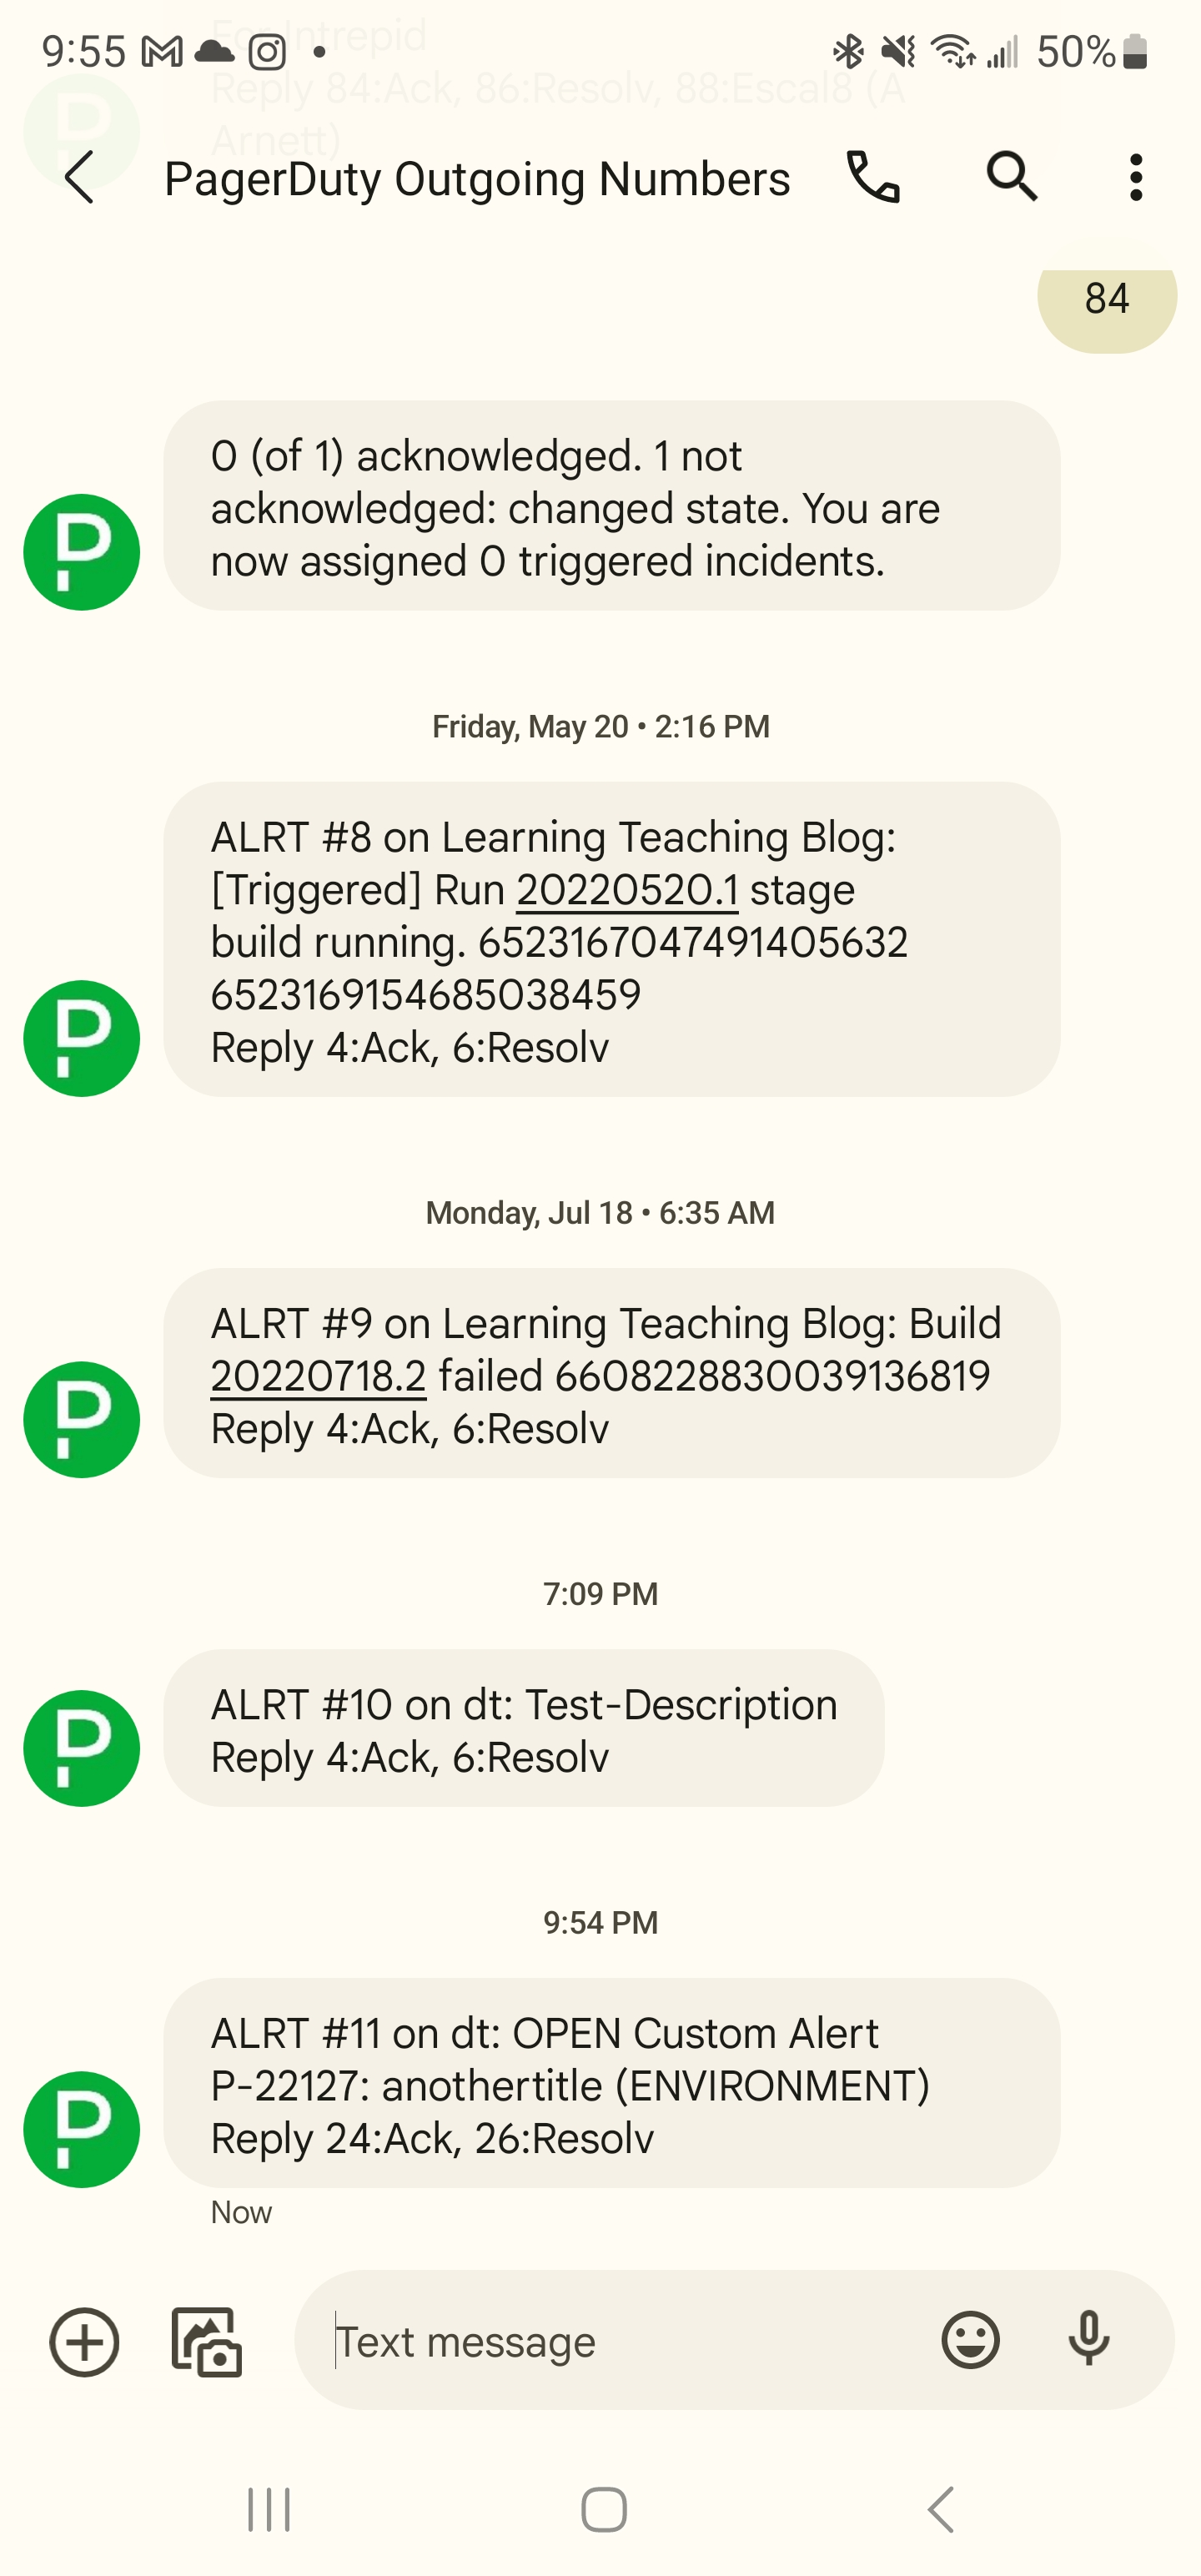
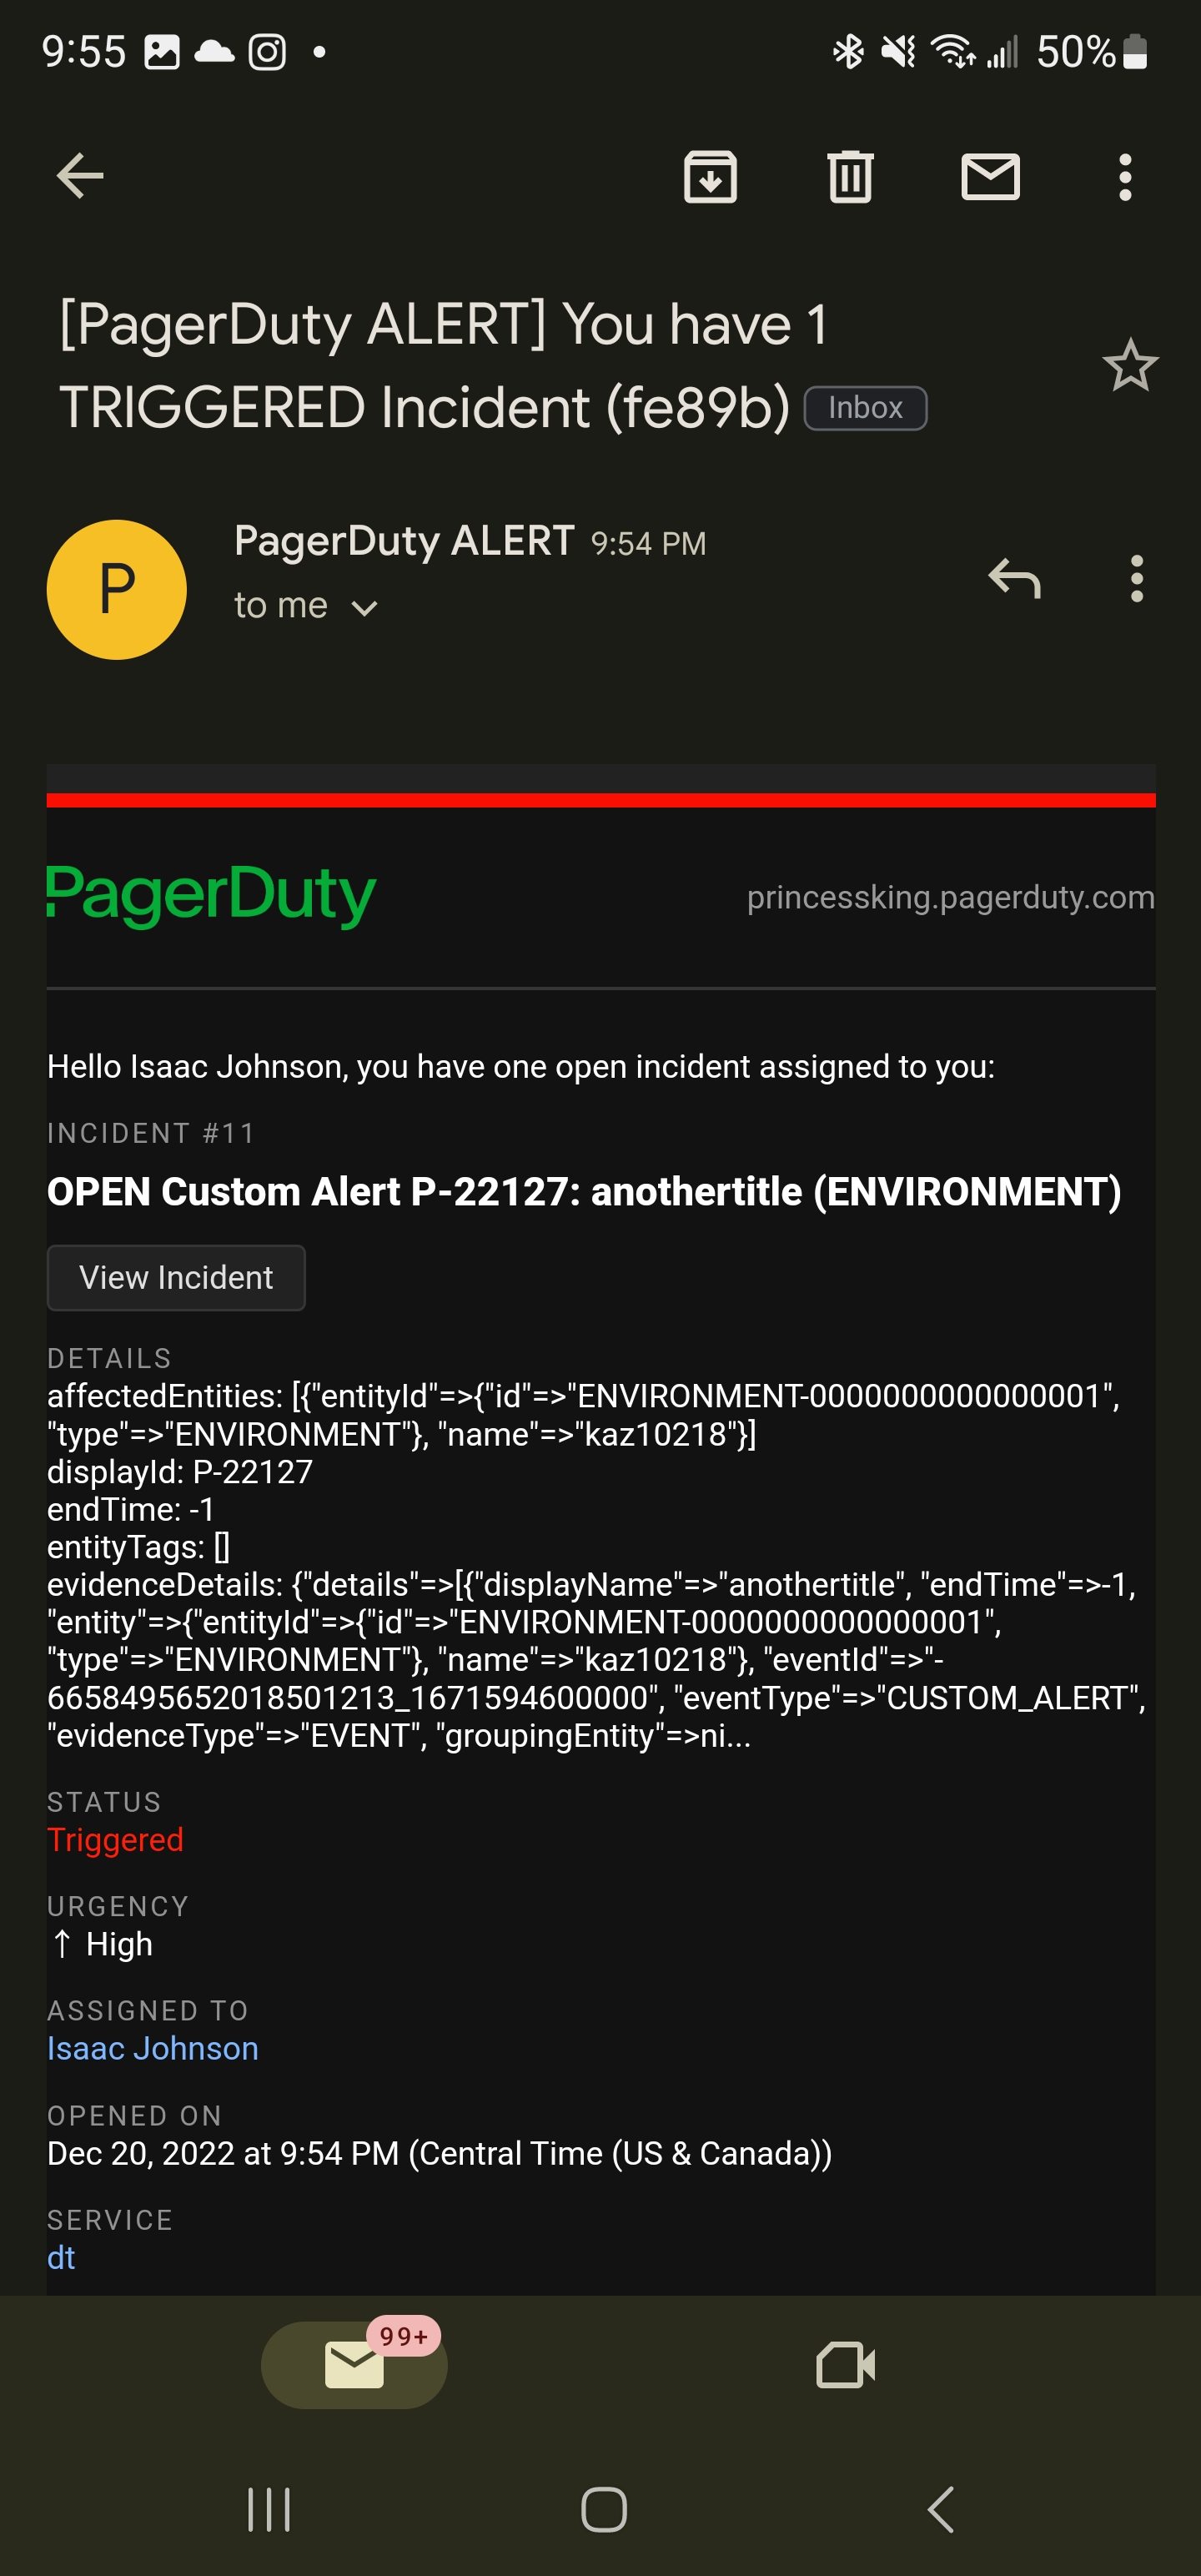
That said, I was getting a lot of DT based PagerDuty Alerts
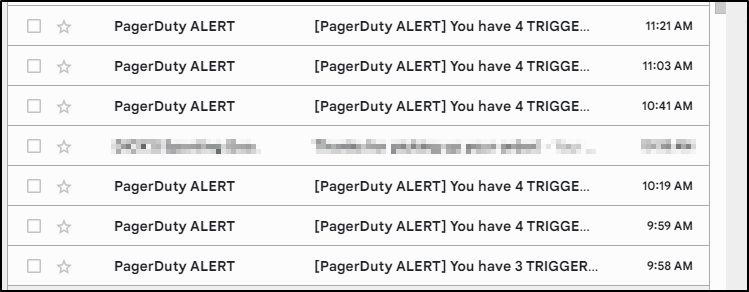
They had detected hosts were now unavailable
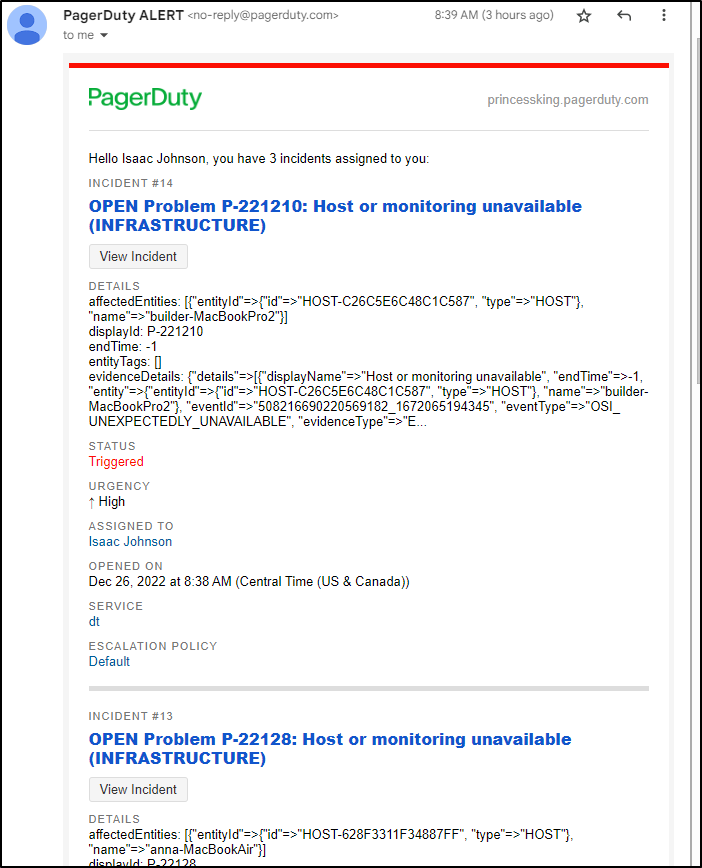
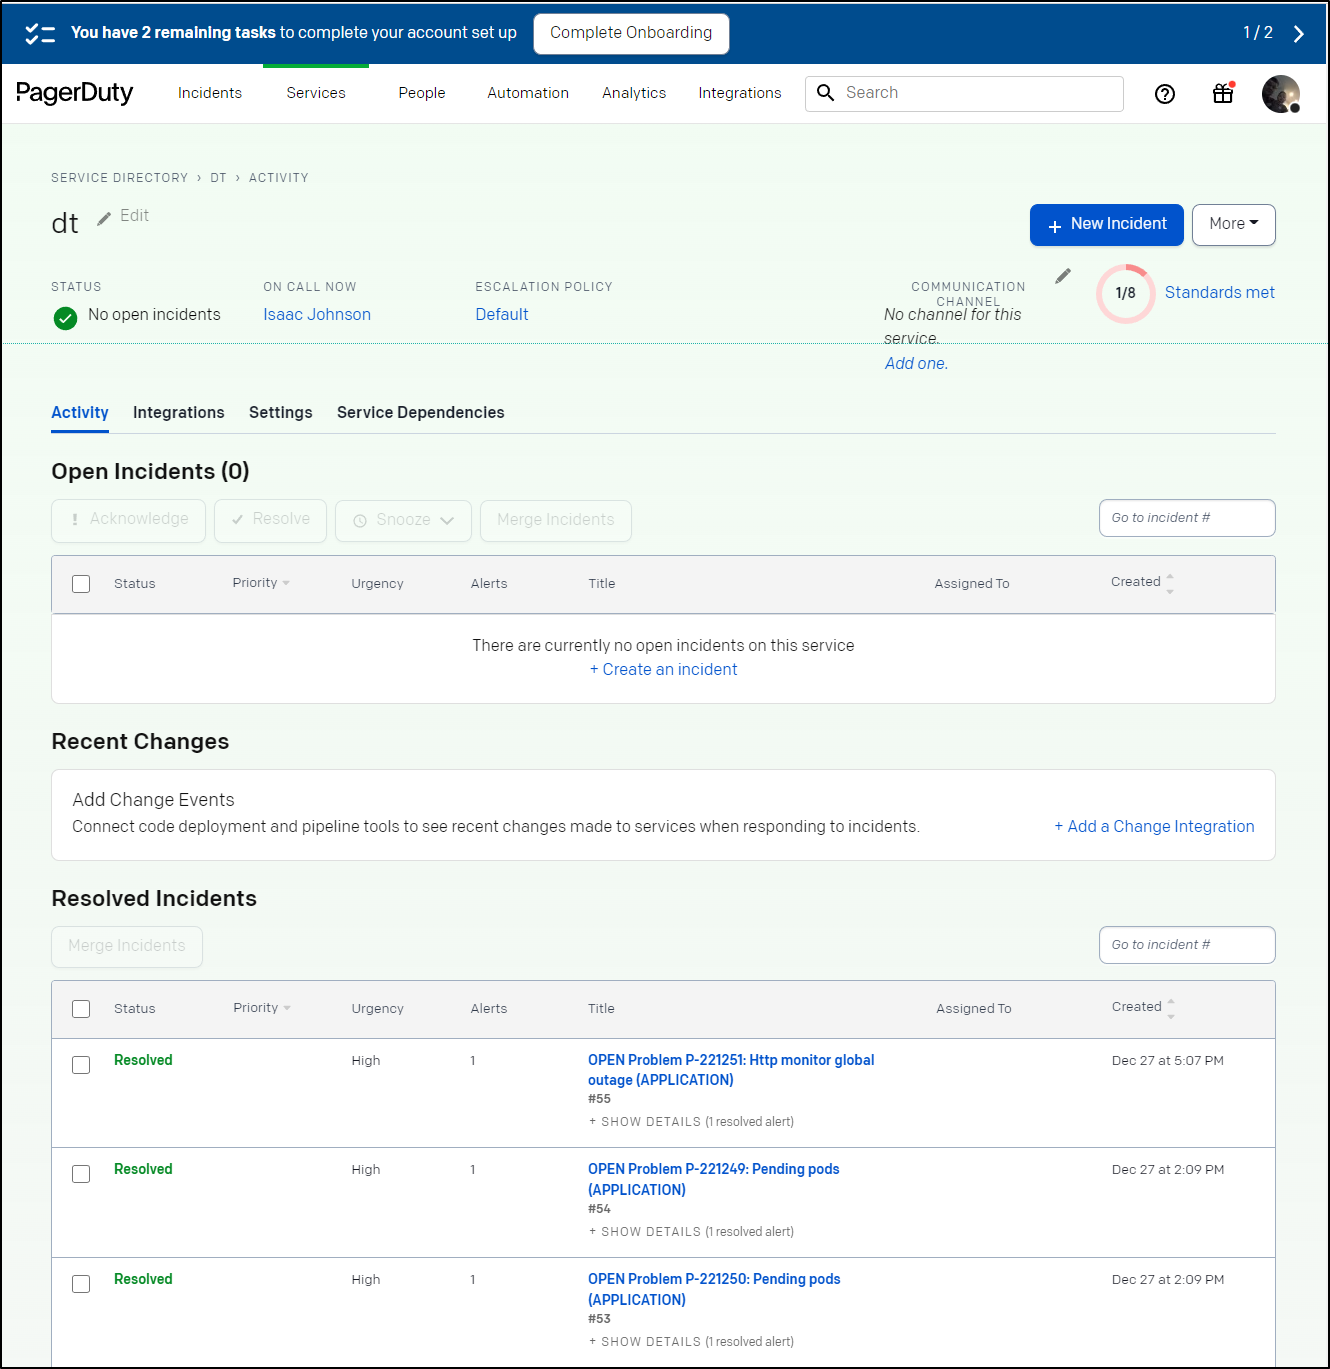
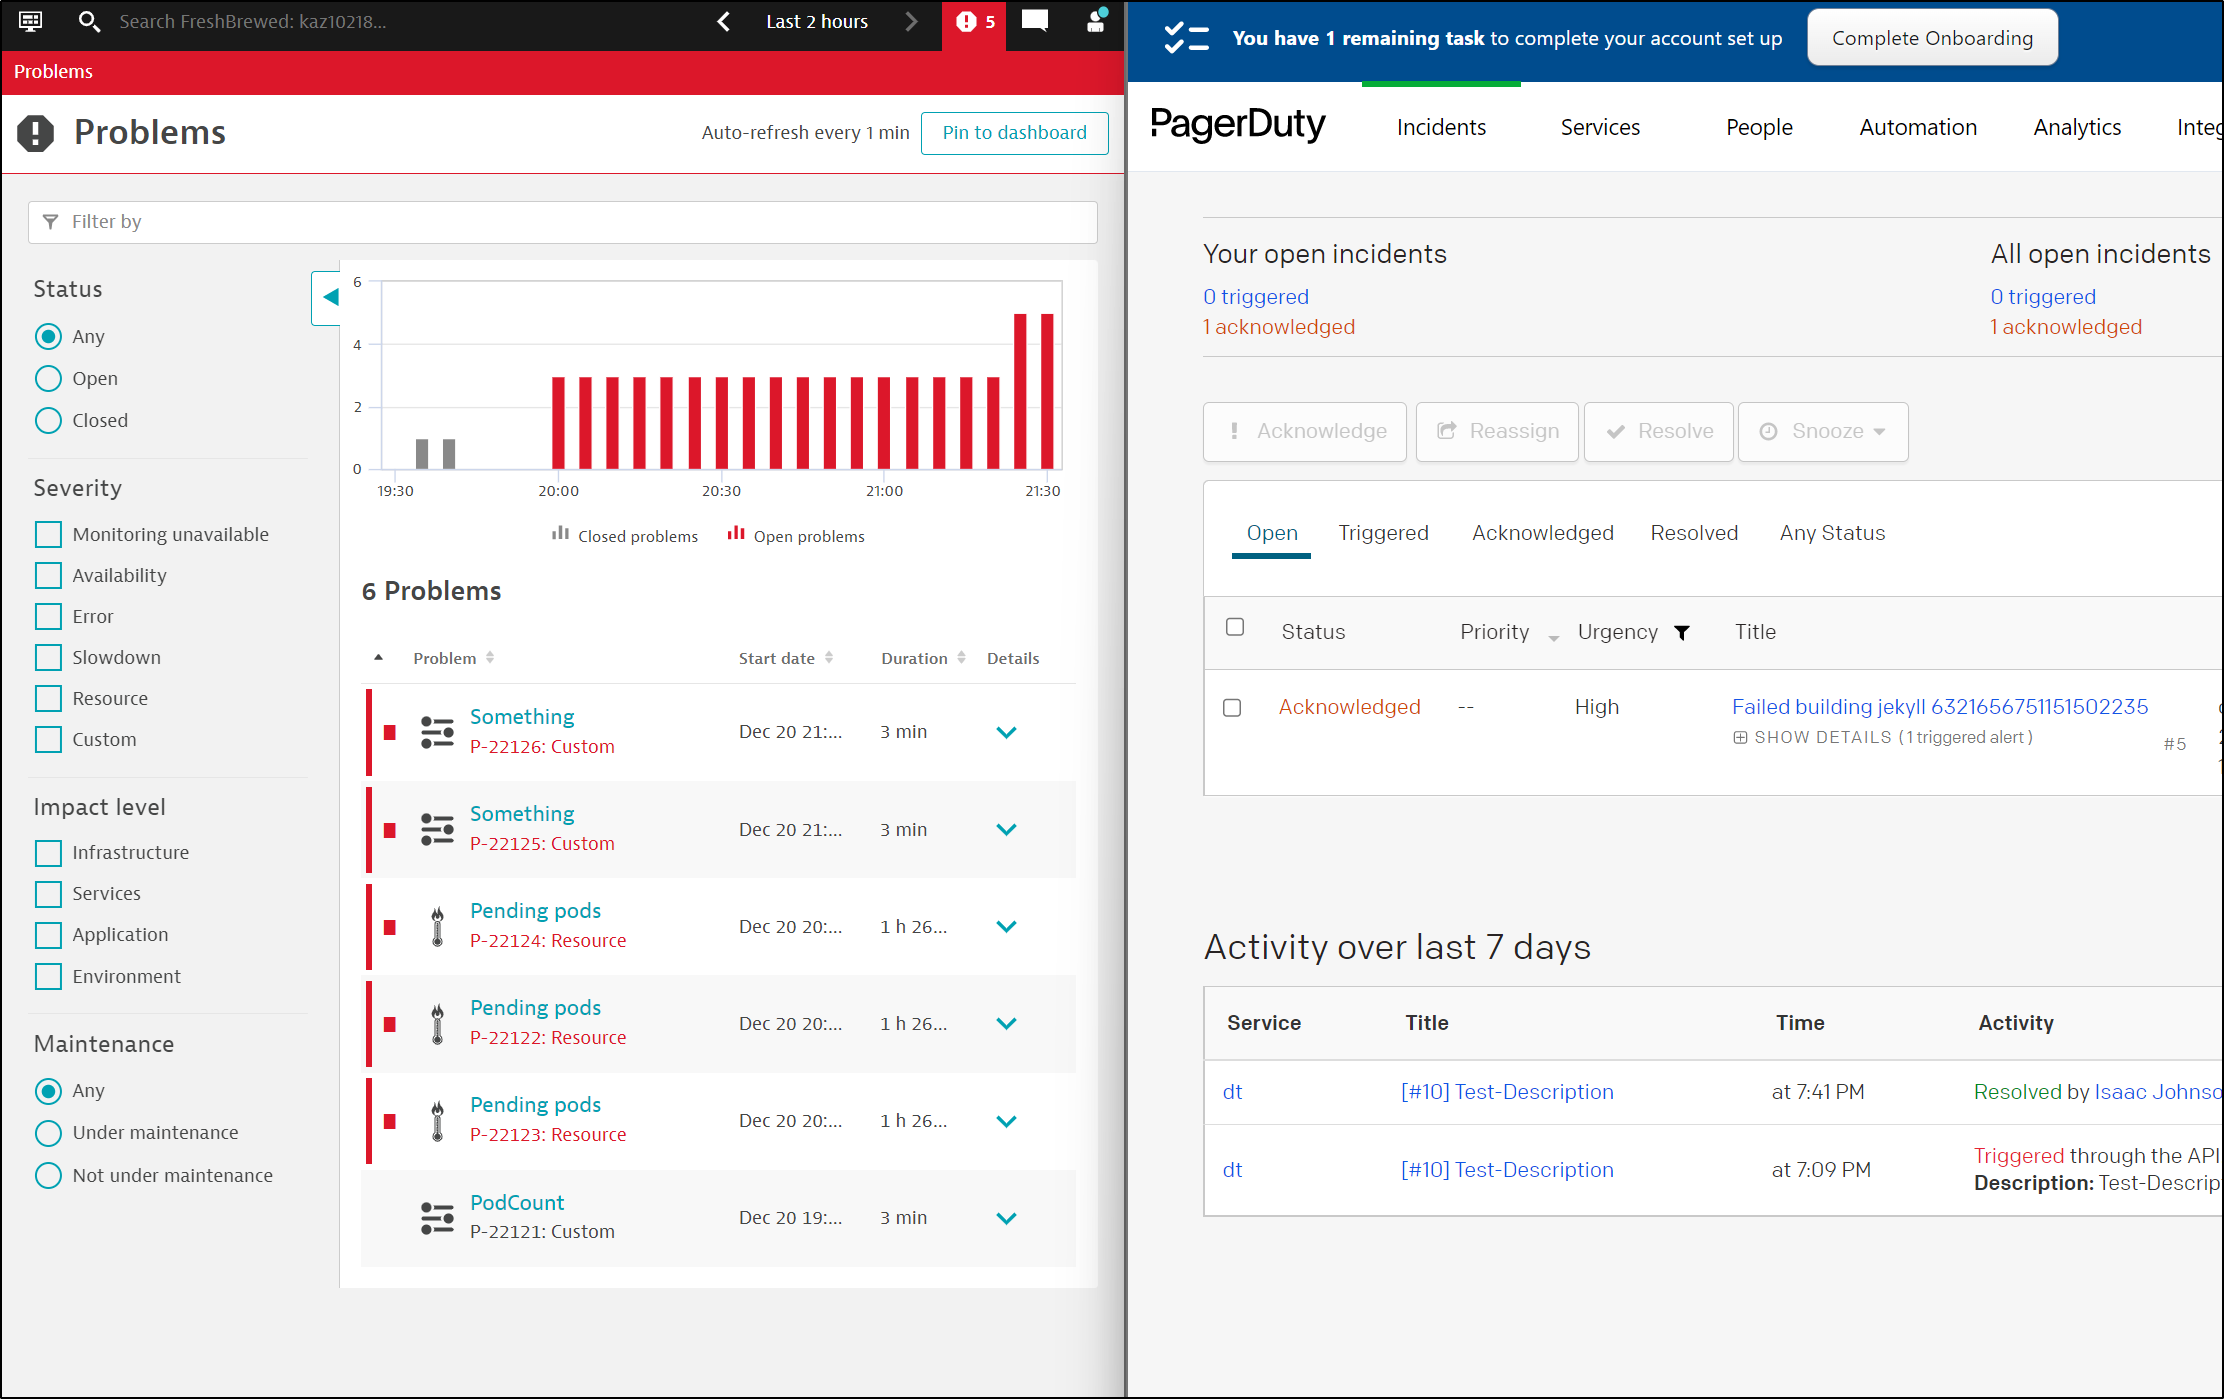
which I could see in more detail in PD
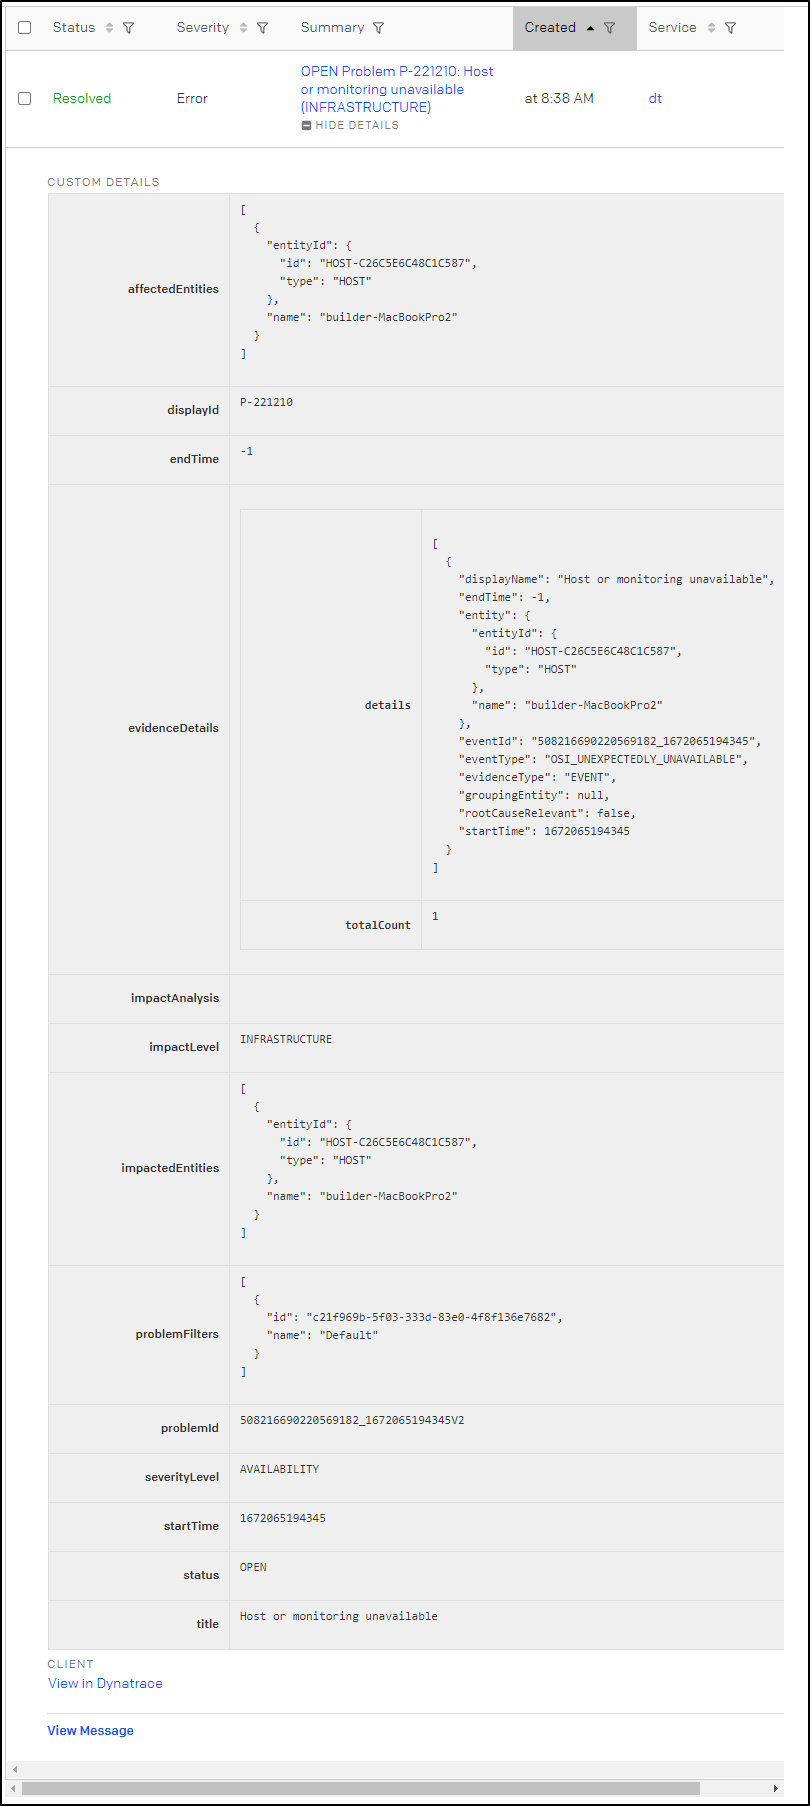
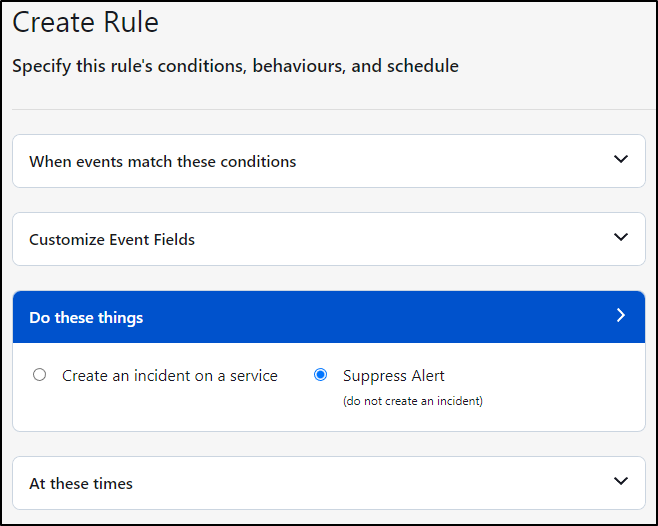
In Dynatrace, we can either find the window the hosts went offline and if they are active then “Close Problem”
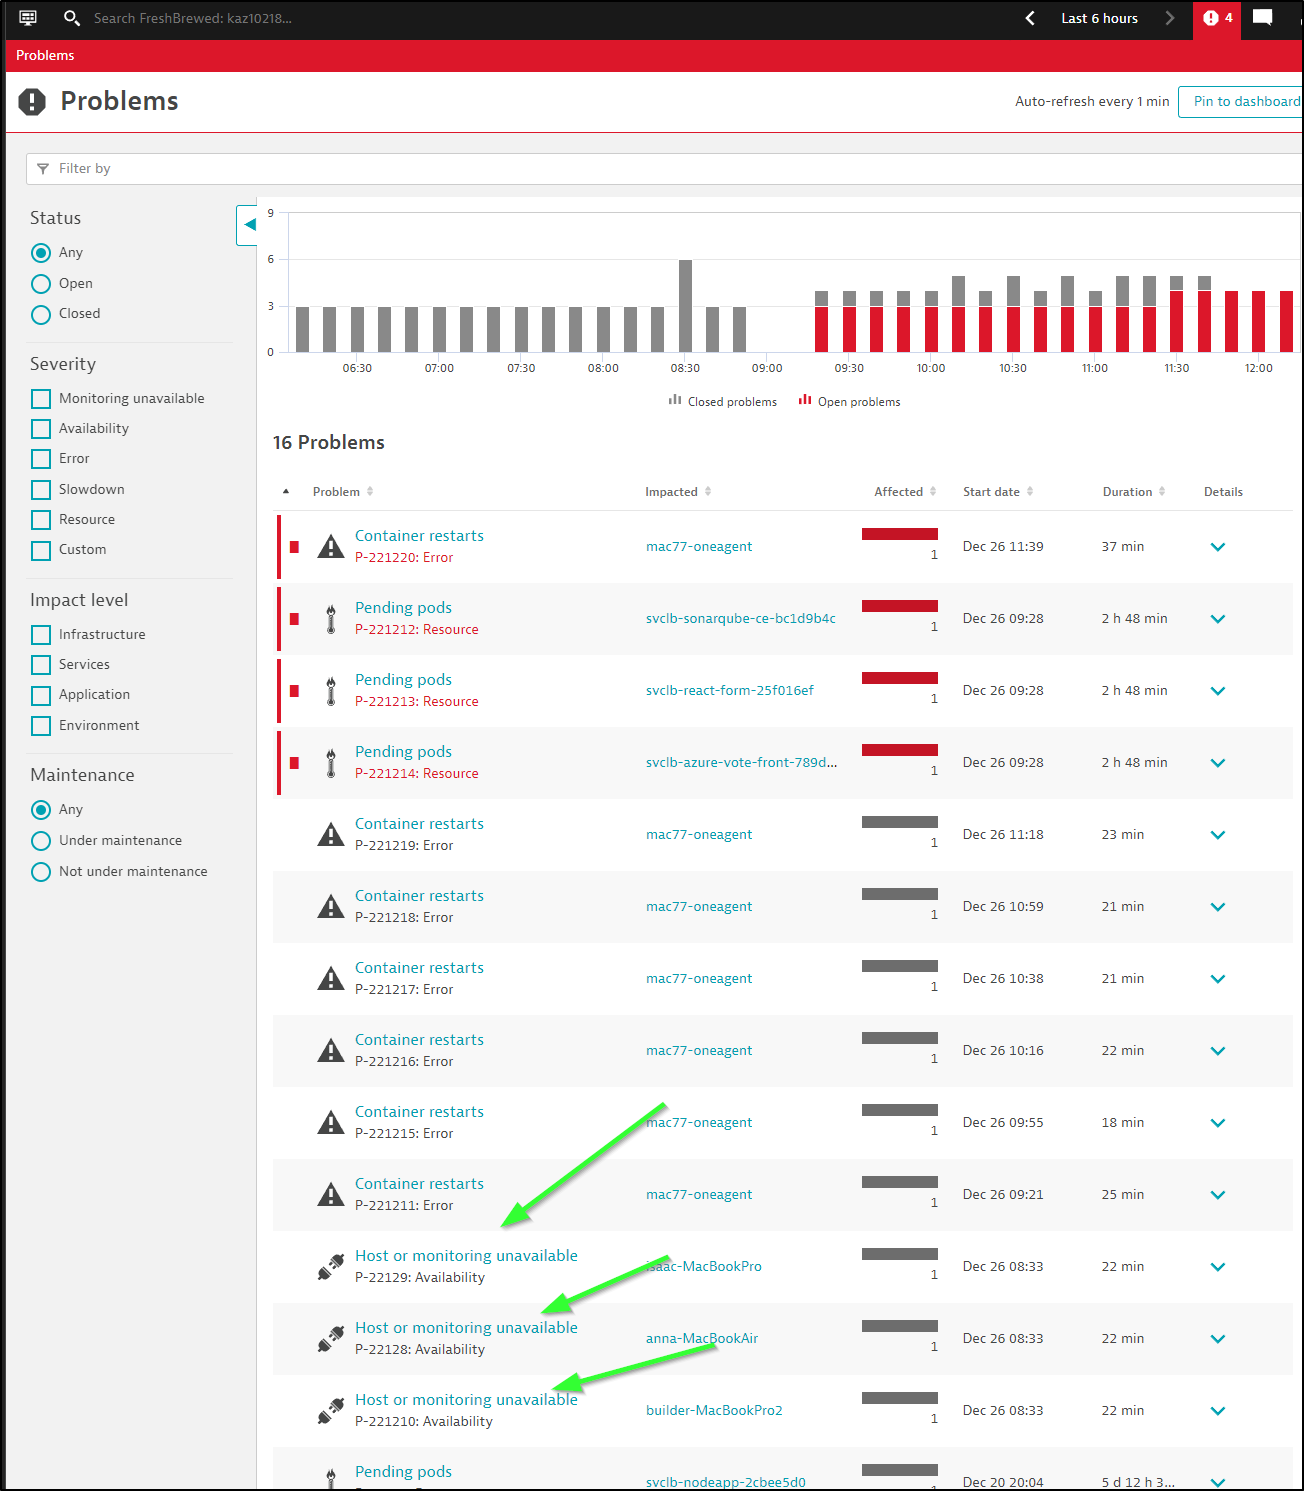
Or, if we do not wish to be alerting about hosts missing anymore, we can disable the Host Anomaly checks.
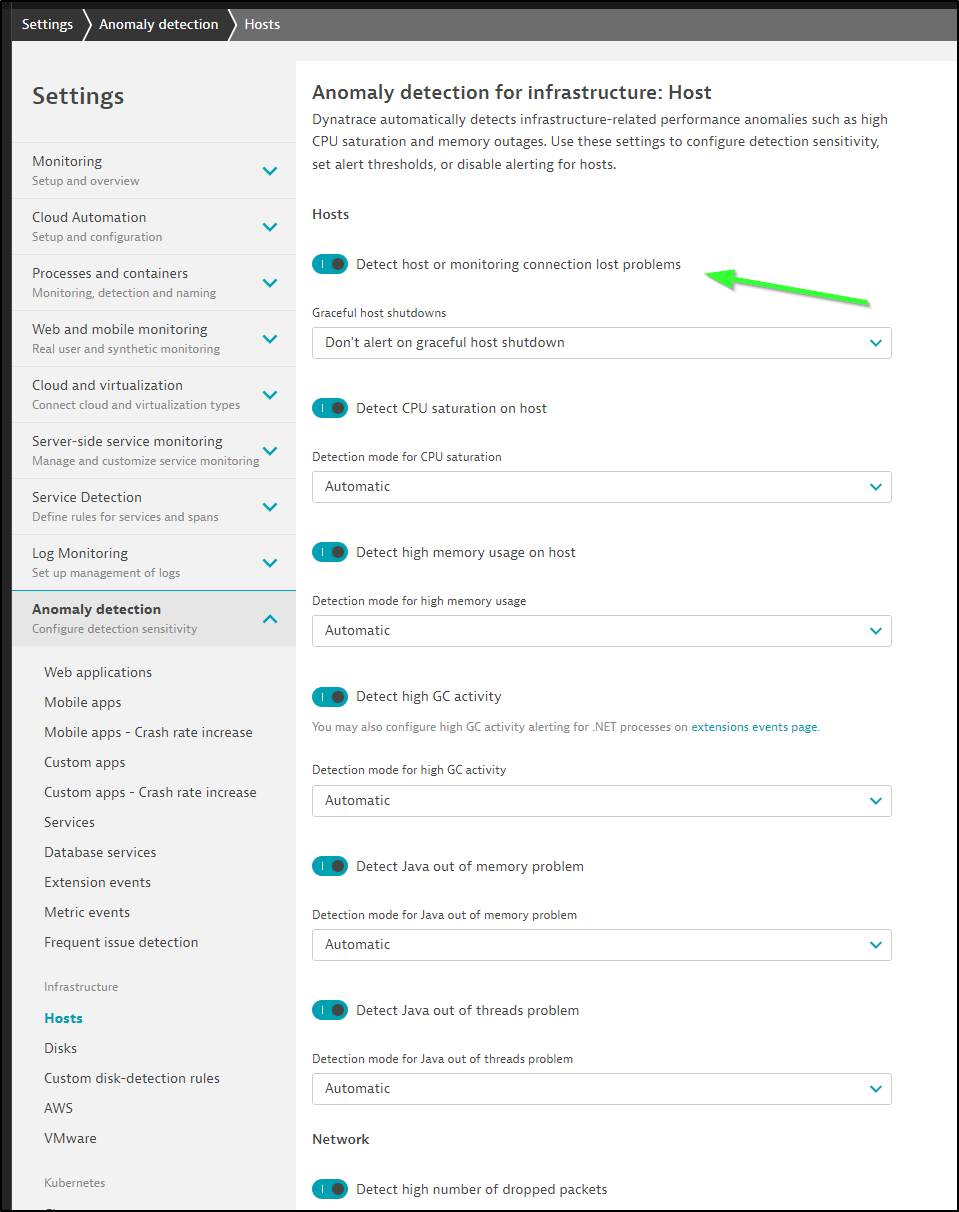
Sadly, you cannot exclude specific hosts. You can only really modify alerts based on few predefined filters (and host name isn’t amongst them)
If I were to handle this in production, I might modify my receiver (e.g. PagerDuty) to ignore hosts of a type or name.
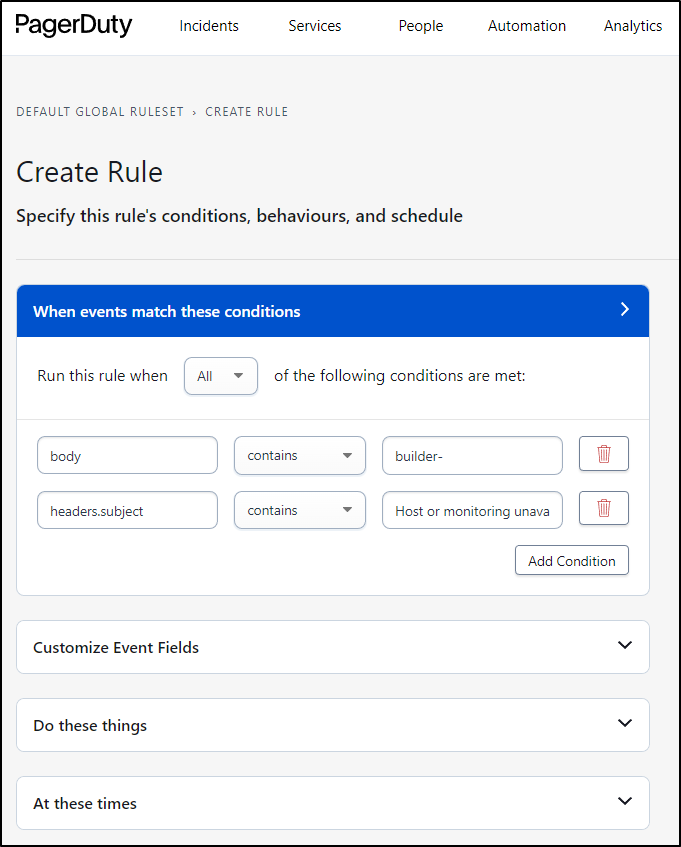
In the “Do these things”, pick Suppress Alert
However, as the day progressed, I saw more and more PD alerts crop up.
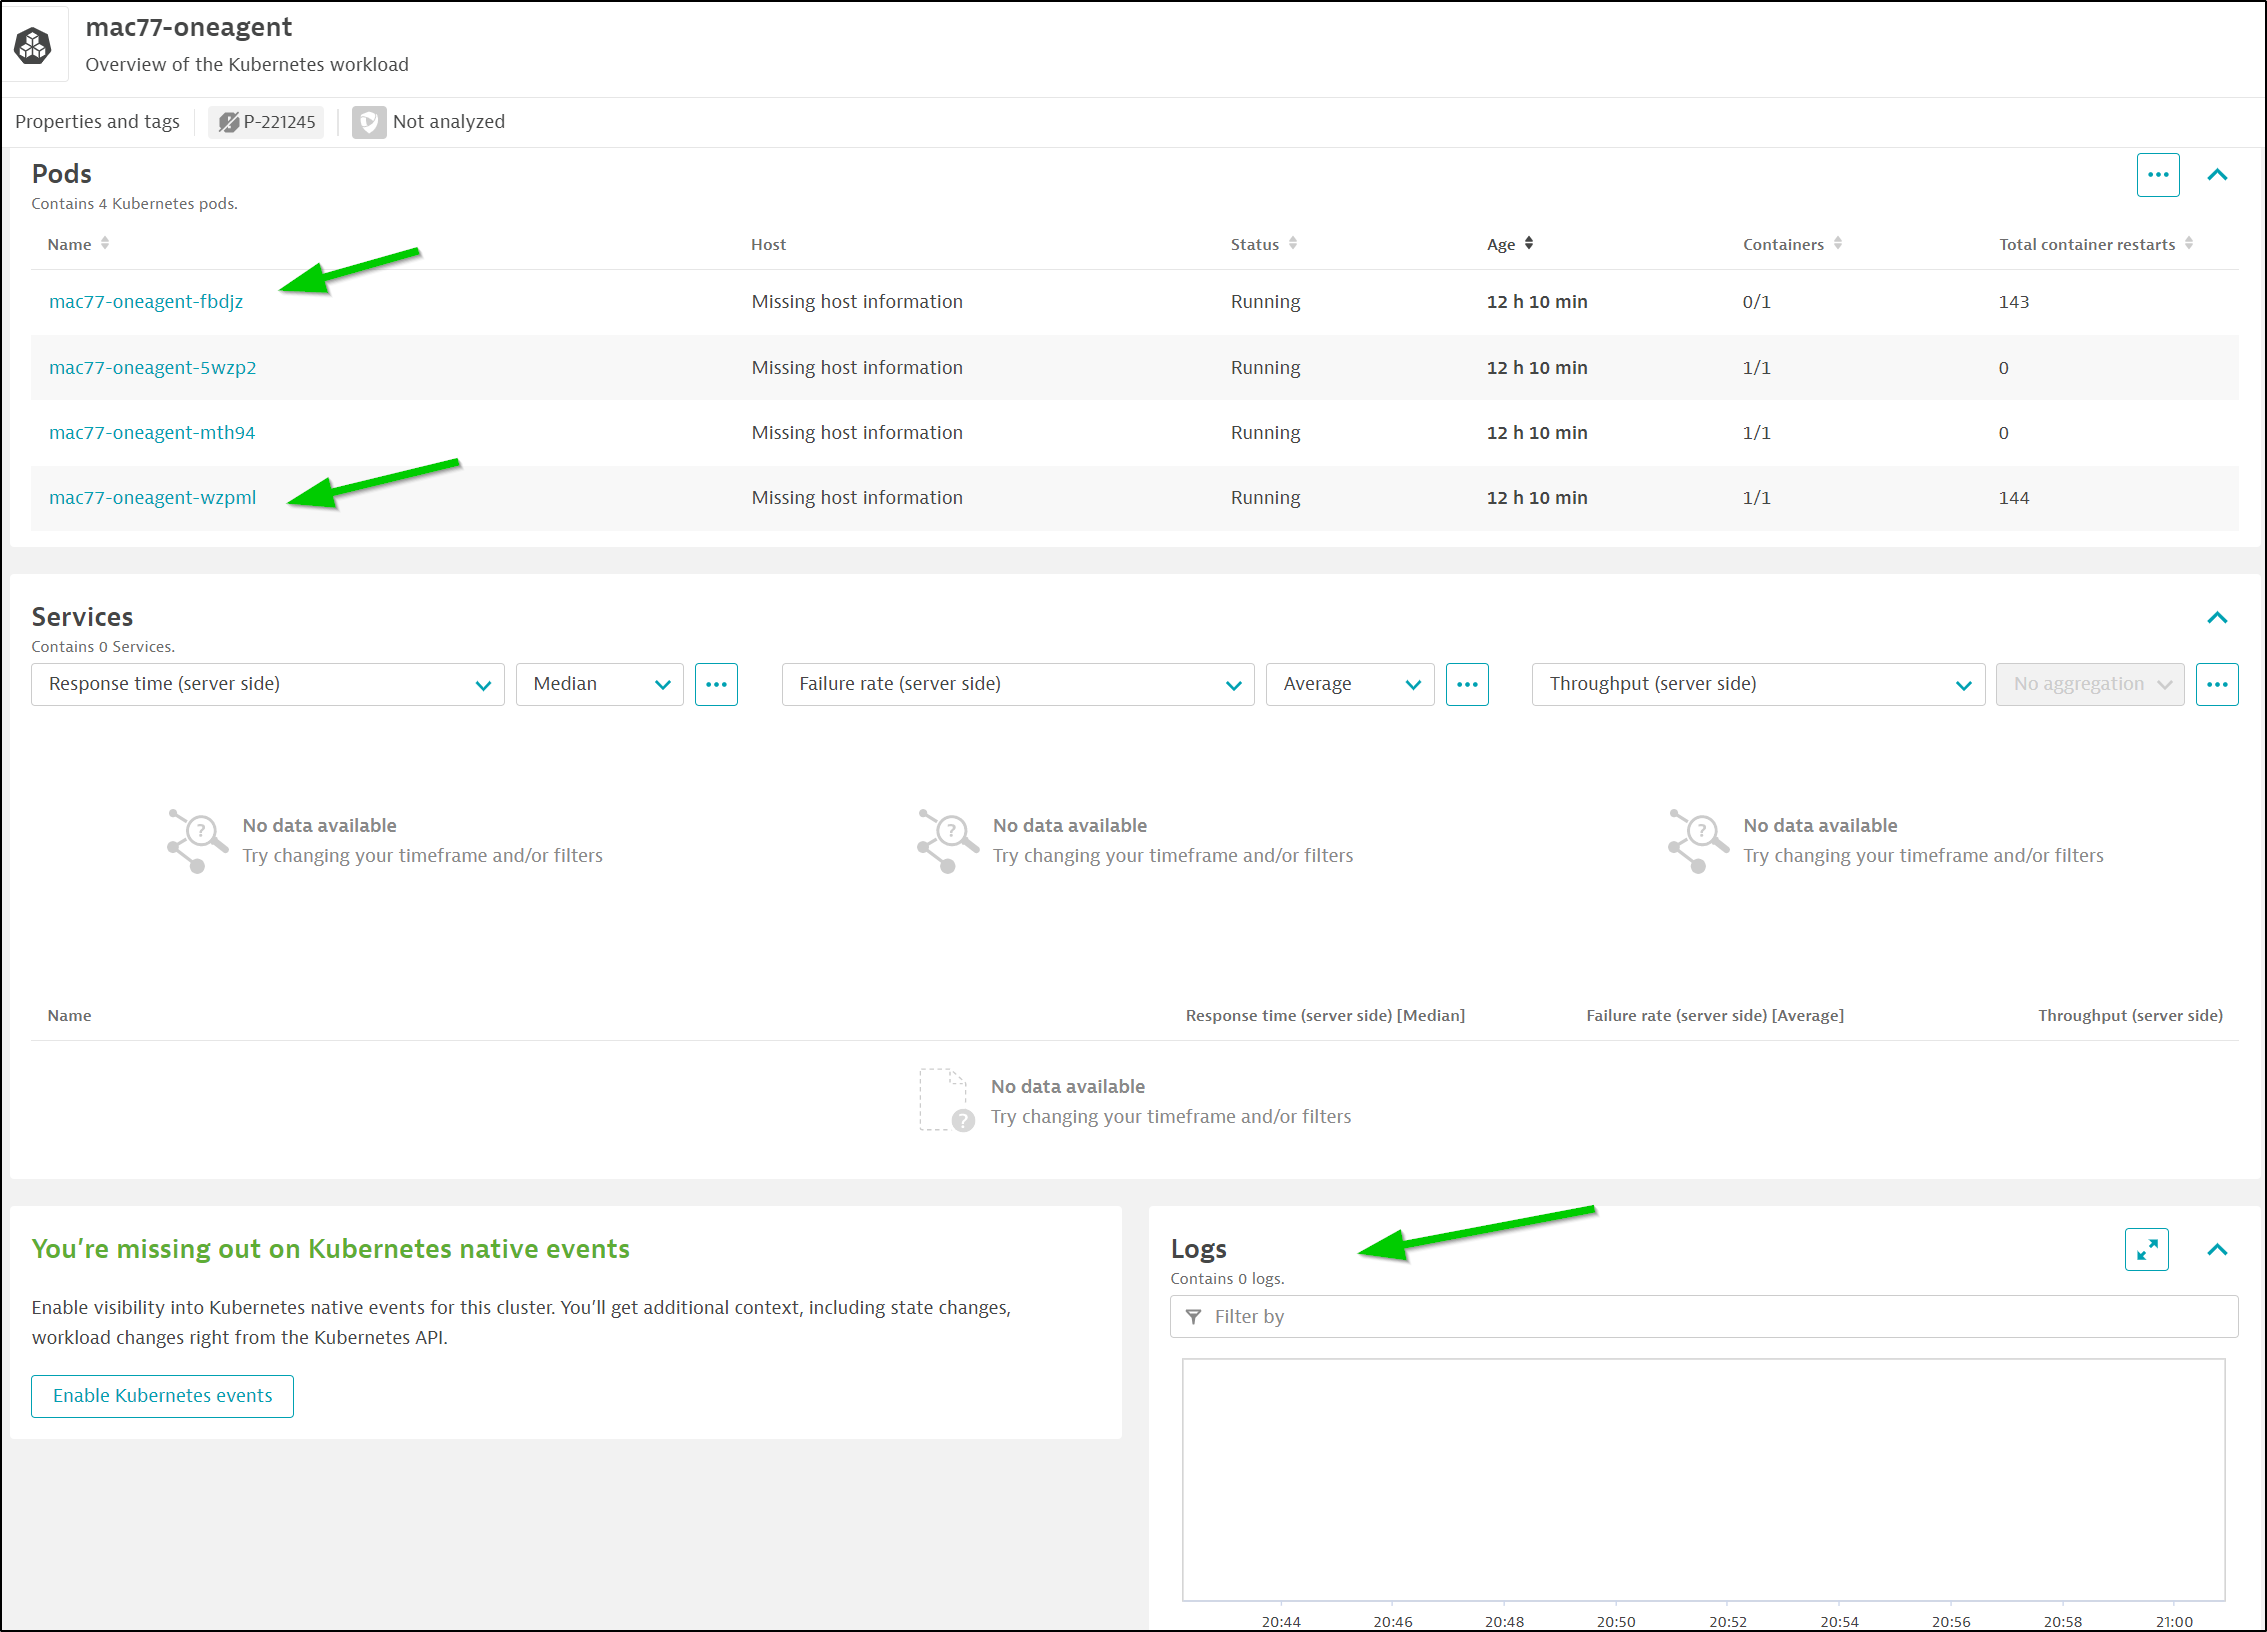
Many came from the Dynatrace oneagent pod itself crashing
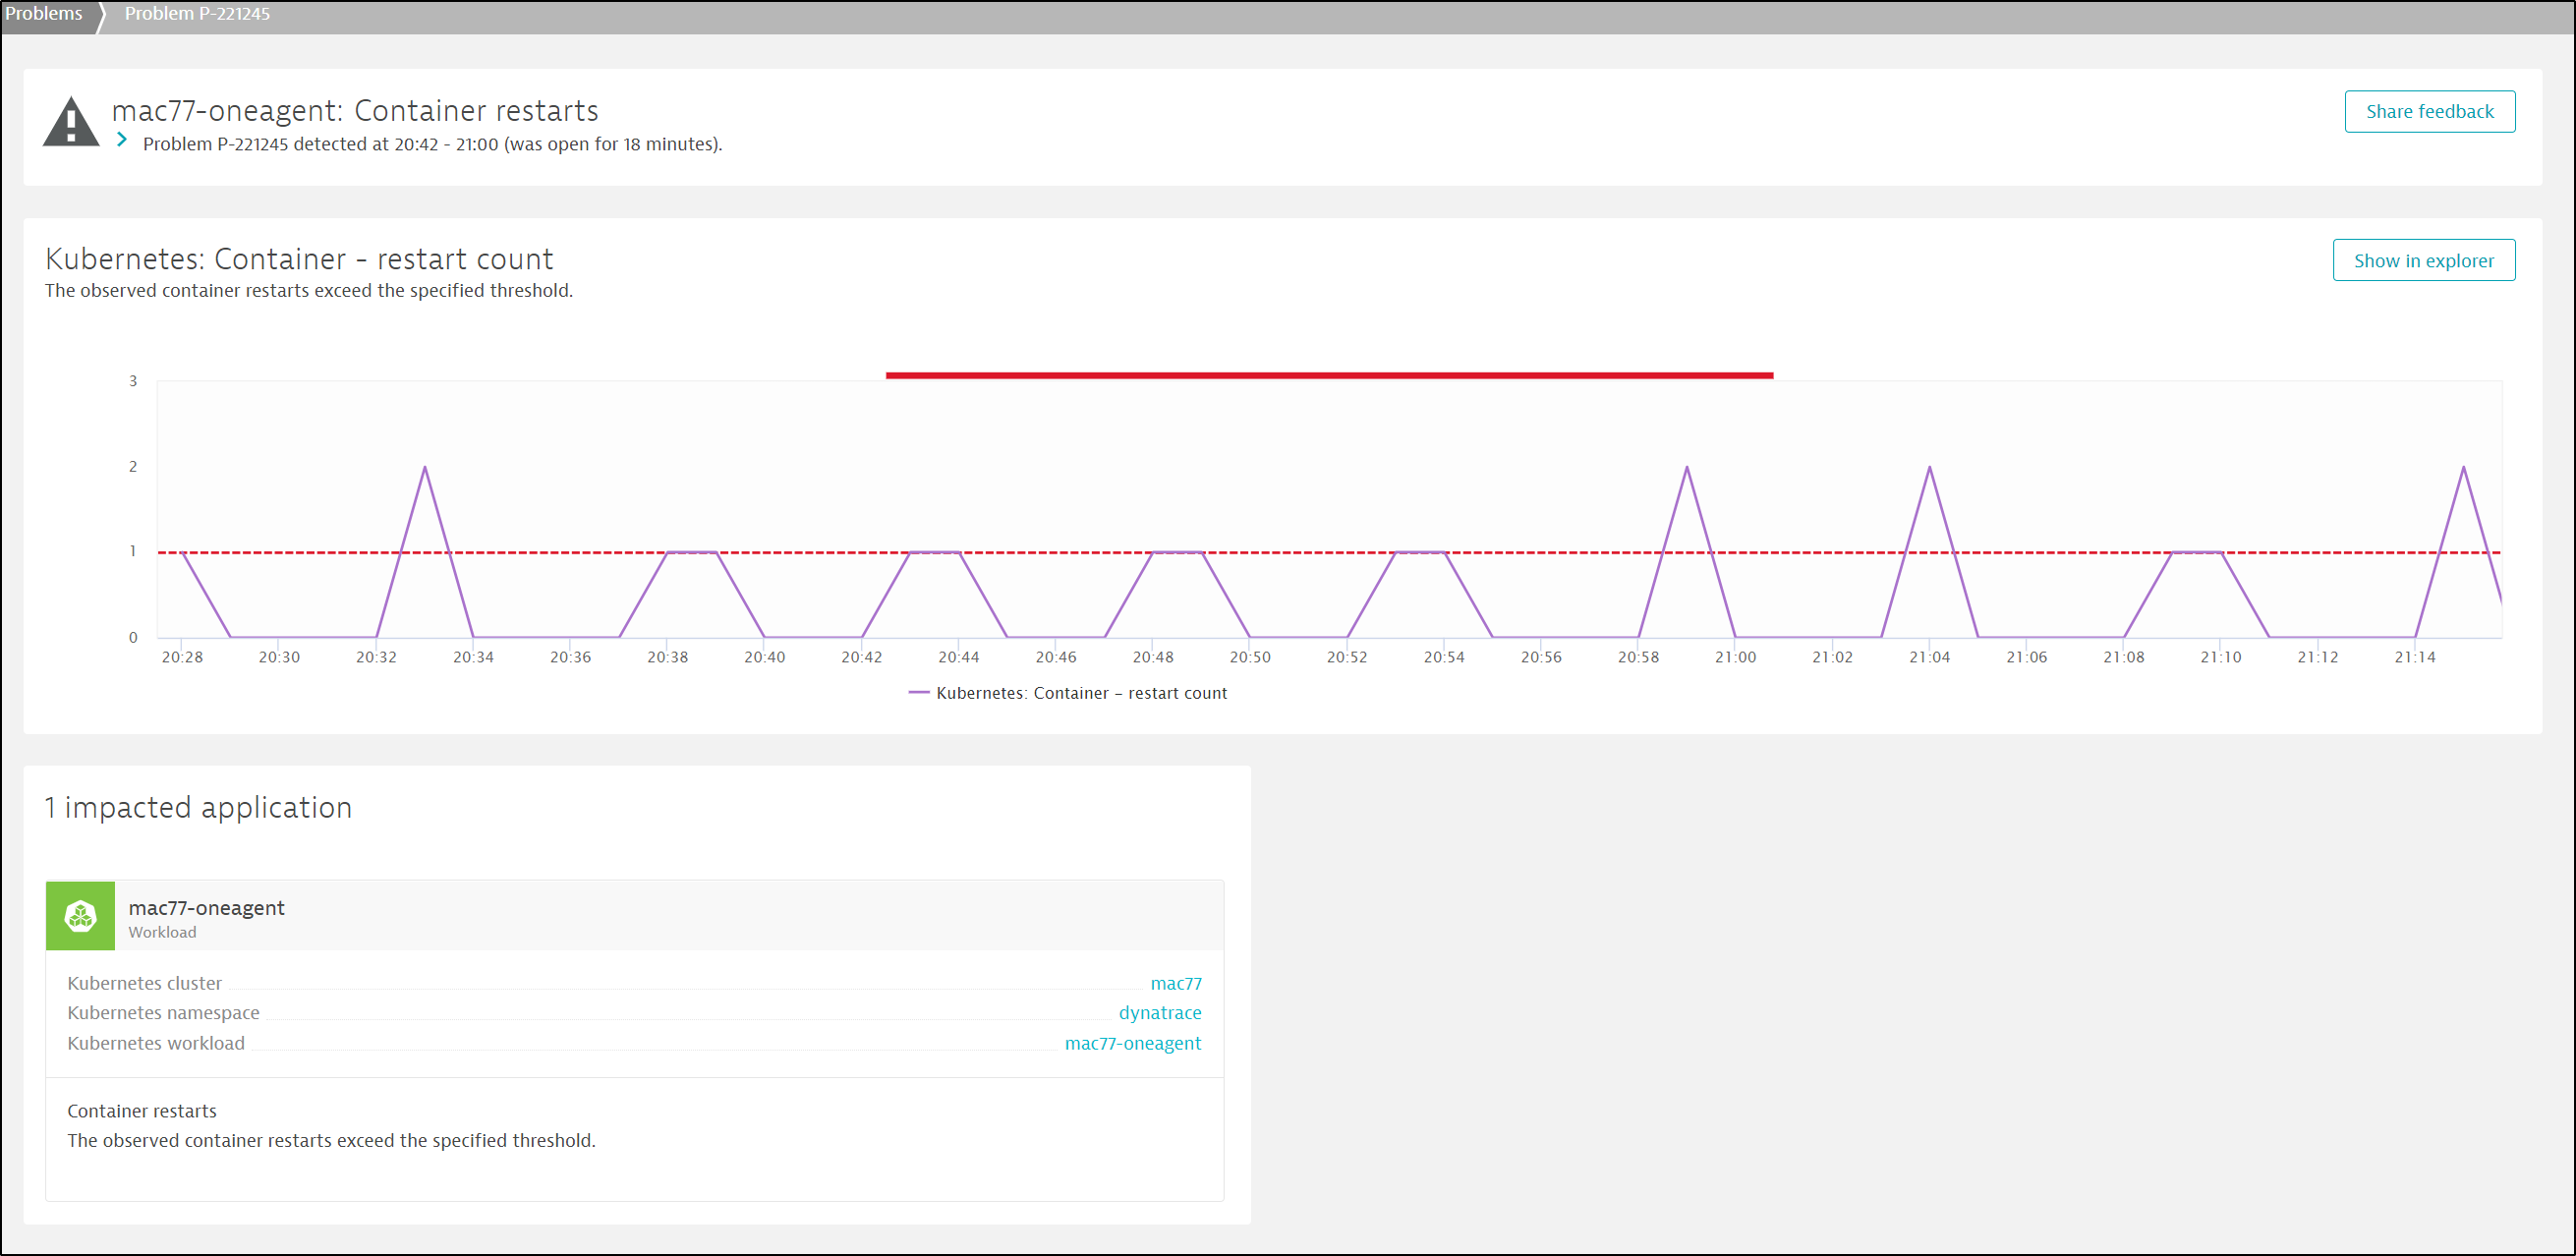
I can see which two pods are crashing, but again, Dynatrace captured no pod logs
I can see the same when I check with kubectl
$ kubectl get pods --all-namespaces | grep oneagent
dynatrace                            mac77-oneagent-5wzp2                                              1/1     Running                0                12h
dynatrace                            mac77-oneagent-mth94                                              1/1     Running                0                12h
dynatrace                            mac77-oneagent-fbdjz                                              0/1     CrashLoopBackOff       144 (57s ago)    12h
dynatrace                            mac77-oneagent-wzpml                                              0/1     CrashLoopBackOff       145 (25s ago)    12h
When I check the logs, I see it’s from a parameter I added:
03:29:09 Starting installer...
21:29:10 Error: Unrecognized parameter: '--set-system-logs-access-enabled'. Did you forget '='?
Usage: Dynatrace-OneAgent-Linux.sh [-h] [-v] [--set-server=https://server_address:server_port] [--set-tenant=tenant] [--set-tenant-token=tenant_token] [--set-proxy=proxy_address:proxy_port|no_proxy] [--set-host-group=host_group] [--set-infra-only=false|true] [INSTALL_PATH=absolute_path] [--set-app-log-content-access=false|true] [USER=username] [GROUP=groupname] [NON_ROOT_MODE=0|1] [DISABLE_ROOT_FALLBACK=0|1]
-h, --help                           Display this help and exit.
-v, --version                        Print version and exit.
INSTALL_PATH                         Installation path to be used, must be absolute and not contain any spaces.
DATA_STORAGE                         Path to the directory for large runtime data storage, must be absolute and not contain any spaces.
LOG_PATH                             Logs path to be used, must be absolute and not contain any spaces.
USER                                 The name of the unprivileged user for OneAgent processes. Must contain 3-32 alphanumeric characters. Defaults to 'dtuser'
GROUP                                The name of the primary group for OneAgent processes, defaults to the value of USER. May only be used in conjunction with USER.
NON_ROOT_MODE                        Enables non-privileged mode. For details, see: https://www.dynatrace.com/support/help/shortlink/root-privileges#linux-non-root-mode
DISABLE_ROOT_FALLBACK                Disables temporary elevation of the privileges in environments where ambient capabilities are unavailable.

For details, see: https://www.dynatrace.com/support/help/shortlink/linux-custom-installation
We can see I missed the “=true”
$ kubectl get dynakube -n dynatrace -o yaml | grep set-system-logs-access-enabled
        {"apiVersion":"dynatrace.com/v1beta1","kind":"DynaKube","metadata":{"annotations":{"feature.dynatrace.com/automatic-kubernetes-api-monitoring":"true"},"name":"mac77","namespace":"dynatrace"},"spec":{"activeGate":{"capabilities":["routing","kubernetes-monitoring"],"group":"onprem","resources":{"limits":{"cpu":"1000m","memory":"1.5Gi"},"requests":{"cpu":"500m","memory":"512Mi"}}},"apiUrl":"https://kaz10218.live.dynatrace.com/api","networkZone":"onprem","oneAgent":{"classicFullStack":{"args":["--set-host-group=onprem","--set-system-logs-access-enabled"],"env":[{"name":"ONEAGENT_ENABLE_VOLUME_STORAGE","value":"false"}],"tolerations":[{"effect":"NoSchedule","key":"node-role.kubernetes.io/master","operator":"Exists"},{"effect":"NoSchedule","key":"node-role.kubernetes.io/control-plane","operator":"Exists"}]}},"skipCertCheck":false}}
        - --set-system-logs-access-enabled
I’ll correct and re-apply
$ kubectl get dynakube -n dynatrace -o yaml > dynakube77.yaml
$ vi dynakube77.yaml
$ kubectl get dynakube -n dynatrace -o yaml > dynakube77.yaml.bak
$ diff dynakube77.yaml.bak  dynakube77.yaml
35c35,36
<         - --set-system-logs-access-enabled
---
>         - --set-system-logs-access-enabled=true
>         - --set-app-log-content-access=true
$ kubectl apply -f dynakube77.yaml -n dynatrace
dynakube.dynatrace.com/mac77 configured
Within a couple minutes this was fine
$ kubectl get pods -n dynatrace | grep one
mac77-oneagent-5wzp2                  1/1     Running   0          12h
mac77-oneagent-8822g                  0/1     Running   0          30s
mac77-oneagent-sxpcm                  0/1     Running   0          29s
mac77-oneagent-q85ct                  0/1     Running   0          20s

$ kubectl get pods -n dynatrace | grep one
mac77-oneagent-8822g                  1/1     Running   0          2m42s
mac77-oneagent-sxpcm                  1/1     Running   0          2m41s
mac77-oneagent-q85ct                  1/1     Running   0          2m32s
mac77-oneagent-7jm8b                  1/1     Running   0          77s
But not before trigger even more PD alerts
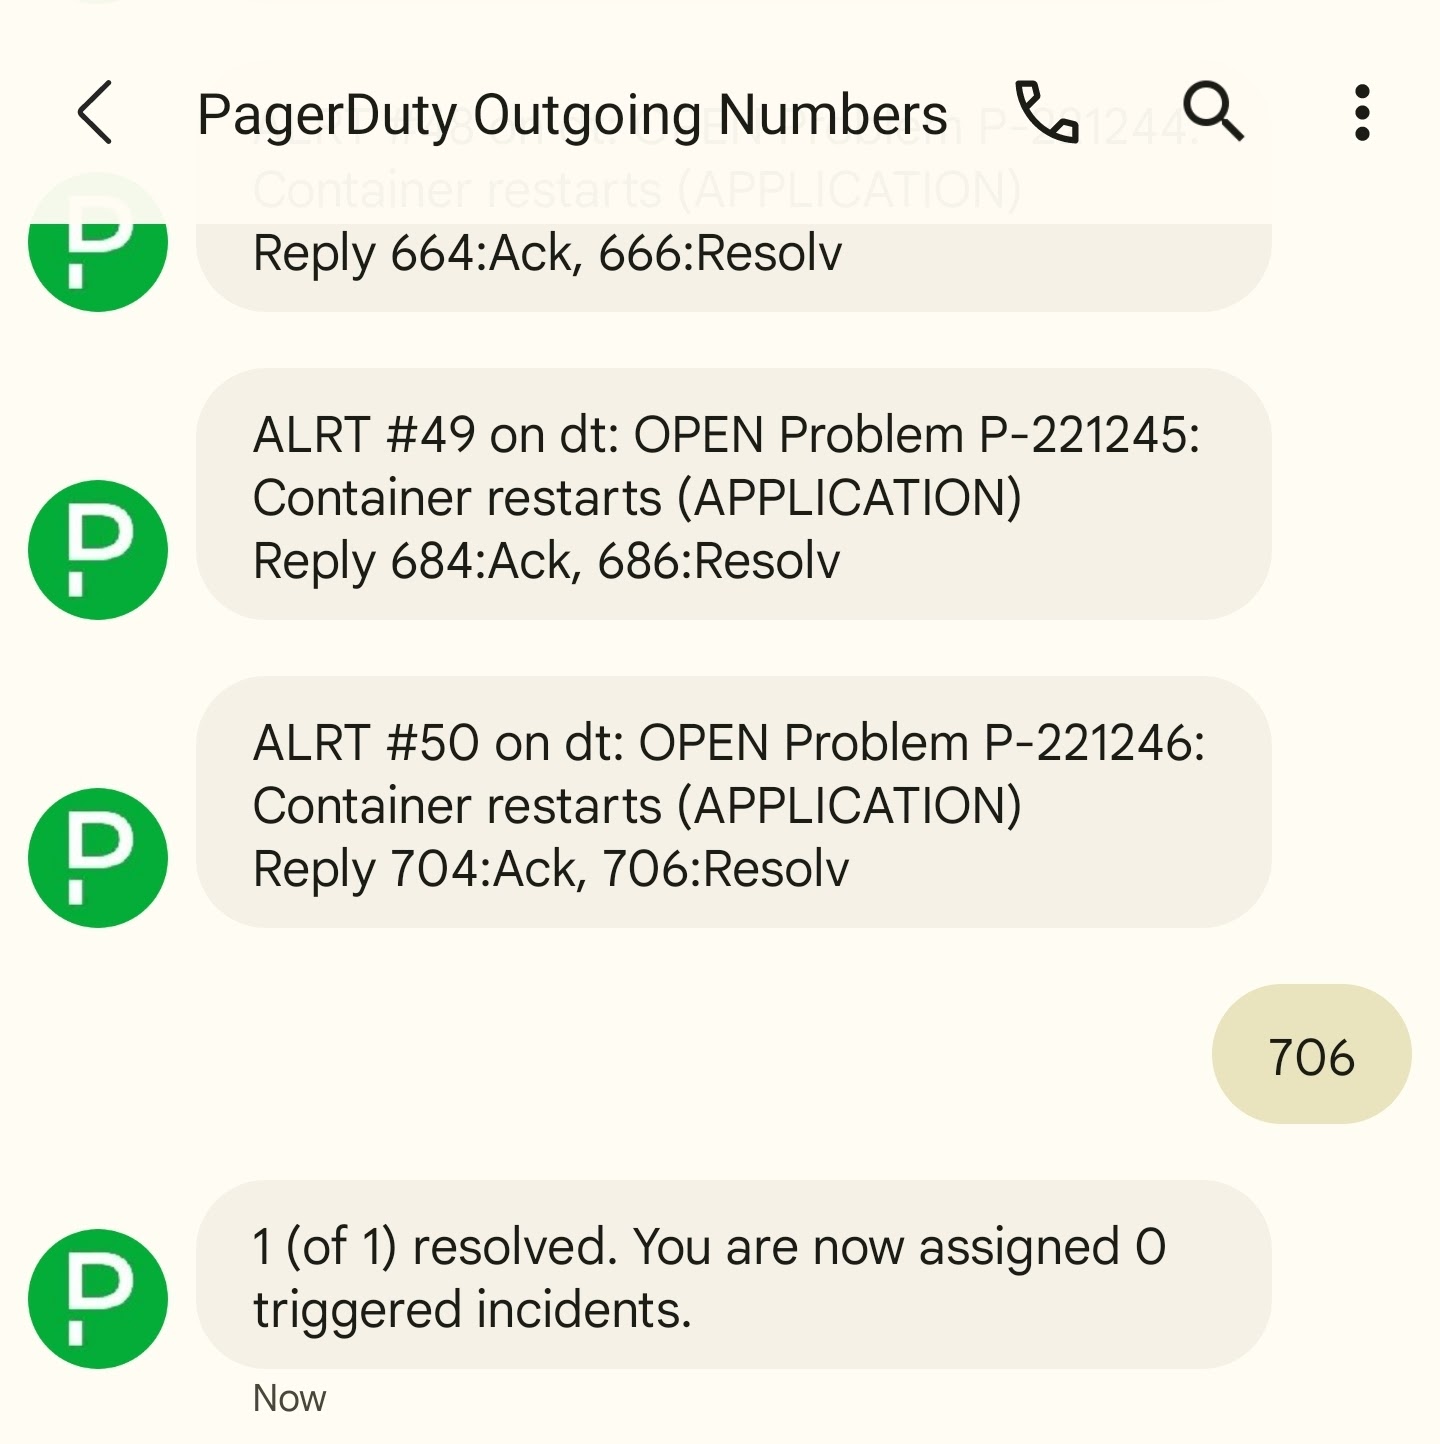
Simple because of the noise I’ve gotten, I decided to disable the PD notifications for now
While my updates on my production cluster still didn’t capture pod logs, I will say that having left it running for a day, no negative effects were seen on any other workload. This means whatever I had experienced prior was an aberration on my home cluster a year ago.
a day later…..
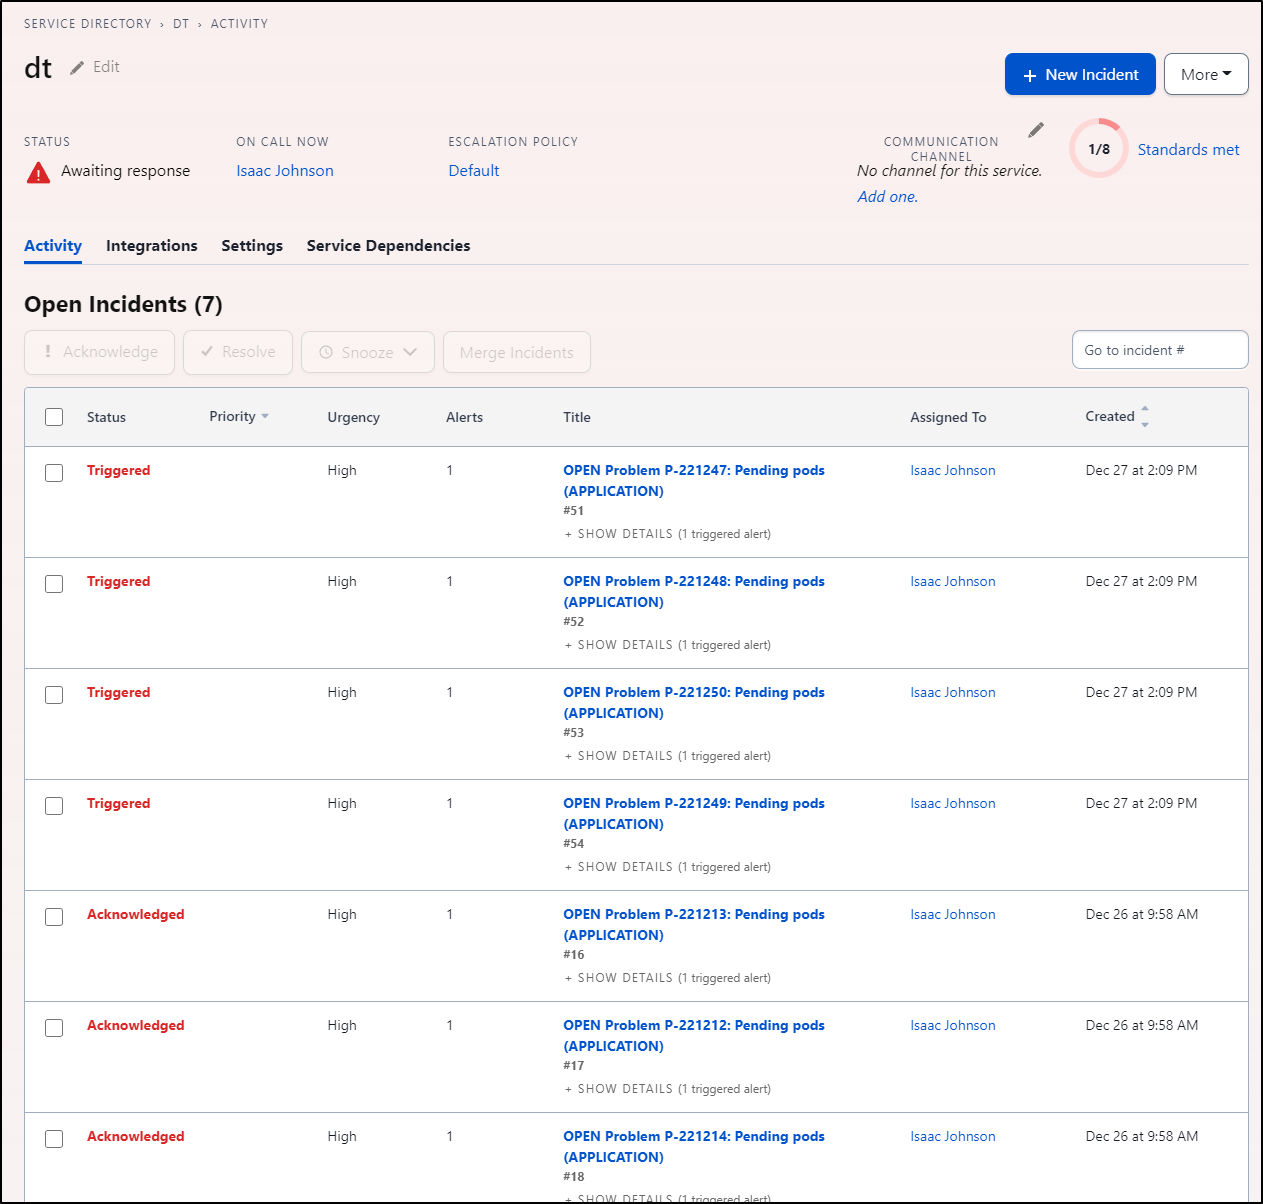
I found the notification re-enabled itself and PagerDuty started to blow up again
I decided to try another route.
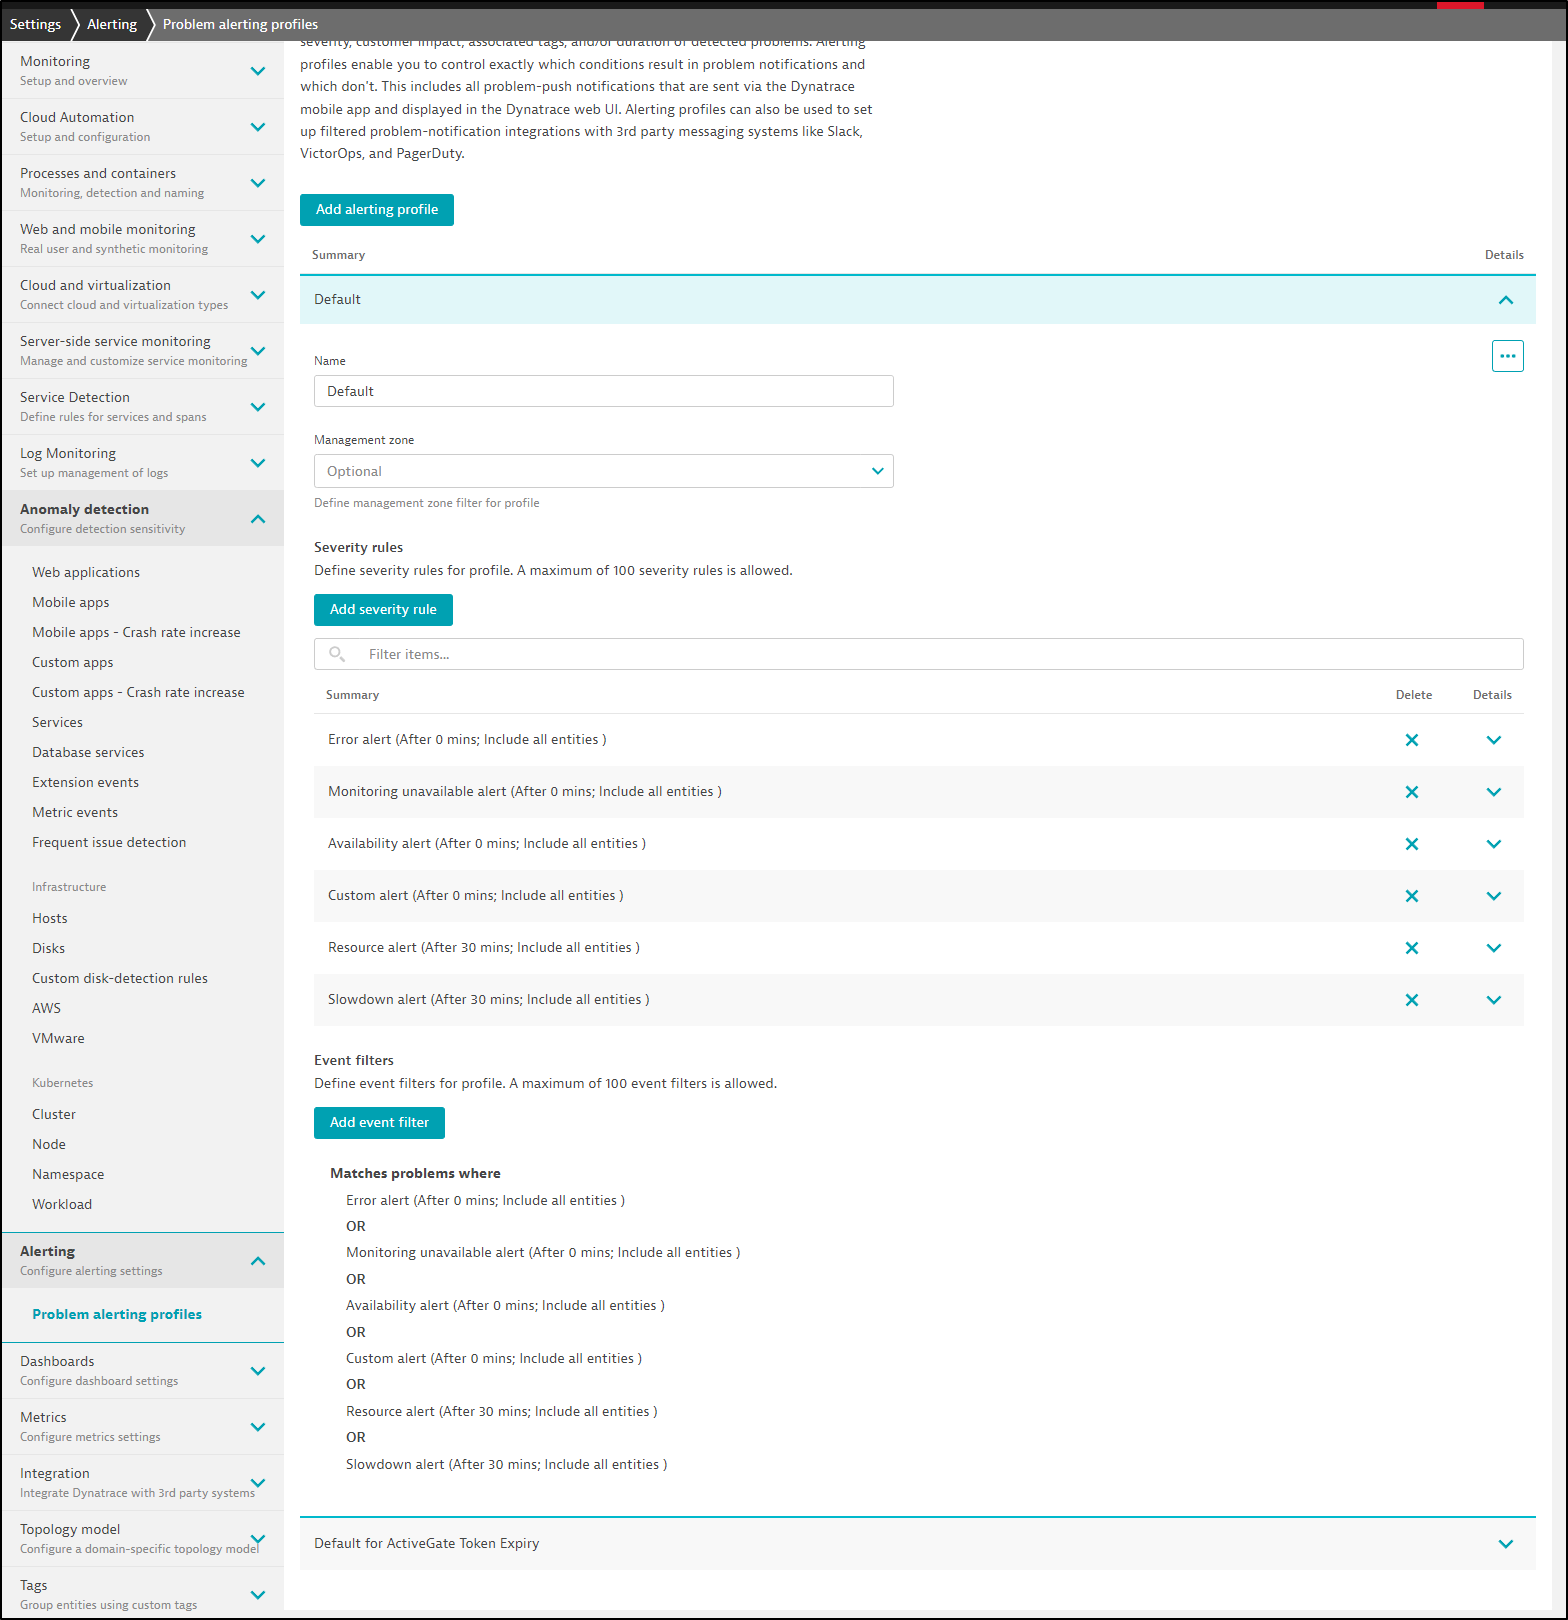
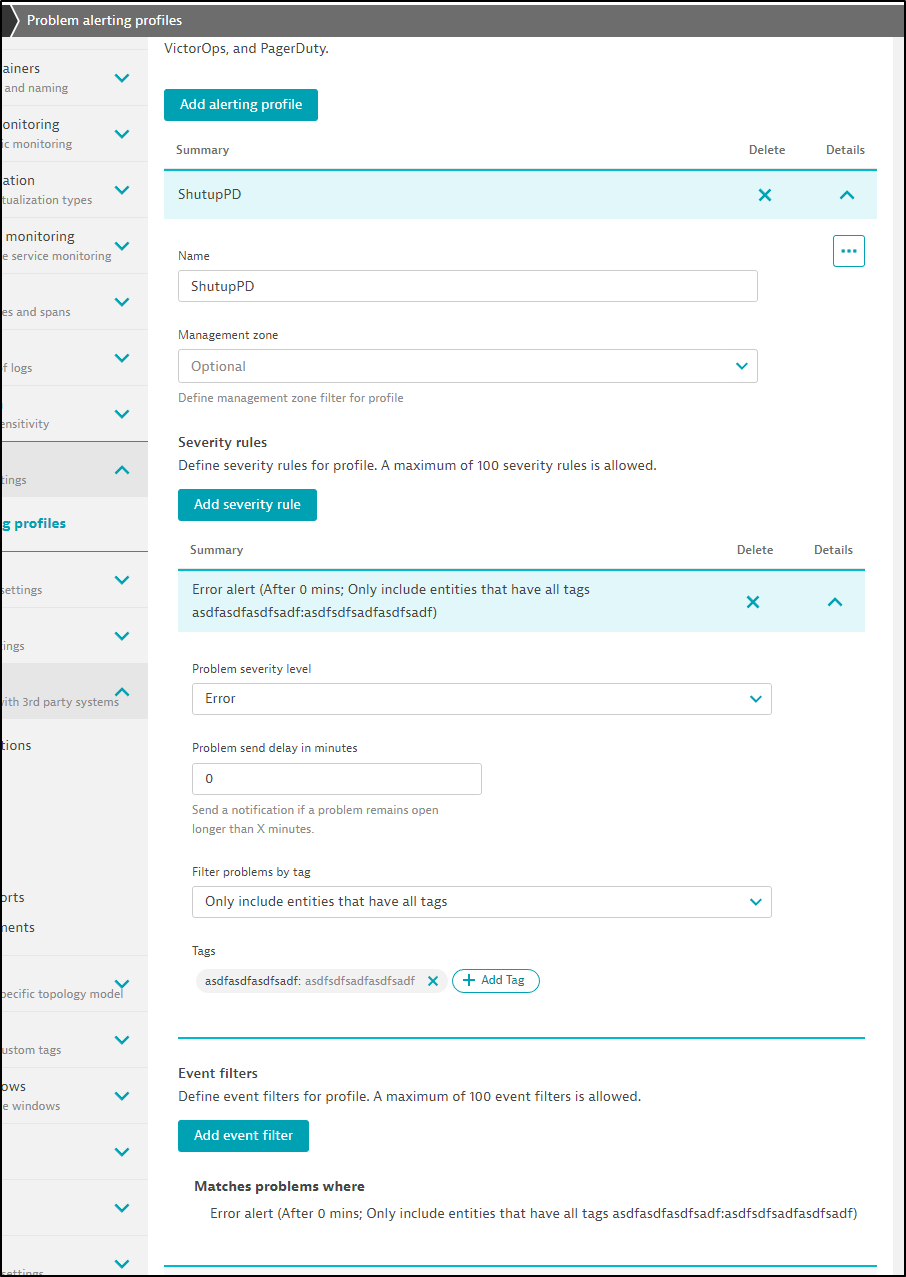
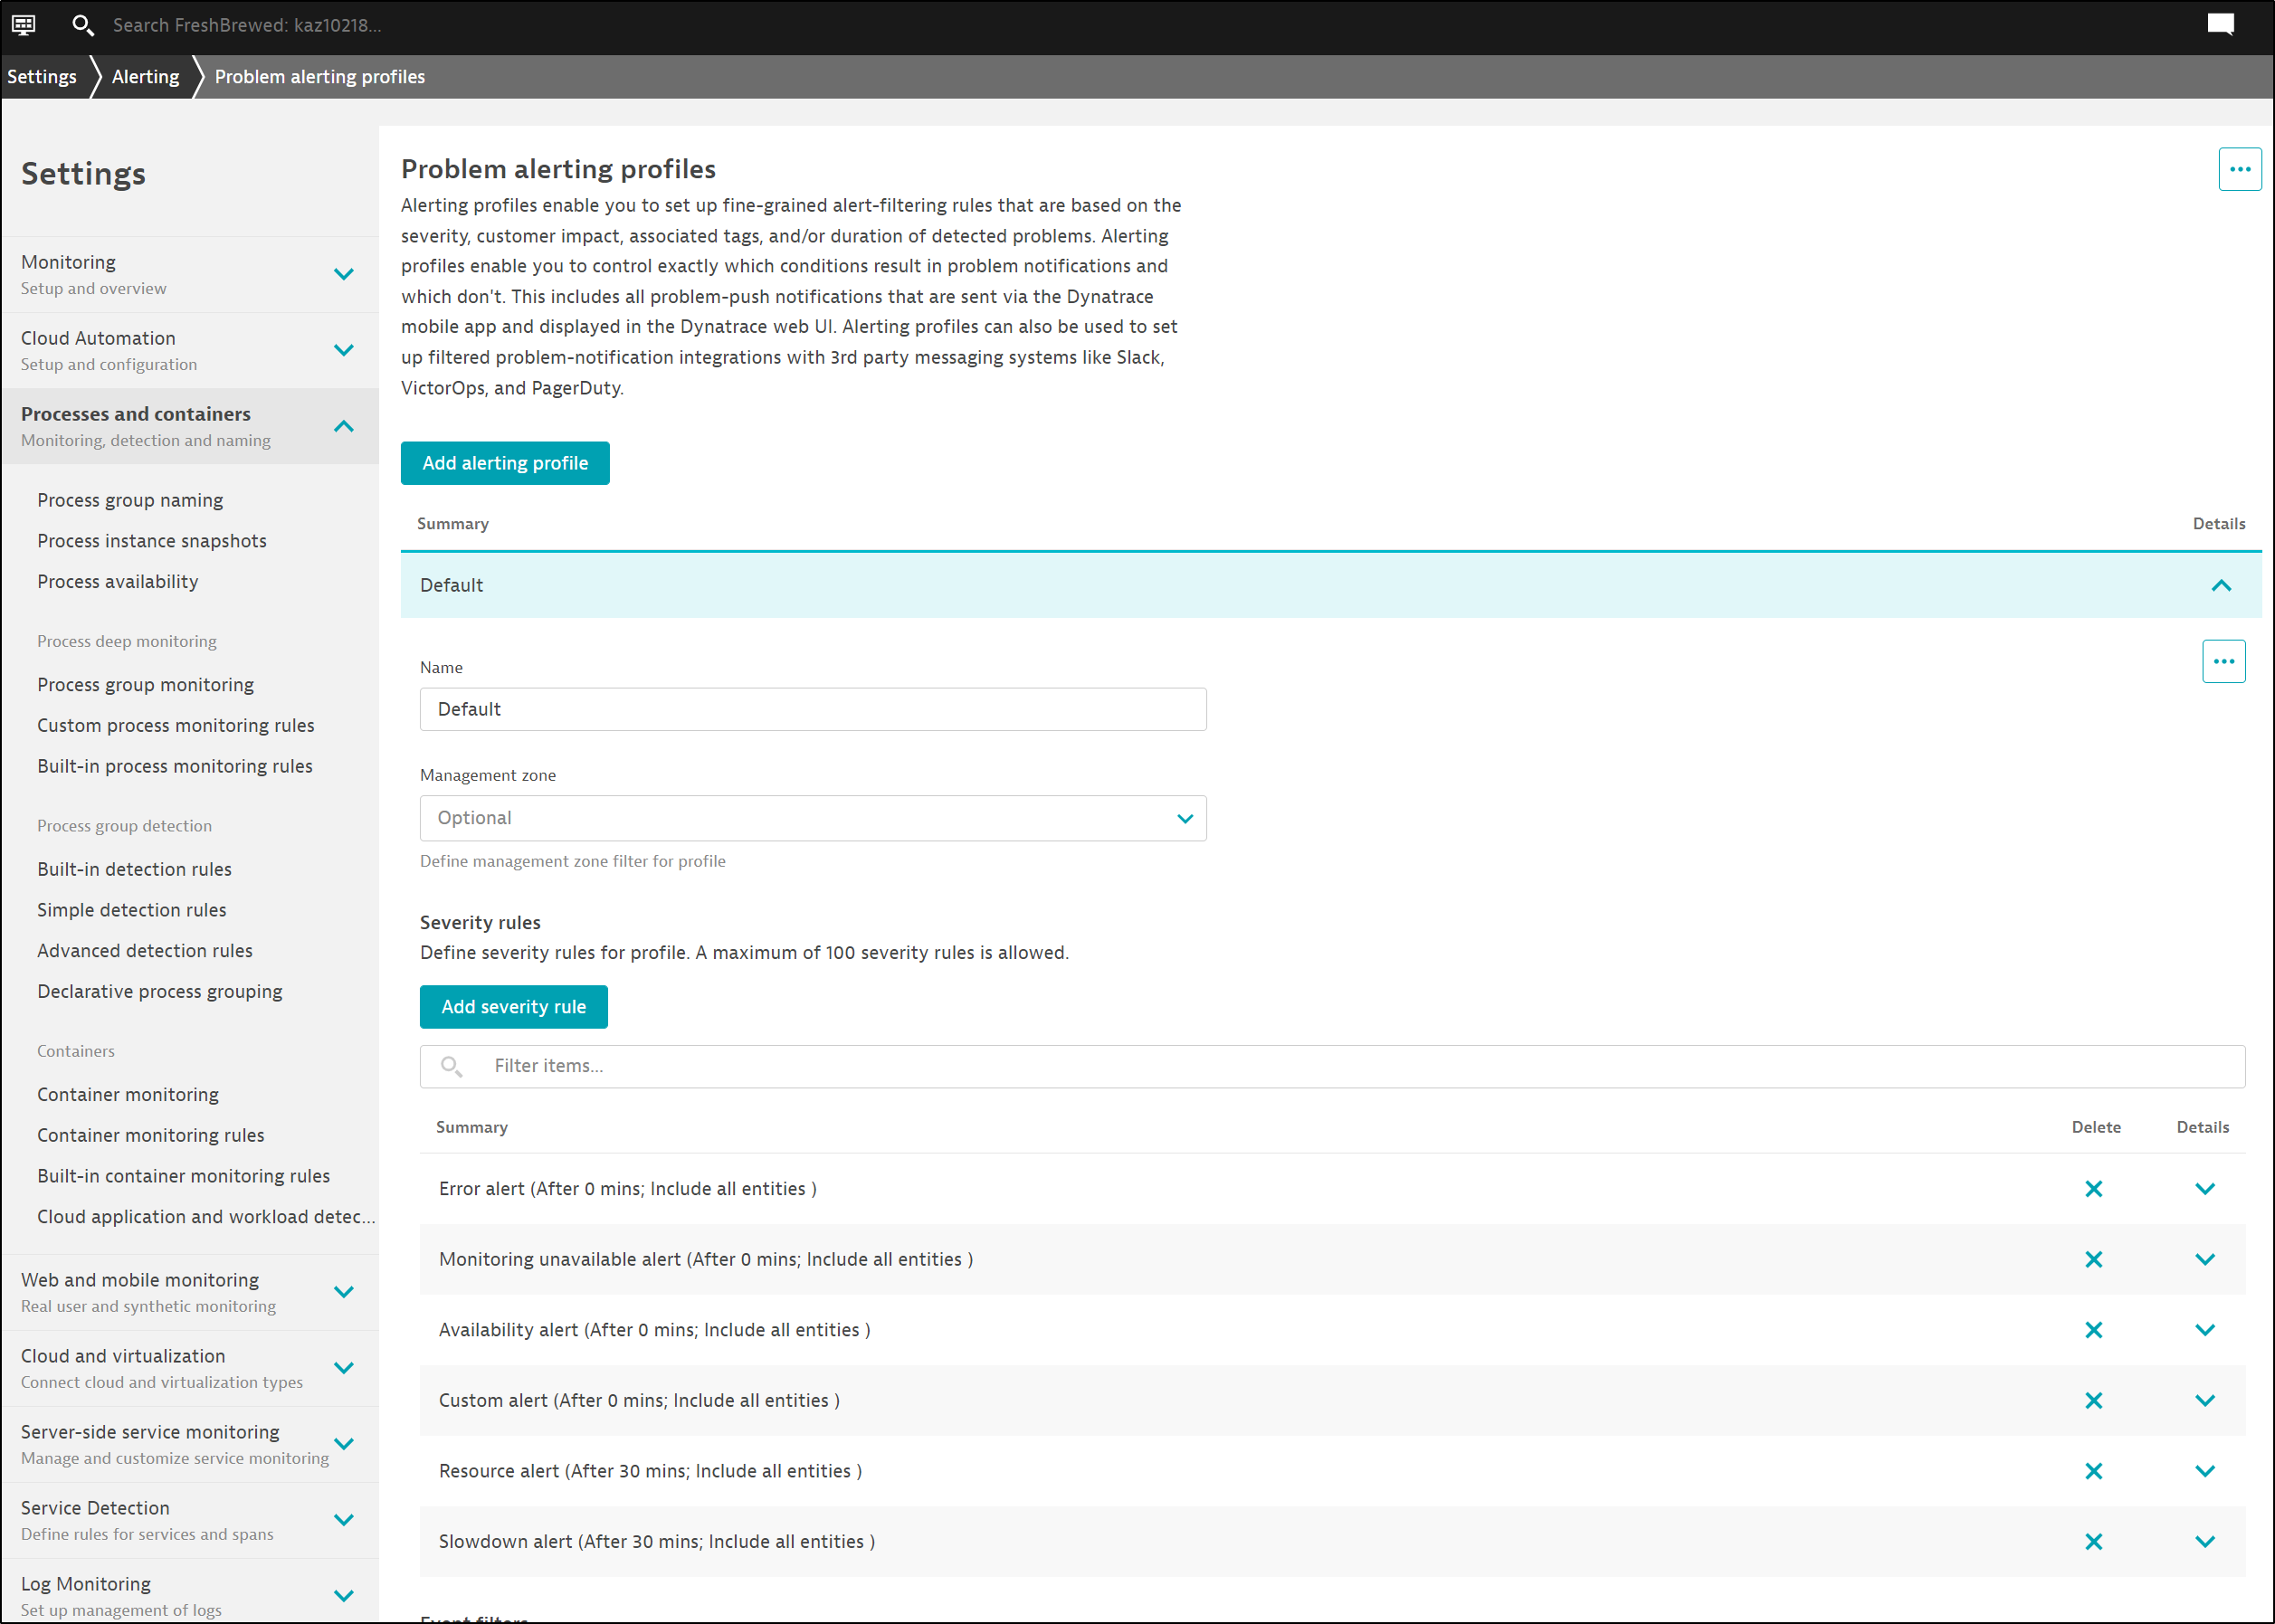
This time I created an Alerting Profile “ShutupPD” in “Settings/Alerting”
Quite simply, it just alerts if an error happens and it occurs on a non-existent tag (asdfasdfasdf).
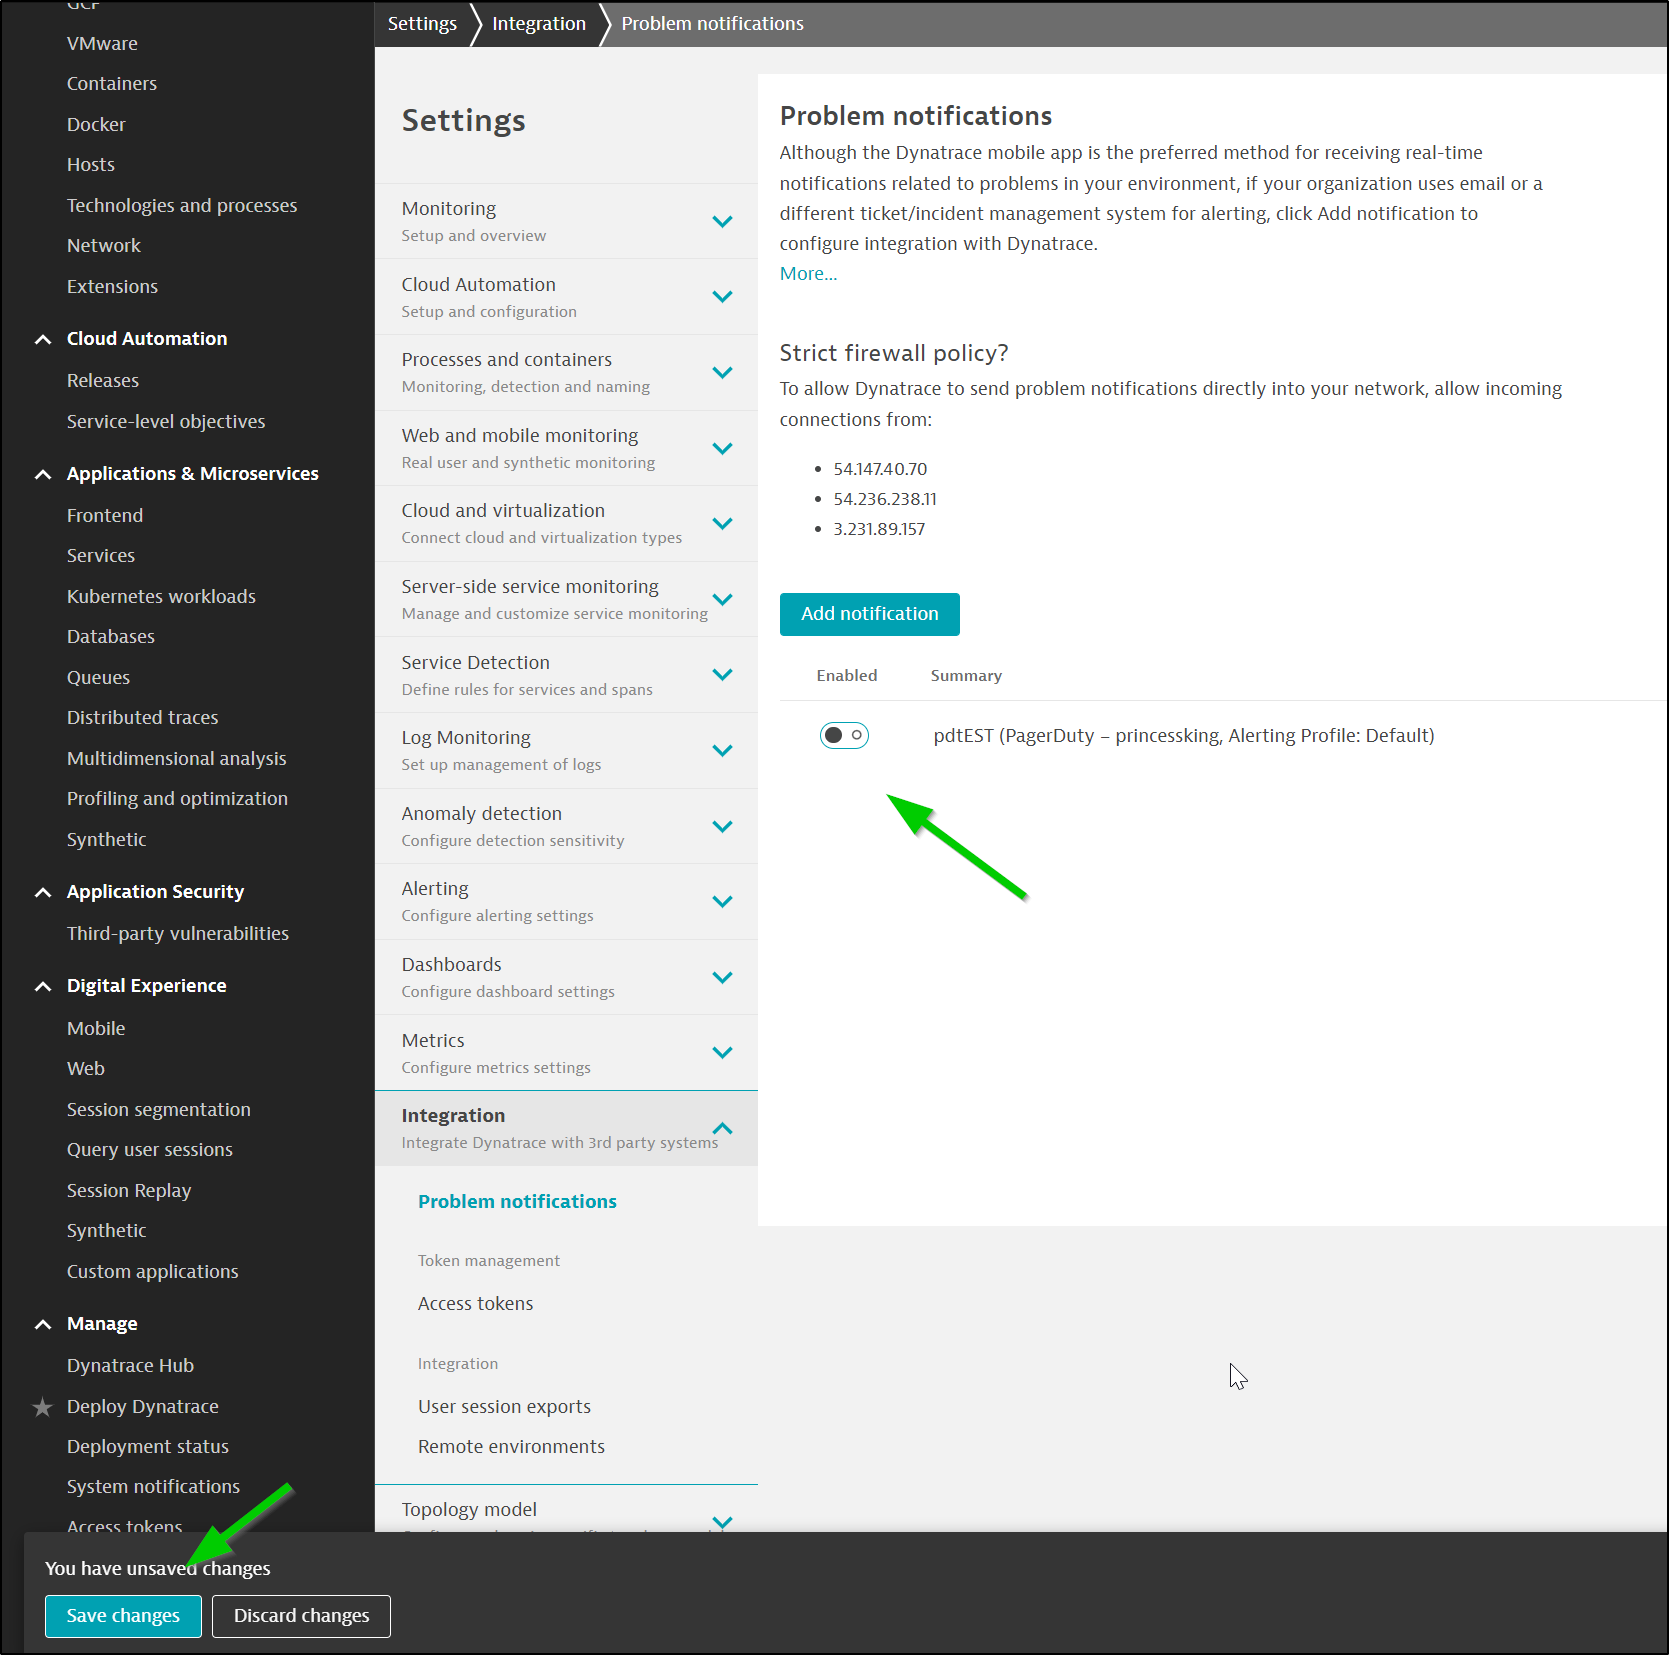
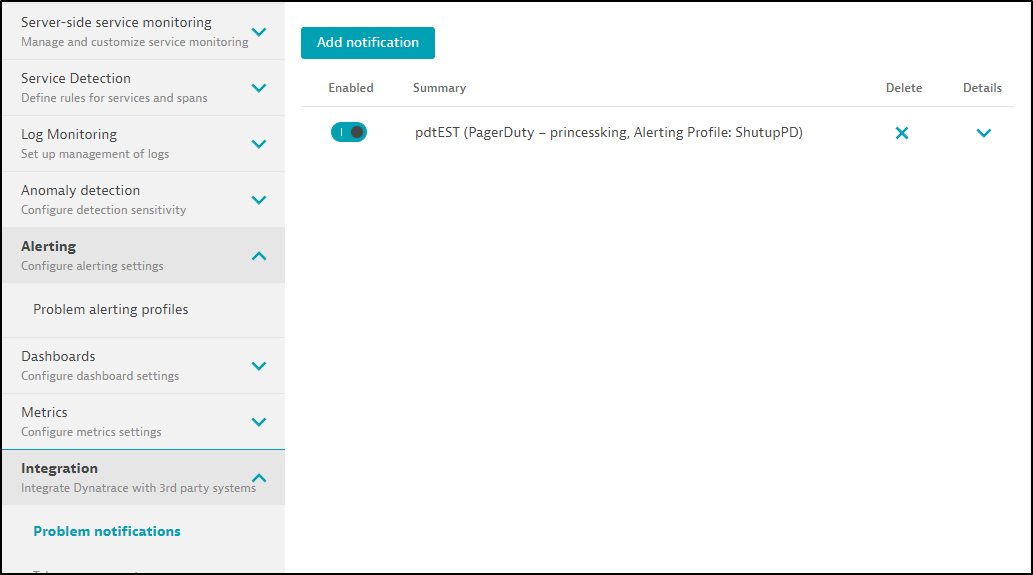
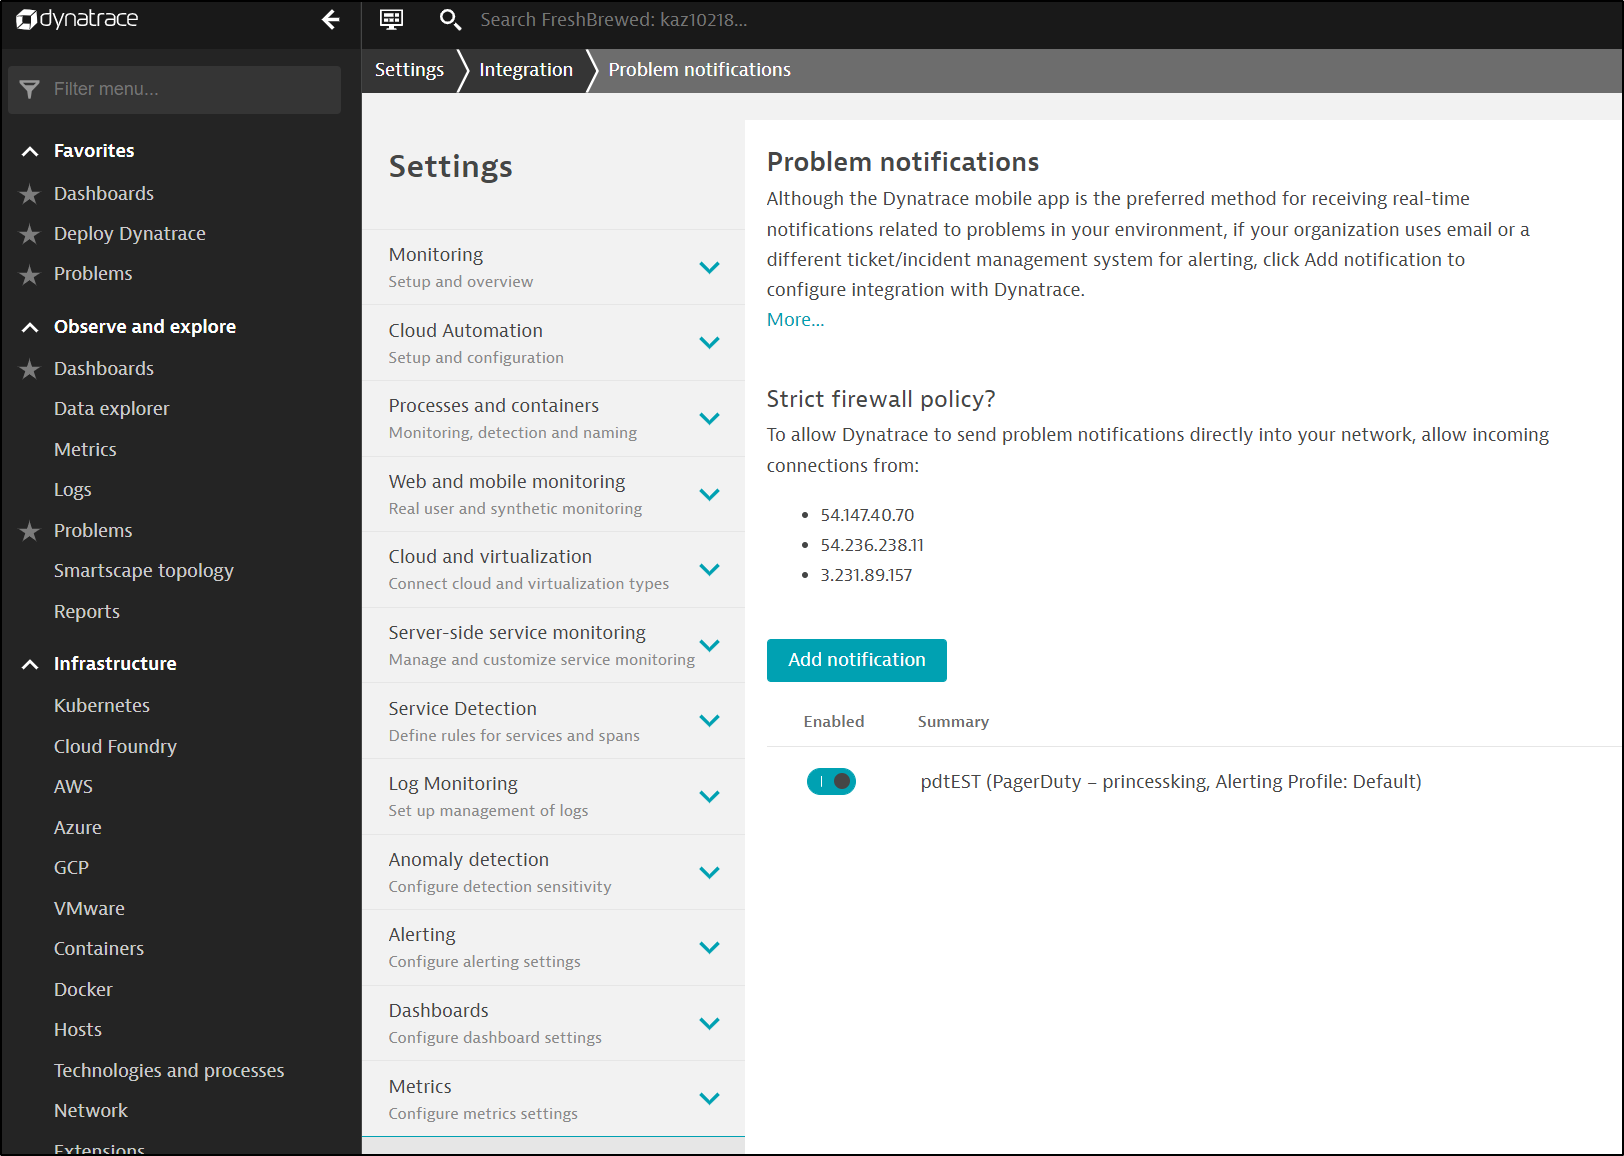
Now I’ll change my Problem Notifications in Integration to only trigger PD on the “ShutupPD” Alerting Profile
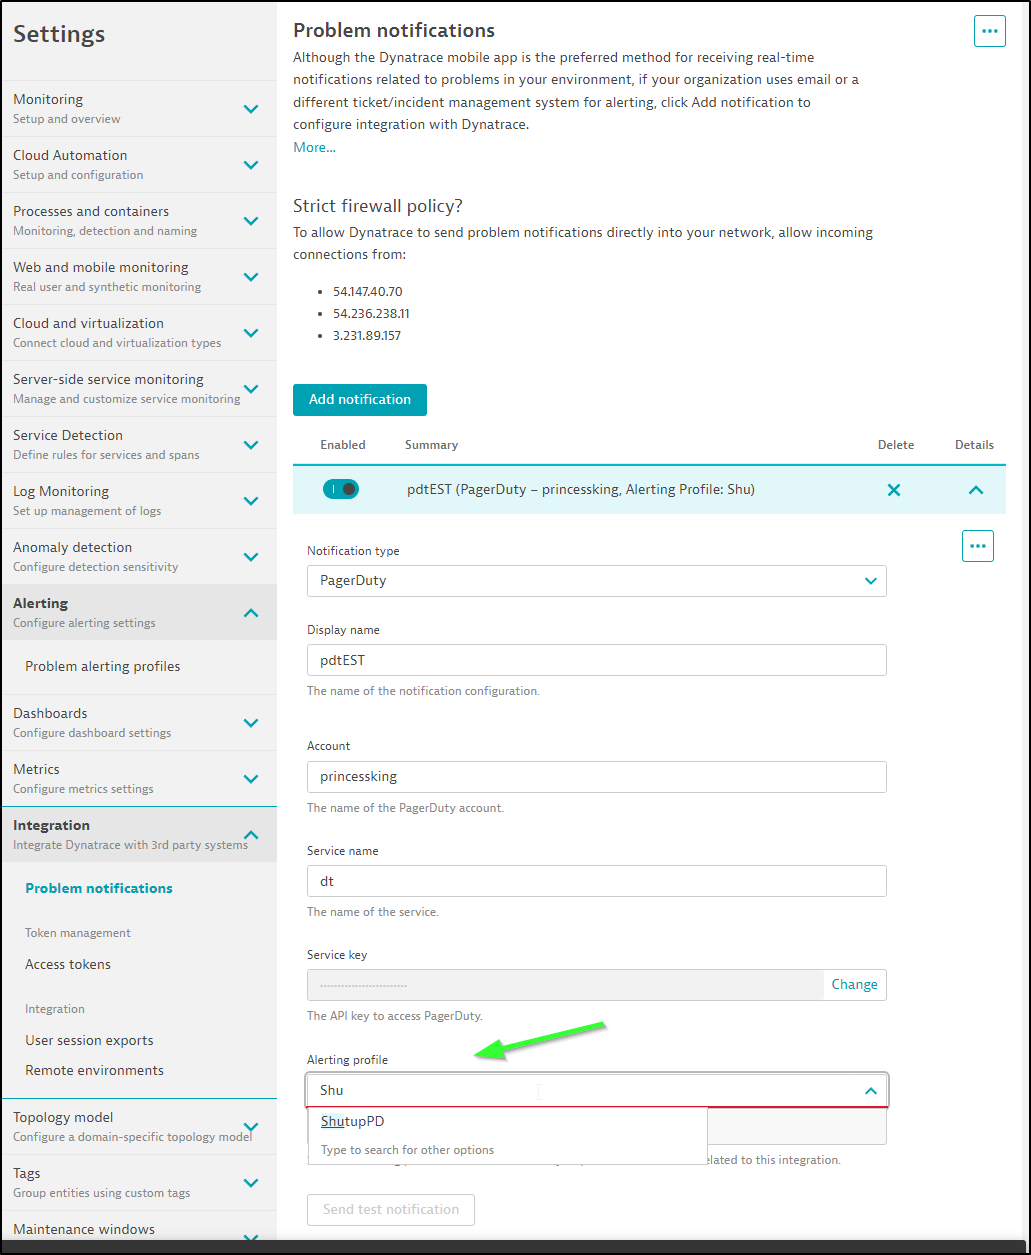
I can see it is now changed (so we’ll see if comes back)
I hopped into PD and resolved the lot of existing issues
Profiling and Optimization
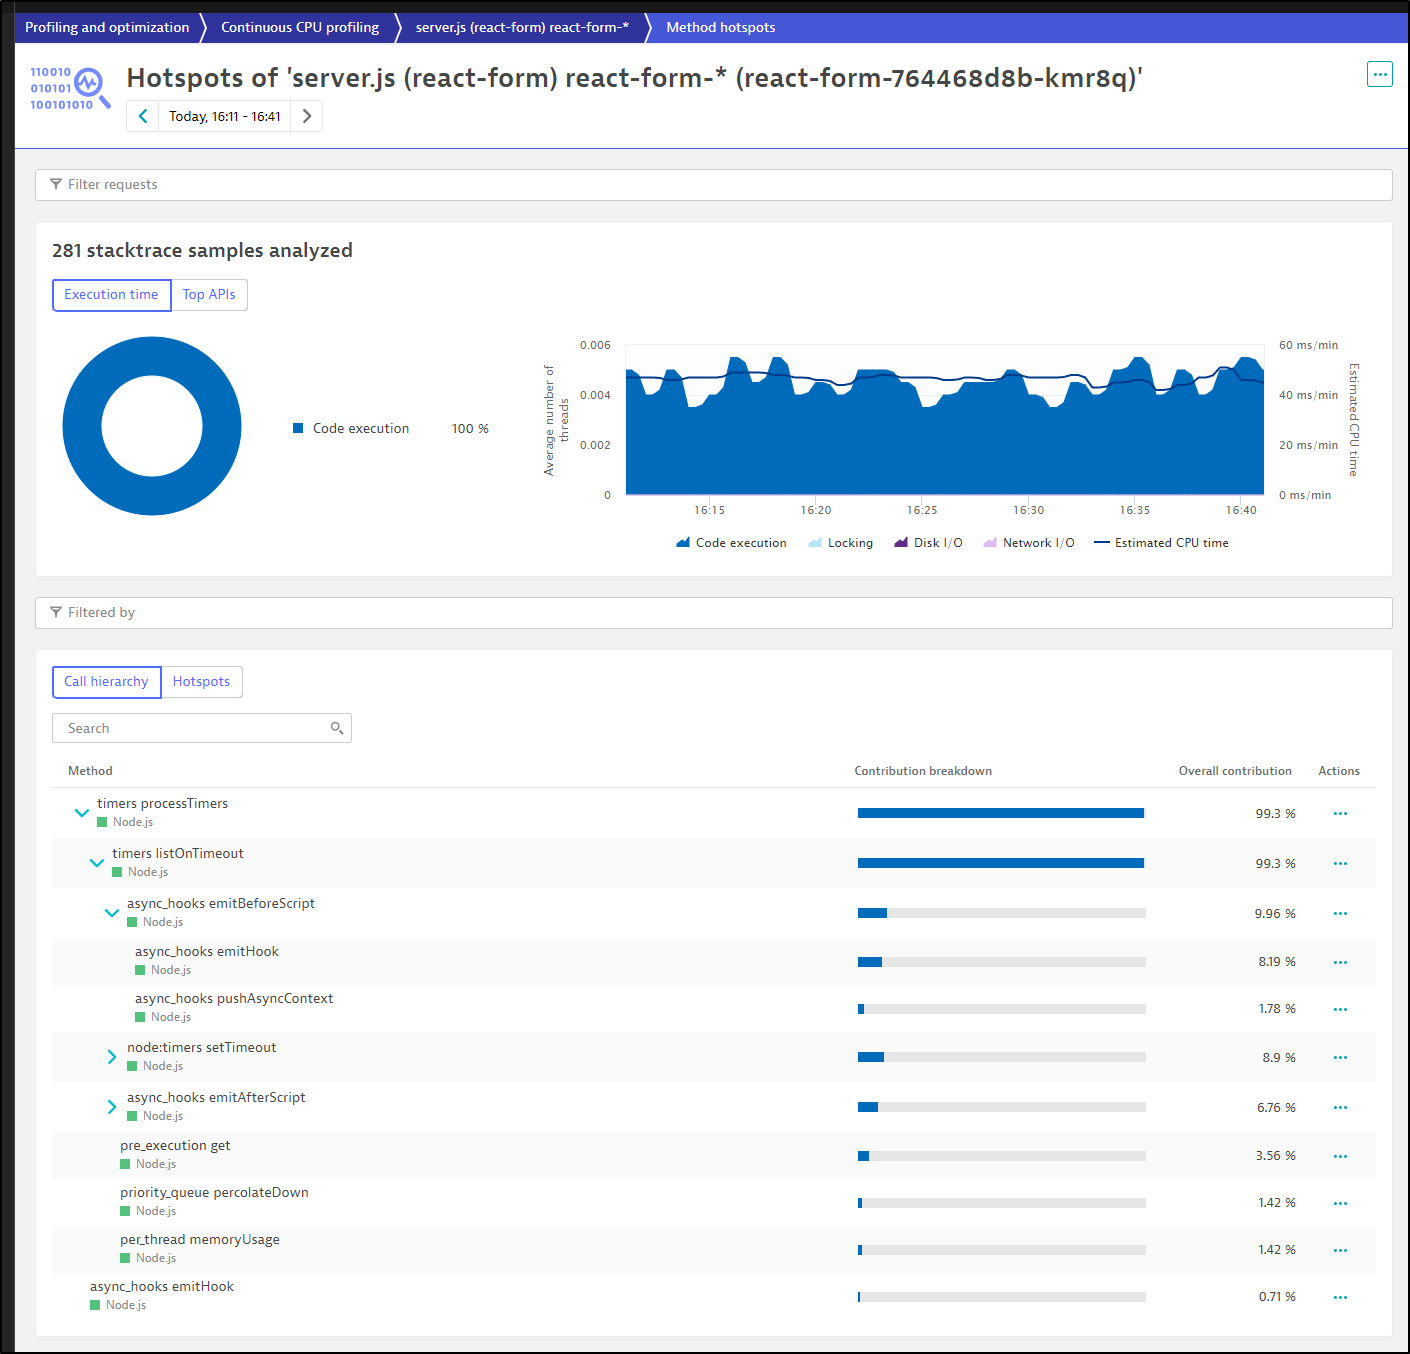
I won’t get too deep into profiling, other than to say I continue to be amazed at how deep Dynatrace can go into my code just seeing containers.
I dug into my react-form and could break down the calls my method
Alerting
There is little to show for alerting. I searched the UI for anything akin to notification destinations.
It seems one can create profiles that can be consumed by other apps.
There just isn’t much there, even if you read the docs
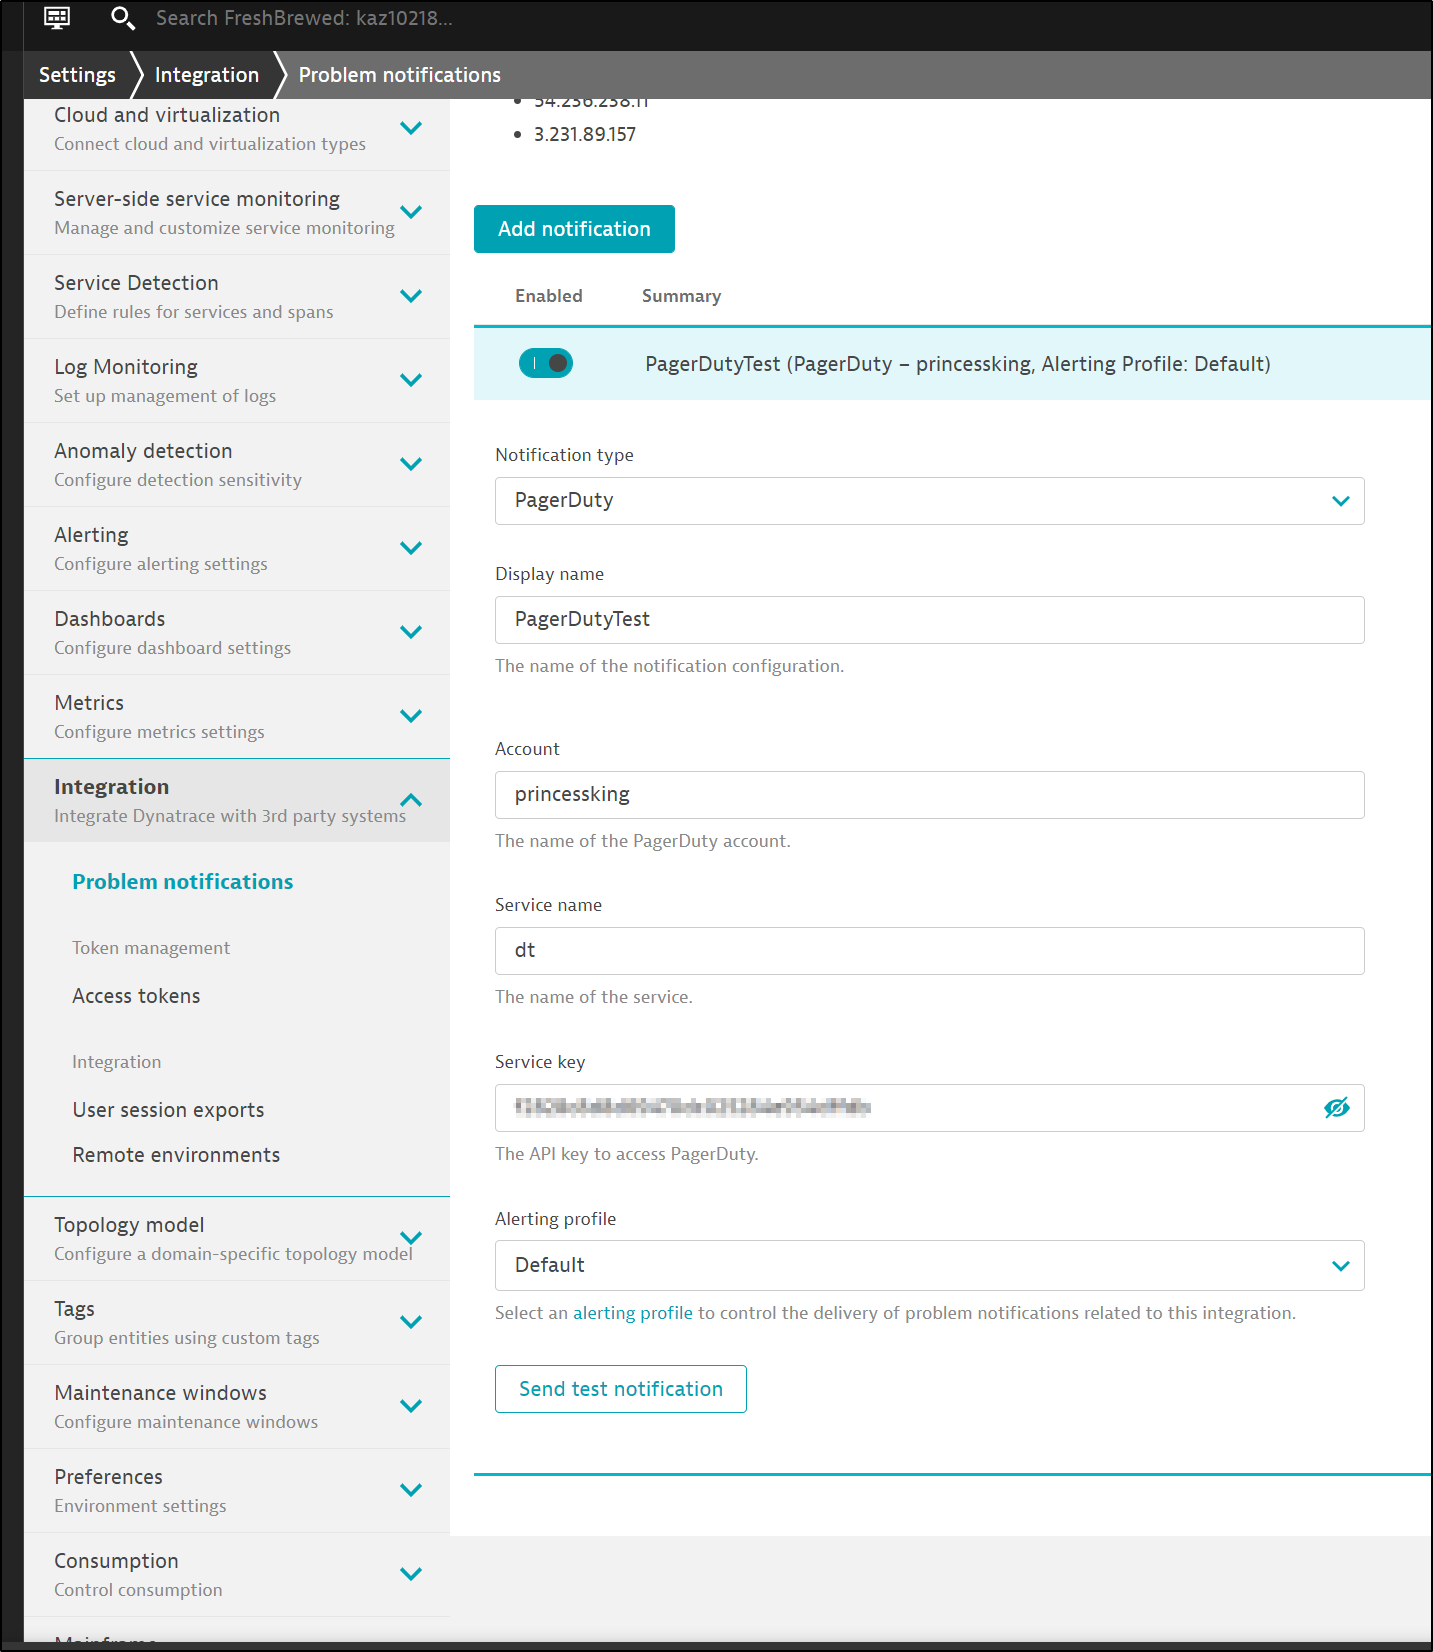
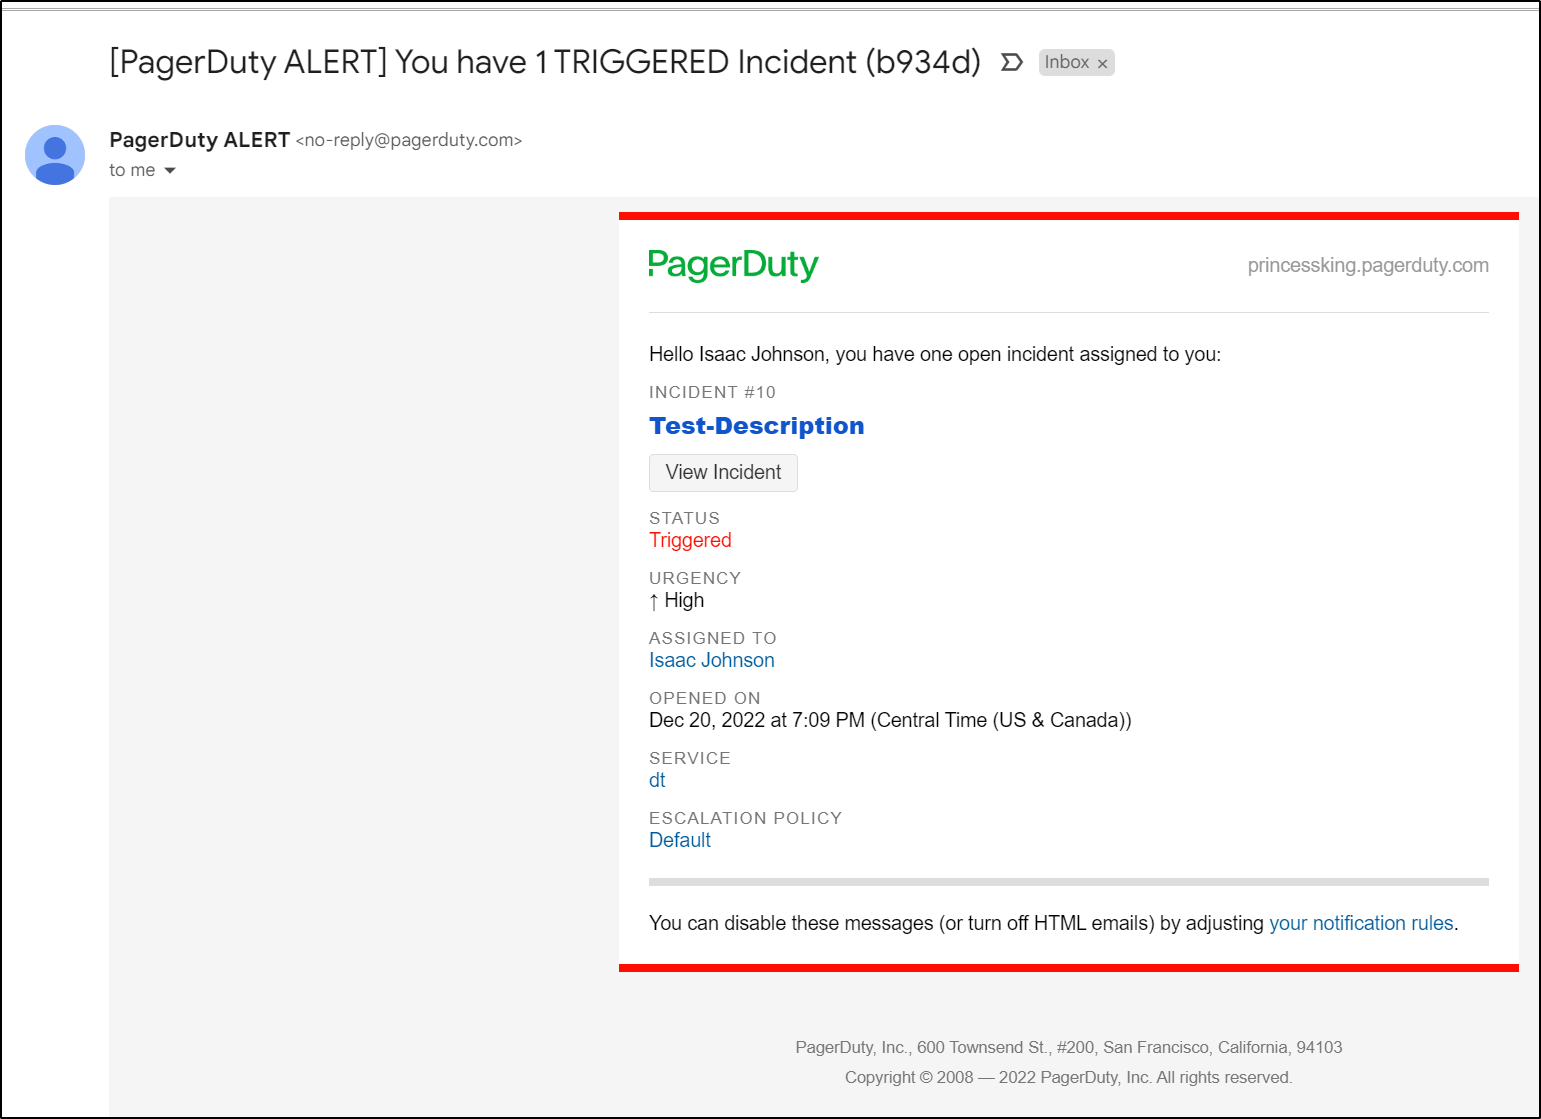
I can create a pager duty problem notification
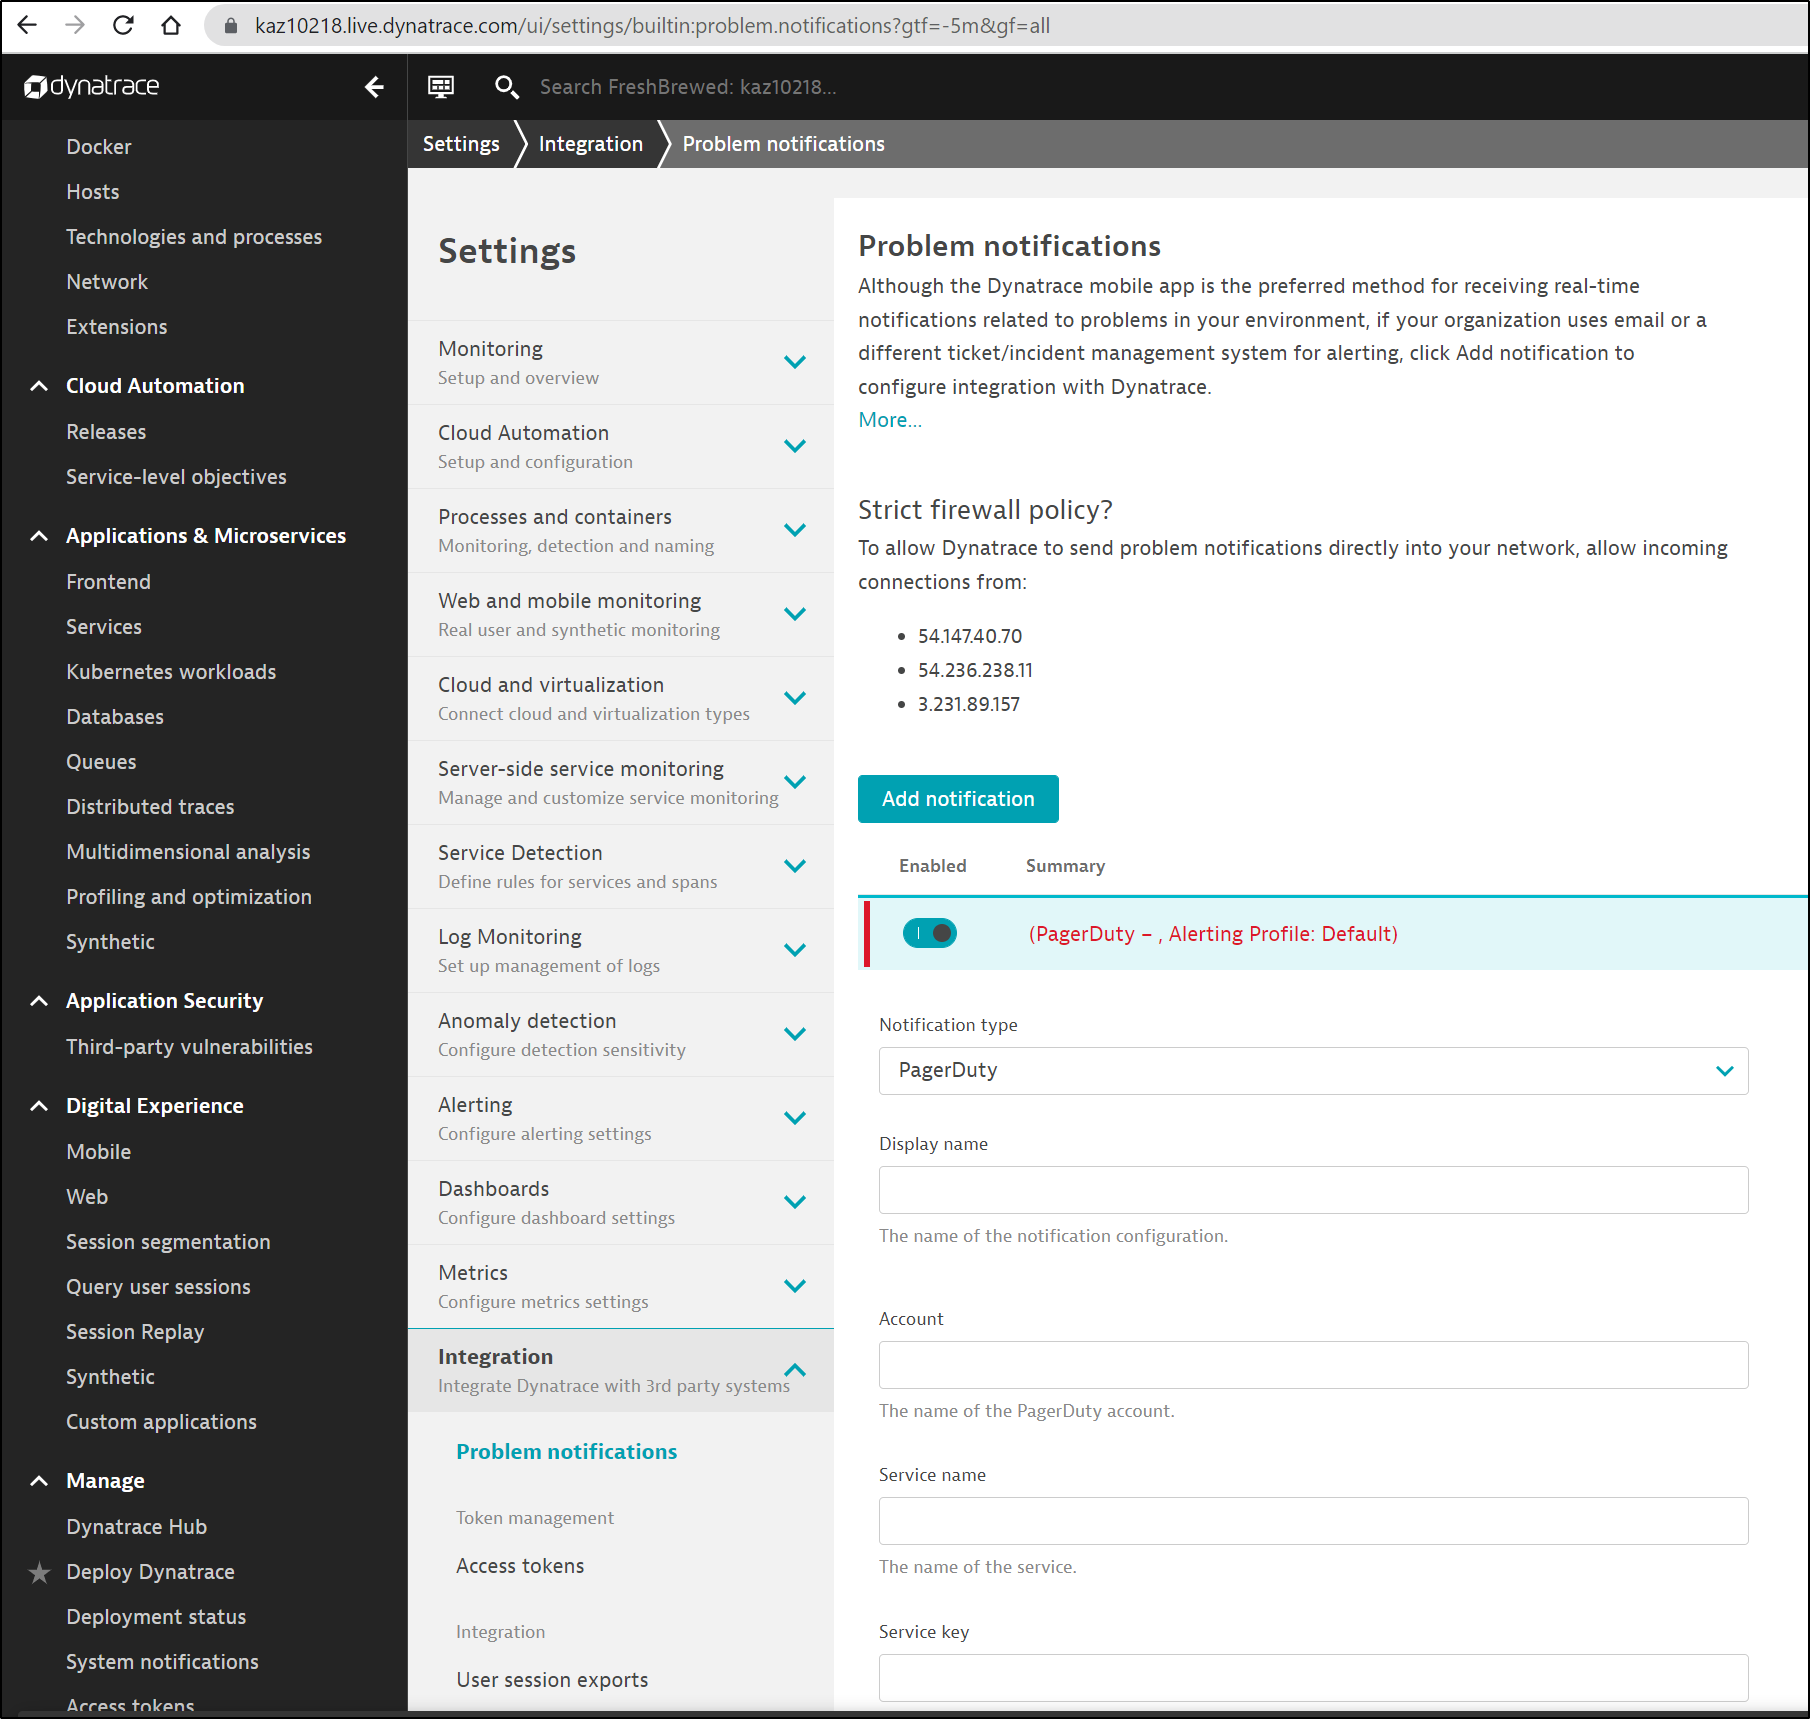
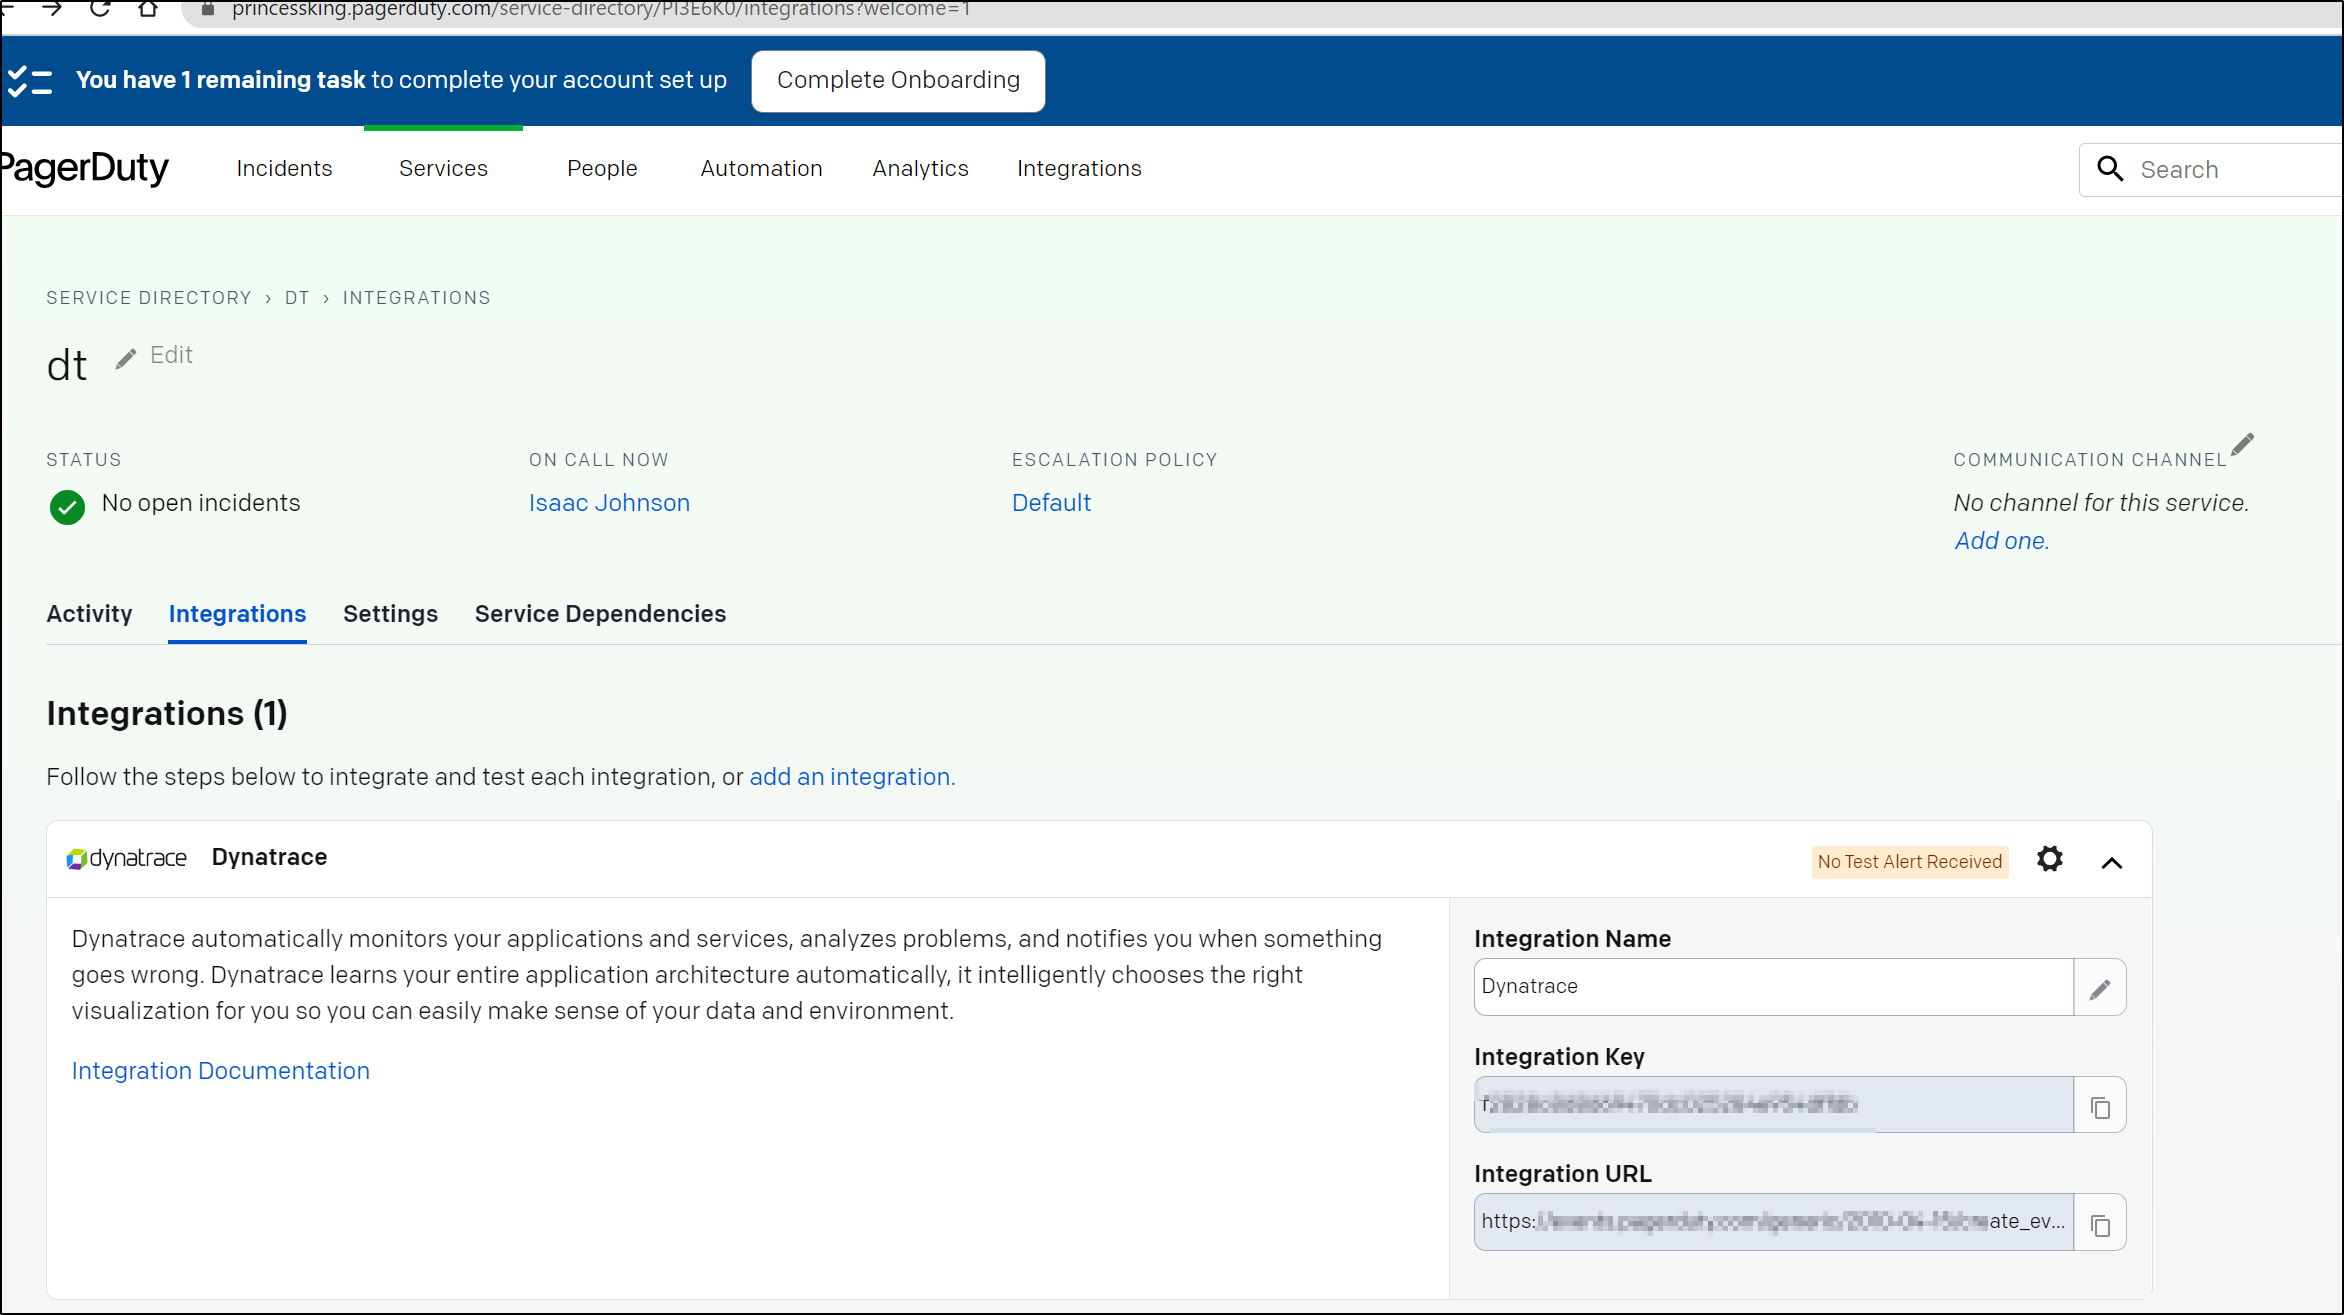
In PagerDuty I need to setup an integration to get the key and URL
I can then click “Send test notification”
confirmation
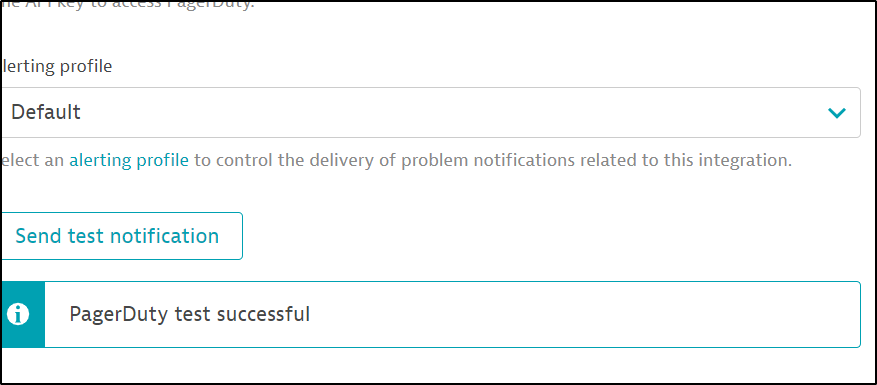
and see it was sent
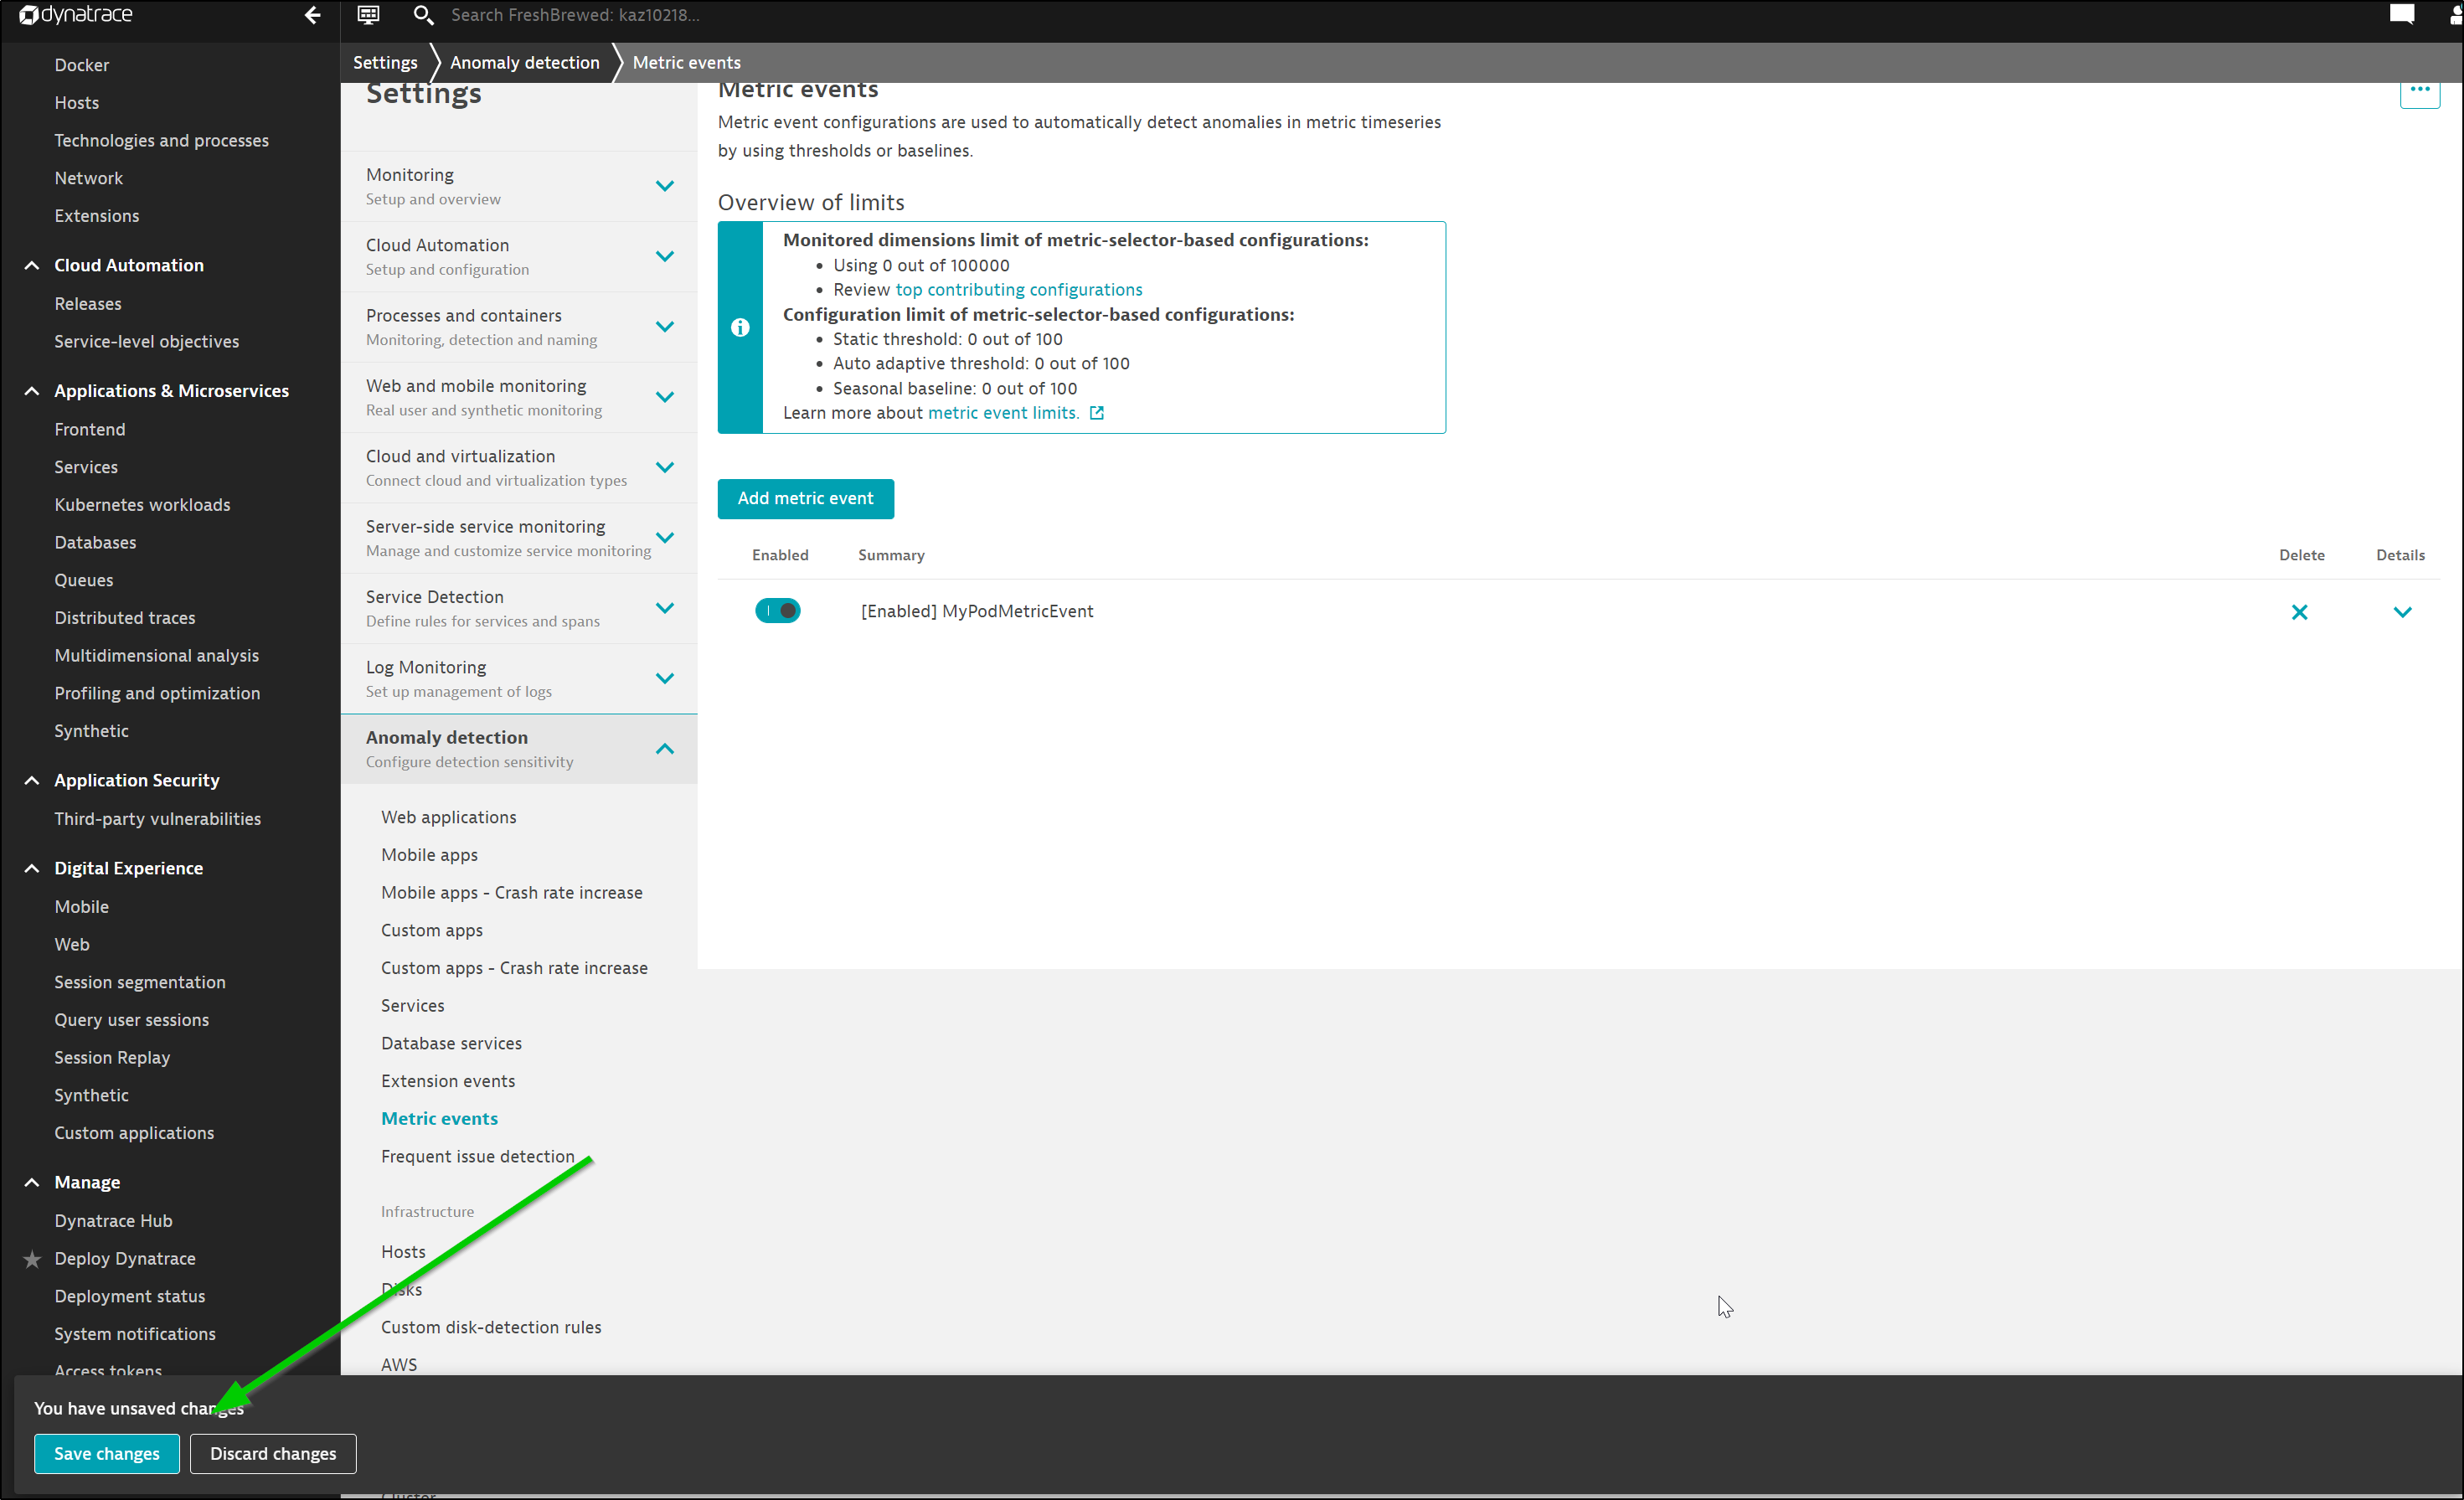
To use it, we go to Settings, Anomaly Detection.
If we wanted to trigger on a metric anomaly.
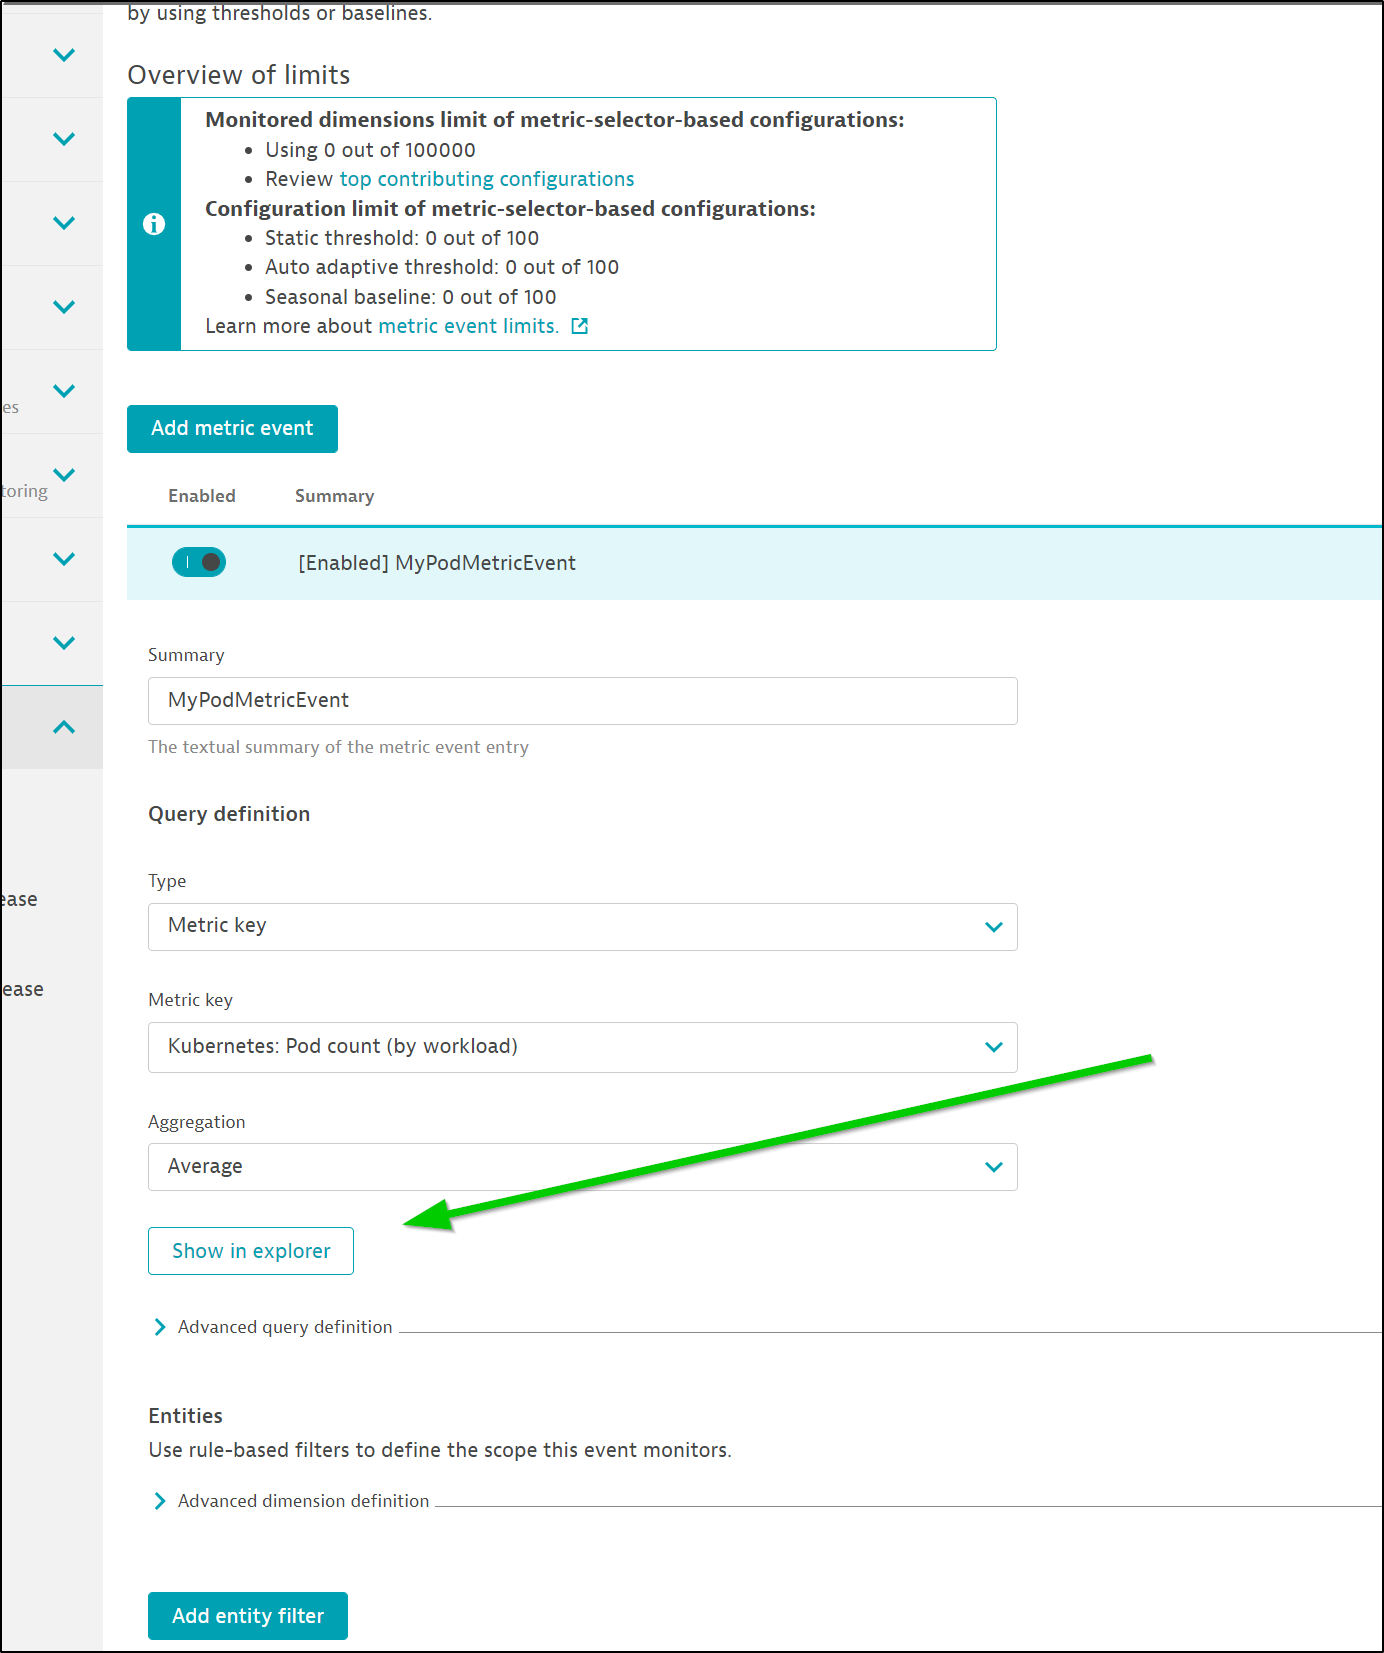
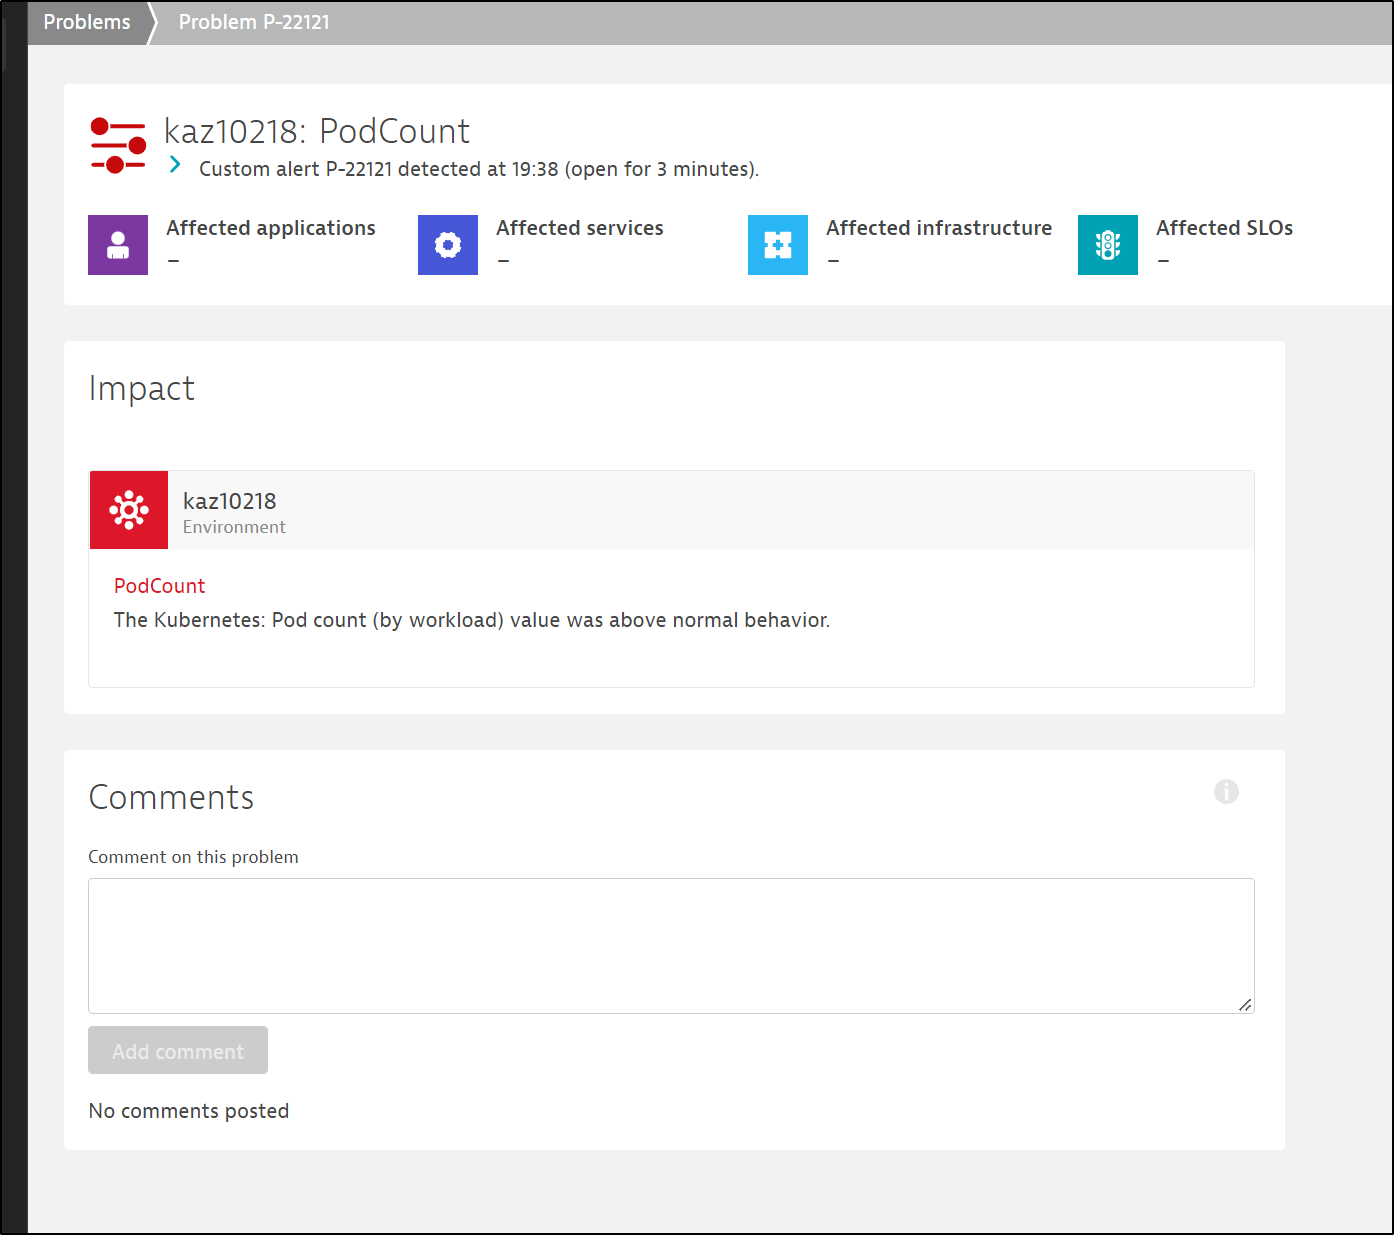
I create one based on “Pod count”
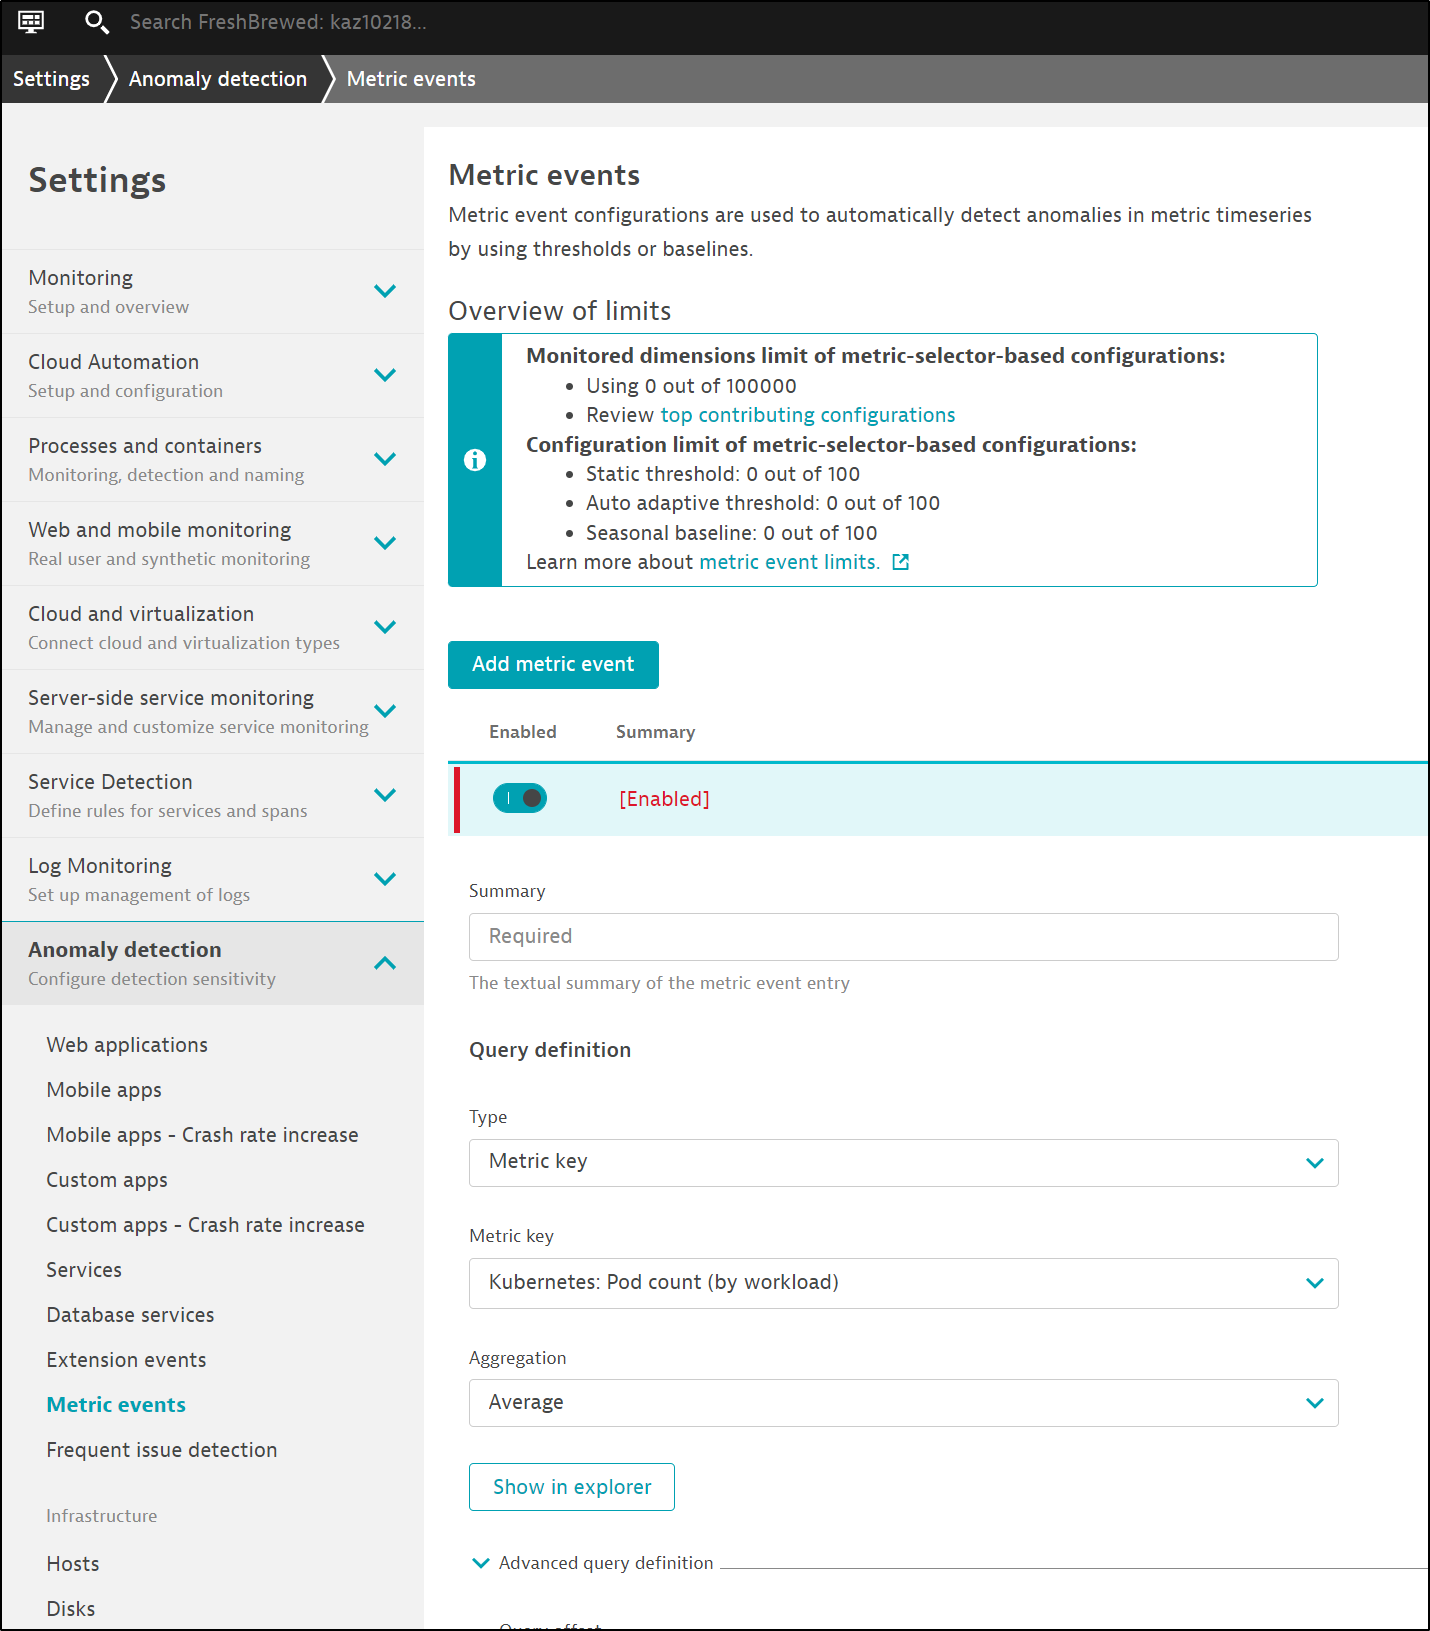
I can set a threshold as well as a few filters, such as by entity or a dimension filter
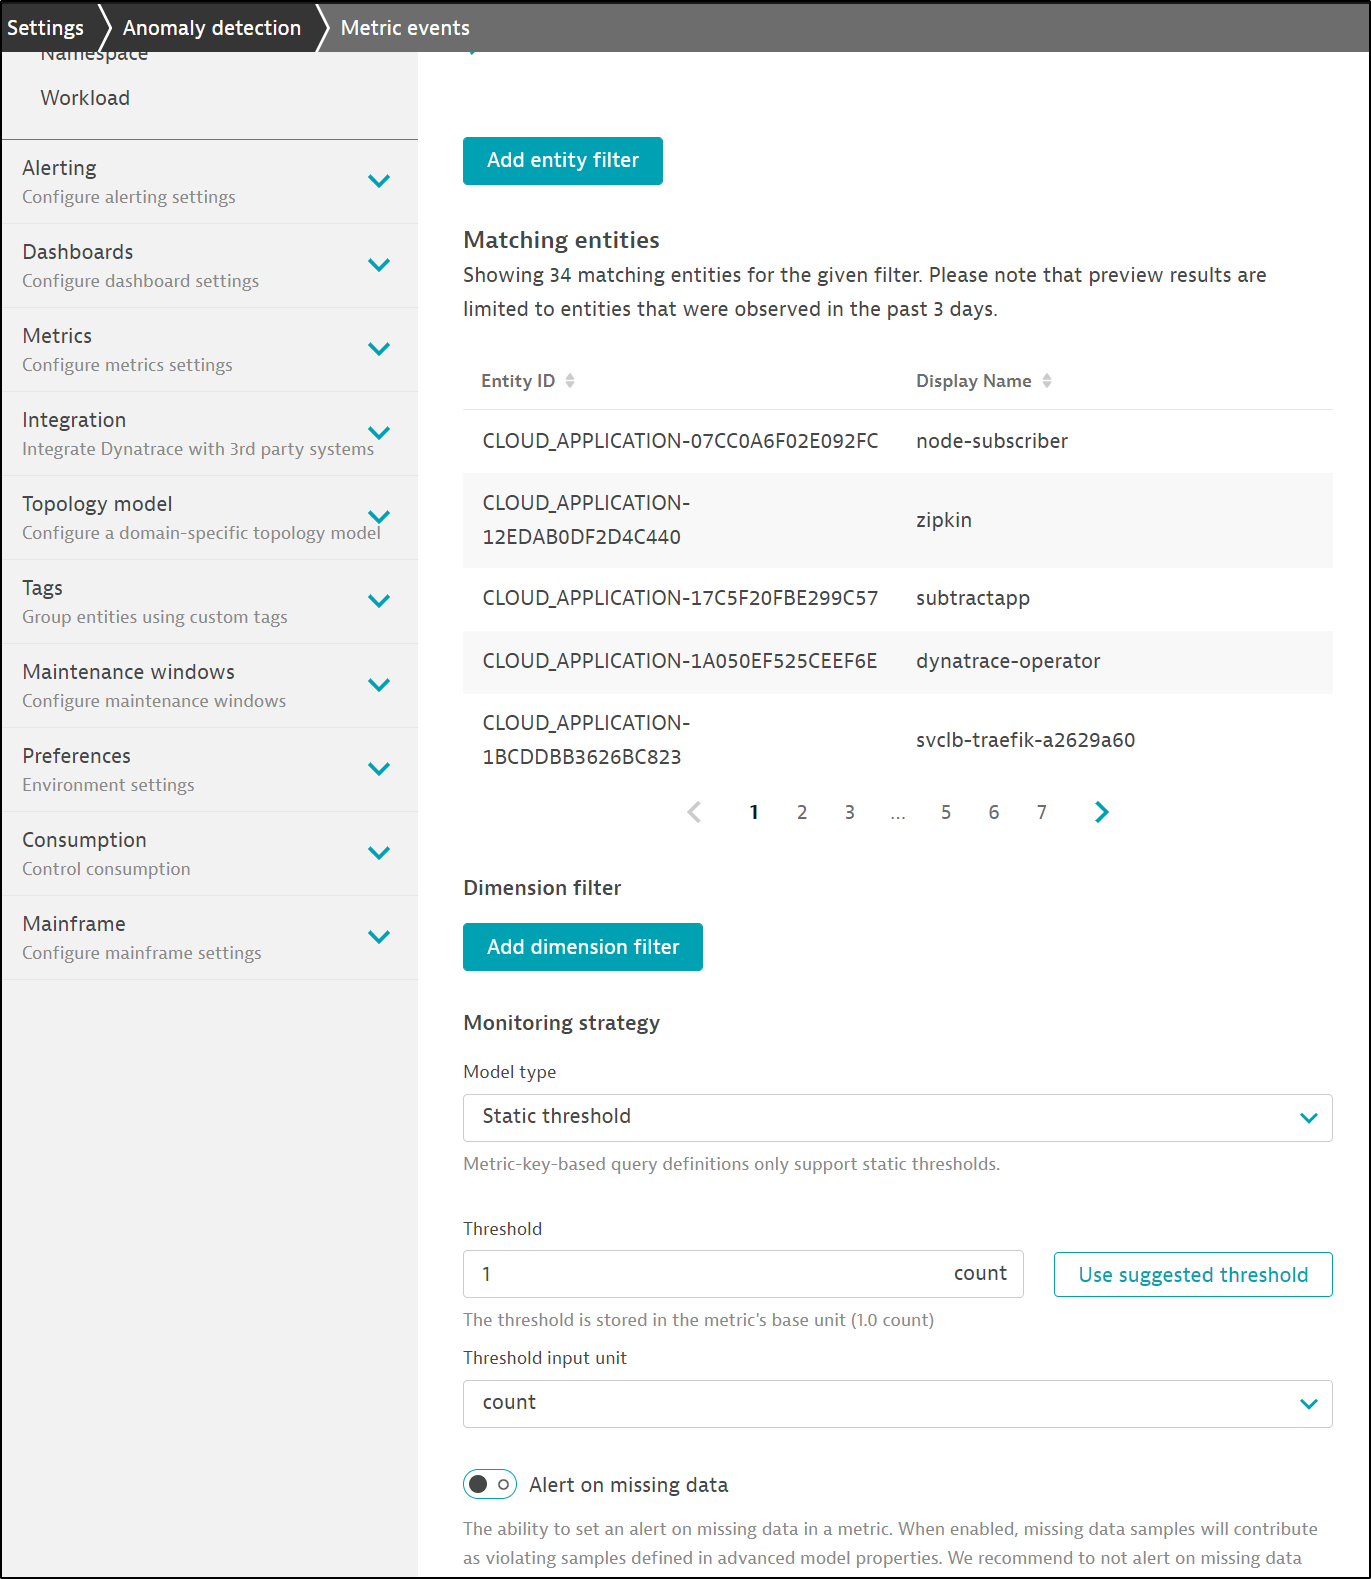
I can set a name
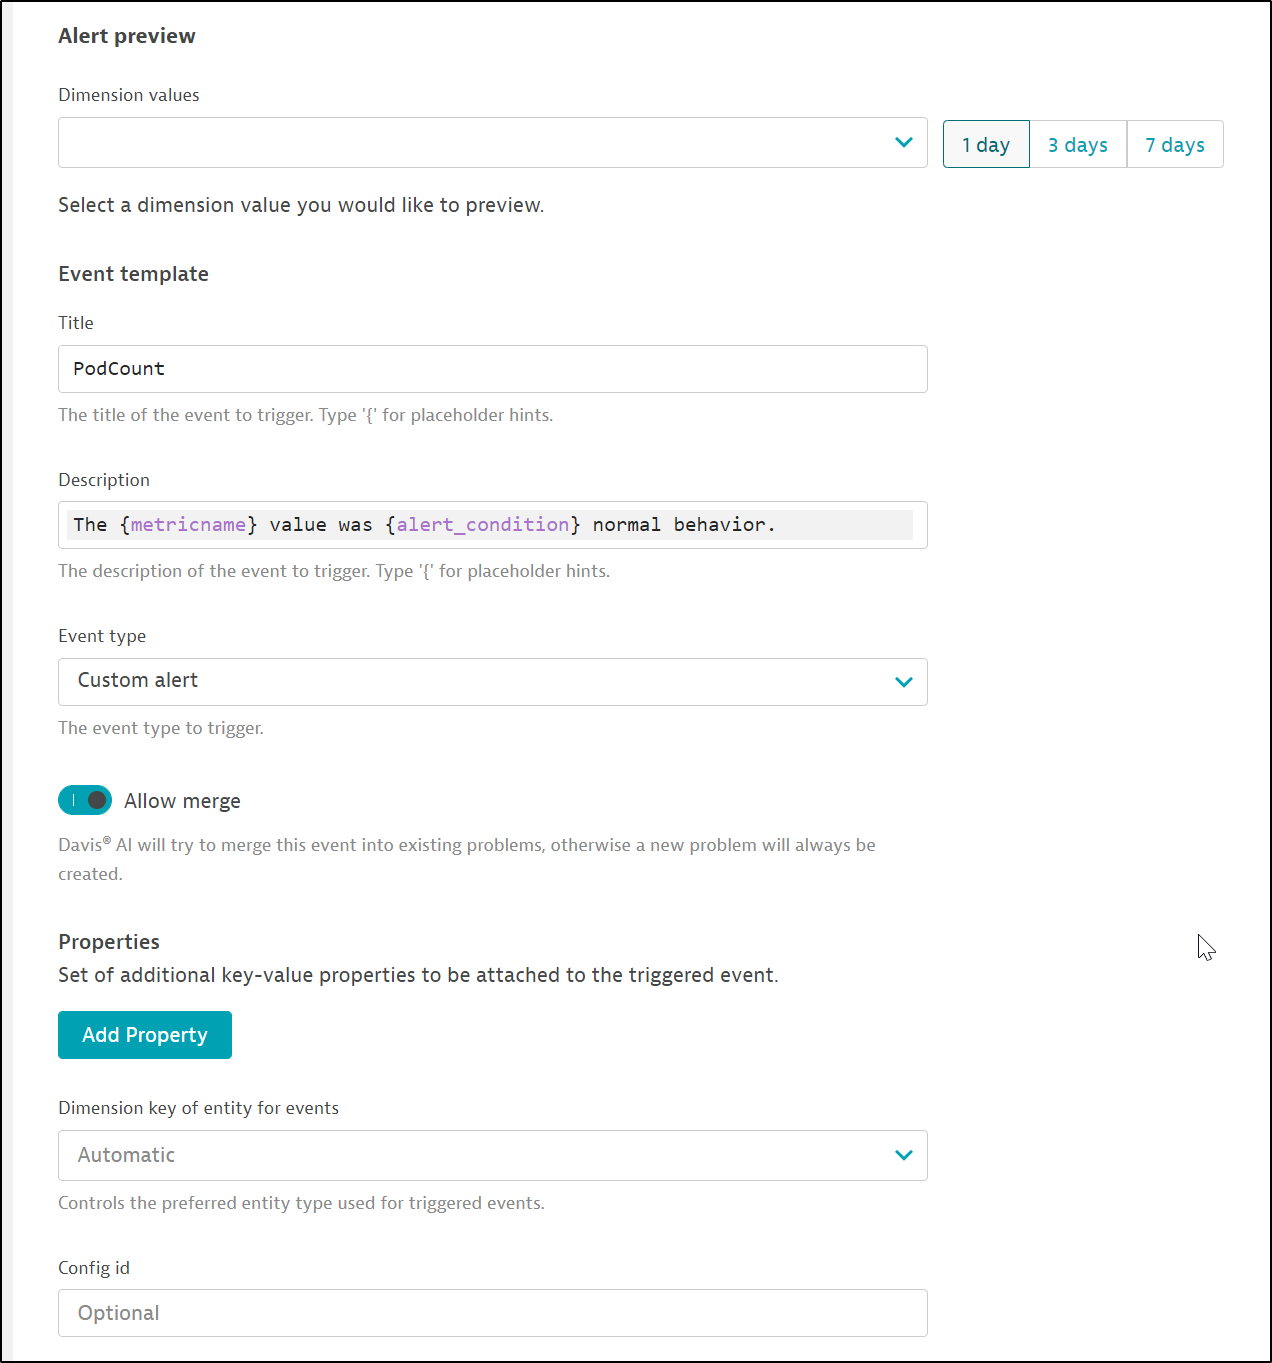
and once all the fields are set, I can save changes (using the distant bottom left save)
Unlike Datadog, there is no warn vs alert threshold. Nor is there an inline preview. However, we can click the “Show in explorer” button
which will render the metric on our time window
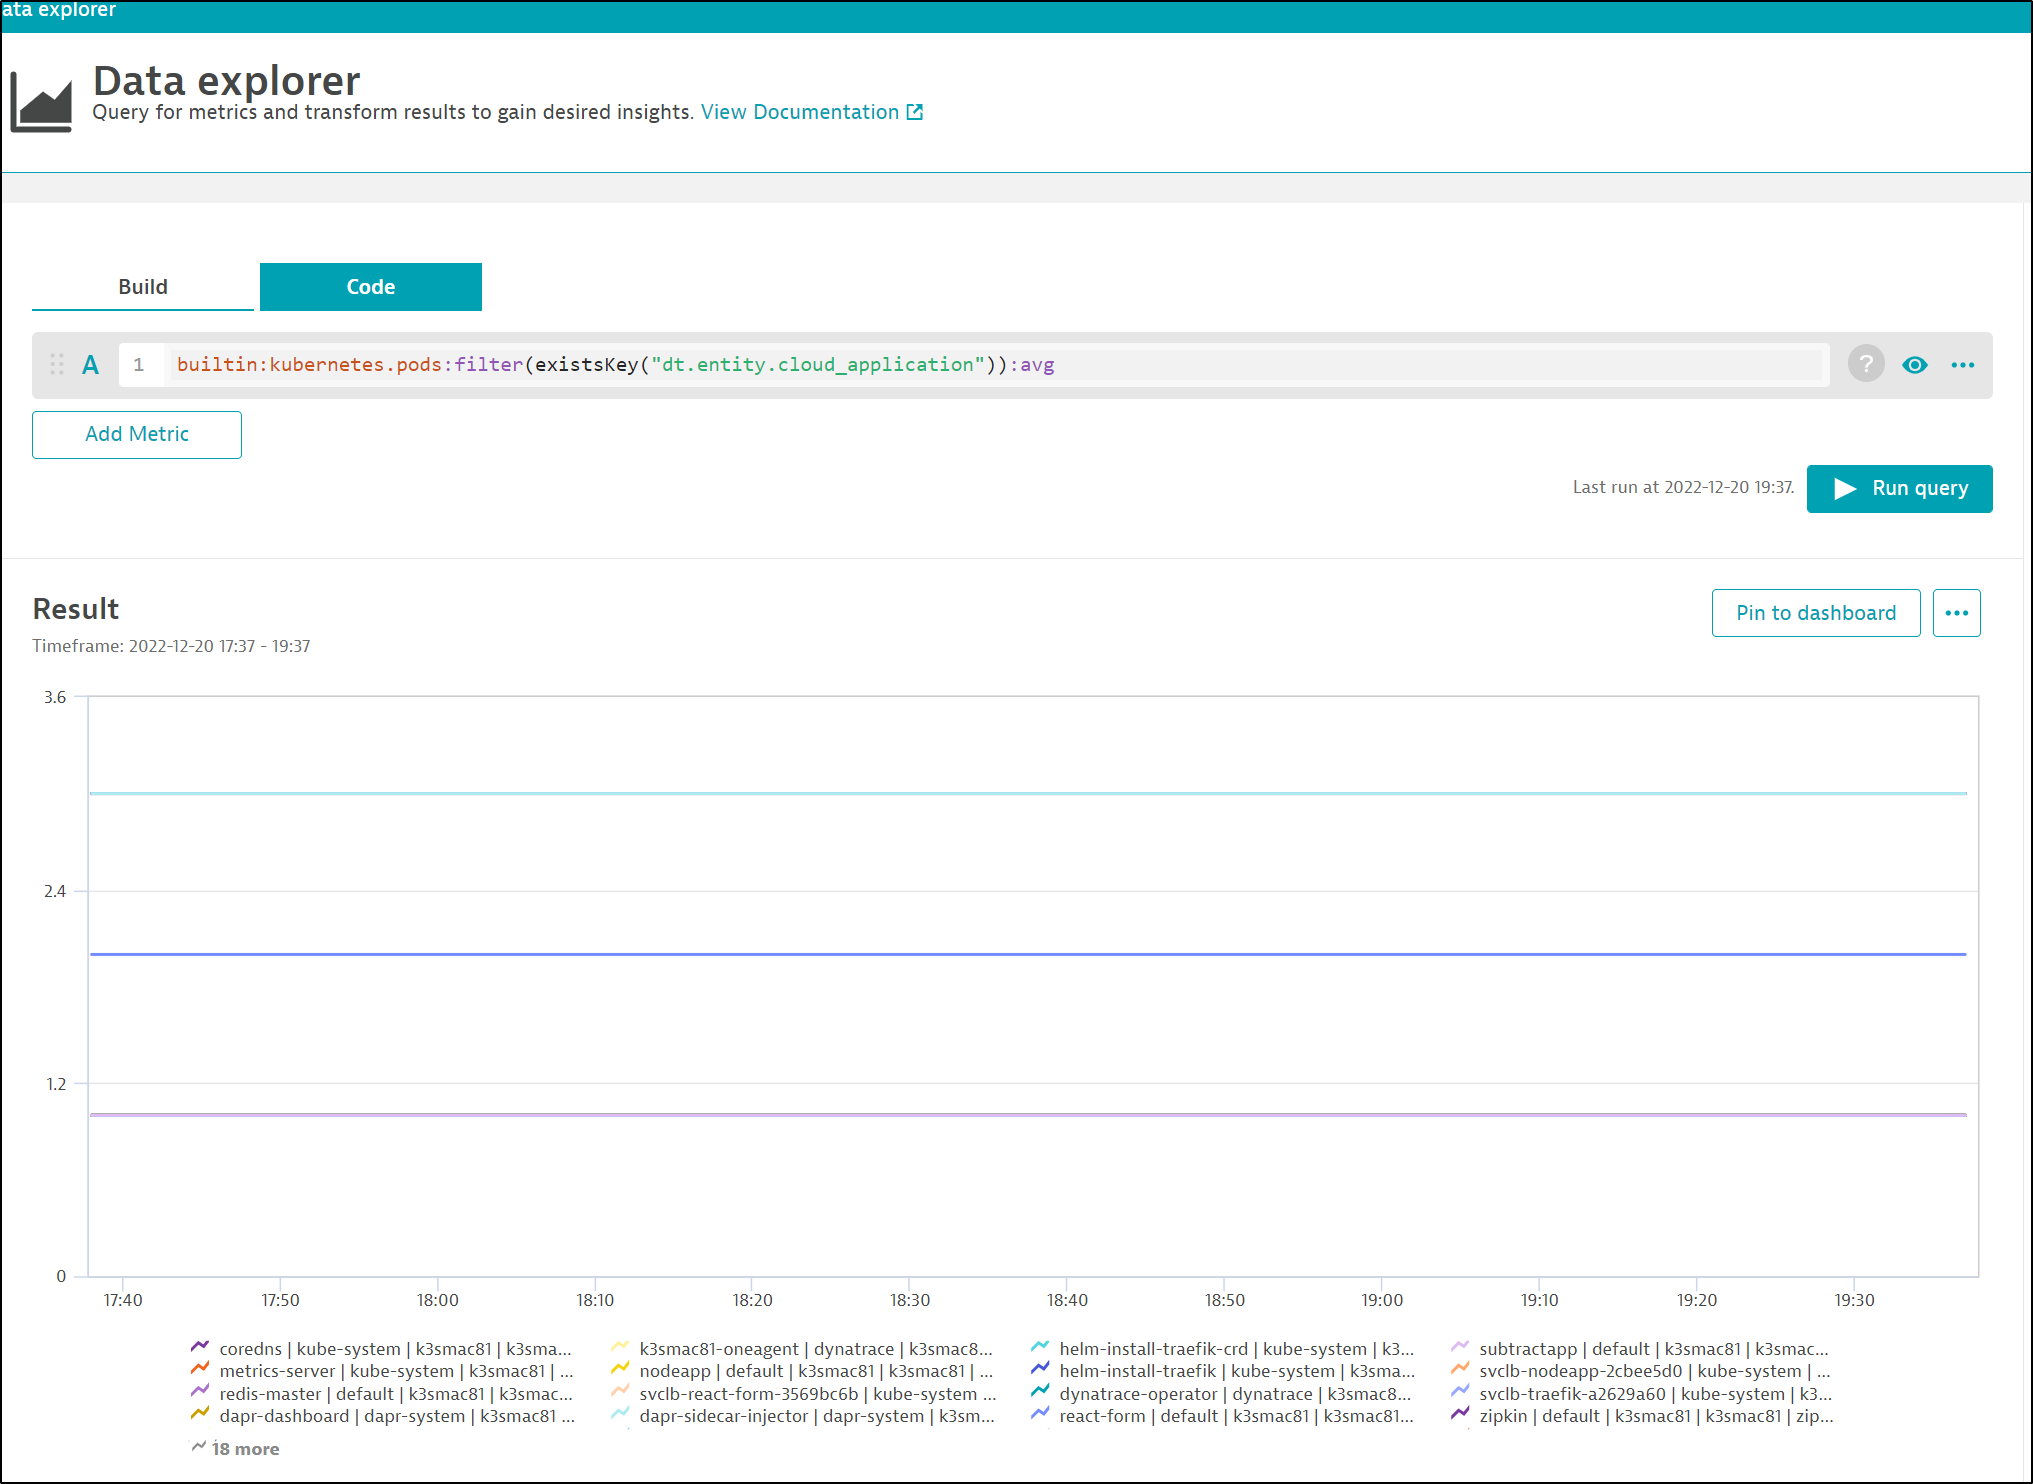
In about a minute I saw a Problem arise
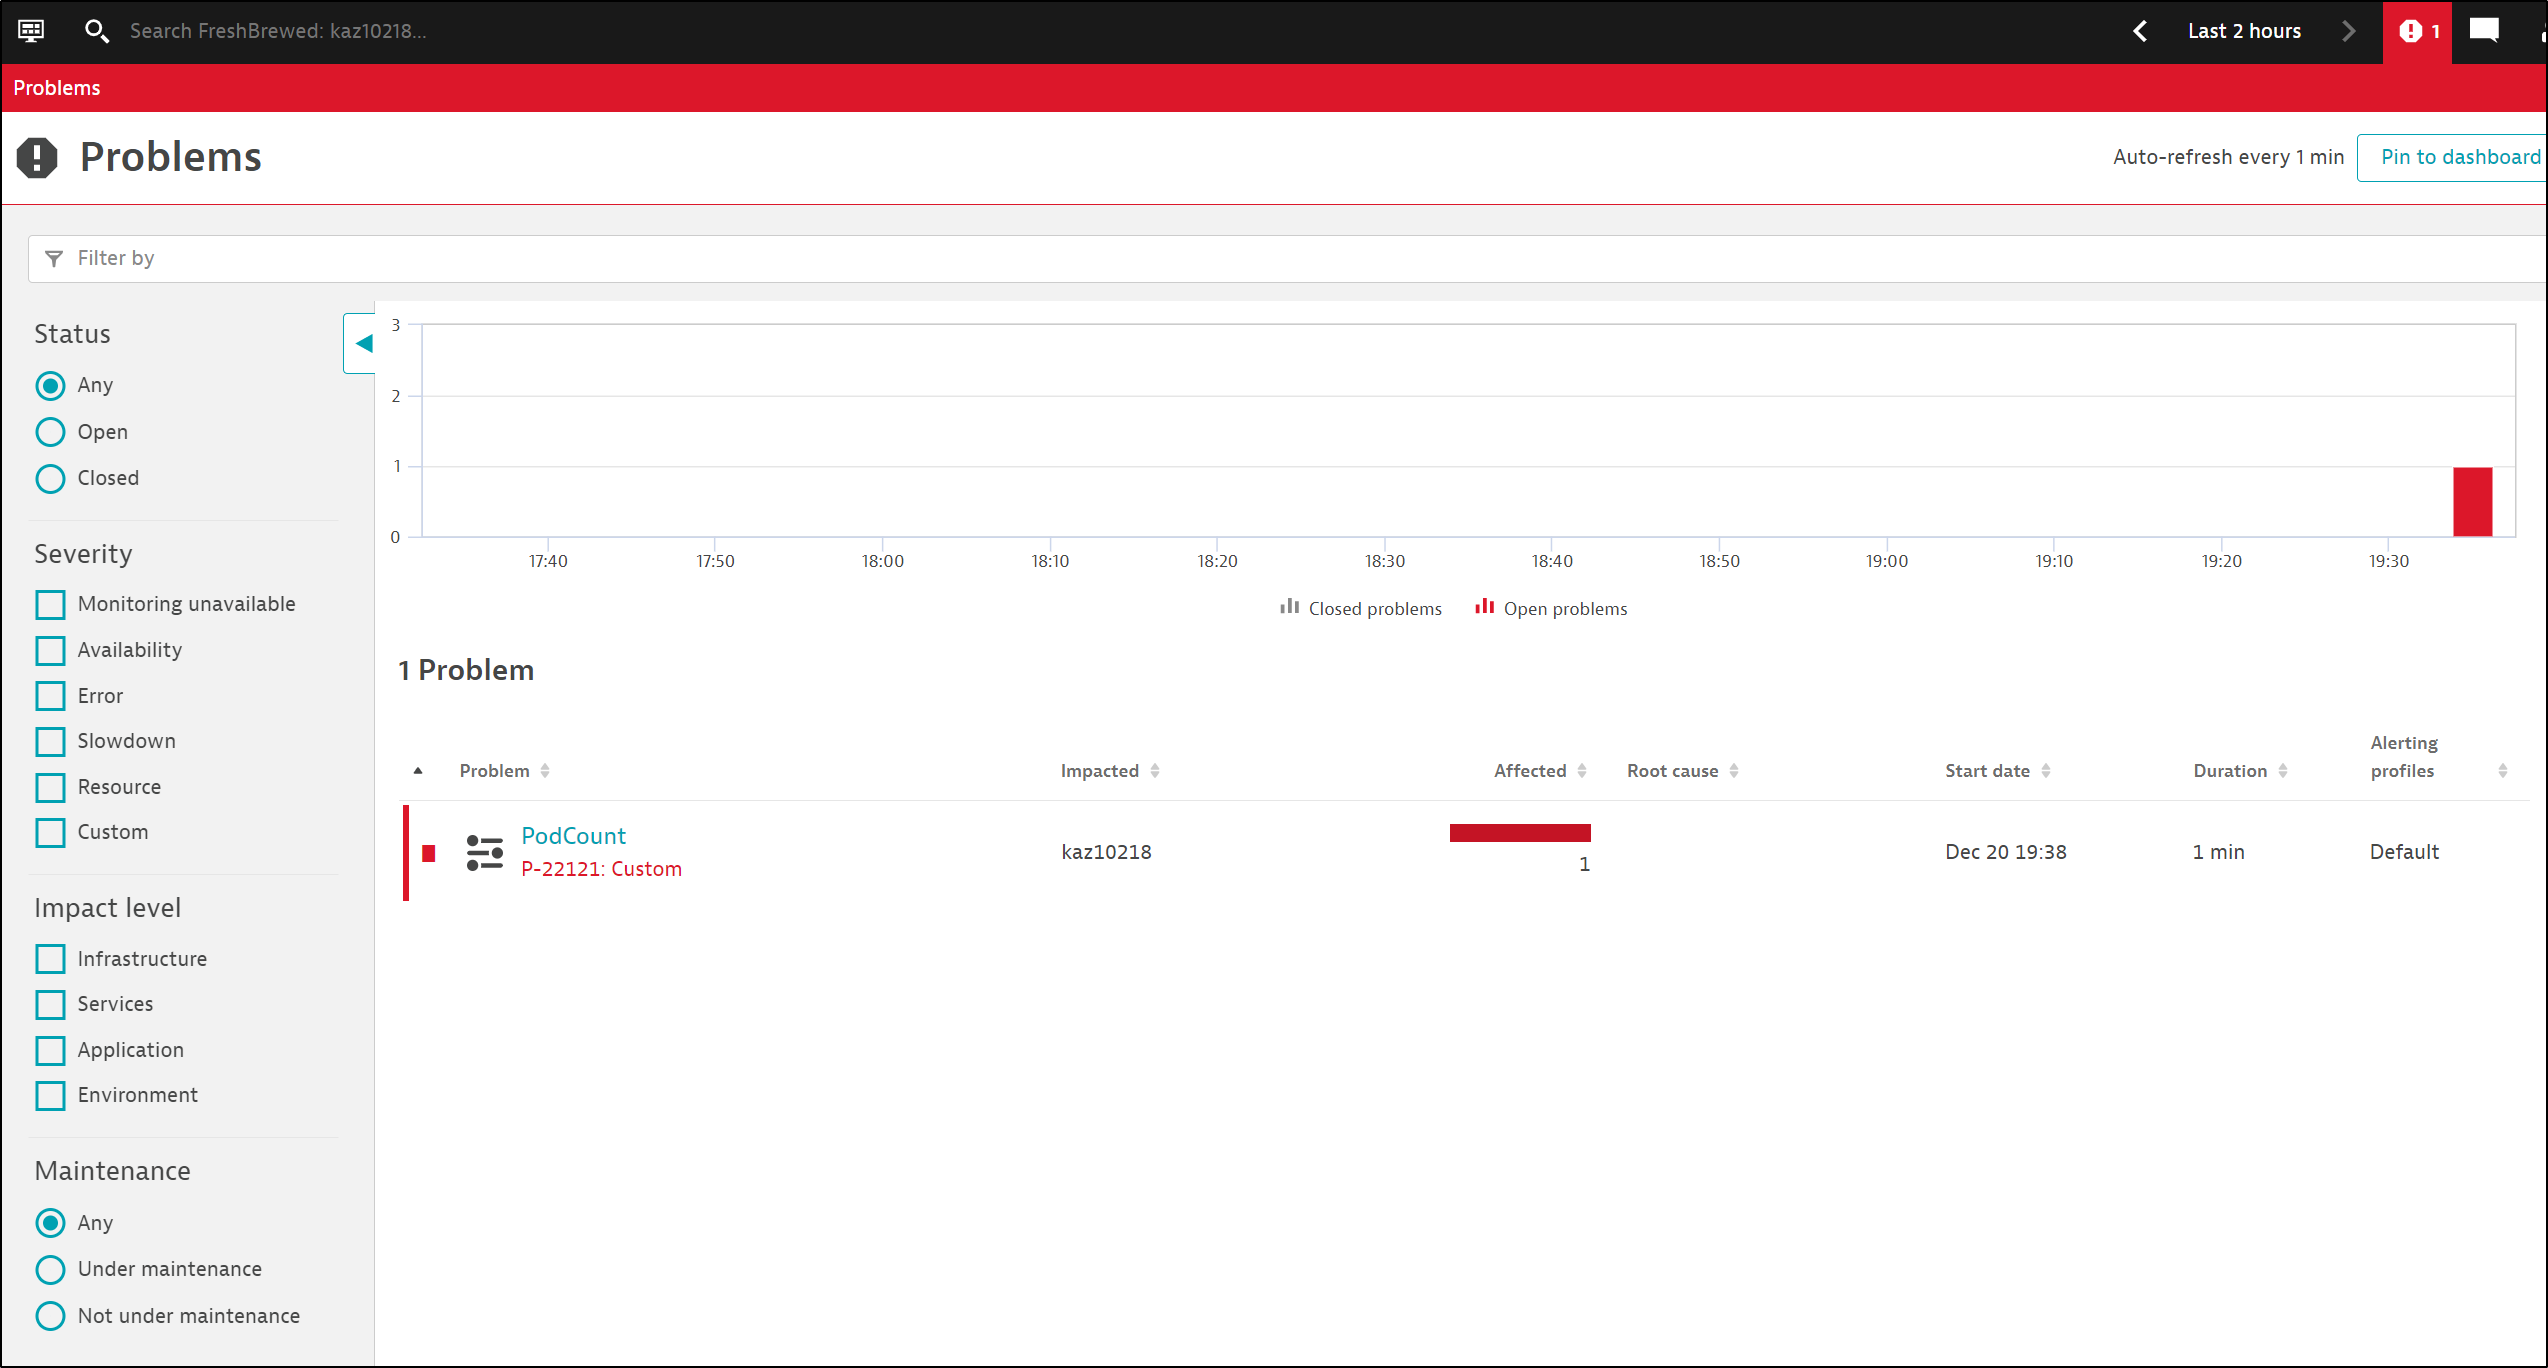
We can close a problem or make comments on it
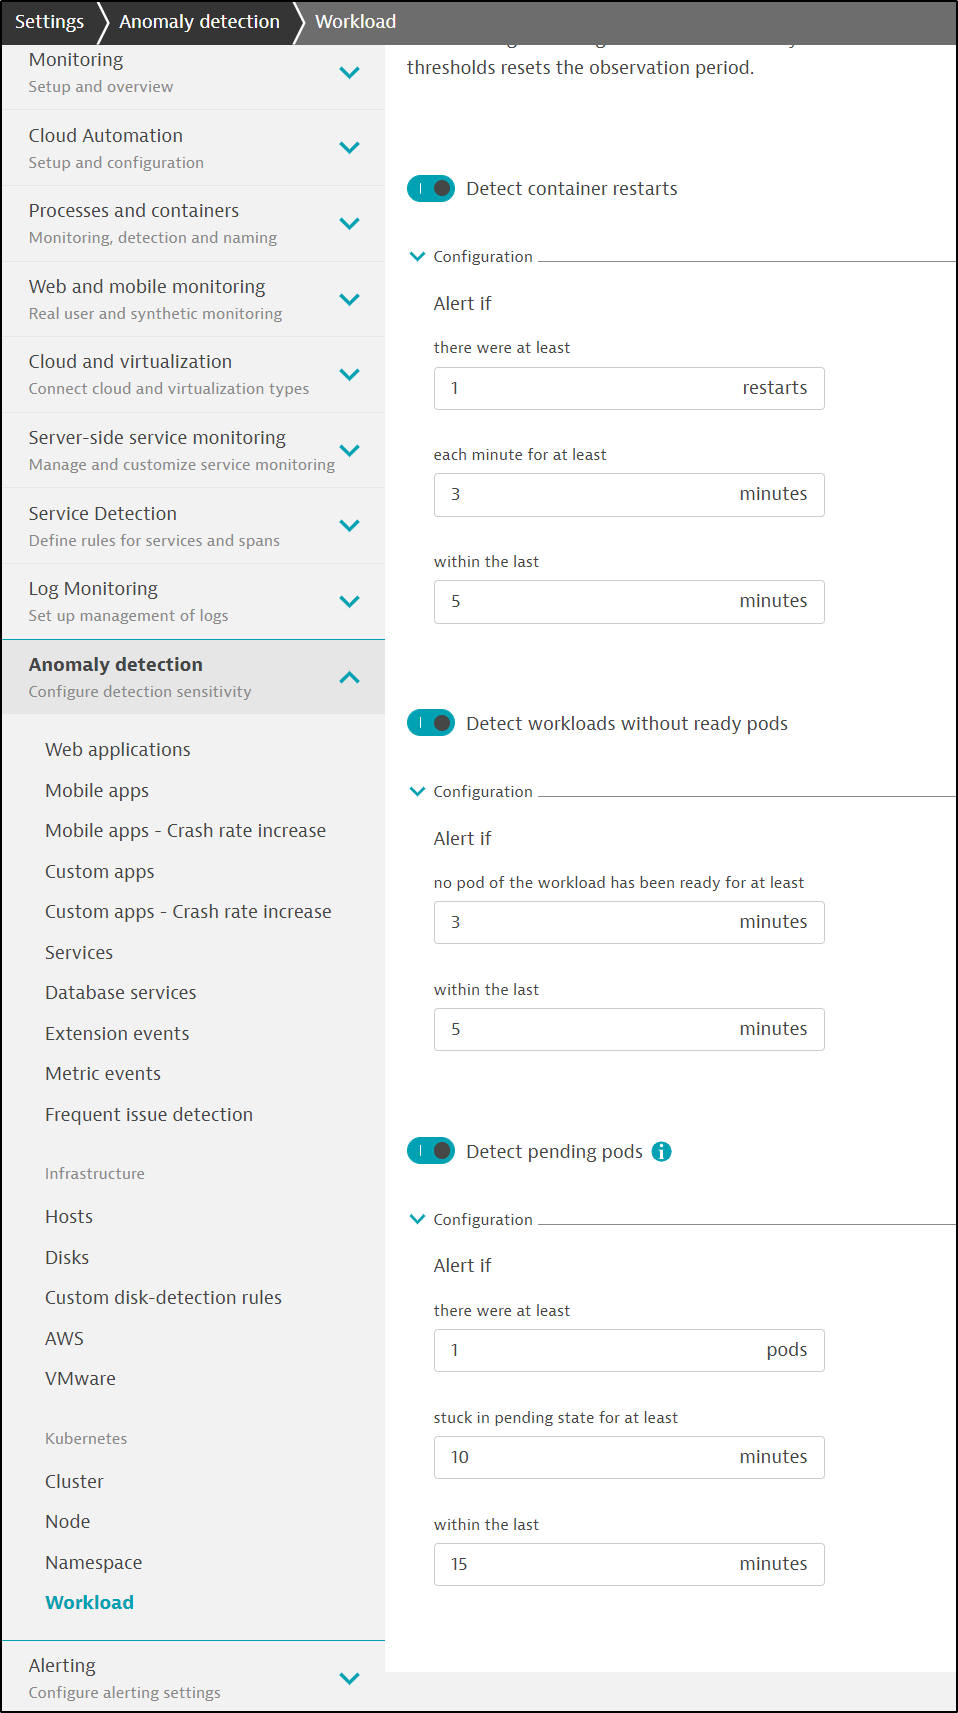
A lot of the various alerting is via predefined areas in Anomaly Detection.
For instance, instead of doing a Metric of containers in pending, one looks to Workloads in the Kubernetes section
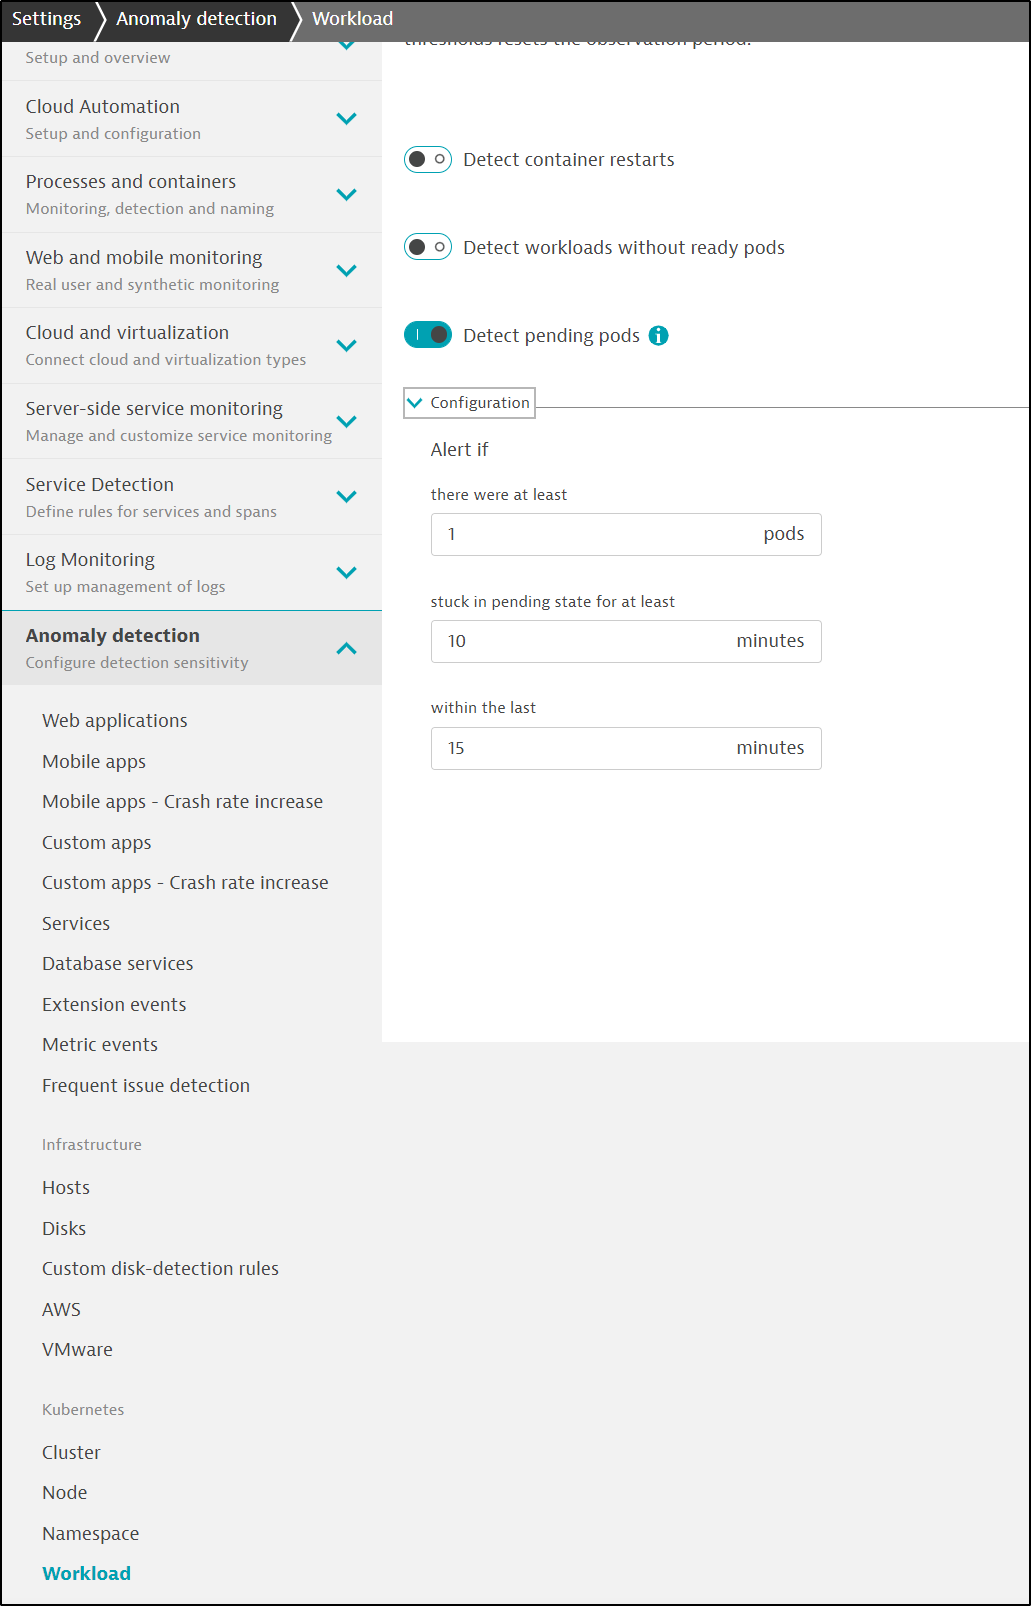
with some configurable settings
I still do not see why my Kubernetes alerts (Problems) do not trigger PagerDuty
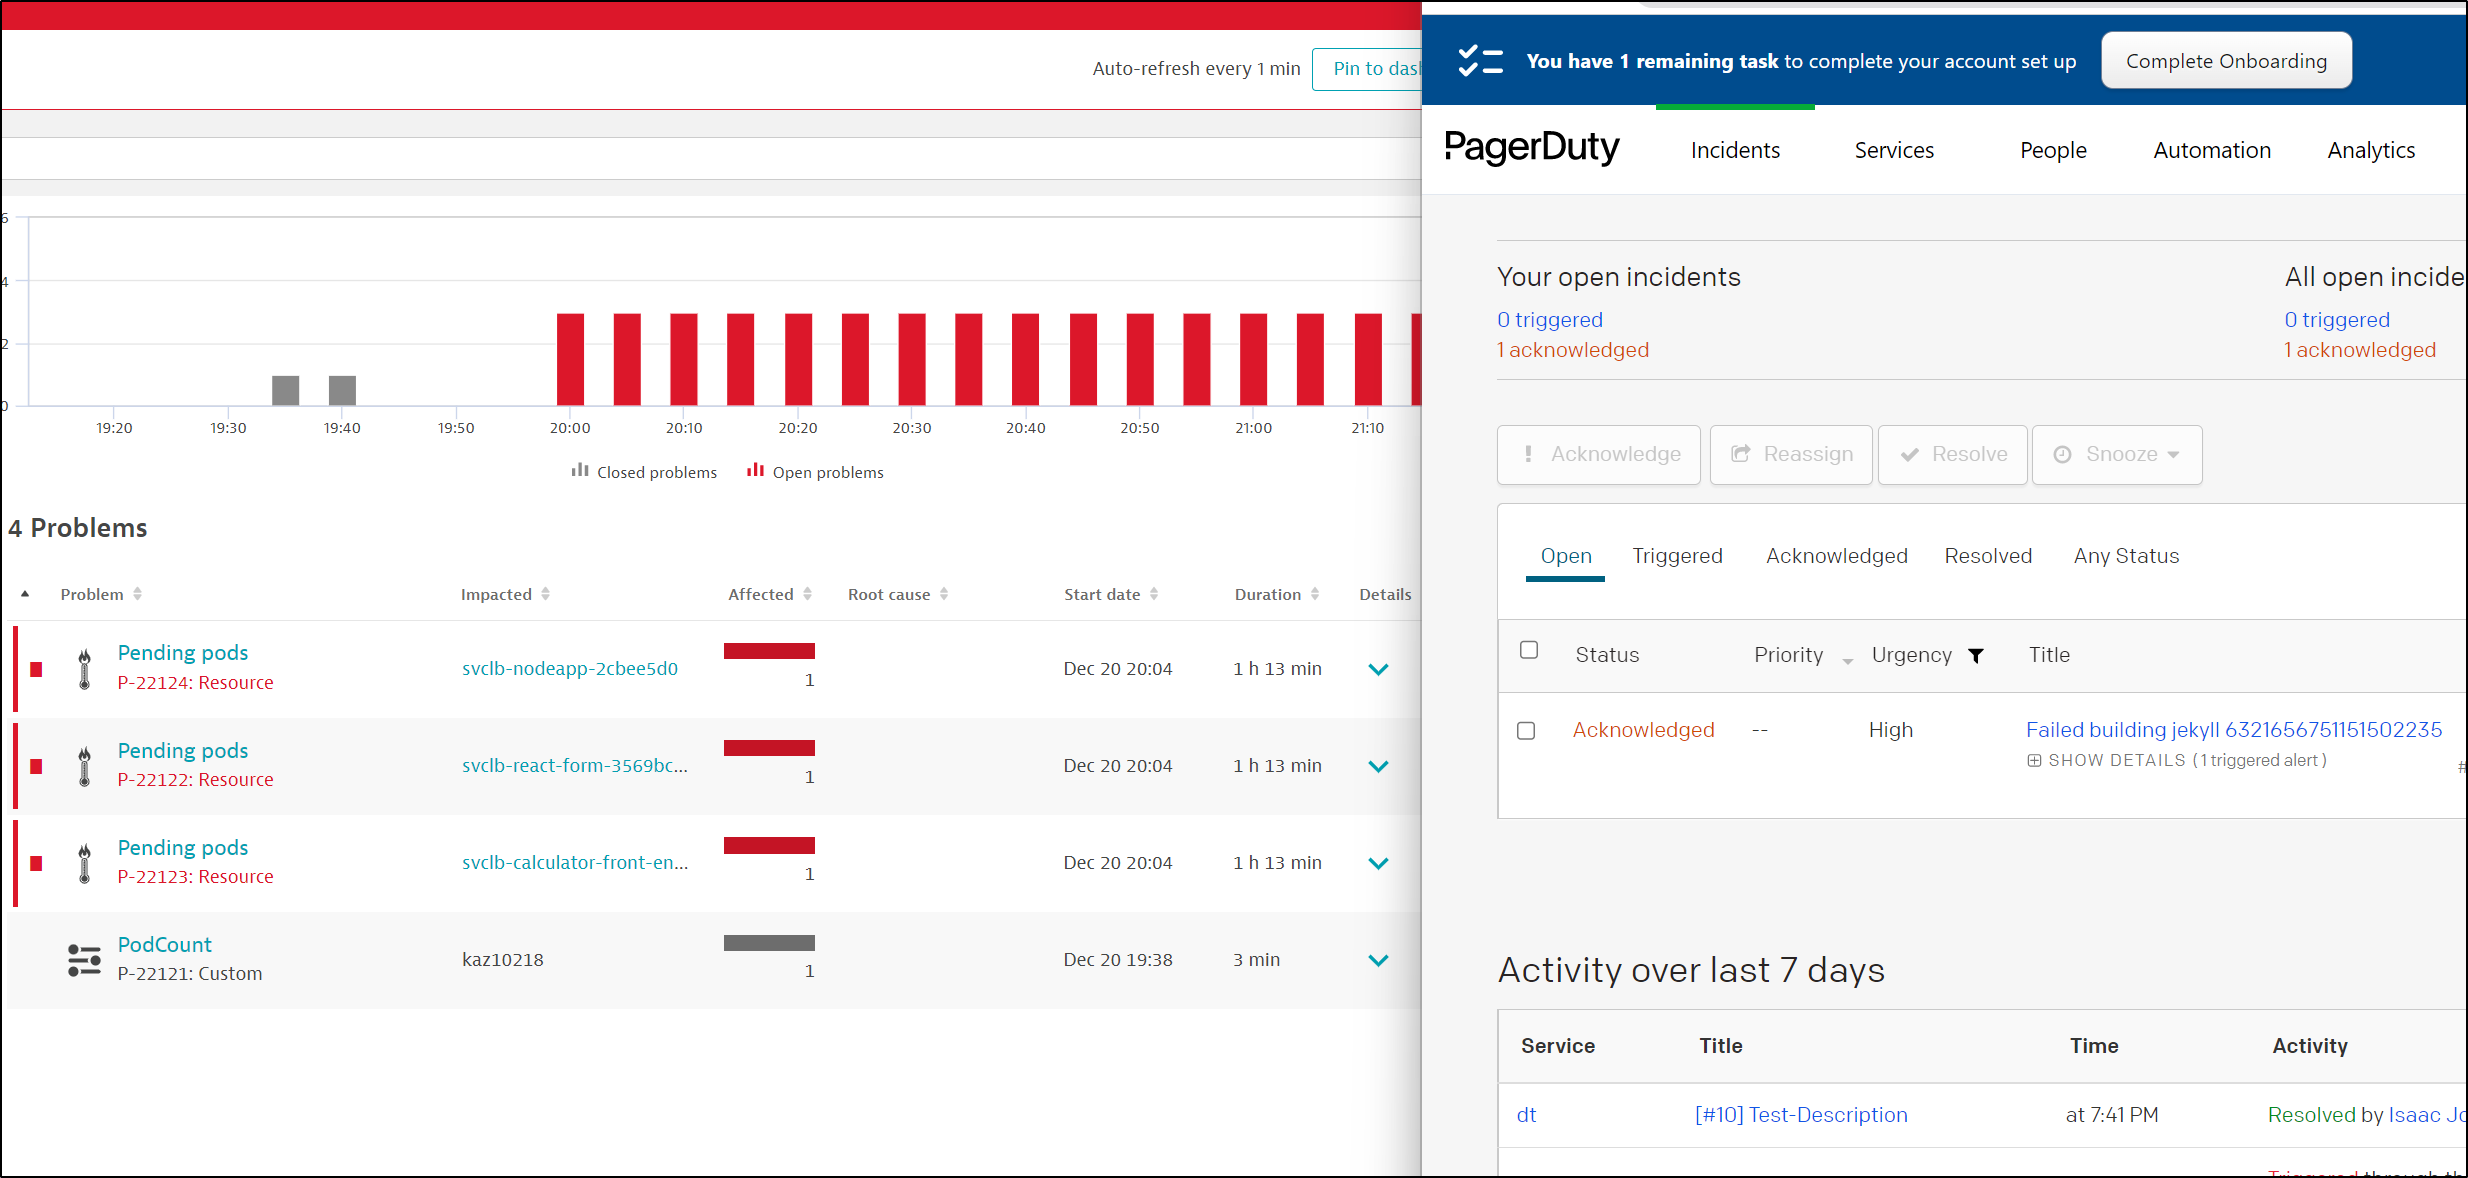
I created a new Metric alert and that too didn’t trigger anything
oddly, i tracked it down to my notification ?thing? was absent
Once recreated, a new metric alert triggered PagerDuty as I would expect
Then create one with a nice Dynatrace icon
Which will give me a URL like “https://princessking.webhook.office.com/webhookb2/asdfasdfasdfsadsadfsadfasdf@asdfasdfasdfasdfasdfasdf/IncomingWebhook/asdfasdfasdfasdfsadfasdasdfsa/asdfsadfsadfasdfasdfasdf”
I can then make a “Custom Integration” in “Settings/Integration/Problem Notifications”.
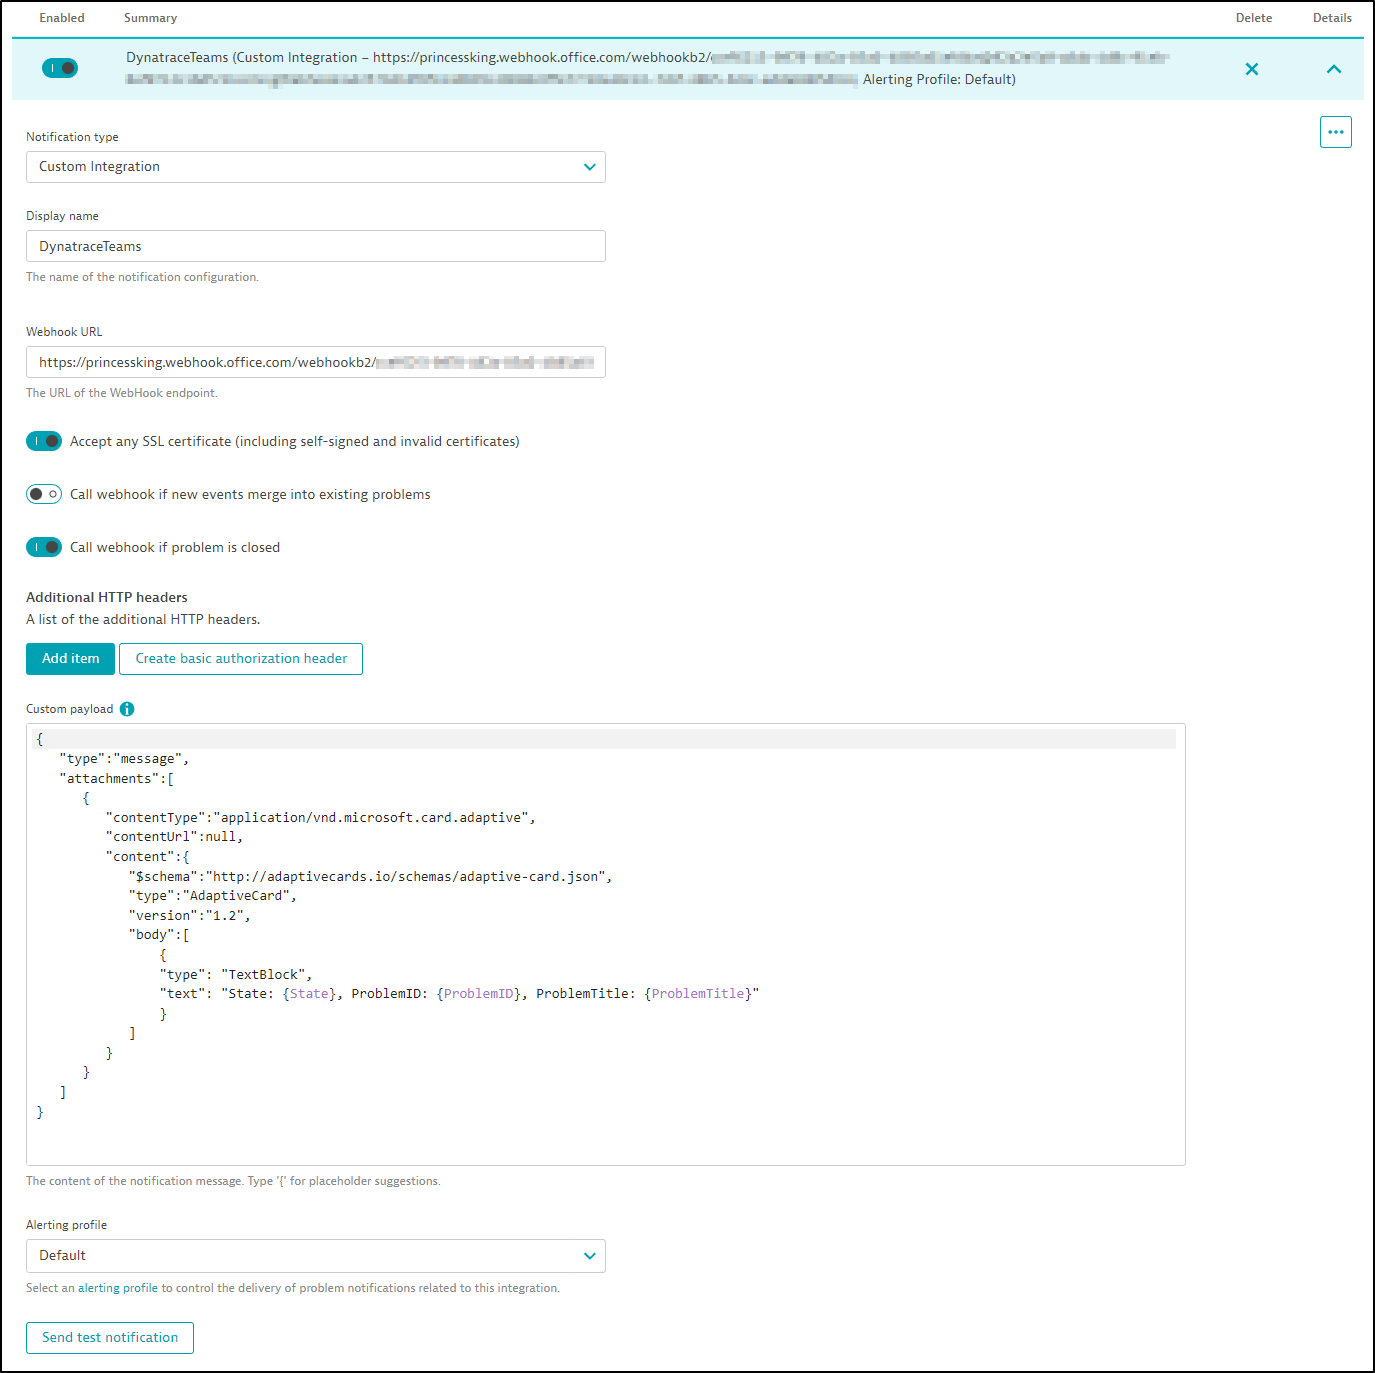
A simple payload:
{
   "type":"message",
   "attachments":[
      {
         "contentType":"application/vnd.microsoft.card.adaptive",
         "contentUrl":null,
         "content":{
            "$schema":"http://adaptivecards.io/schemas/adaptive-card.json",
            "type":"AdaptiveCard",
            "version":"1.2",
            "body":[
                {
                "type": "TextBlock",
                "text": "State: {State}, ProblemID: {ProblemID}, ProblemTitle: {ProblemTitle}"
                }
            ]
         }
      }
   ]
}
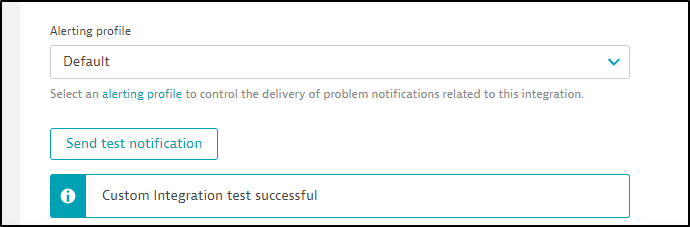
I can send a test notification
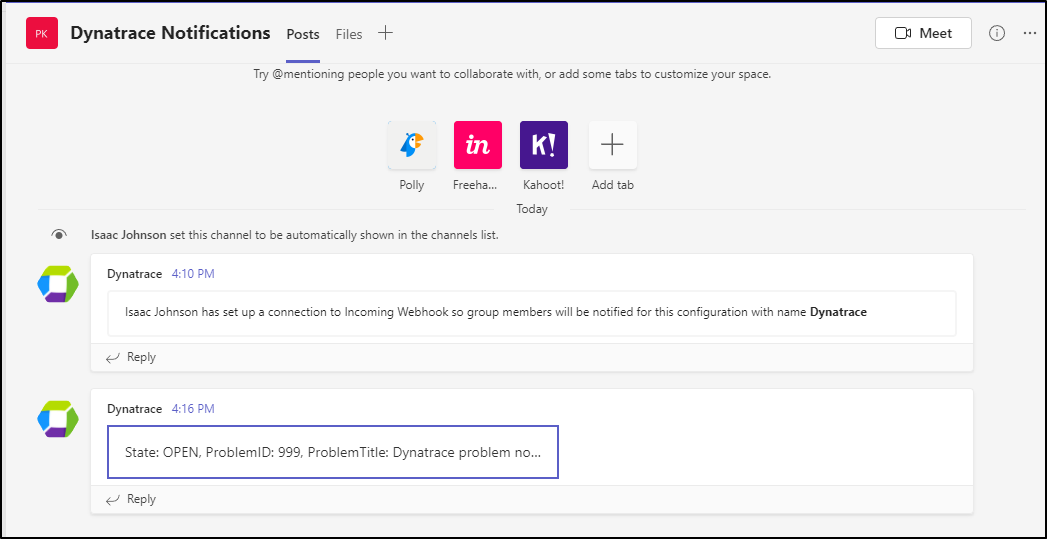
and we can see it in Teams
Or a slightly more complicated version
{
    "type": "message",
    "attachments": [
        {
        "contentType": "application/vnd.microsoft.card.adaptive",
        "content": {
            "type": "AdaptiveCard",
            "body": [
                {
                    "type": "TextBlock",
                    "size": "Medium",
                    "weight": "Bolder",
                    "text": "State: {State} :: ProblemID: {ProblemID}"
                },
                {
                    "type": "TextBlock",
                    "text": "{ProblemTitle}"
                }
            ],
            "$schema": "http://adaptivecards.io/schemas/adaptive-card.json",
            "version": "1.0"
        }
    }]
}
which renders
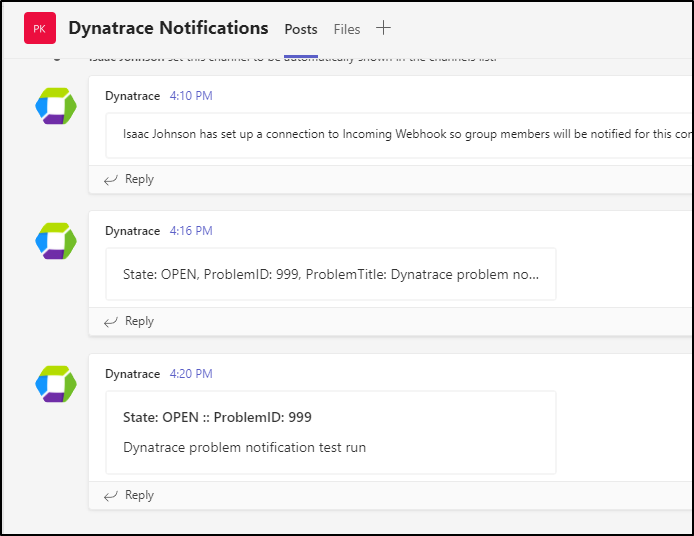
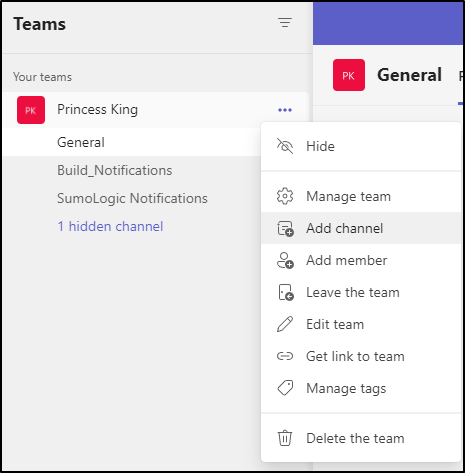
MS Teams
Let’s create a channel for Dynatrace. Choose Add Channel
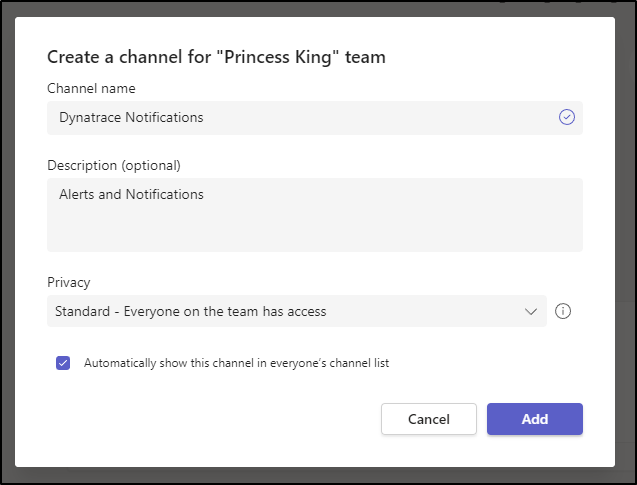
Then create one for Dynatrace
And then create a Connector
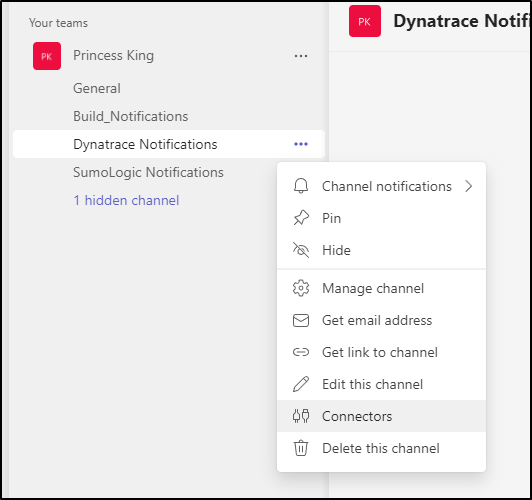
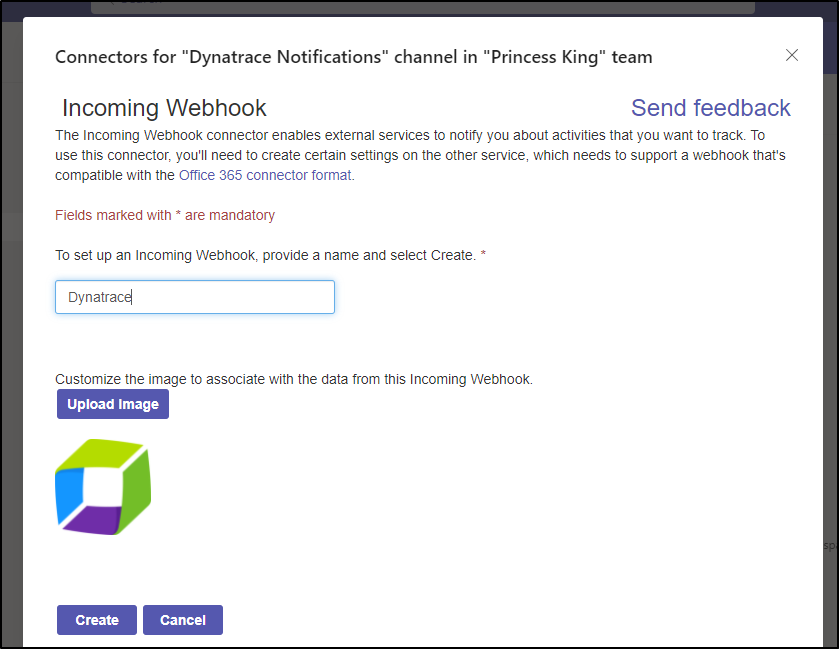
Then configure an “Incoming Webhook”
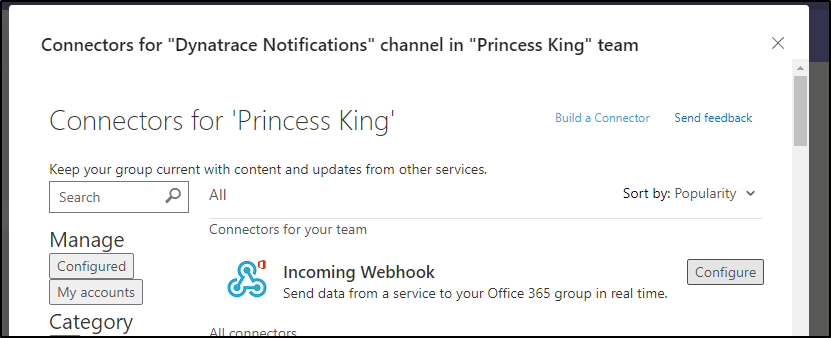
MS Teams
Let’s create a channel for Dynatrace. Choose Add Channel
Give it a name, like “Dynatrace Notifications”
Then create a Connector
Configure an “Incoming Webhook”
I like to create one with a nice Dynatrace icon
Which will give me a URL like “https://princessking.webhook.office.com/webhookb2/adsf@asdf/IncomingWebhook/asdf/asdf”
I can then make a “Custom Integration” in “Settings/Integration/Problem Notifications”.
A simple payload:
{
   "type":"message",
   "attachments":[
      {
         "contentType":"application/vnd.microsoft.card.adaptive",
         "contentUrl":null,
         "content":{
            "$schema":"http://adaptivecards.io/schemas/adaptive-card.json",
            "type":"AdaptiveCard",
            "version":"1.2",
            "body":[
                {
                "type": "TextBlock",
                "text": "State: {State}, ProblemID: {ProblemID}, ProblemTitle: {ProblemTitle}"
                }
            ]
         }
      }
   ]
}
I can send a test notification
and we can see it in Teams
Or a slightly more complicated version
{
    "type": "message",
    "attachments": [
        {
        "contentType": "application/vnd.microsoft.card.adaptive",
        "content": {
            "type": "AdaptiveCard",
            "body": [
                {
                    "type": "TextBlock",
                    "size": "Medium",
                    "weight": "Bolder",
                    "text": "State: {State} :: ProblemID: {ProblemID}"
                },
                {
                    "type": "TextBlock",
                    "text": "{ProblemTitle}"
                }
            ],
            "$schema": "http://adaptivecards.io/schemas/adaptive-card.json",
            "version": "1.0"
        }
    }]
}
which renders
Mobile App
There is a mobile app one can use to monitor problems.
Once you sign in, you can view the Problems for your Account
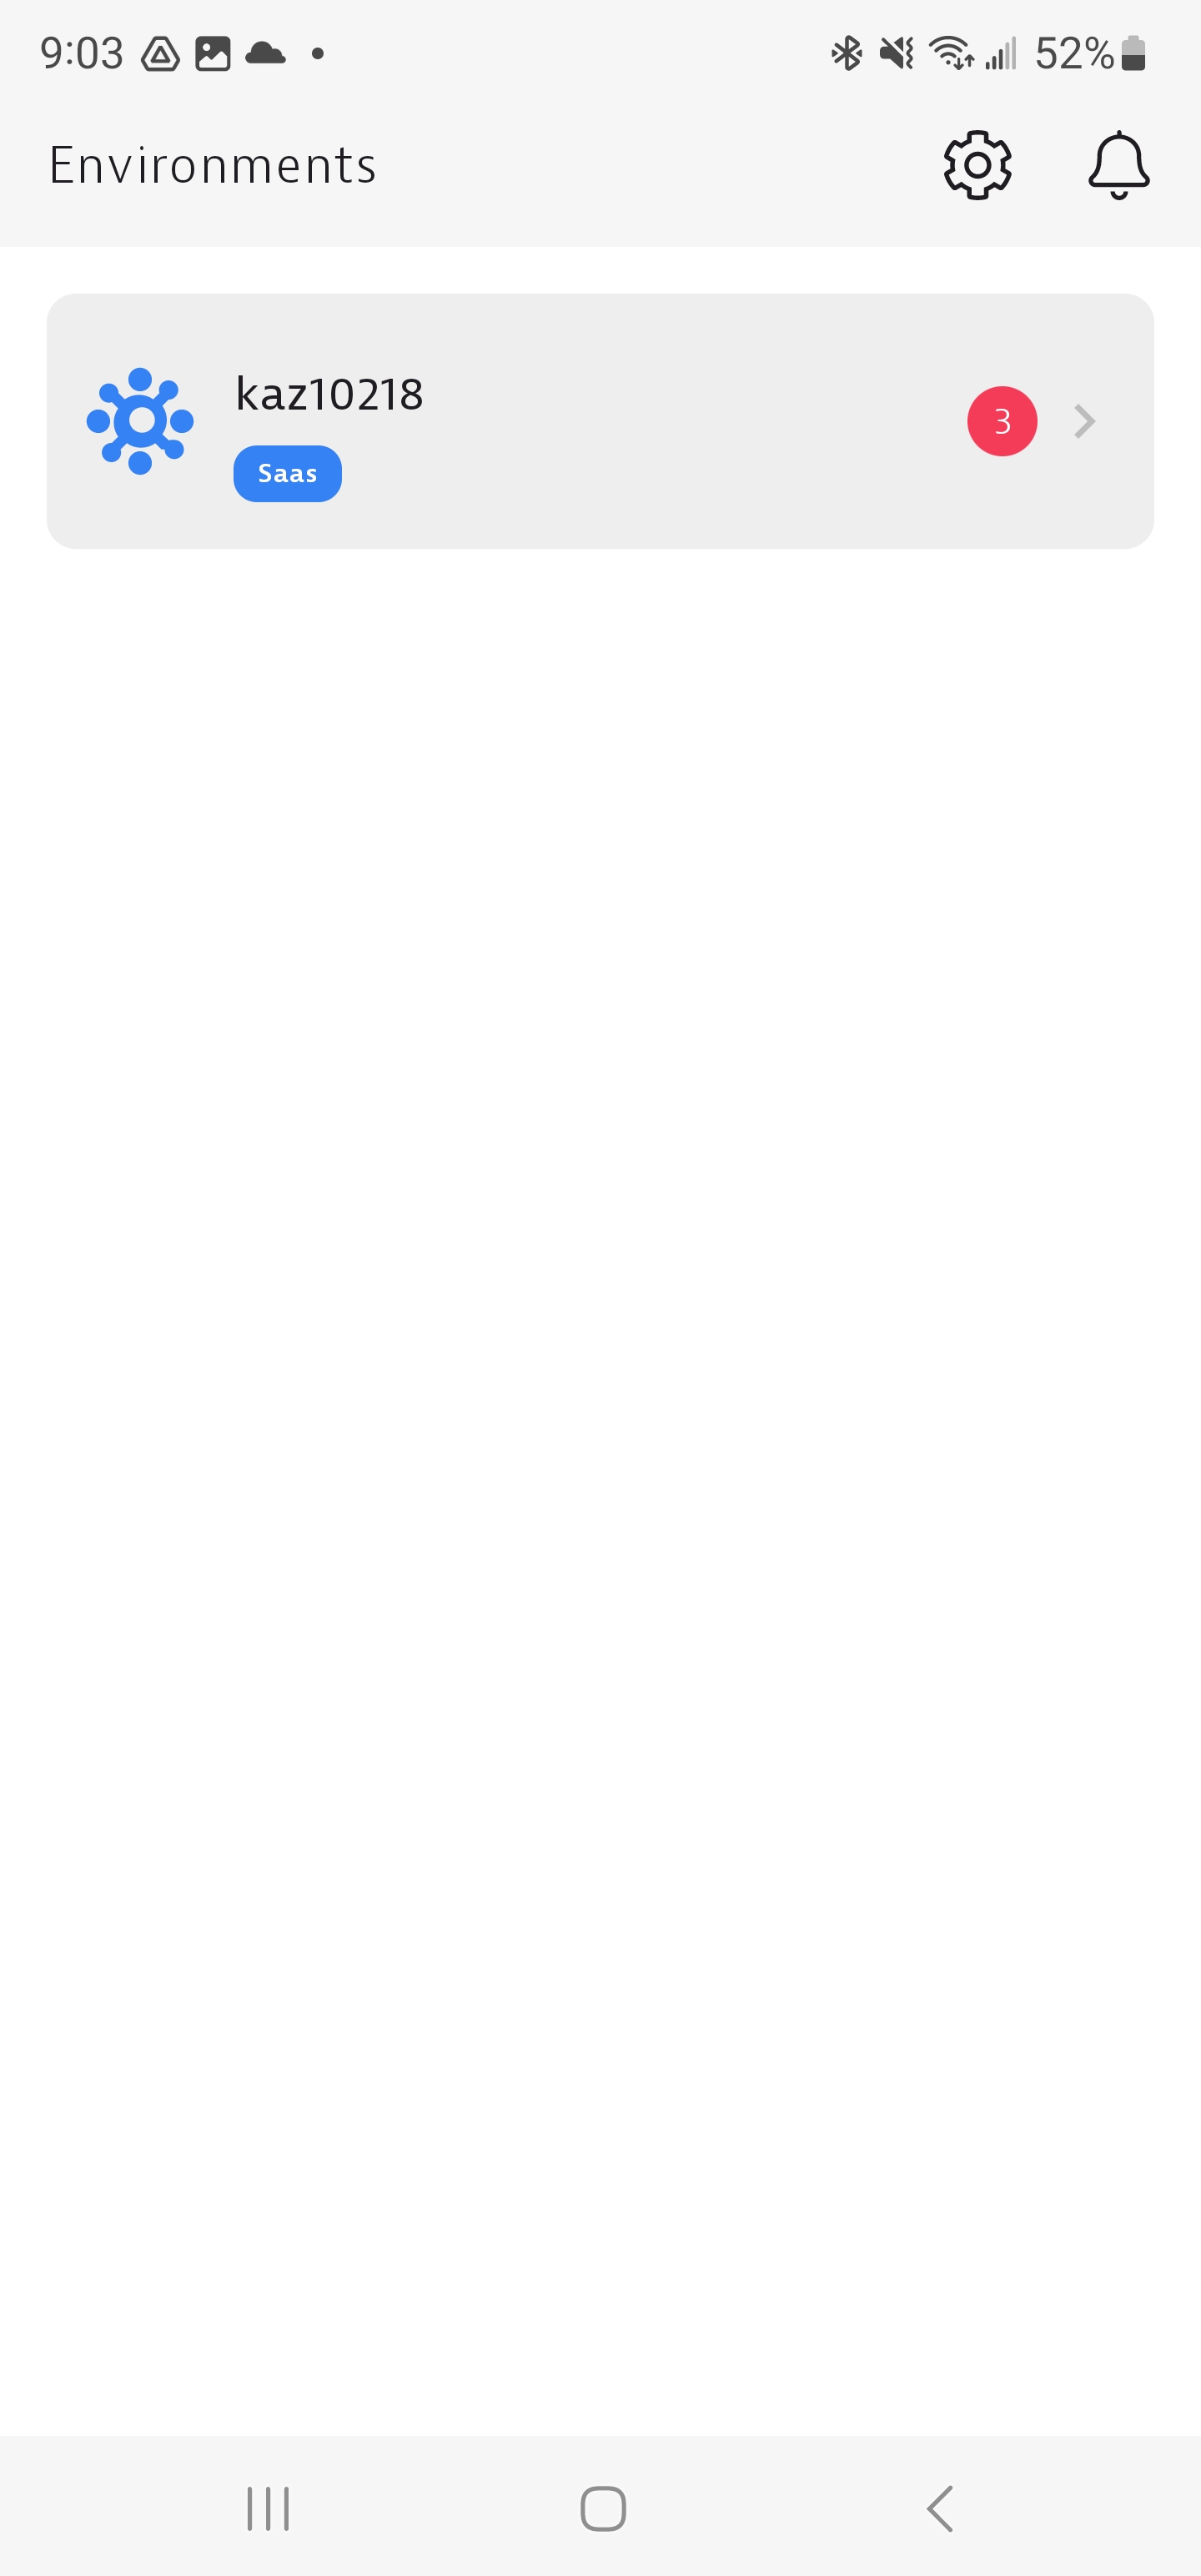
Clicking into the Environment, shows our issues
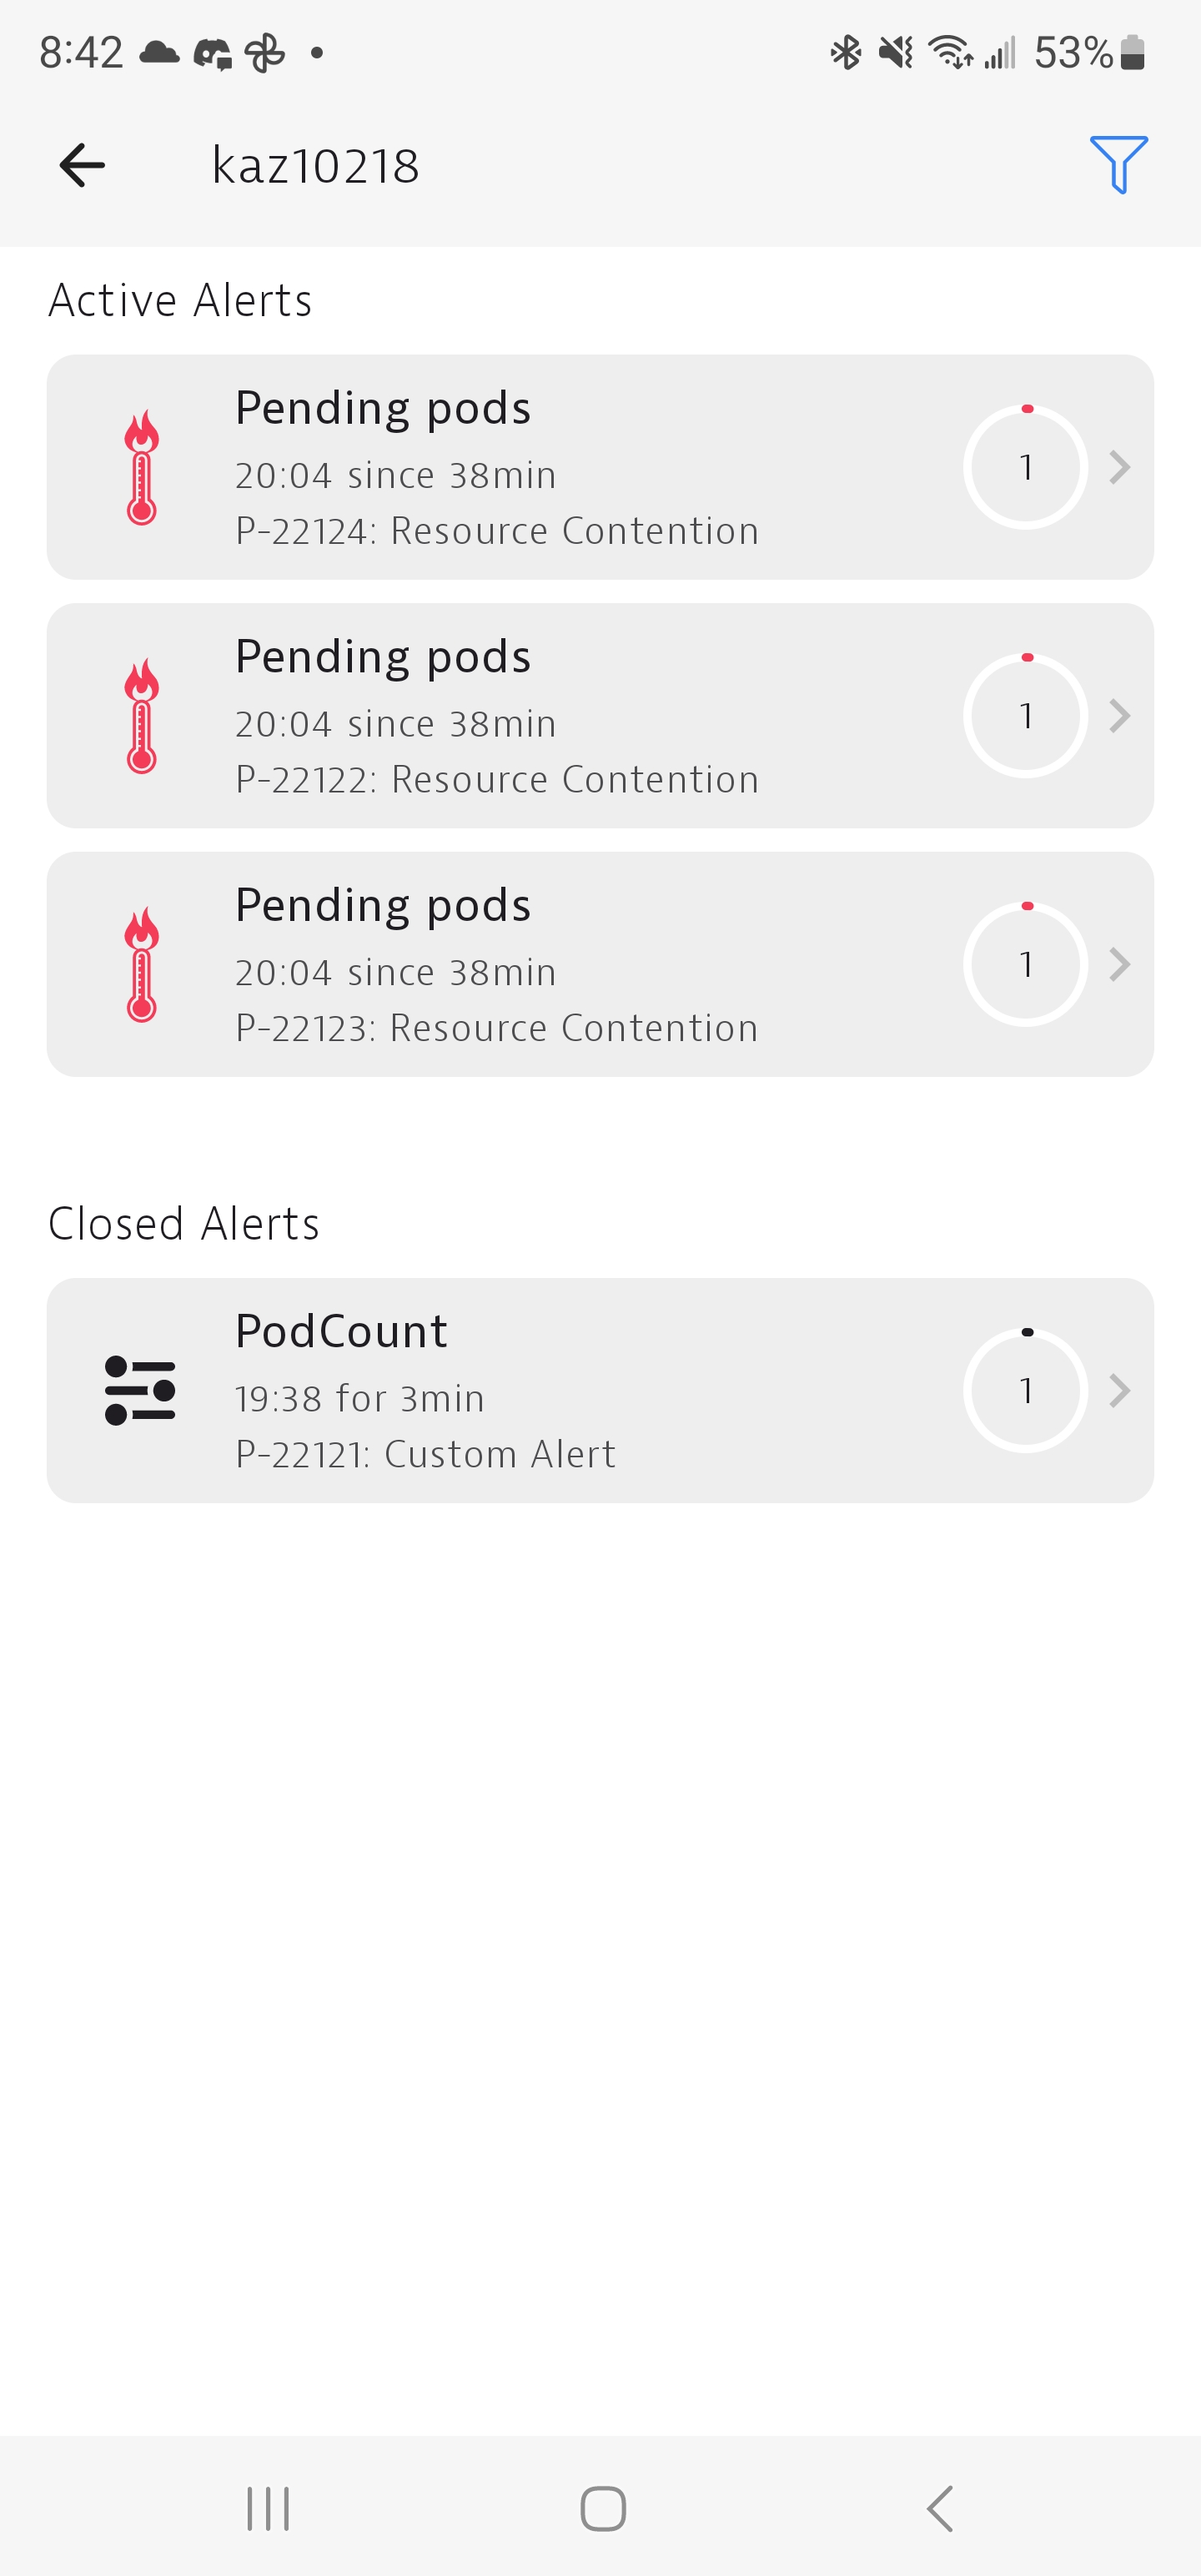
I can look at the details of an active or closed problem
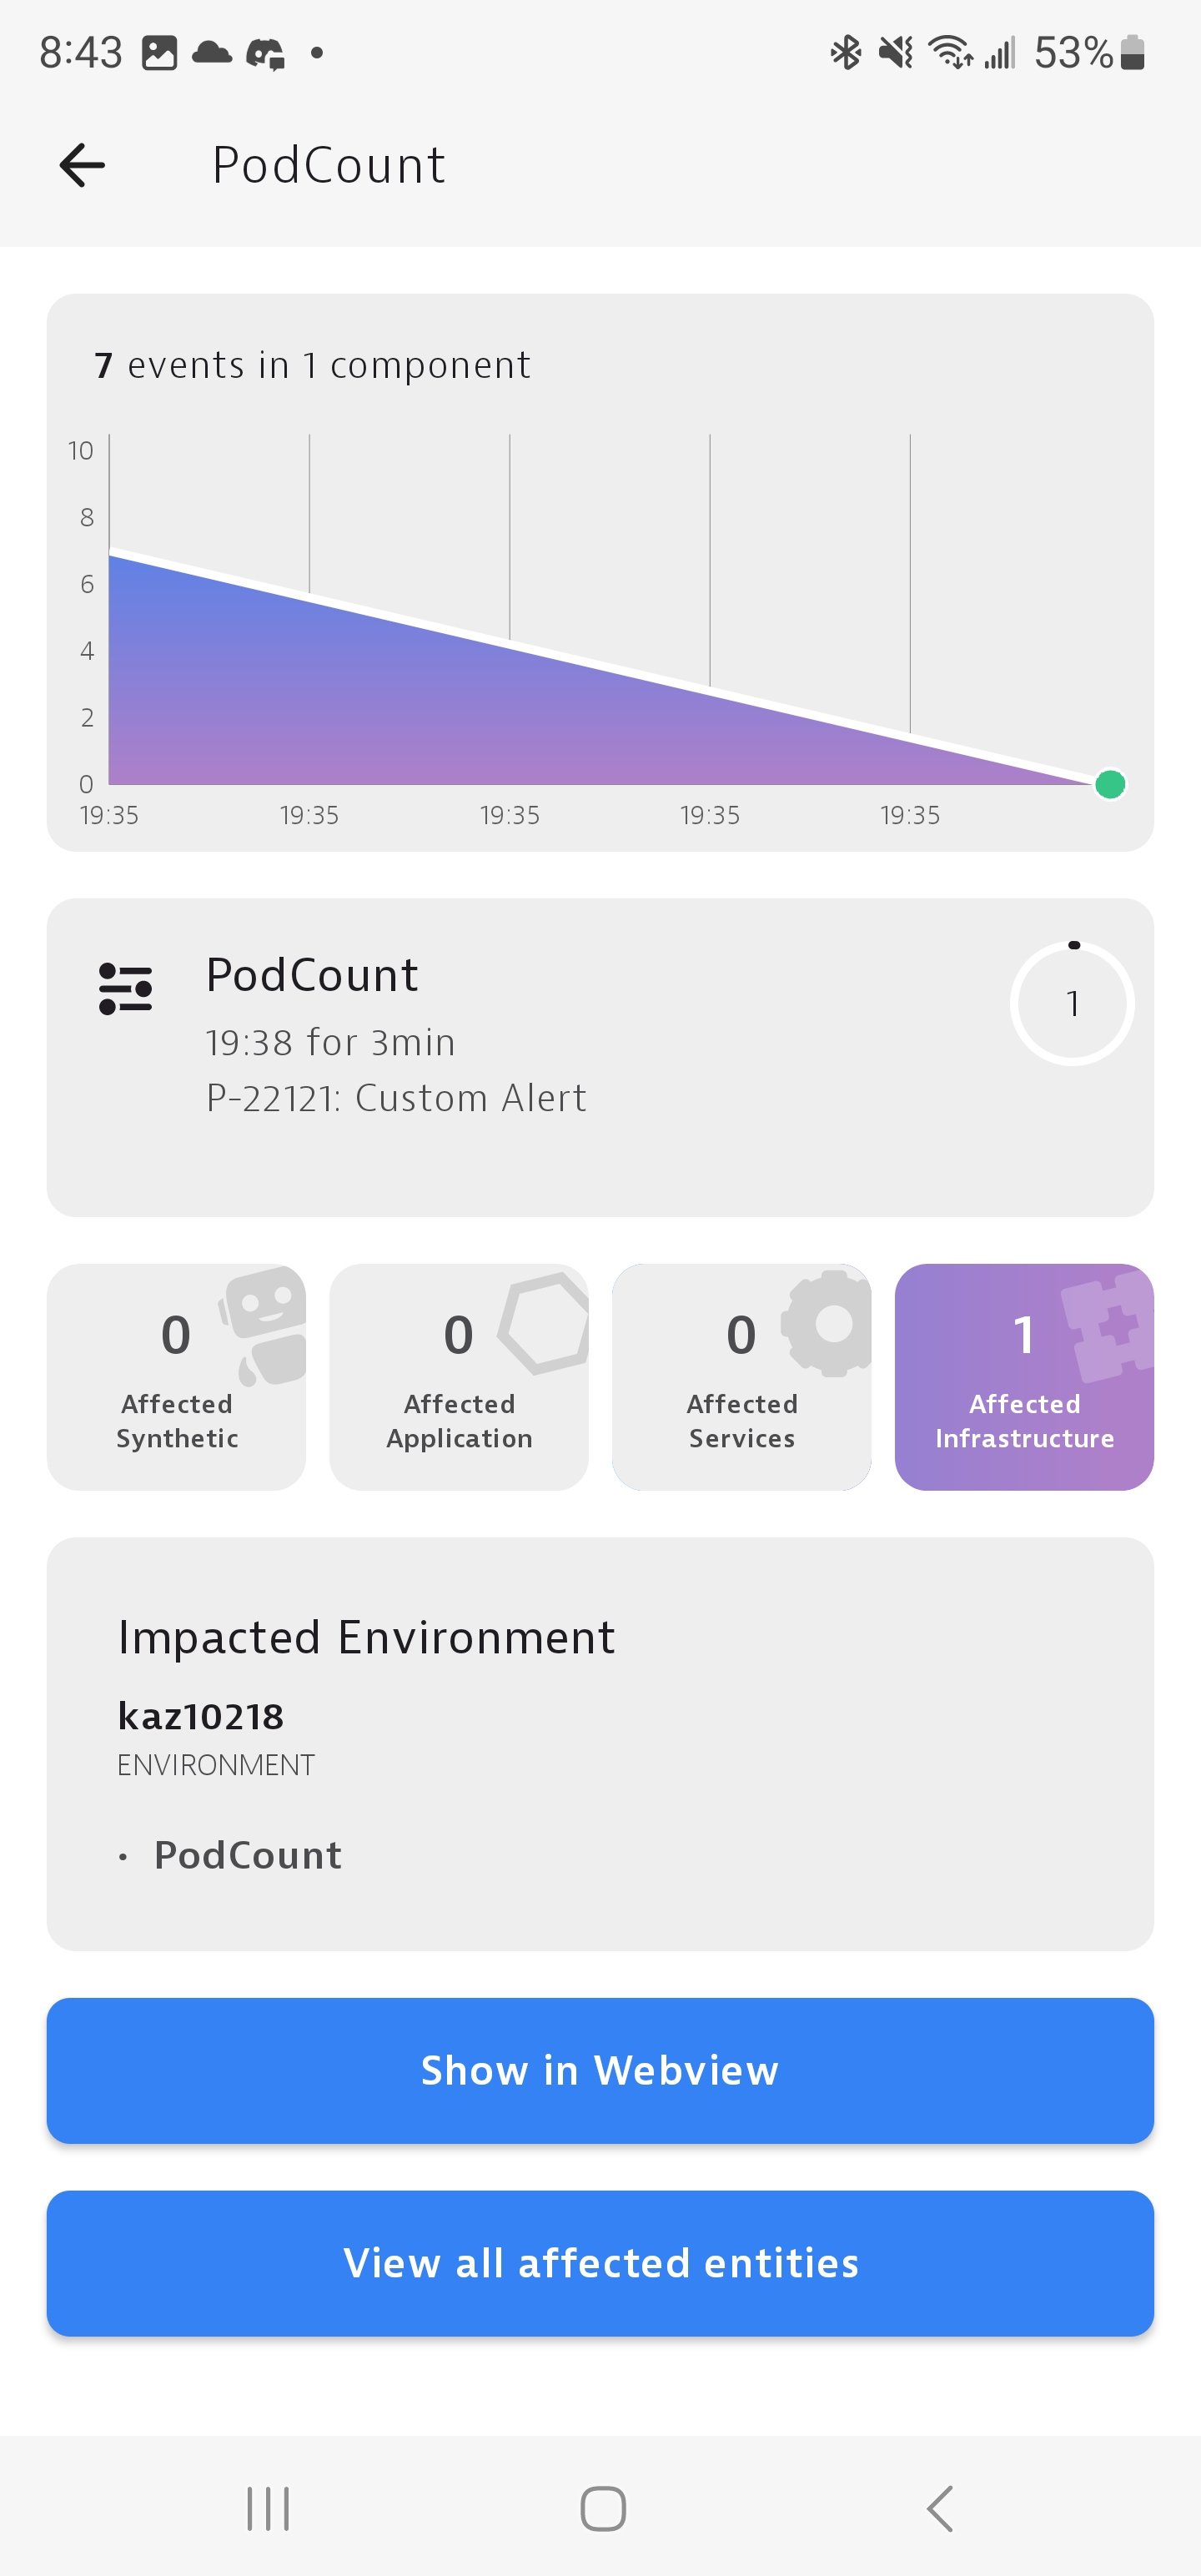
Such as Pending Pods
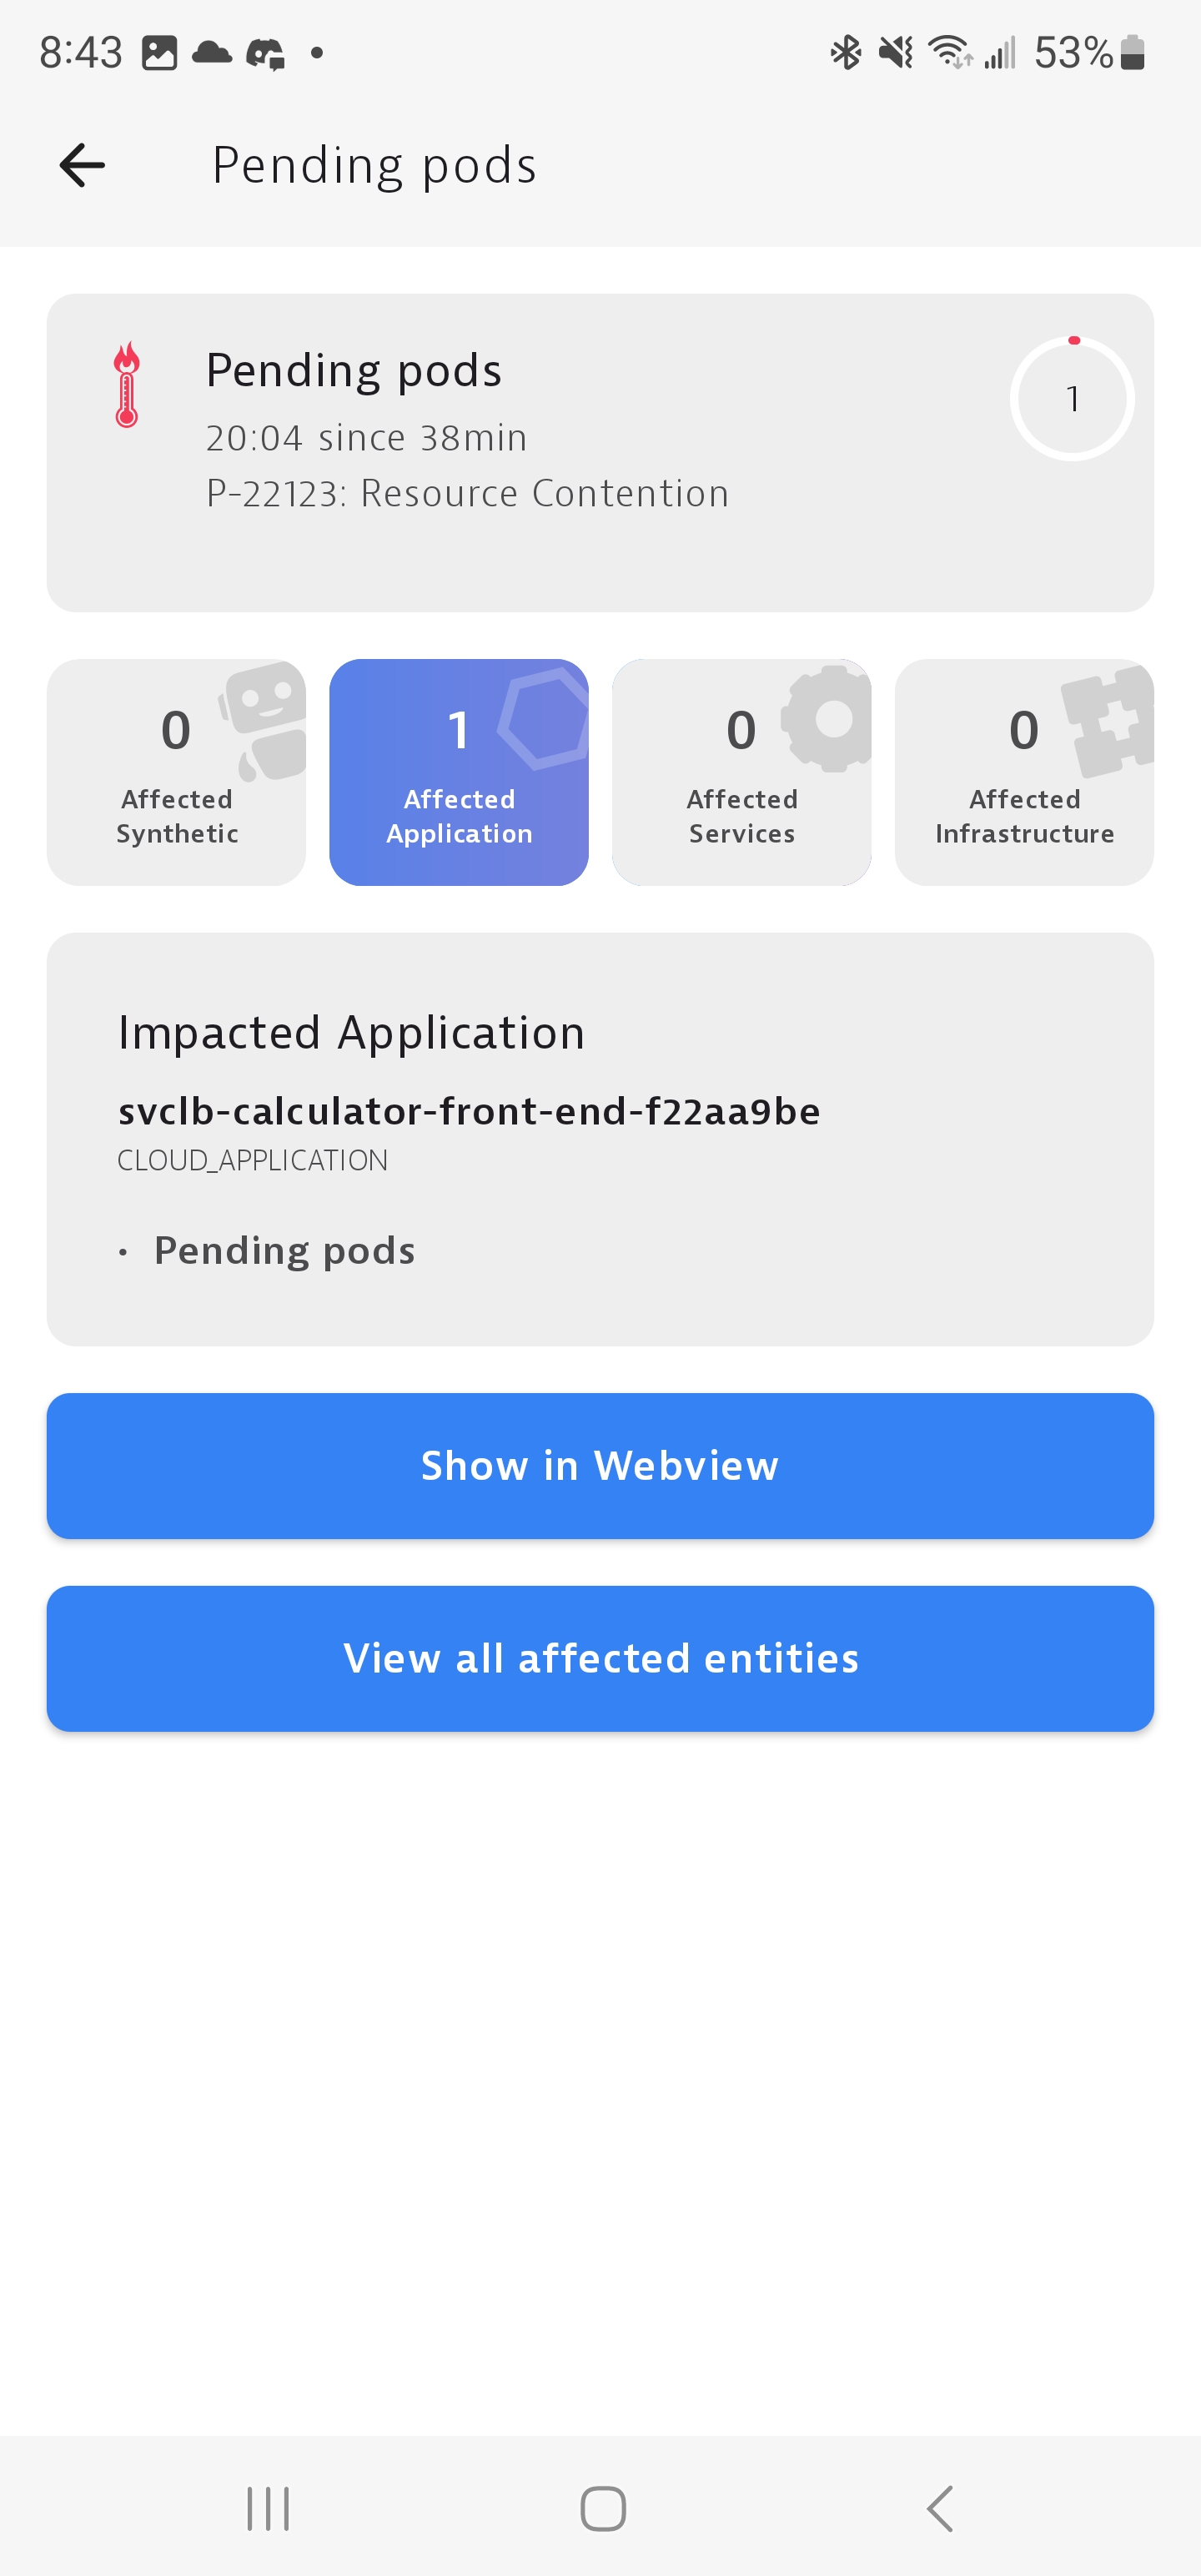
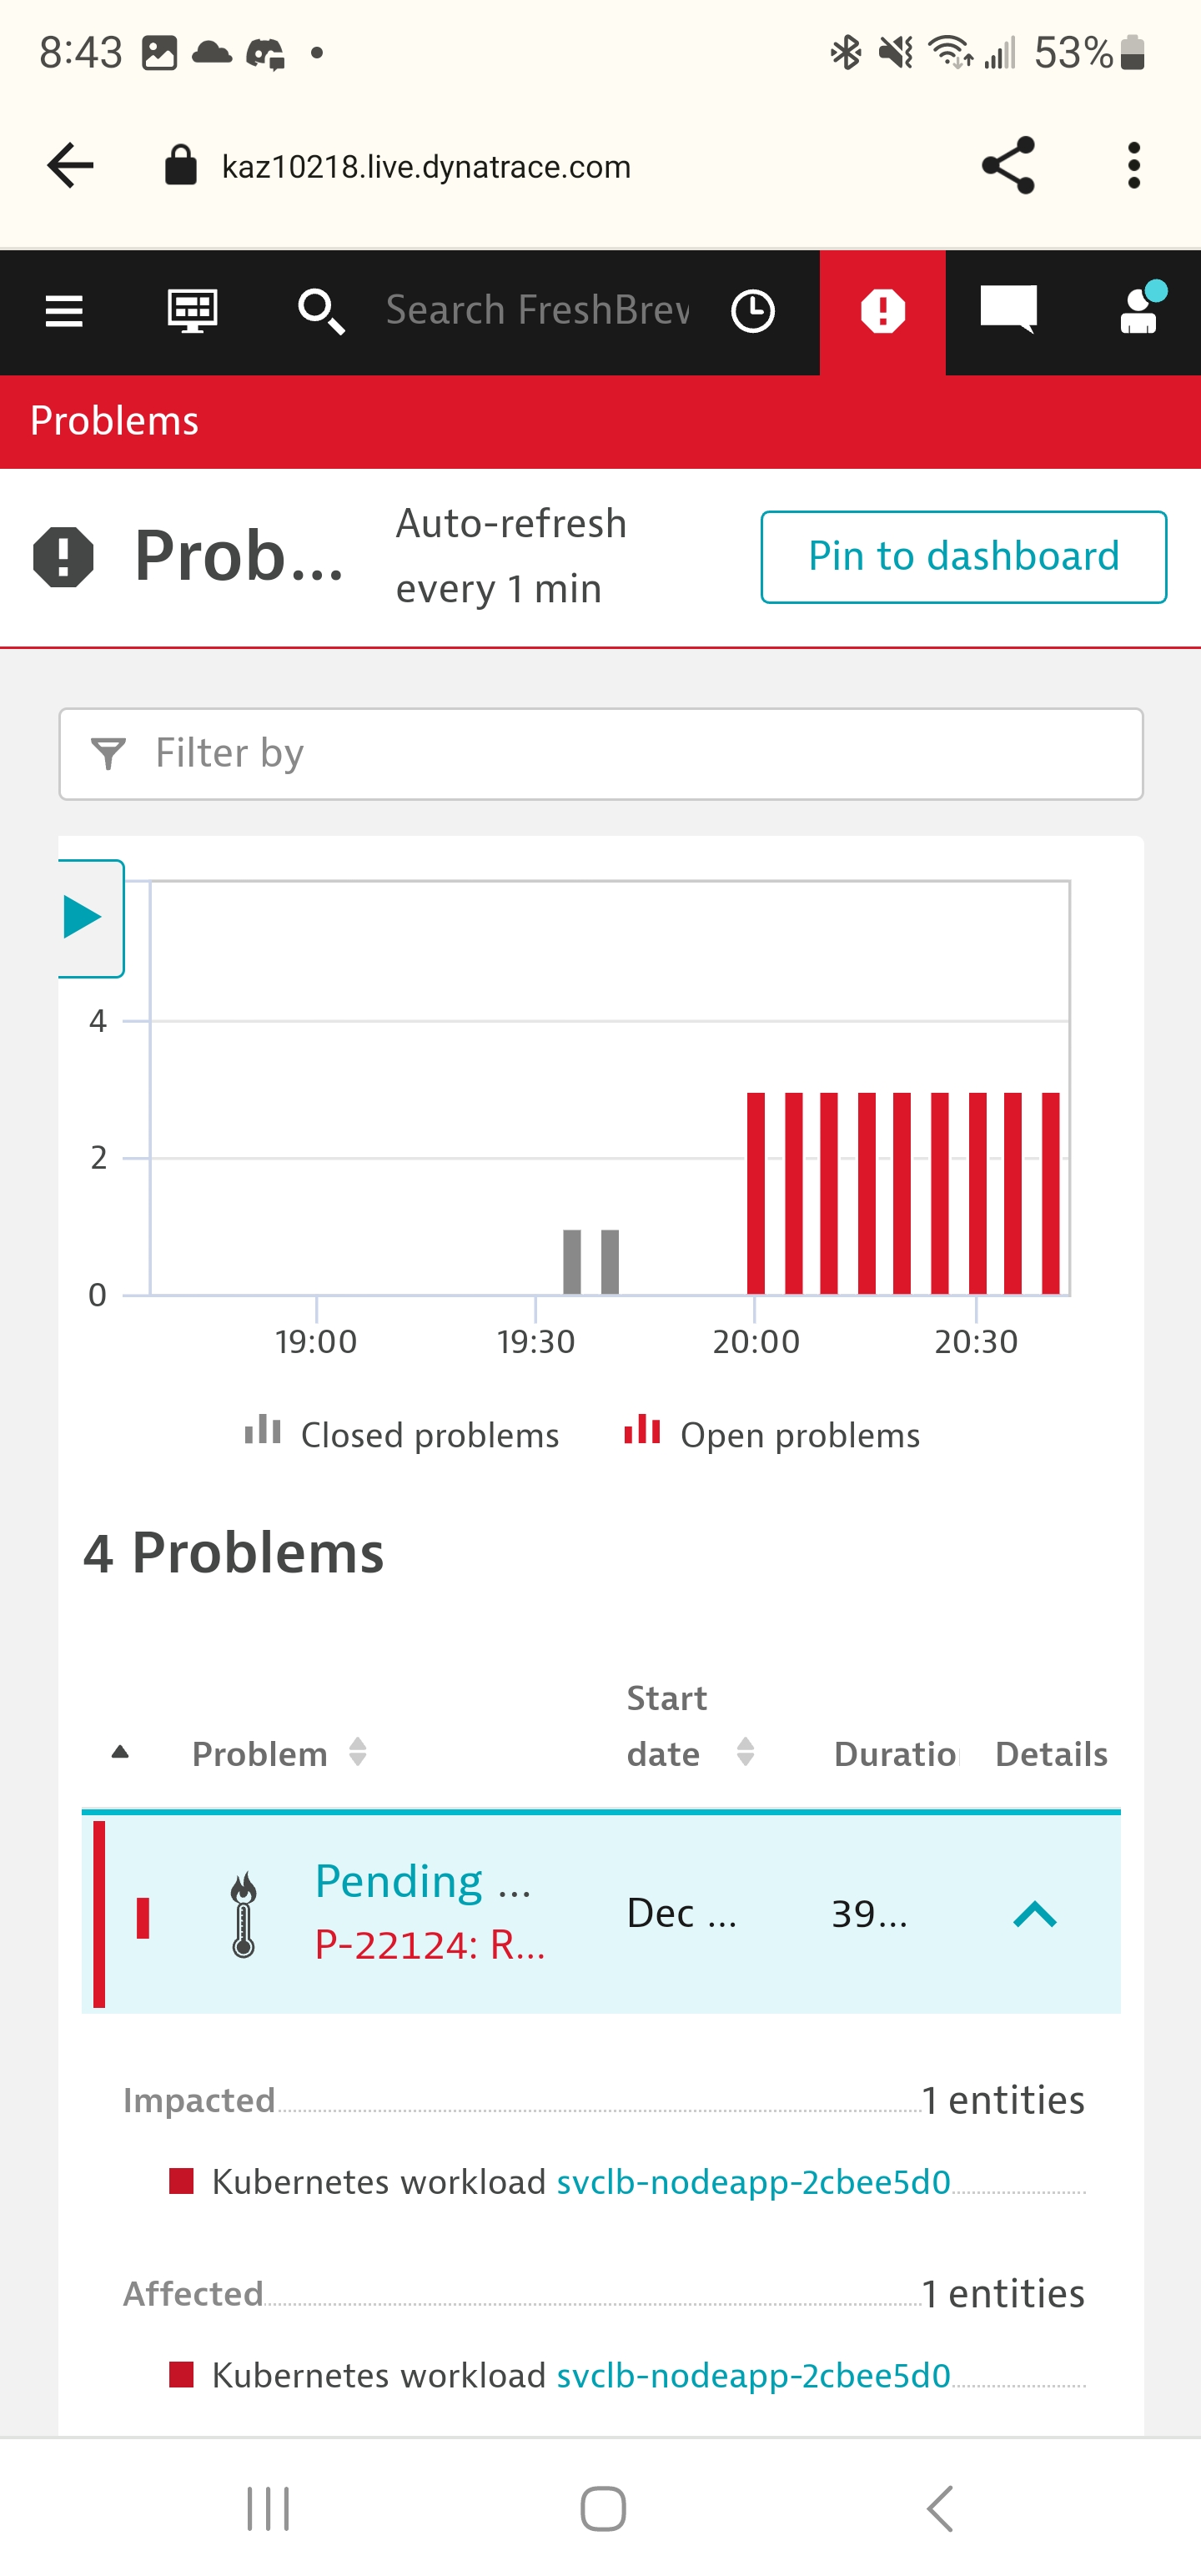
If I click “Show in Webview”, it loads the website onto the phone
Usage
When it comes time to pay for things, we’ll want to get an idea of usage.
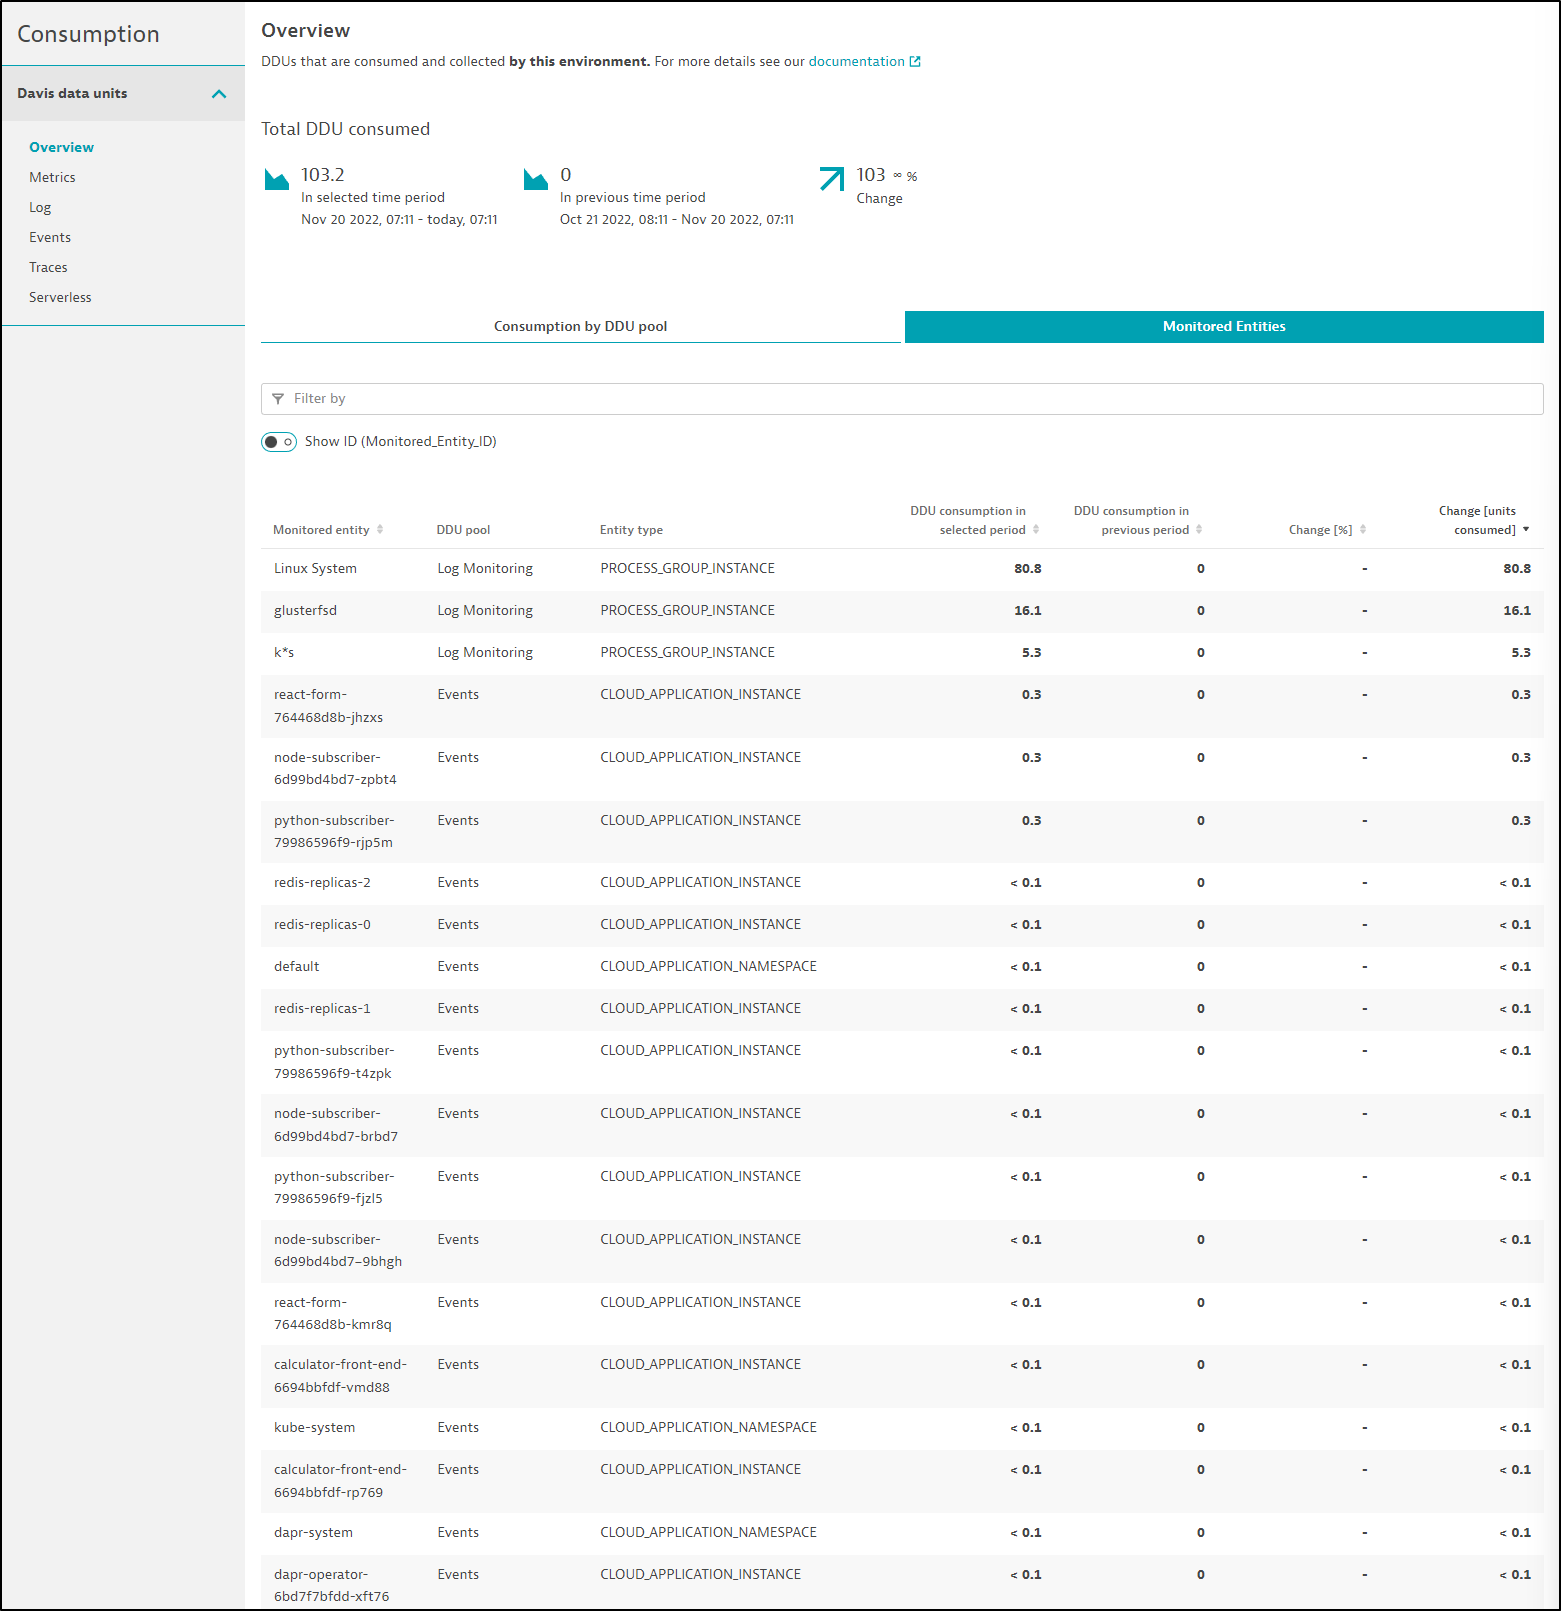
At any point we can head over to the “Manage/Consumption” section to view our current usage
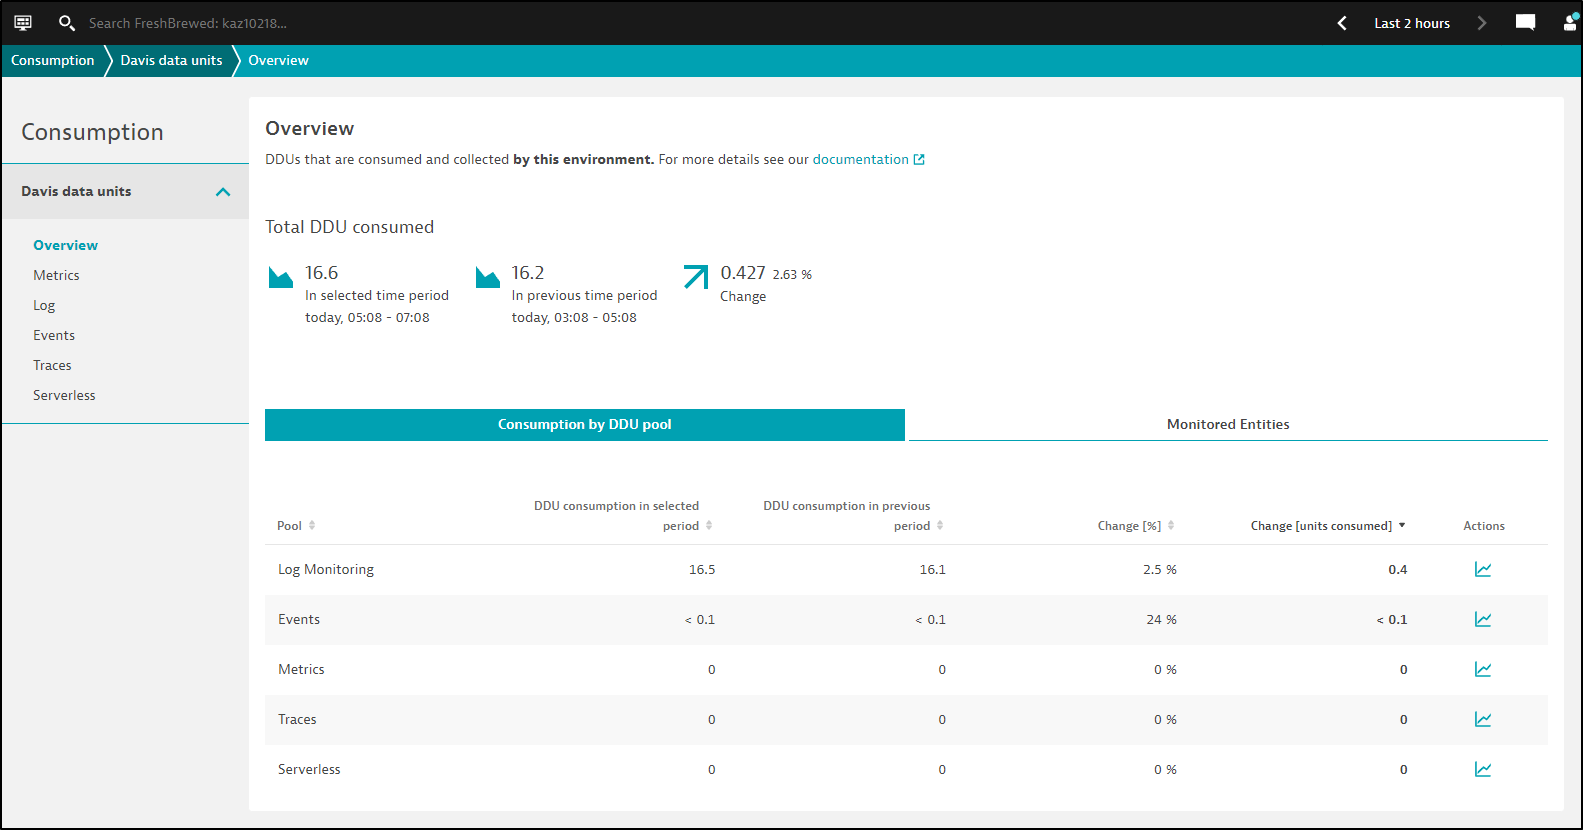
Like one might expect, the usage details above match the time window in the upper right.
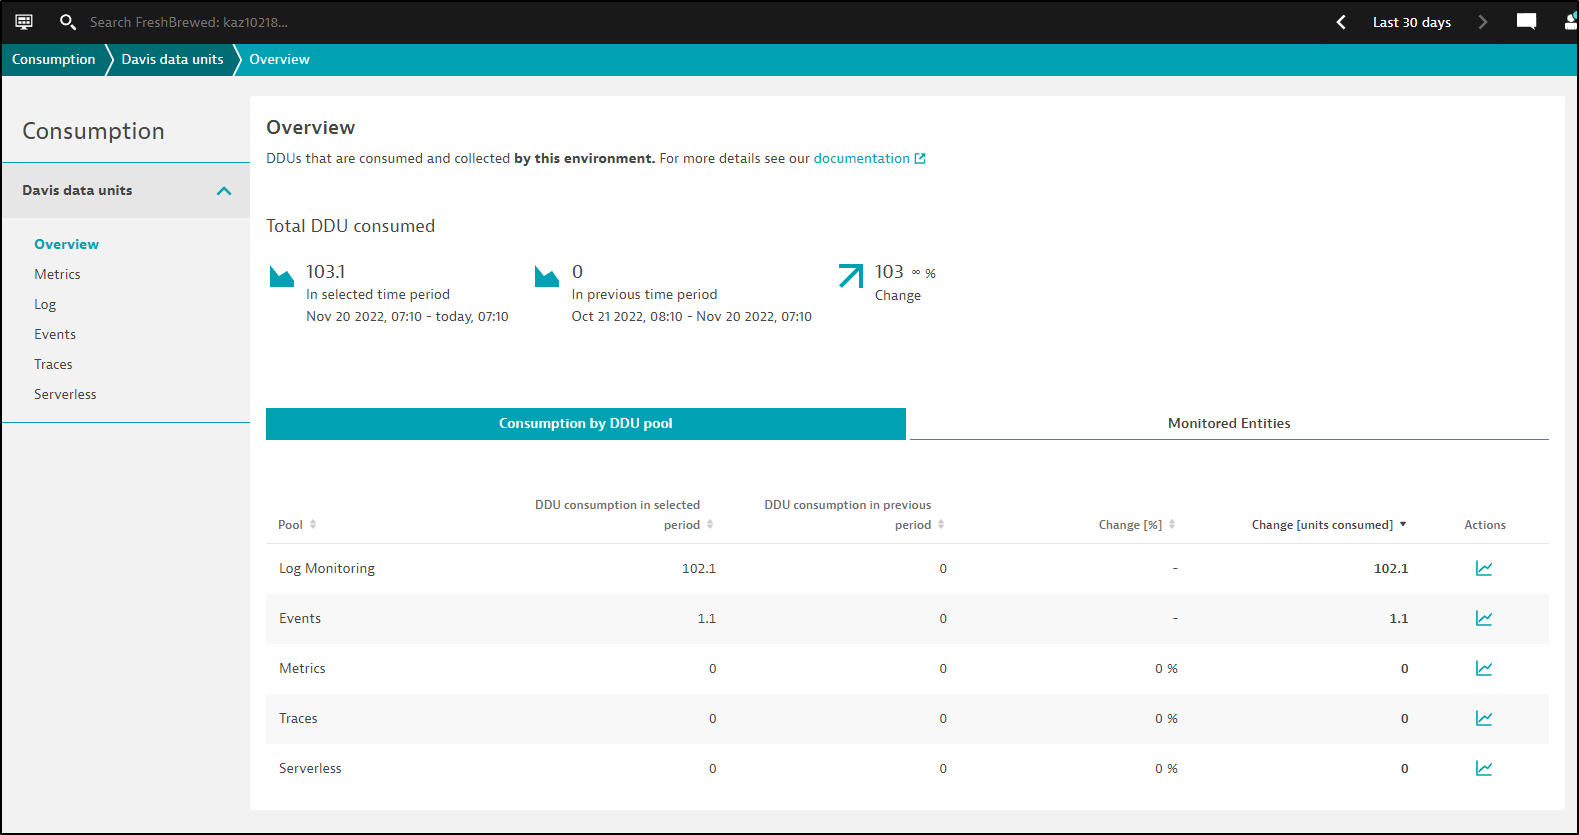
If I change to the last 30d, I can get a 30d rolling report
I like the fact you can view by “Monitored Entities” if one is trying to see what systems are using Dynatrace the most
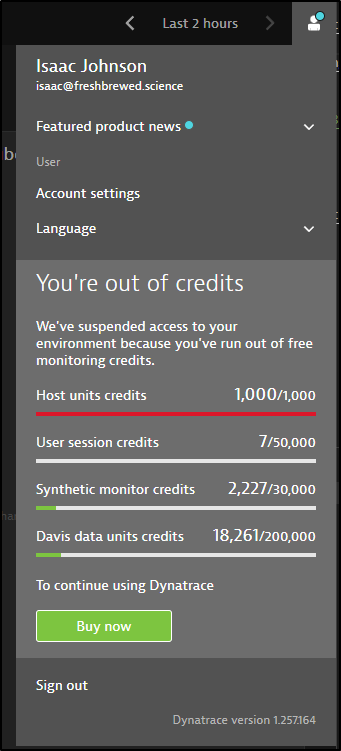
If you click your user icon in the upper right, we can also see a top summary of usage
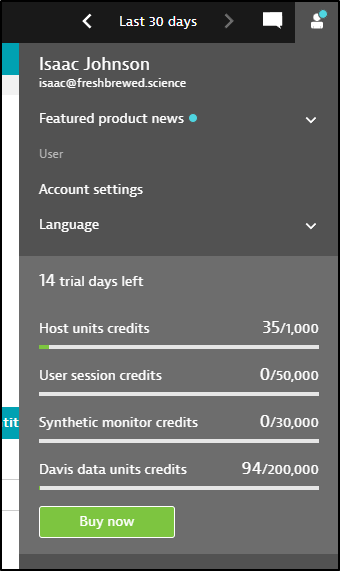
In my case, I very easily used up all credits in my trial window and the system stopped
Buy Now
Yet again, we are stuck with phone calls or chat. Buy Now just takes me to a “I must negotiate” page
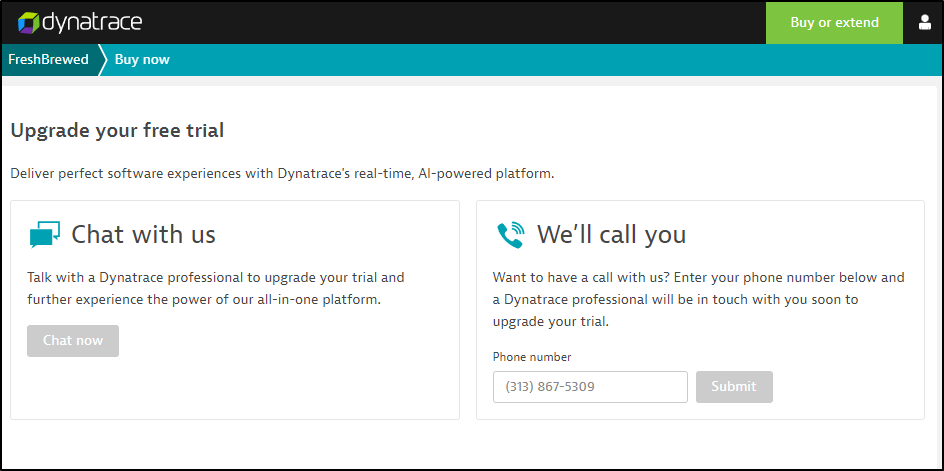
Which I really really hate. This tells me prices are fluid and depend on what a salesperson negotiates.
Yes, they list prices, but there is no “buy” button - it’s only “start a trial” and “Contact Sales”
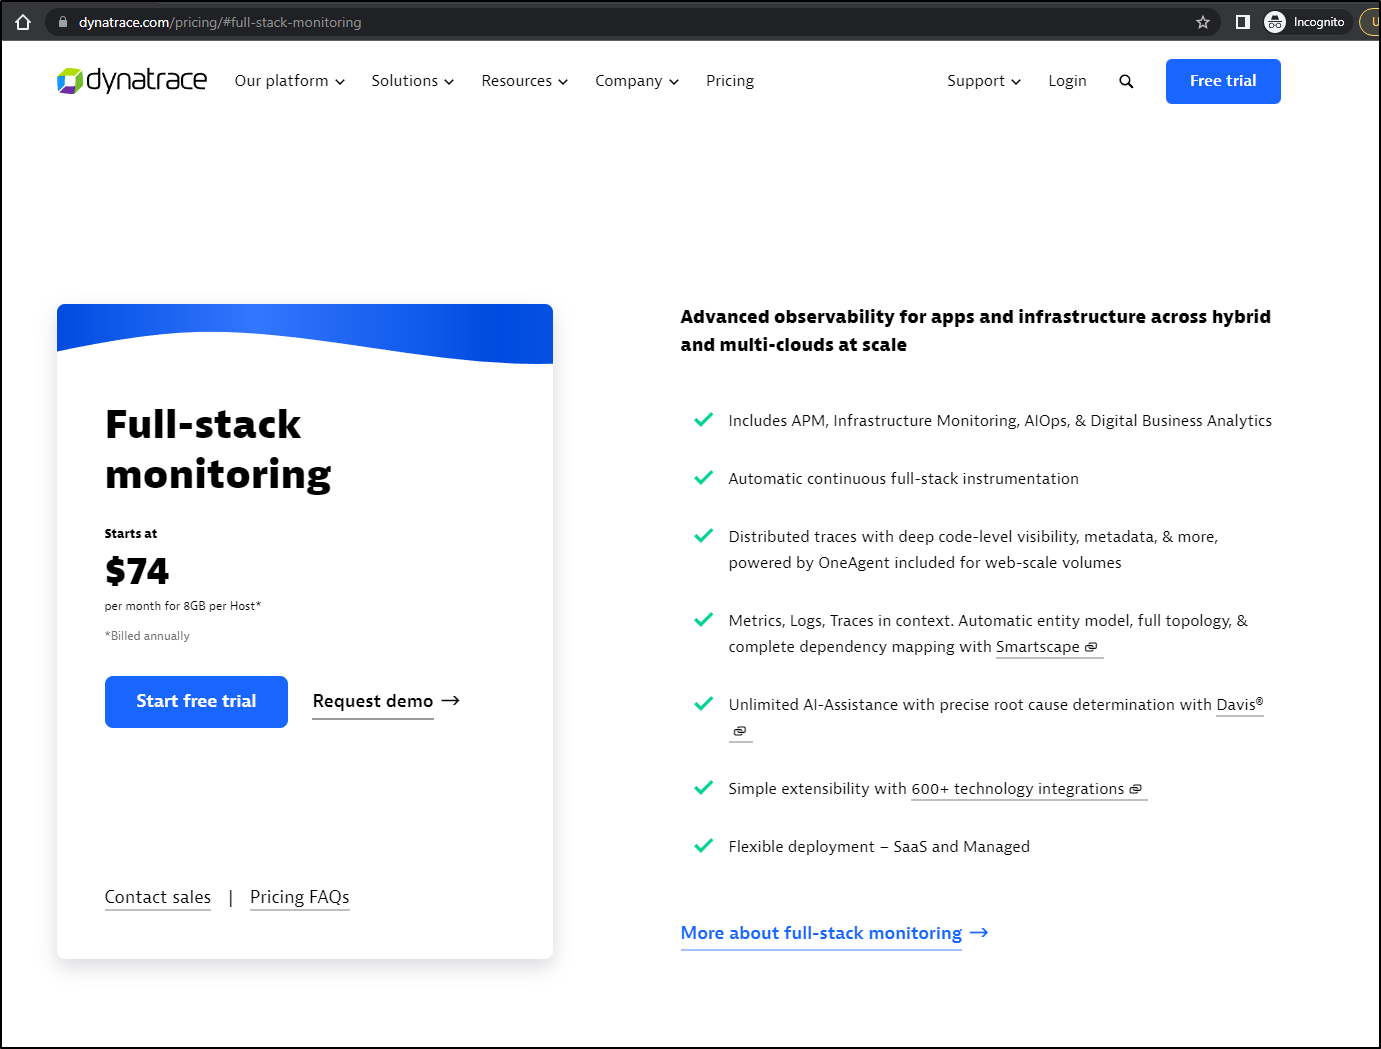
If we compare to Datadog
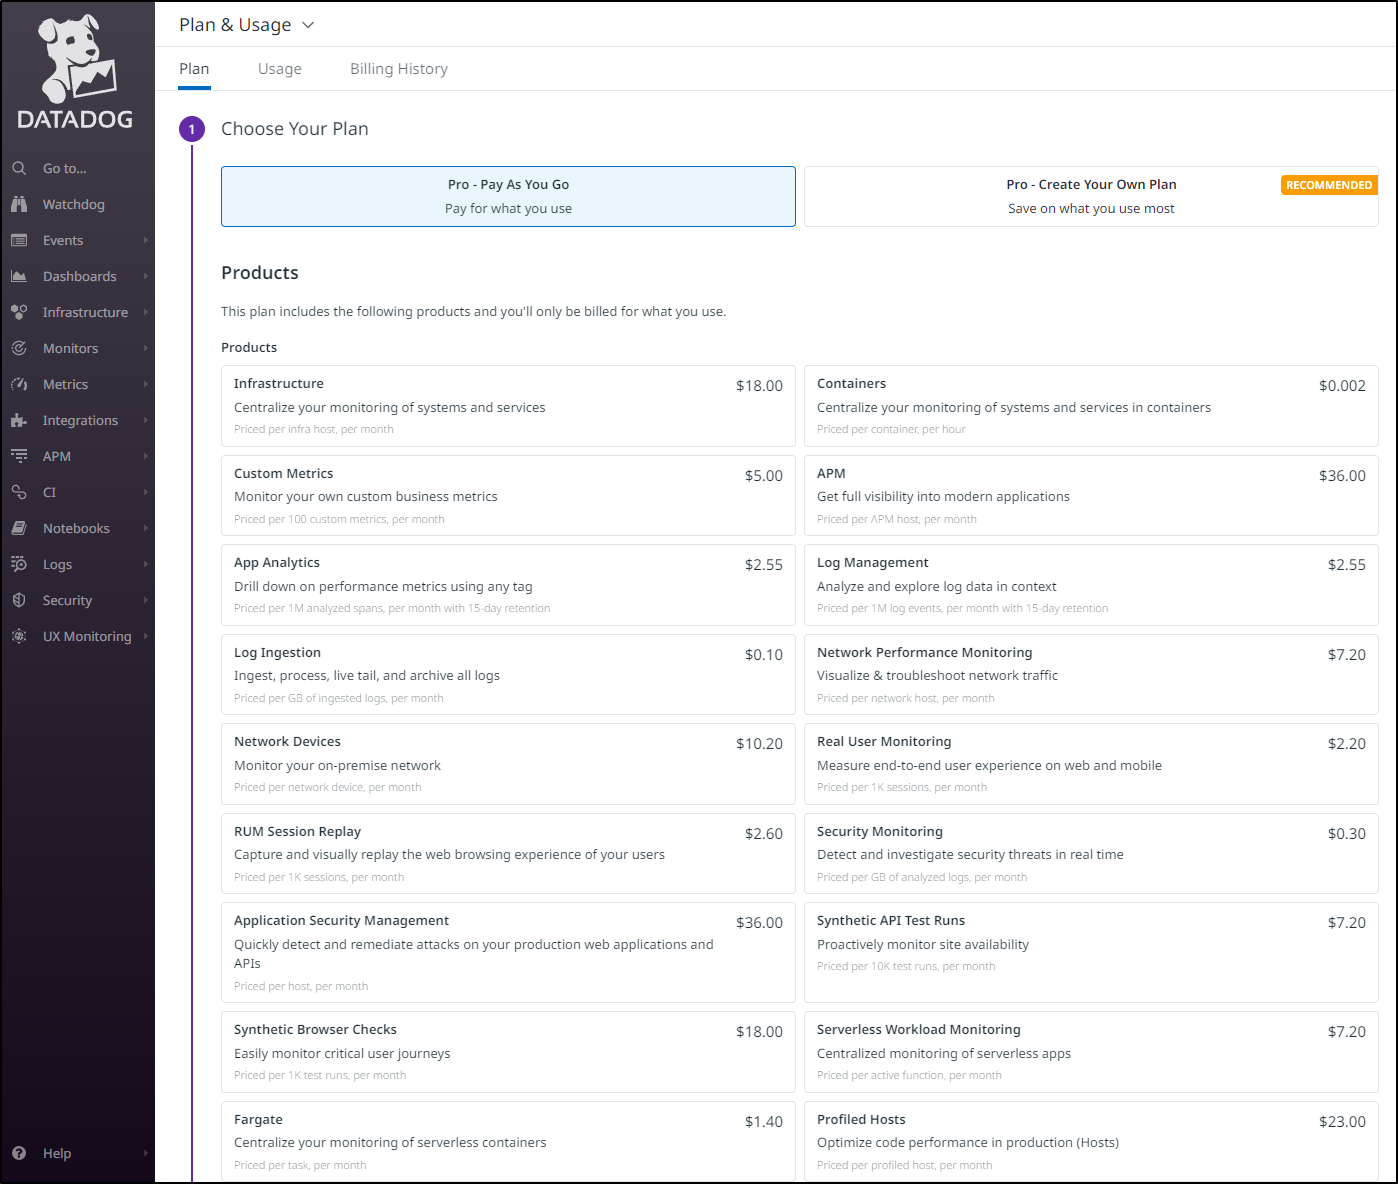
I can pay-as-you-go or I can just pick like a menu.
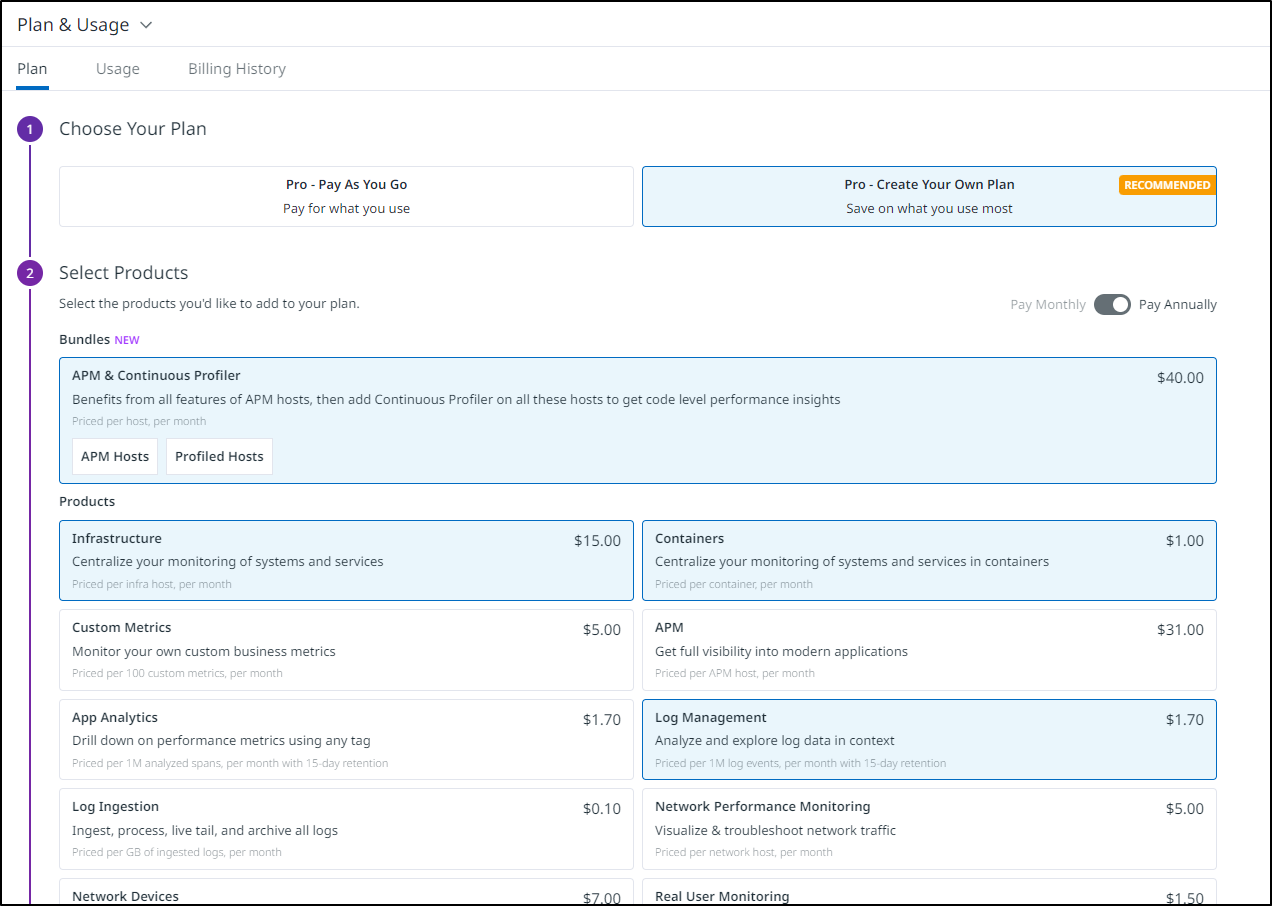
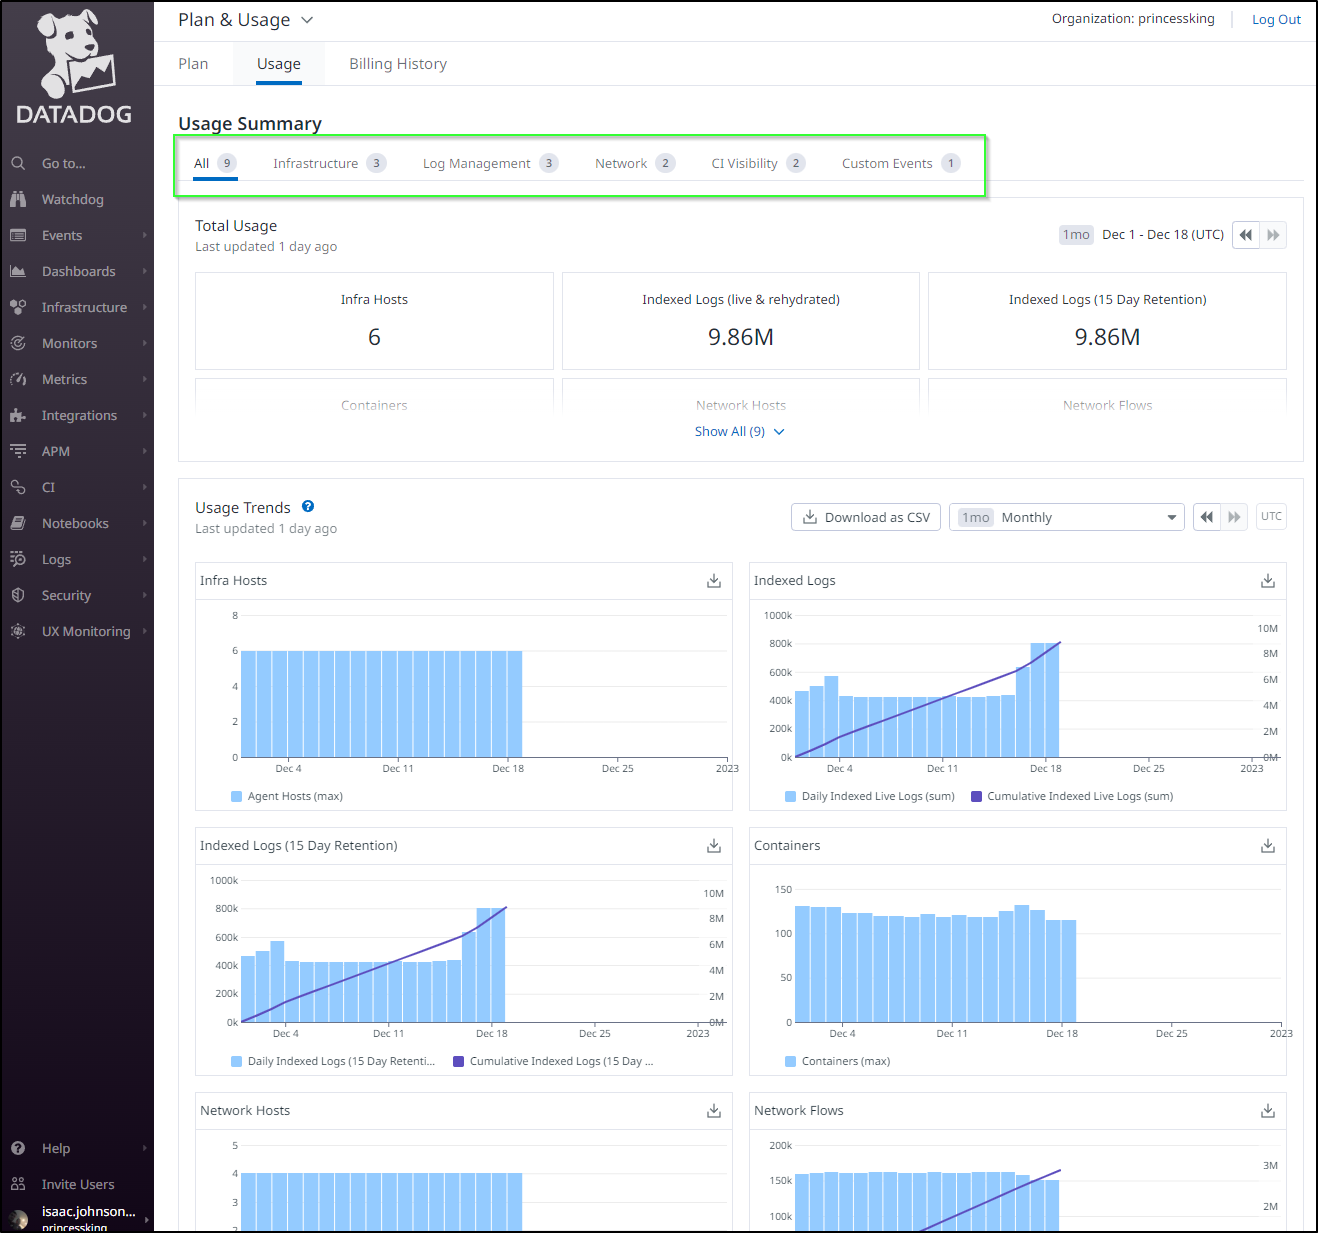
And while Datadog arguably lets you pick A LOT of menu items, i can use Usage to see what I really use
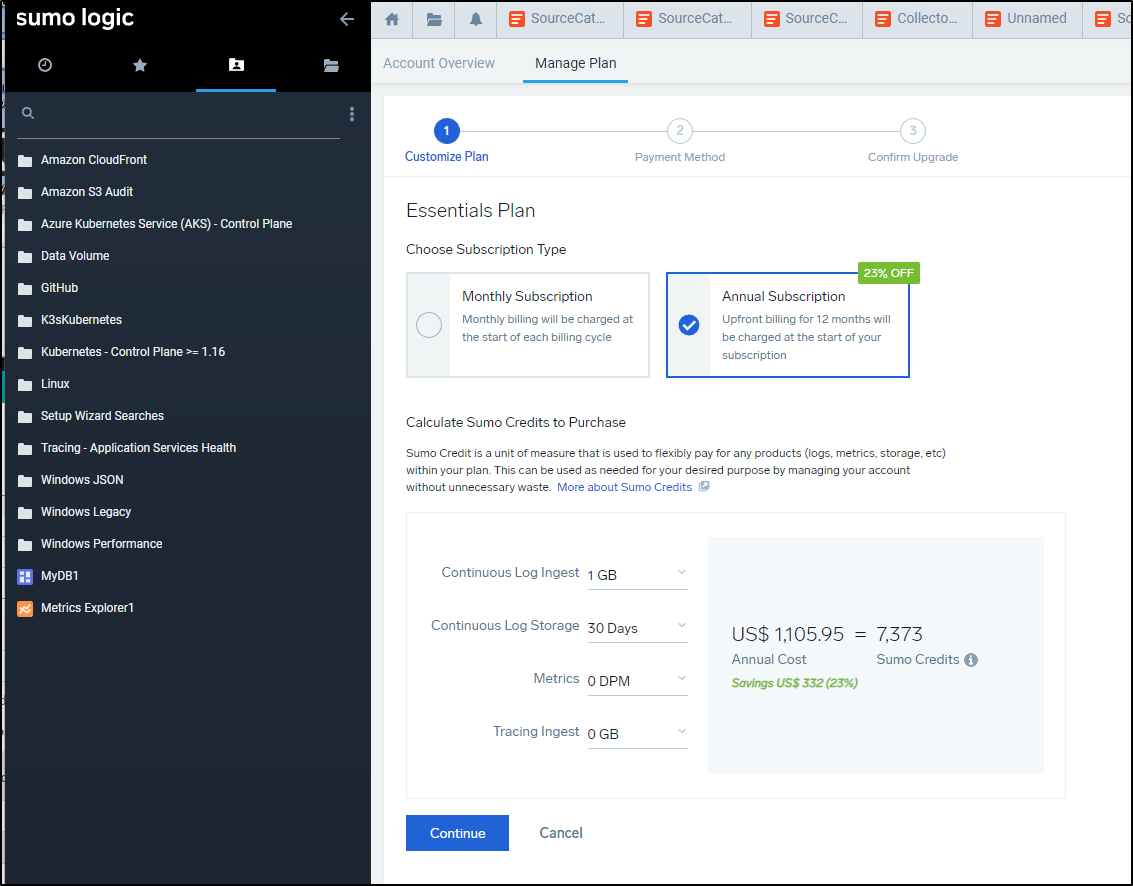
Or if we compare to SumoLogic, another of my APM suites, we can just buy Sumo Credits (they have a model where everything breaks down into a credit to spend)
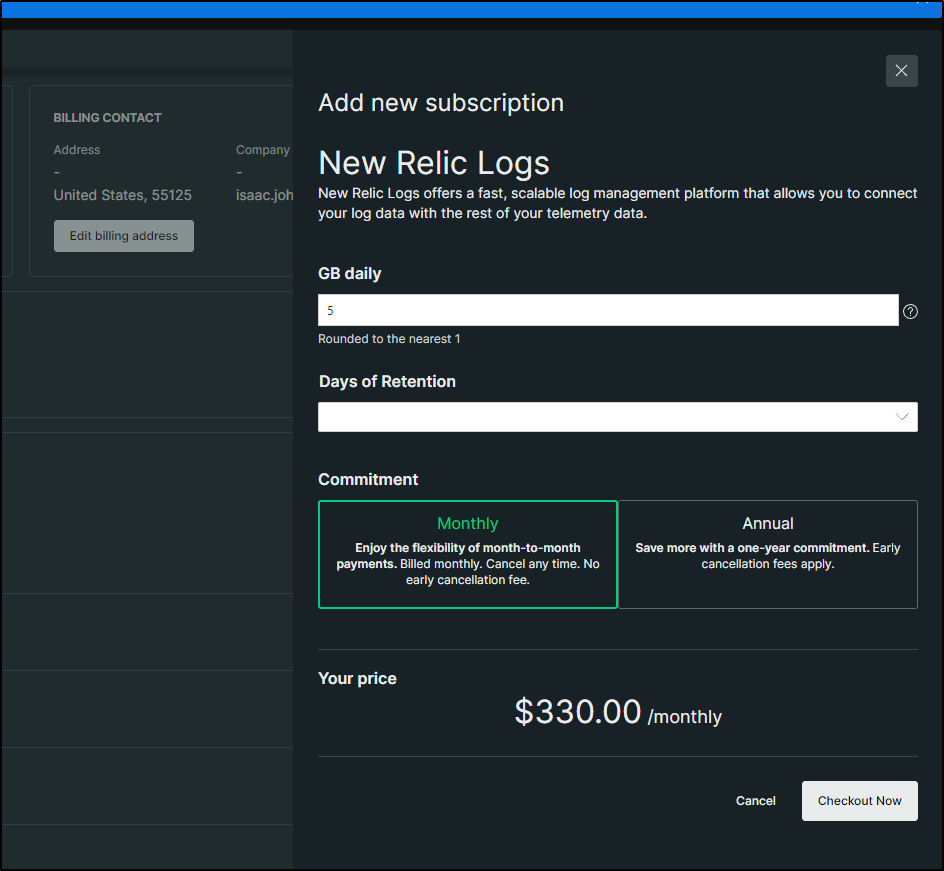
Or New Relic (who still have rather high logging prices in my opinion)
Perhaps I’m being harsh, but I just do not trust companies that cannot be upfront with costs and require me to chat with someone to get a real price.
I’ll agree that Dynatrace lists some price guidance, but if you see “* starts at” with no more details, you know you are in for a ride.
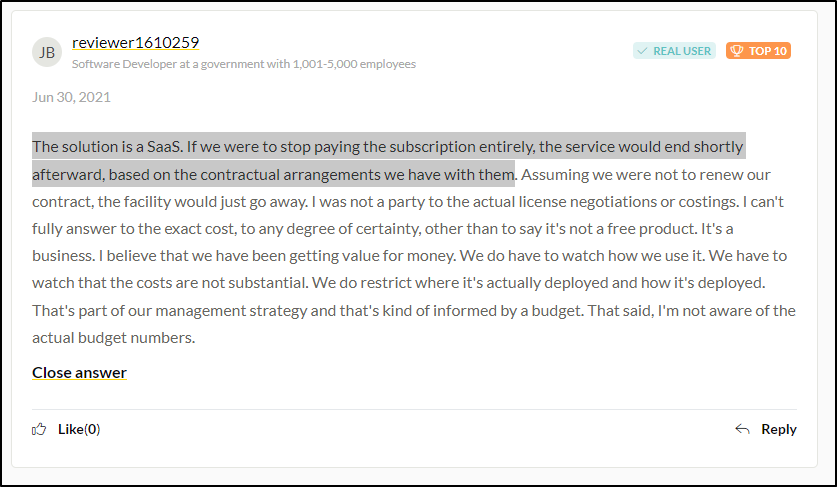
I did some searching and again found threads about Dynatrace pricing
One of the ones that hit home was by a government-based software developer: “The solution is a SaaS. If we were to stop paying the subscription entirely, the service would end shortly afterward, based on the contractual arrangements we have with them”
This leads to another reality; New Relic, Sumo Logic and Datadog All have free tiers (which I use). If I don’t pay, I just get reduced to a free-tier plan. I don’t lose my recent data.
I guess I see Dynatrace as the Peloton of APM. It’s very nice - no argument there, feature rich and a wonderful interface. But it comes with fees that render it useless without an active contract.
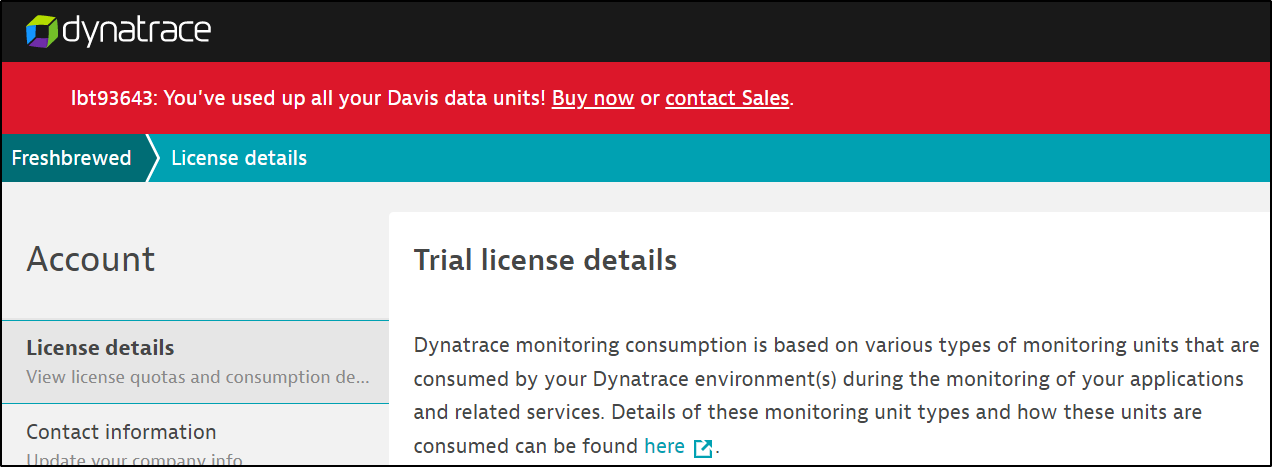
To make my point, when the trial expires, you have two options “buy now” or “contact sales”
And the “Buy Now” takes me to, surprise surprise, a Chat now or call me later option
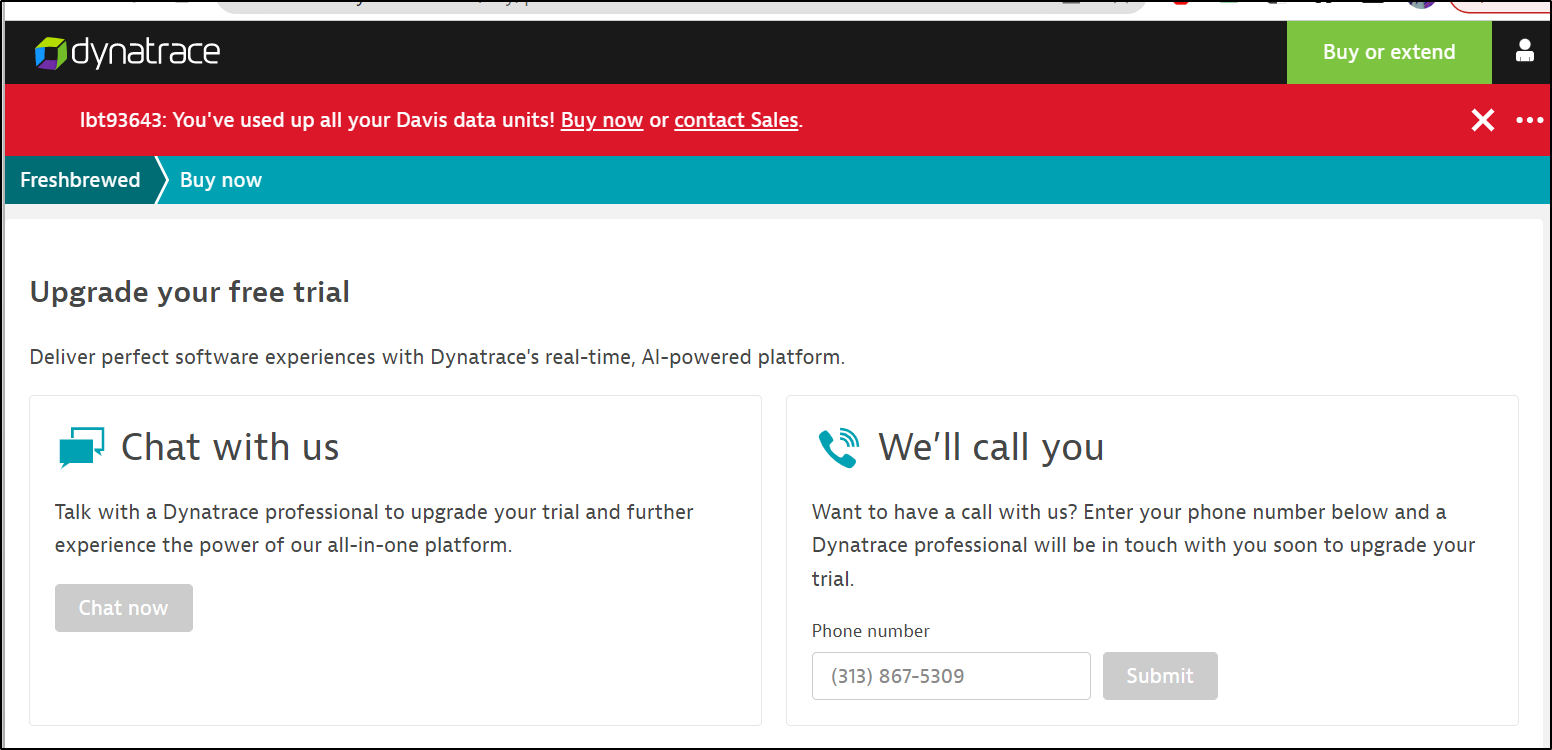
The link in the upper right “Buy or extend” also takes us to this ‘purchase’ page. They literally make it impossible to keep going without a conversation.
Trying to purchase before expiring
Trying to purchase after
I also found it interesting that they email you from a ‘natrial’ email address:
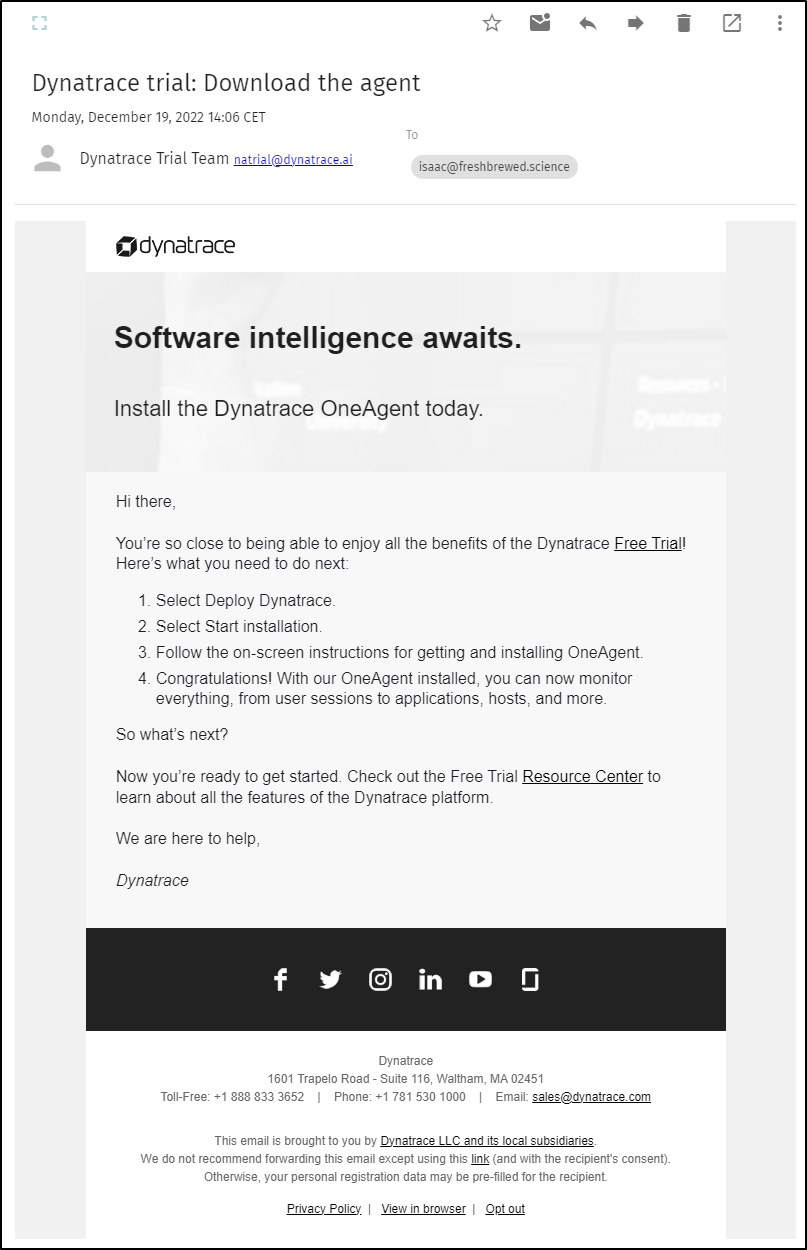
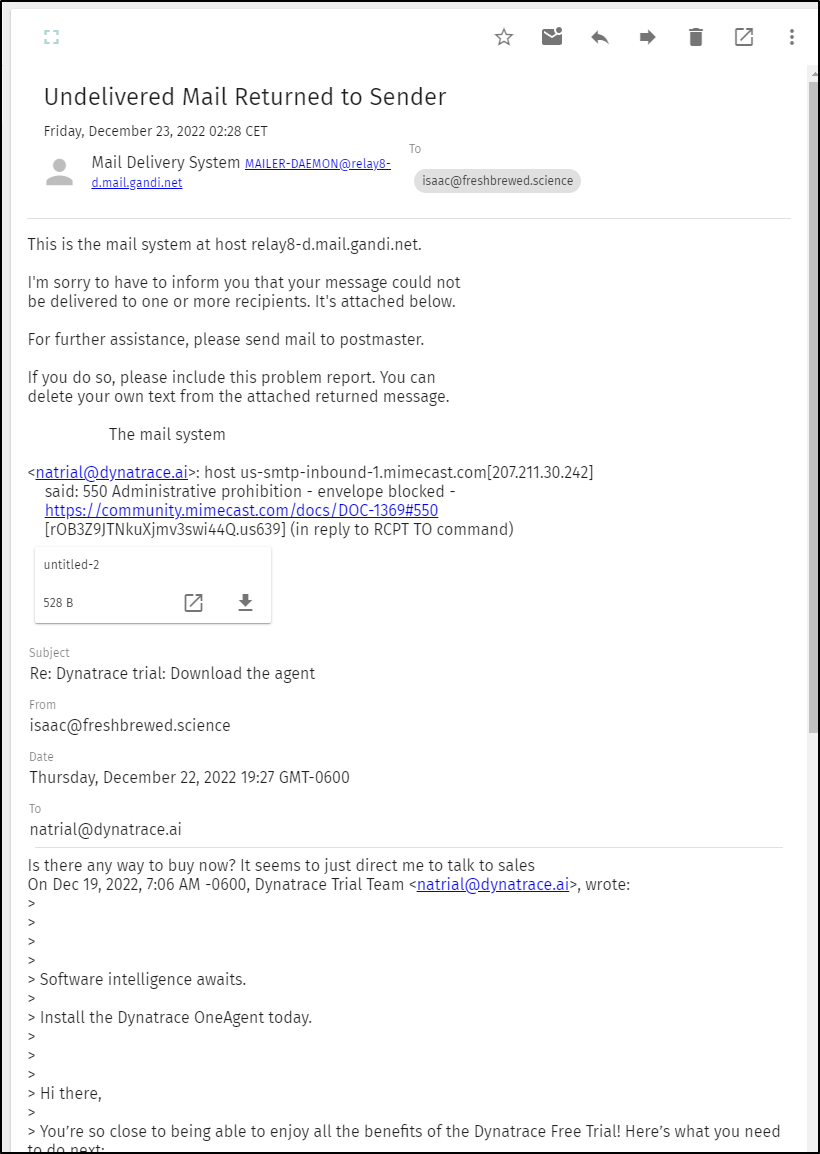
But if you reply to it
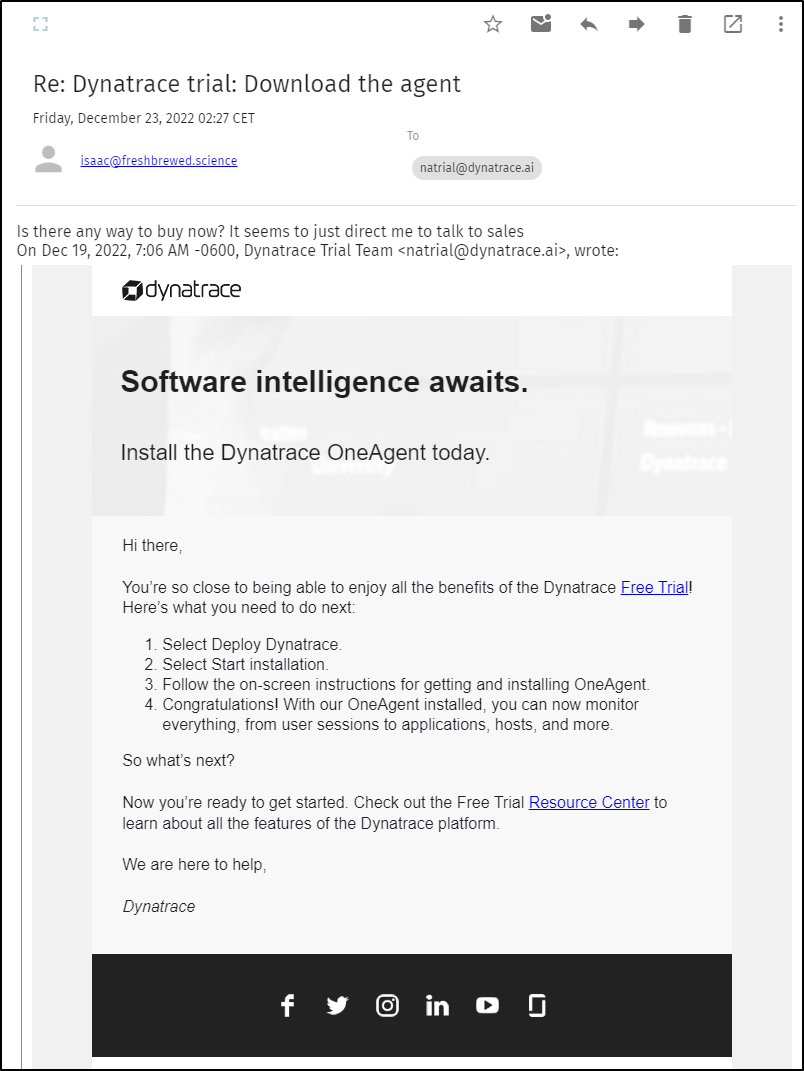
it just bounces back
And near the end of my trial, a banner clearly prompted me to “buy now”. Only, as you can see, that was impossible
Even the “Chat now” was disabled
Summary
Summary
In our first post, we covered signing up for Dynatrace then installing into a fresh on-prem K3s cluster. We looked at the various monitoring options we get out of the box from the K8s collector; services, metrics and traces. We then wrapped up by setting up the Open Telemetry collector with Dapr and directing zipkin traces to the zipkin otel Dynatrace endpoint.
In the second, we focused on Serverless monitoring of GCP Cloud Run and AWS Lambda, Agentless (JavaScript/web-based), monitoring of Hosts (Infrastructure) and then how we remove the agent from Kubernetes which was one of our tests we set out to check at the start.
Today we covered installing into a production clusters, profiling and optimization, alerting, the mobile app, usage and some wrap up thoughts on costs and “buy now”.
Dynatrace is an amazing tool for gathering application performance data including traces and metrics. It’s ability to deeply profile containers is probably the best in the business. One can find and fix issues in the stack with relative ease.
The one agent setup is a mixed bag - you have the advantage of installing this mega-agent in your cluster, infra, etc. And then knowing it picks up its configuration from the server. In a way, that is good - you can control your monitoring selections from a central control plane instead of going out to tweak helm charts or confs. However, it also means my agent could do wild things outside my control if someone in the settings starts flipping toggles. I just see it as a mixed bag; If you have the control, perhaps it’s a non-issue. If your department’s relationship with Operations is - delicate - perhaps you do not wish to cede control on configurations to the ultimate APM suite management group.
As for logging, I simply could not get logging to work. I’ll assume it can work, but it didn’t pick up the logs in my containers and I wasn’t interested in events as logs. Additionally, throughout the UI, we have a time picker, but no LIVE view. Everything is time shifted. Often, I wanted to see the relative impact of a change of a setting or a pod rotation. However, not being able to click a ‘live’ button meant I had to repeatedly refresh the UI waiting for a change to get picked up.
While they do have a form of alerting, it is weird. I have to go into settings to an Anomaly area and then create queries based on some presets. Even then, there is no live or rendered view of the data (I had to click a button to go back to data explorer to see if I was right). I can’t tailor the alerts to different audiences easily. I say easily because there is a Problem Profile transform that lets one filter problems on a profile, and I would assume somehow this plays into notifications - but there was no linkage that was obvious to me.
Lastly, my largest bone to pick is in pricing. What is it. I can see usage; I can sort of equate the “Davis” units to a “starts at” price on a price page. But I cannot buy now, or extend my trial or even use a free tier. Once the trial is up, you are done with that account lest you start to have to talk to sales people.
And I only bring this up because it was a long time ago and I think that salesperson moved on - but when I did talk to sales, that salesperson called me daily. I got to the point where I told that person (in a somewhat kidding-on-the-square voice) “If you call me again tomorrow, I’ll block your number”. First thing in the morning, that person called me and I then ghosted them for a year after. Thus, I’m very hesitant to provide contact details to what I’ve experienced to be high-pressure sales.
But perhaps you don’t worry about that kind of thing; a director or VP or Procurement person above you will have to handle it. Some things I can see could be a “me-issue”. At the end of the day, Dynatrace is great for its namesake - tracing. It’s manageable for monitoring. It’s rather weak on alerting and who-knows on logging.