Published: Dec 5, 2022 by Isaac Johnson
We’ve covered using Datadog and other tools to monitor and display metrics. Today we’ll wrap our series on Aiven.io by looking at setting up a hosted Grafana instance and tying a custom DNS name to it.
We’ll setup a hosted InfluxDB to collect metrics from Kafka and Redis, then show how to use native Aiven integrations to link InfluxDB to Grafana.
Lastly, we’ll dig in to Grafana queries and dashboards and wrap by setting up Email, Teams and Discord integrations (including setting up a new Discord server)
Grafana
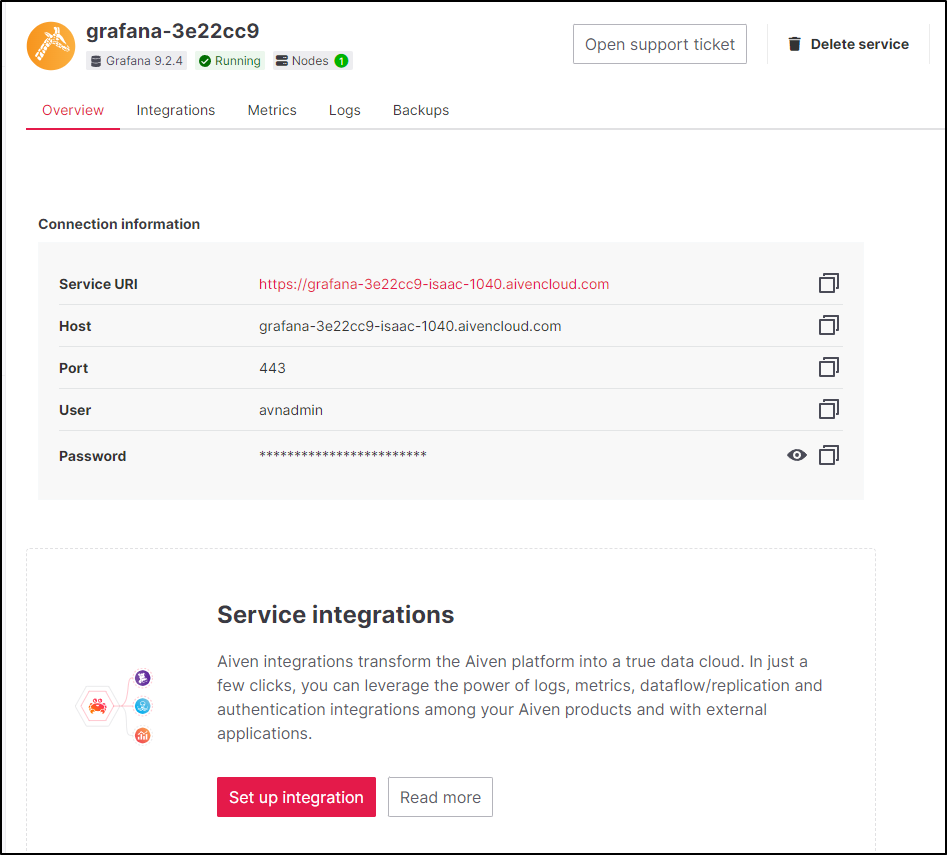
We first create the service from the Services page. It’s one of the least expensive hosted services from Aiven.io starting (presently) as US$35/mo in GCP

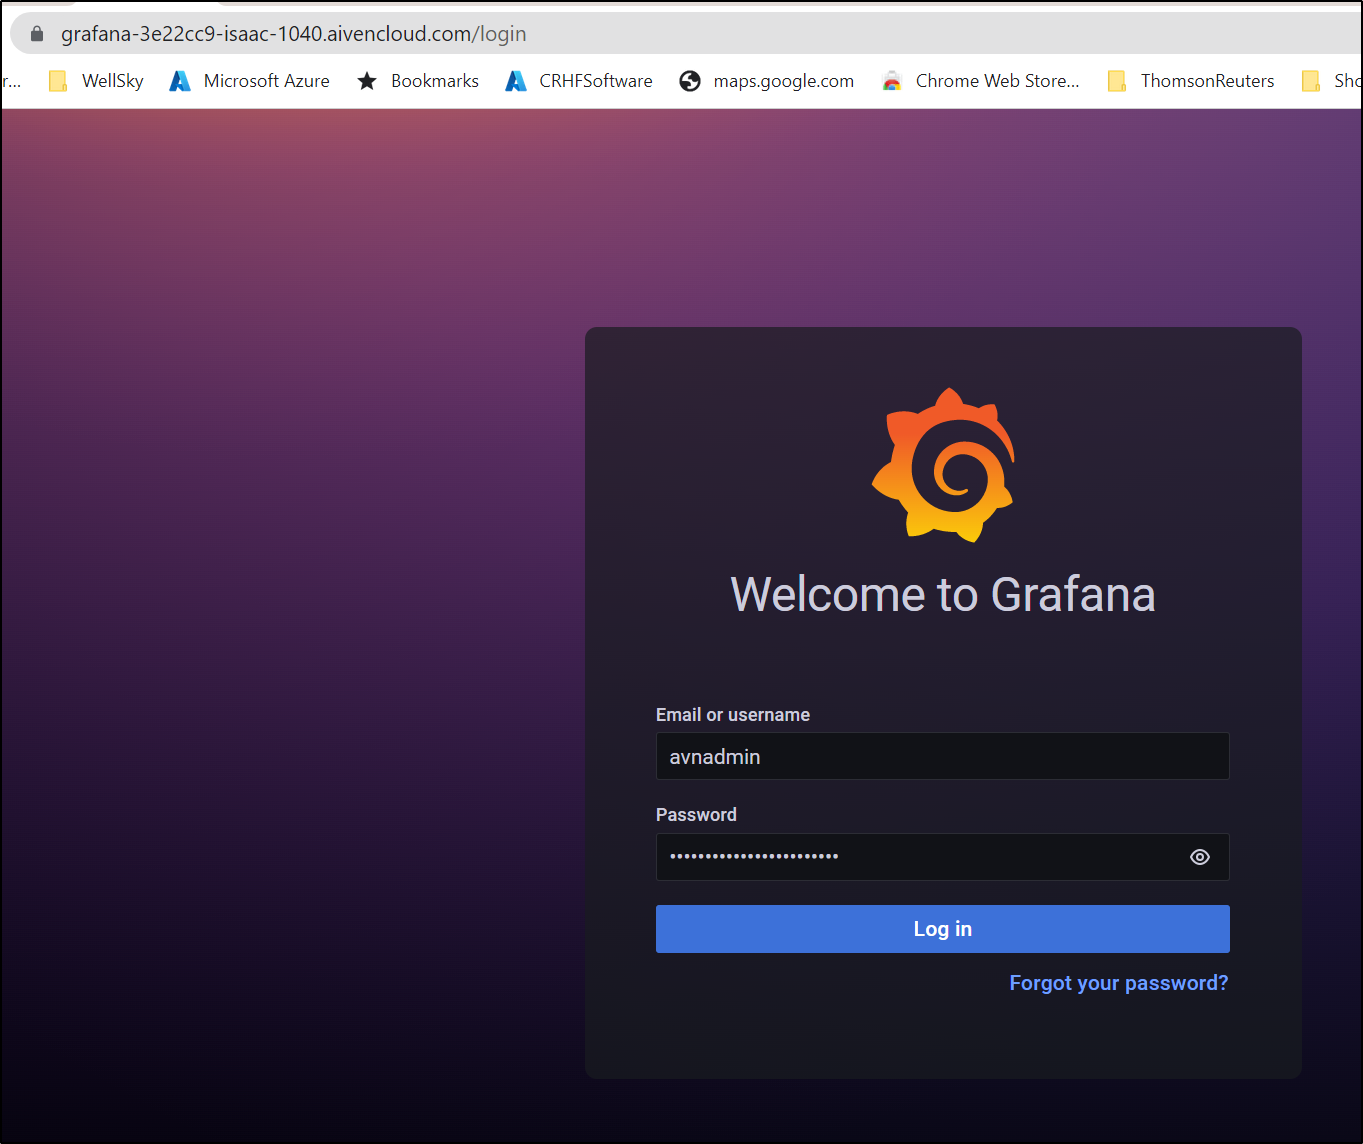
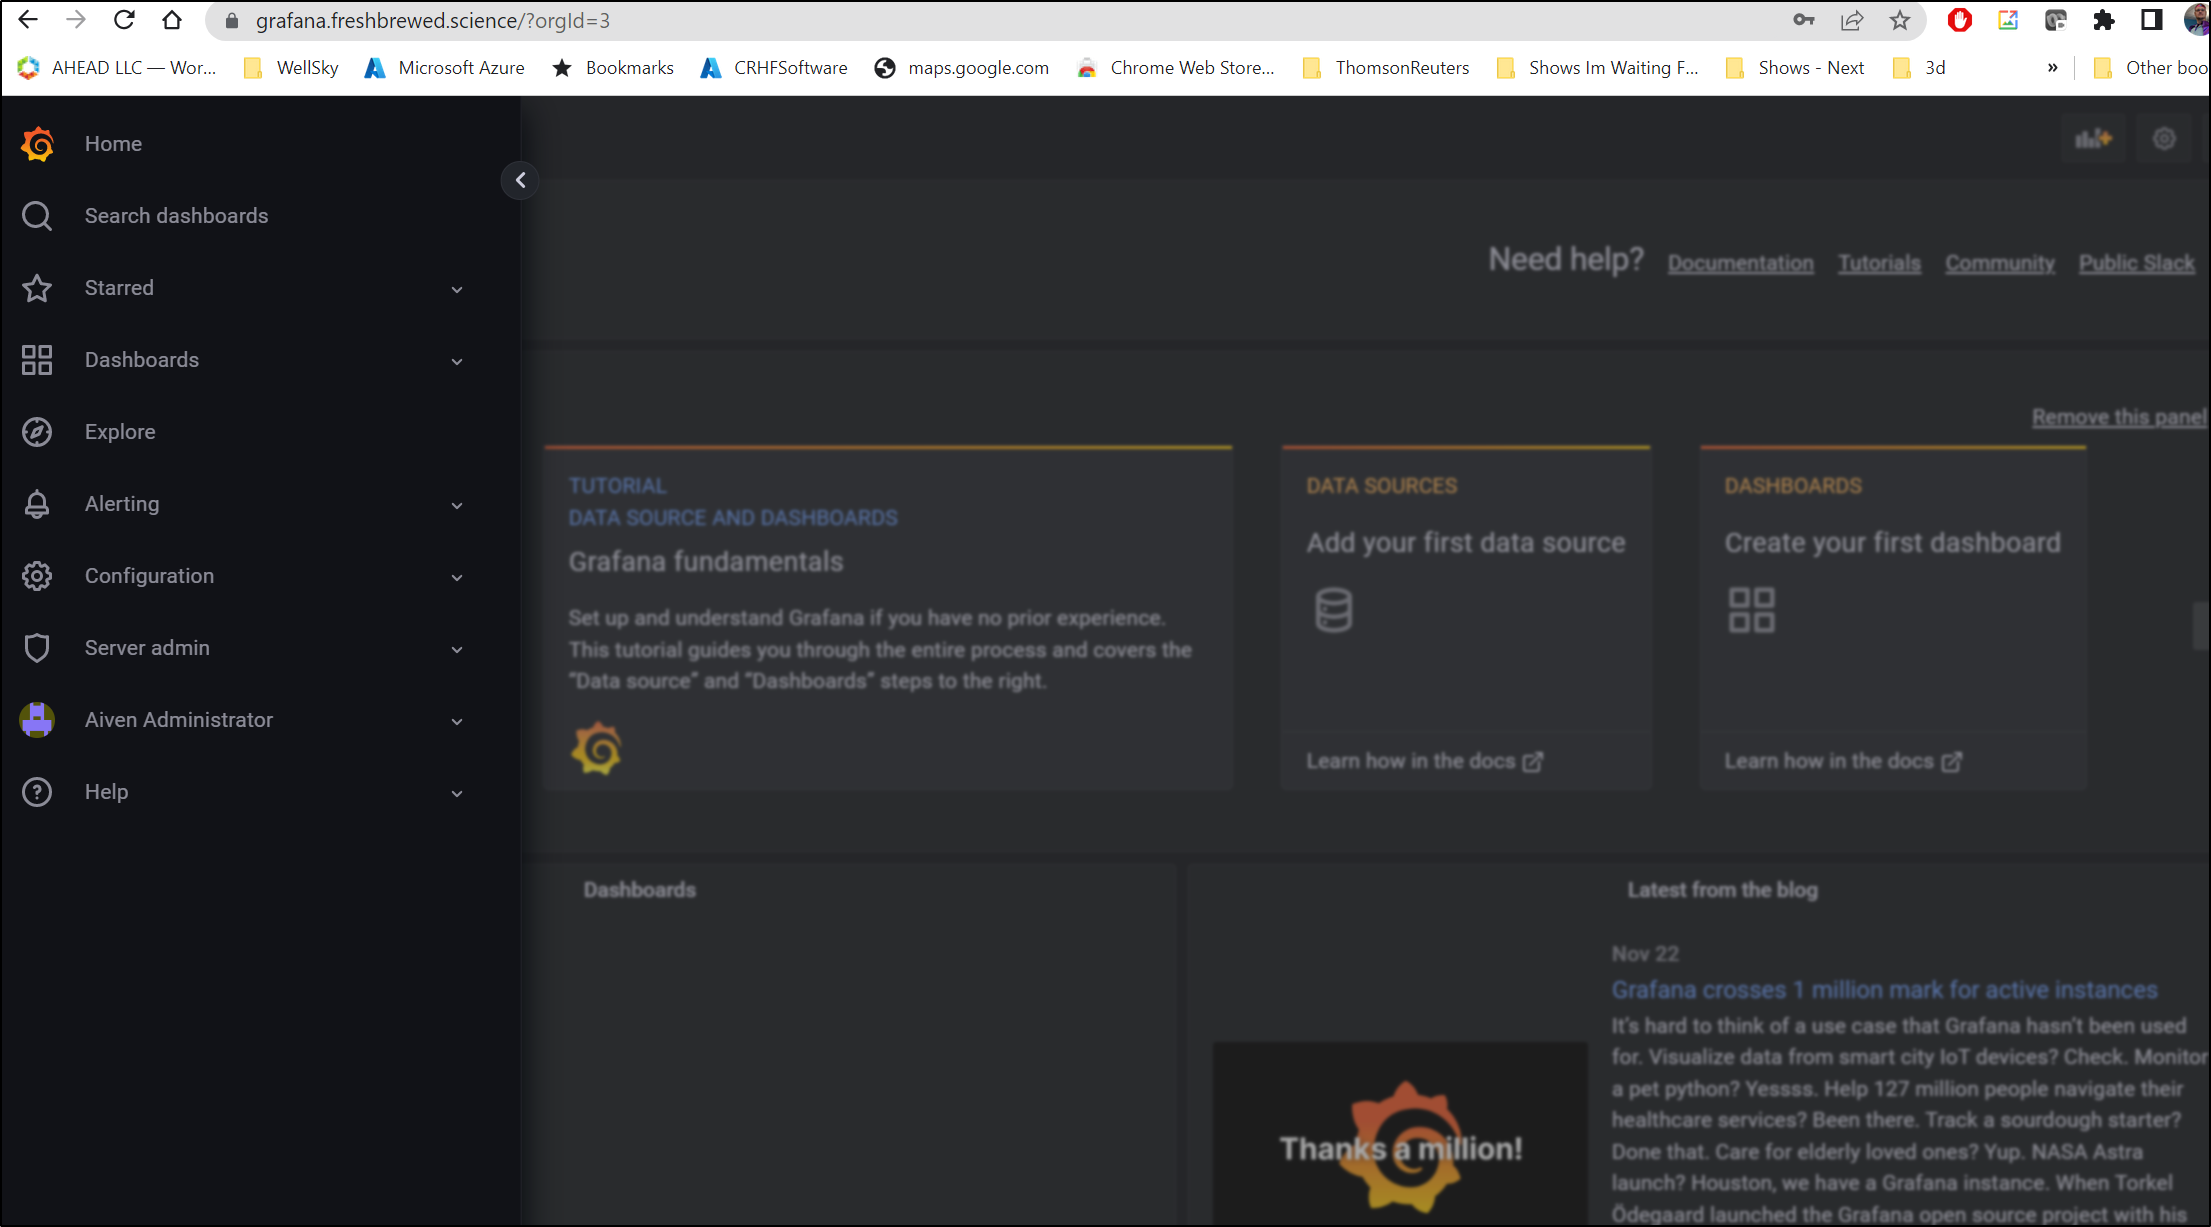
Once running, we can login with the credentials in the service page
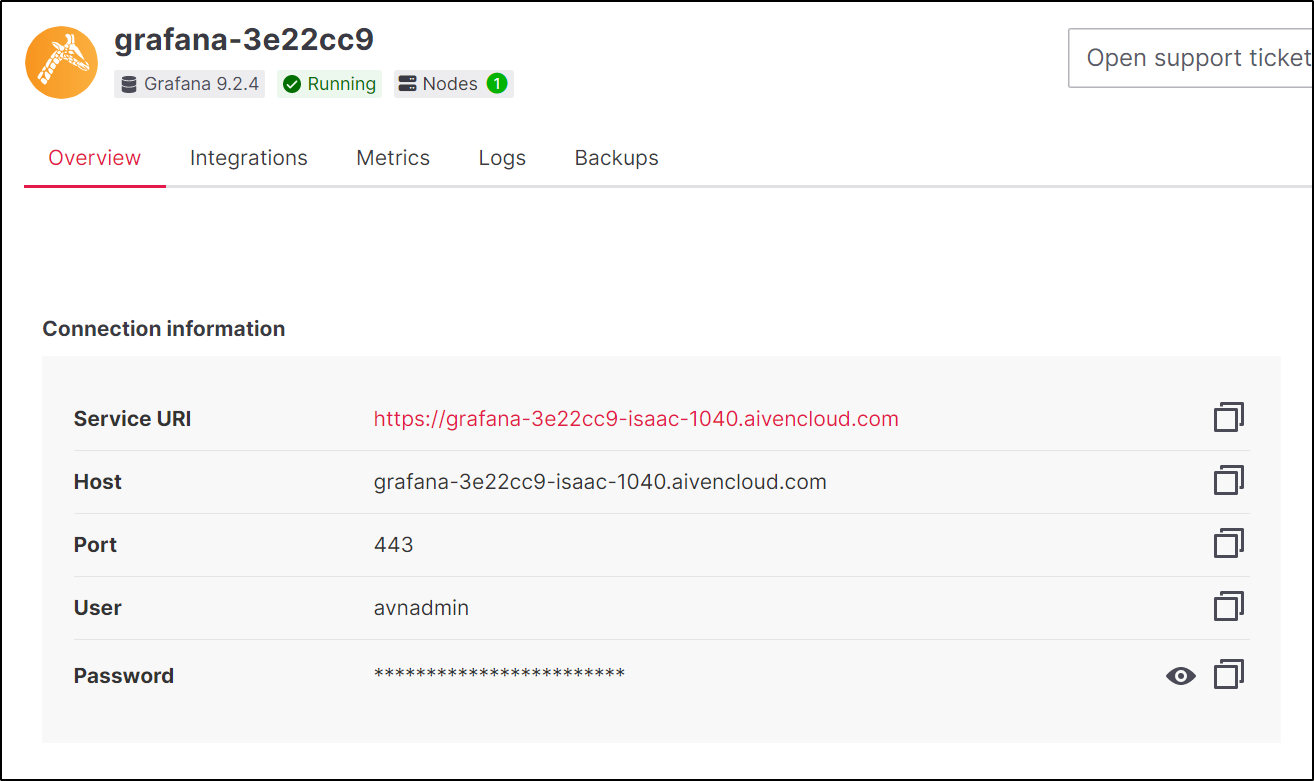
And use on the Grafana URL
Adding InfluxDB
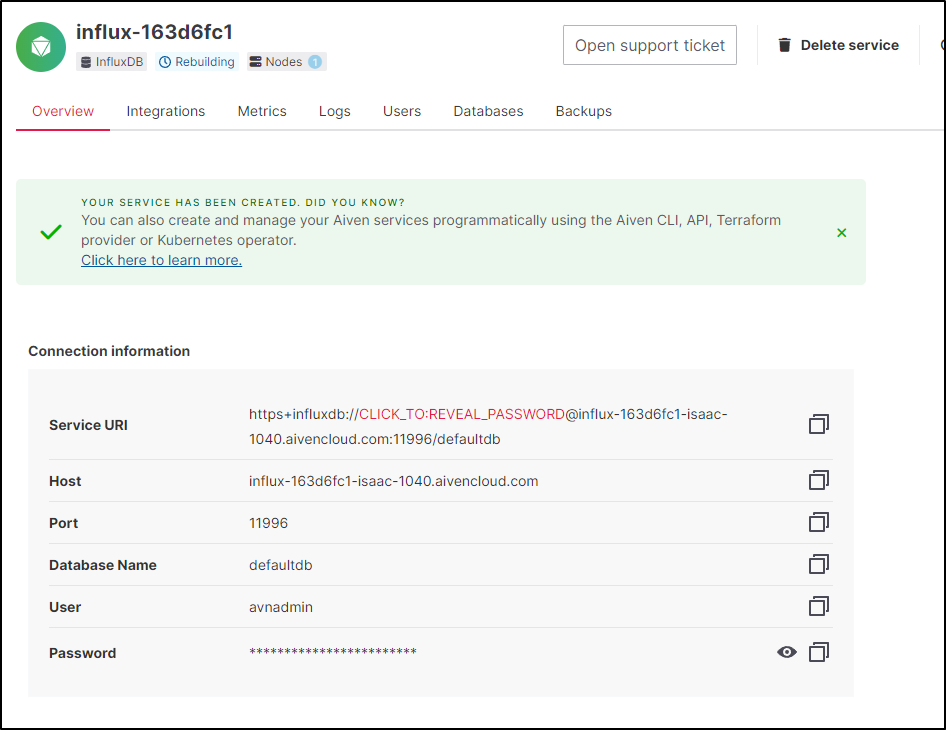
Of the Options to gather metrics in Aiven, InfluxDB is one of the less expensive at US$60/mo for a startup size instance in US Central
I’ll create and wait on the new service to get past ‘Rebuilding’
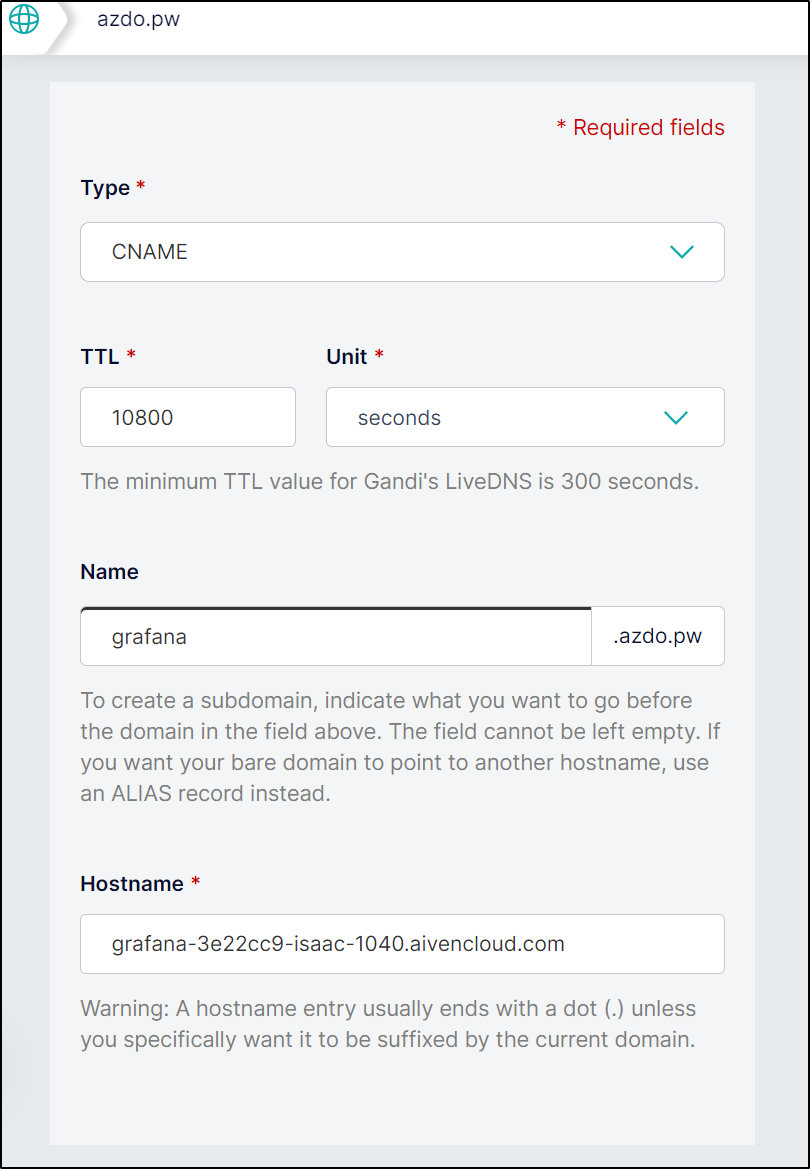
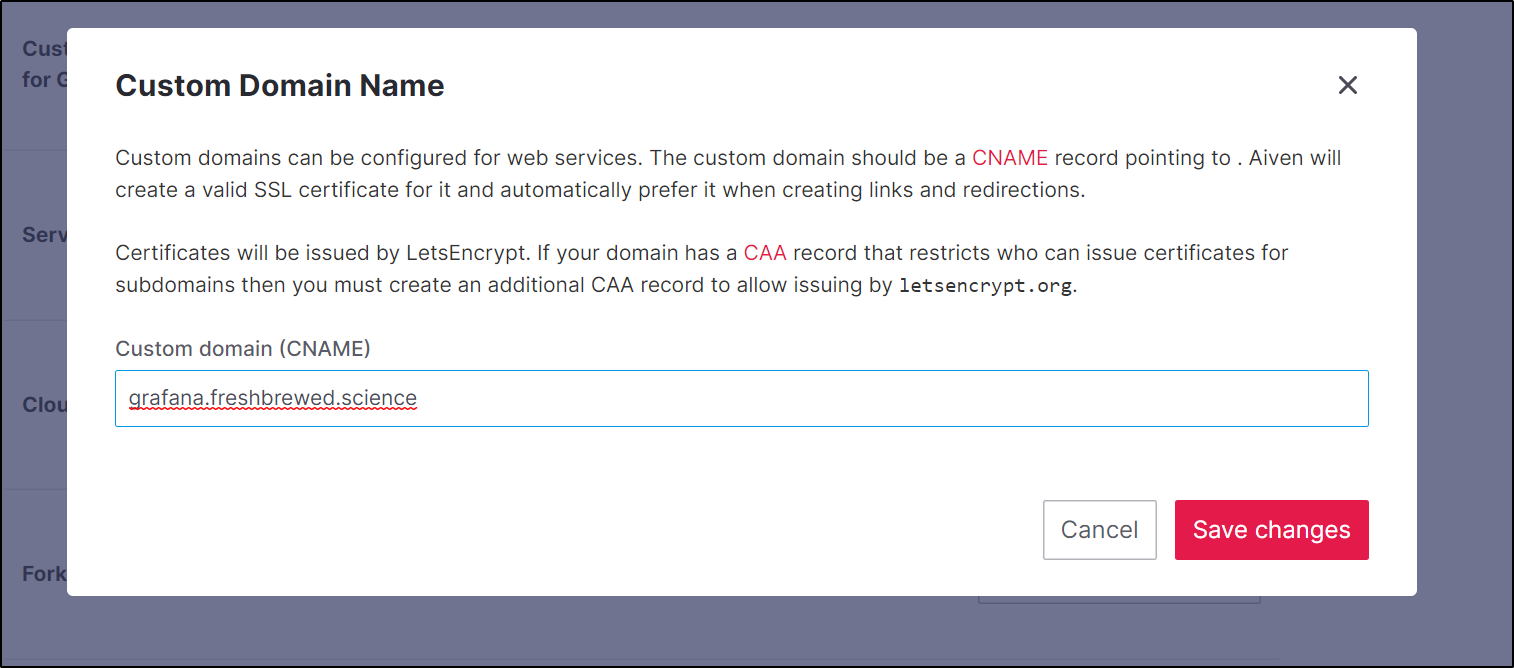
Custom DNS for Grafana
creating a custom domain name
and
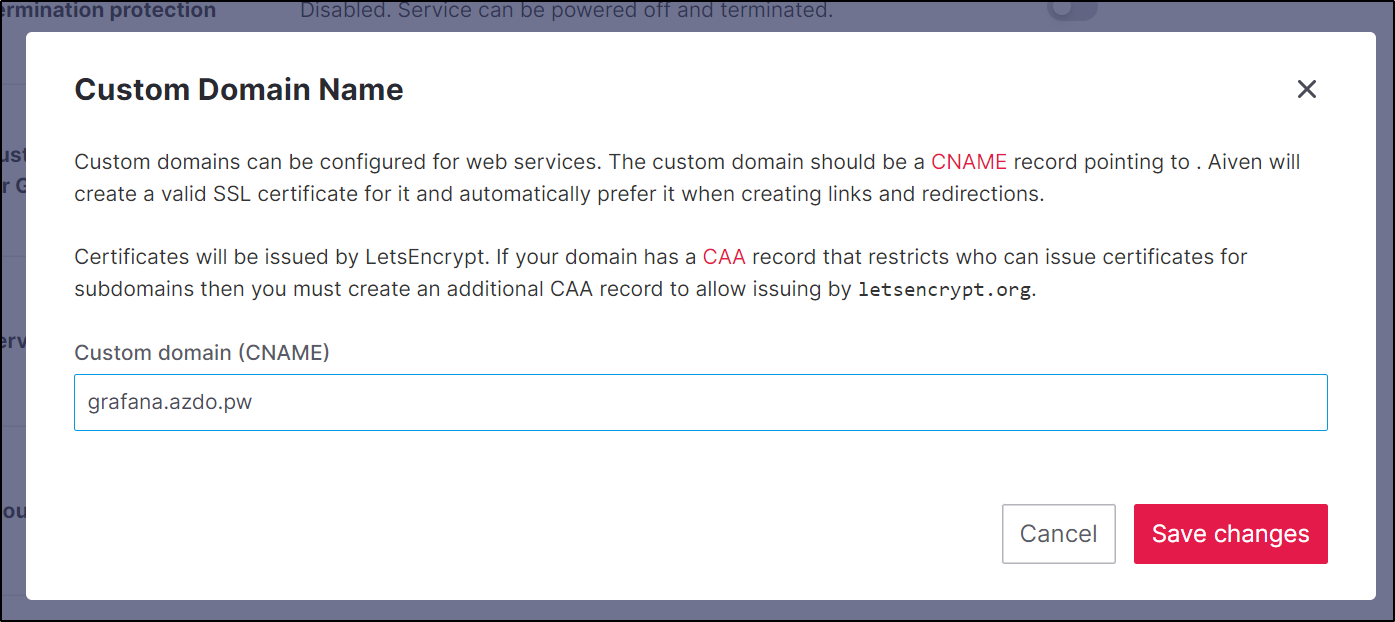
Hmm.. that domain has issues; let’s use our primary
I’ll create a CNAME record
$ cat r53-aiven-grafana.json
{
  "Comment": "CREATE awx fb.s CNAME record ",
  "Changes": [
    {
      "Action": "CREATE",
      "ResourceRecordSet": {
        "Name": "grafana.freshbrewed.science",
        "Type": "CNAME",
        "TTL": 300,
        "ResourceRecords": [
          {
            "Value": "grafana-3e22cc9-isaac-1040.aivencloud.com"
          }
        ]
      }
    }
  ]
}

$ aws route53 change-resource-record-sets --hosted-zone-id Z39E8QFU0F9PZP --change-batch file://r53-aiven-grafana.json
{
    "ChangeInfo": {
        "Id": "/change/C06282161TELBVGW1ZHNQ",
        "Status": "PENDING",
        "SubmittedAt": "2022-11-24T14:47:15.942Z",
        "Comment": "CREATE awx fb.s CNAME record "
    }
}
Then apply it in Aiven.io
In a bit, we’ll see it has a proper cert and responds
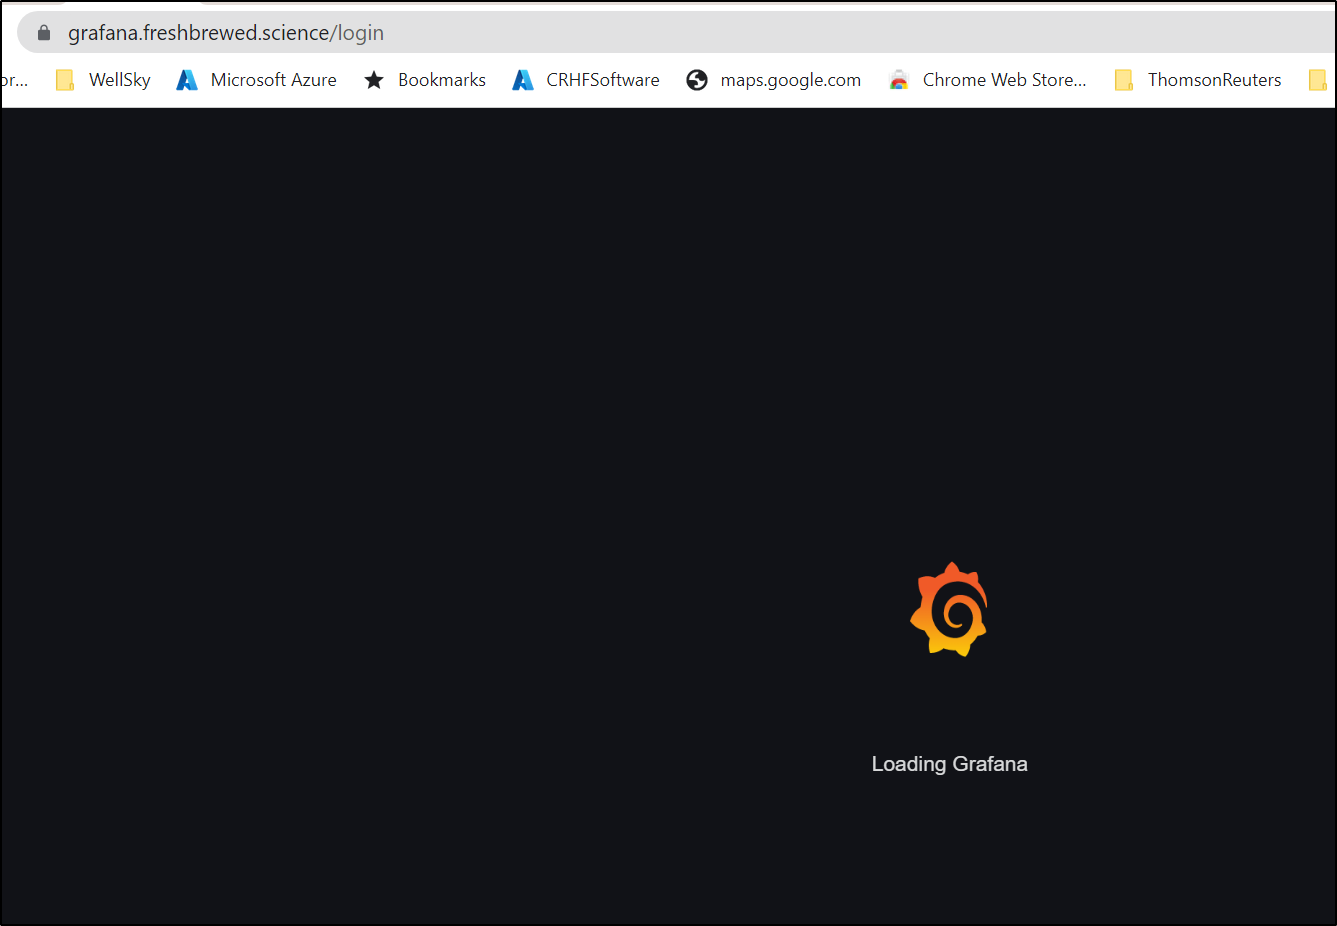
Then we can log in
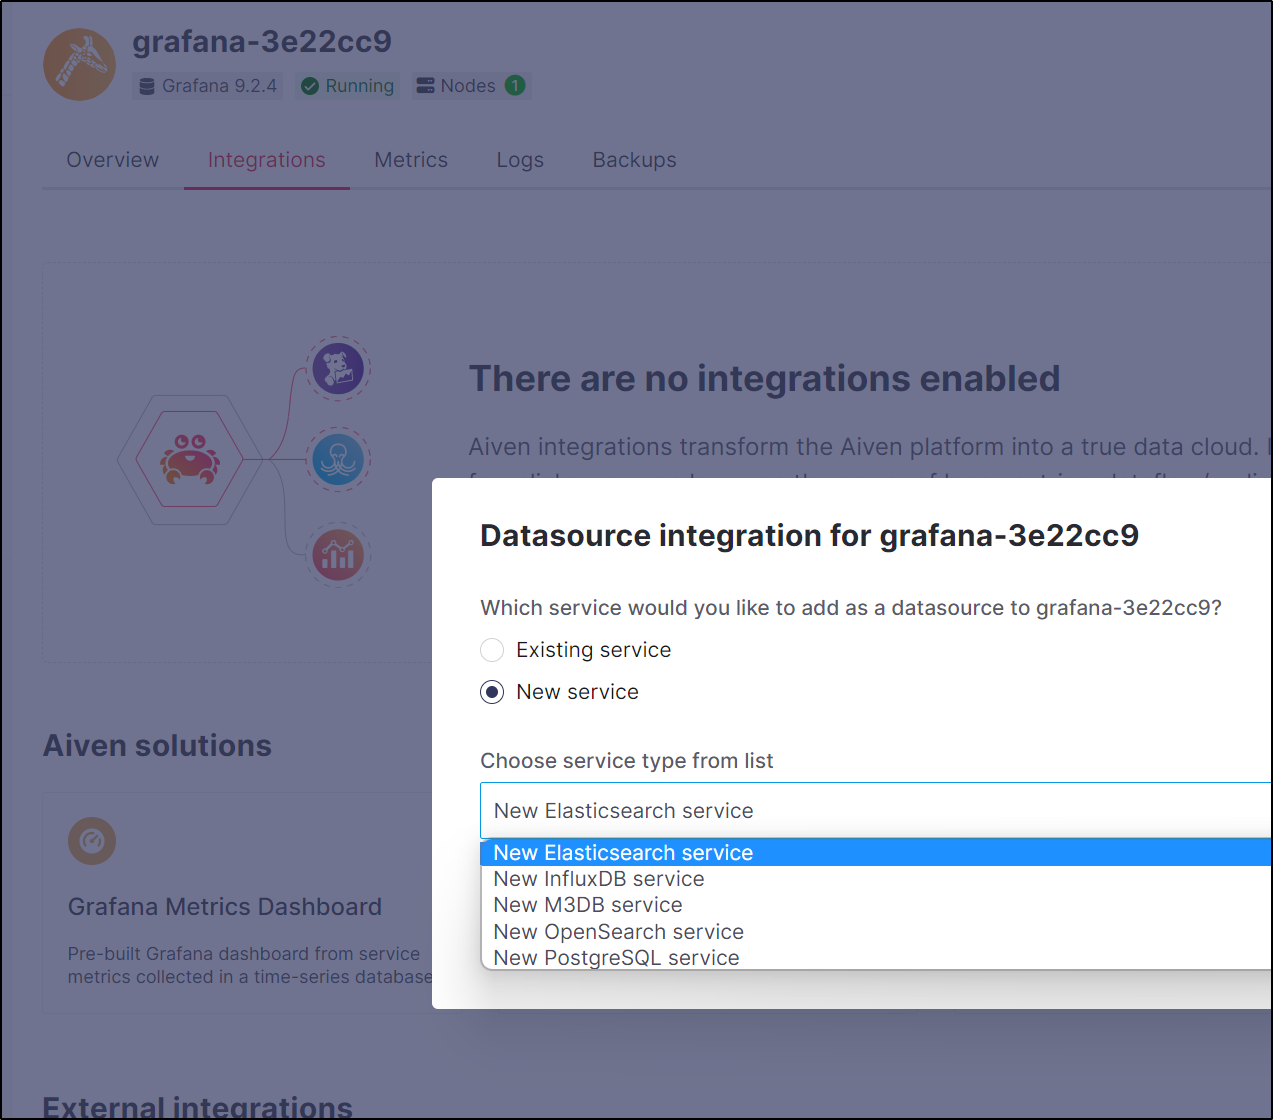
Adding Data Sources
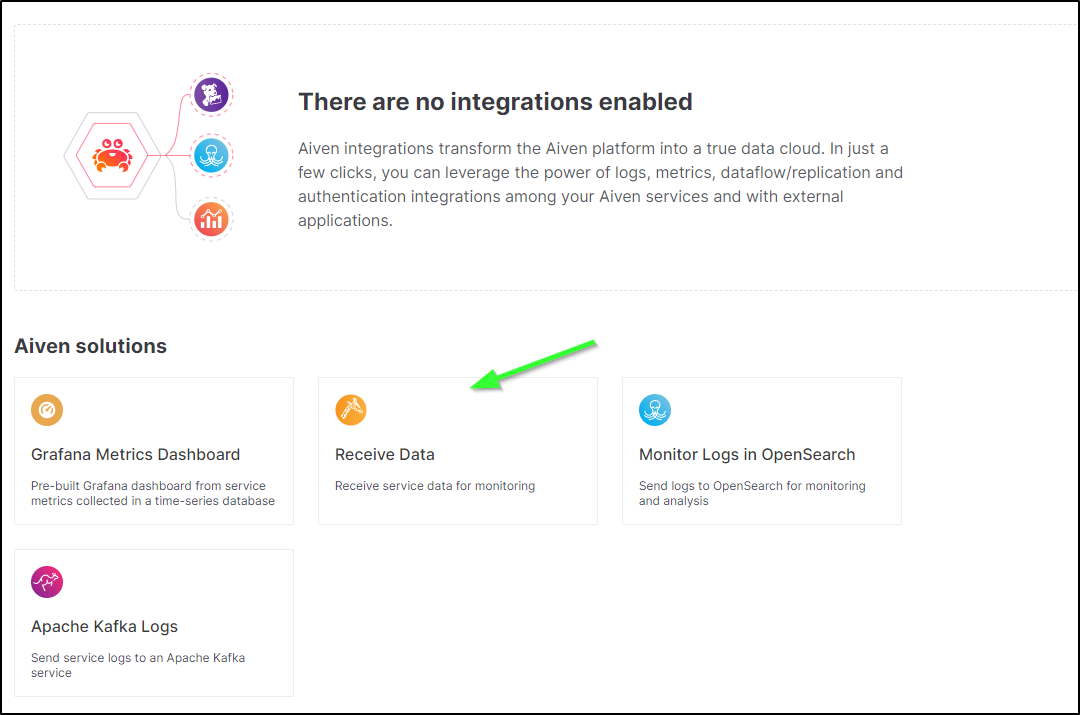
Before we can graph anything, we need to add a data source
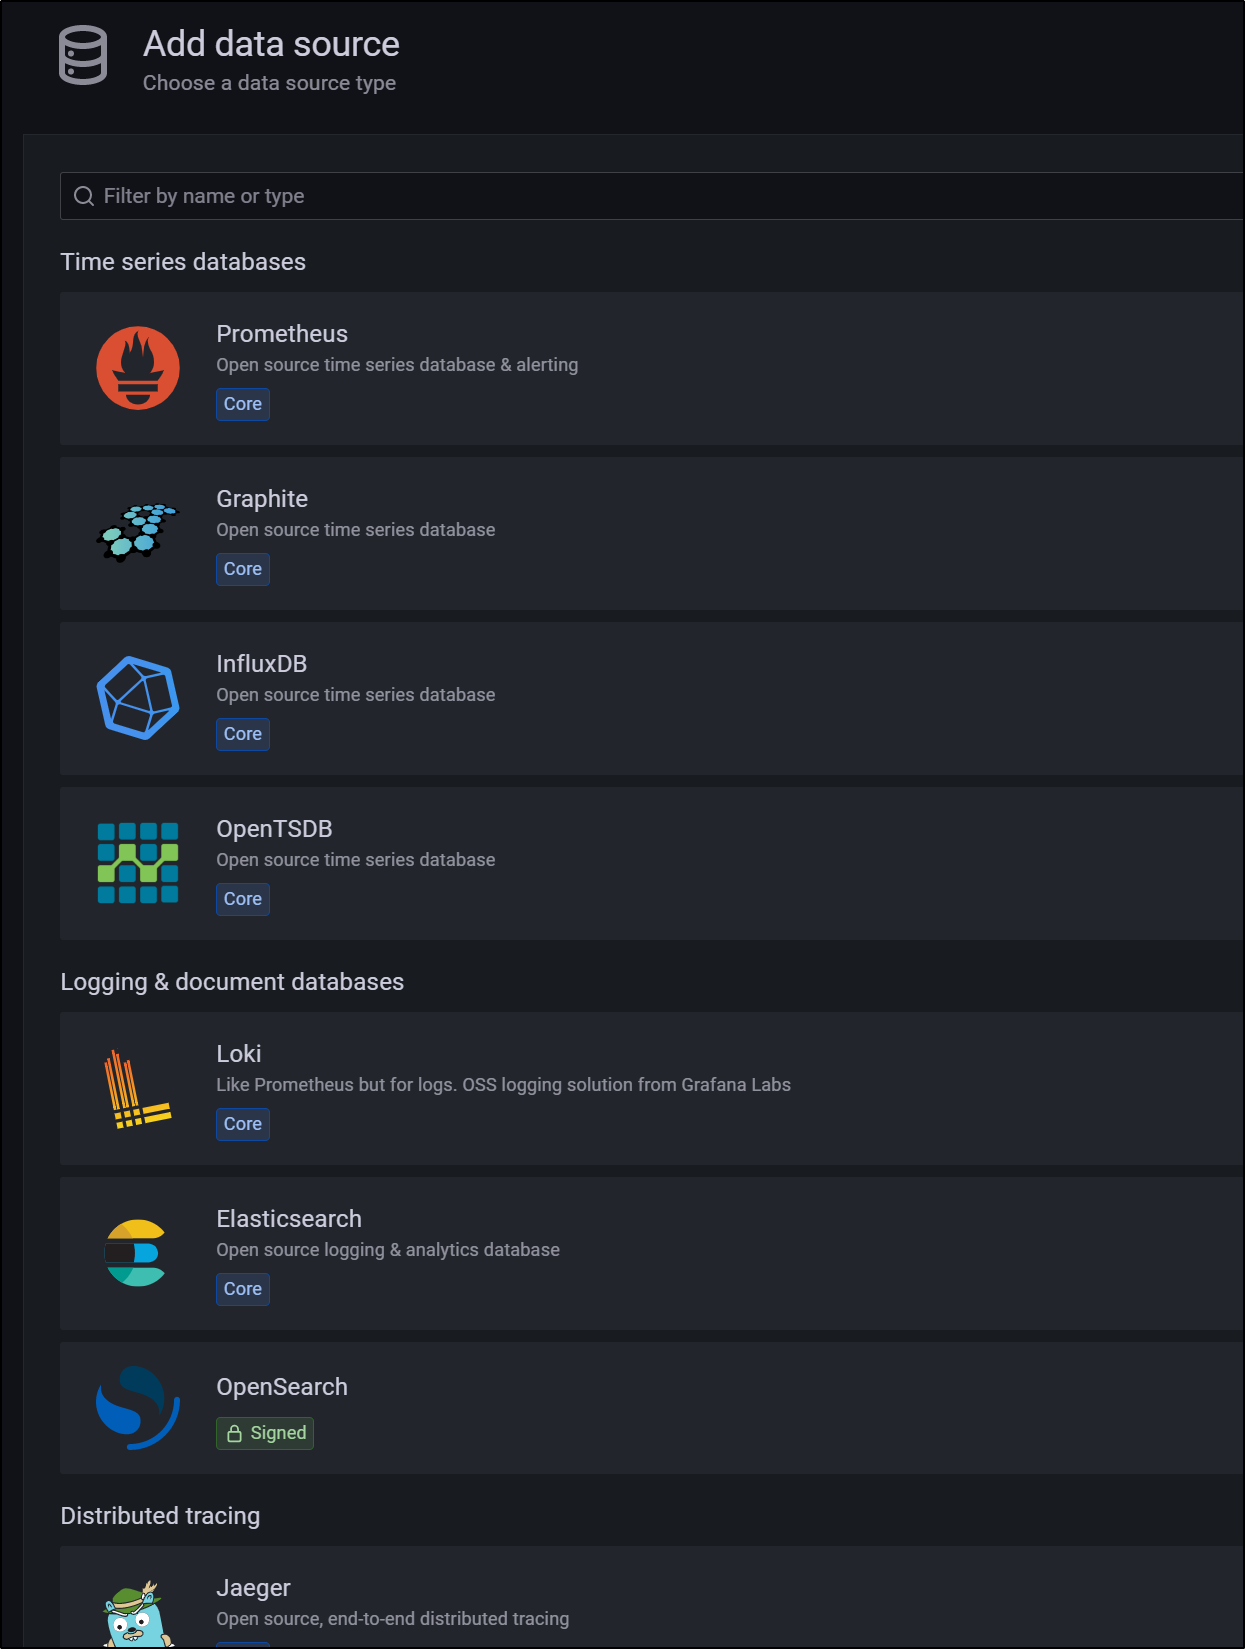
Besides setting it up in Grafana, we can setup Data sources from Aiven via the Integrations section
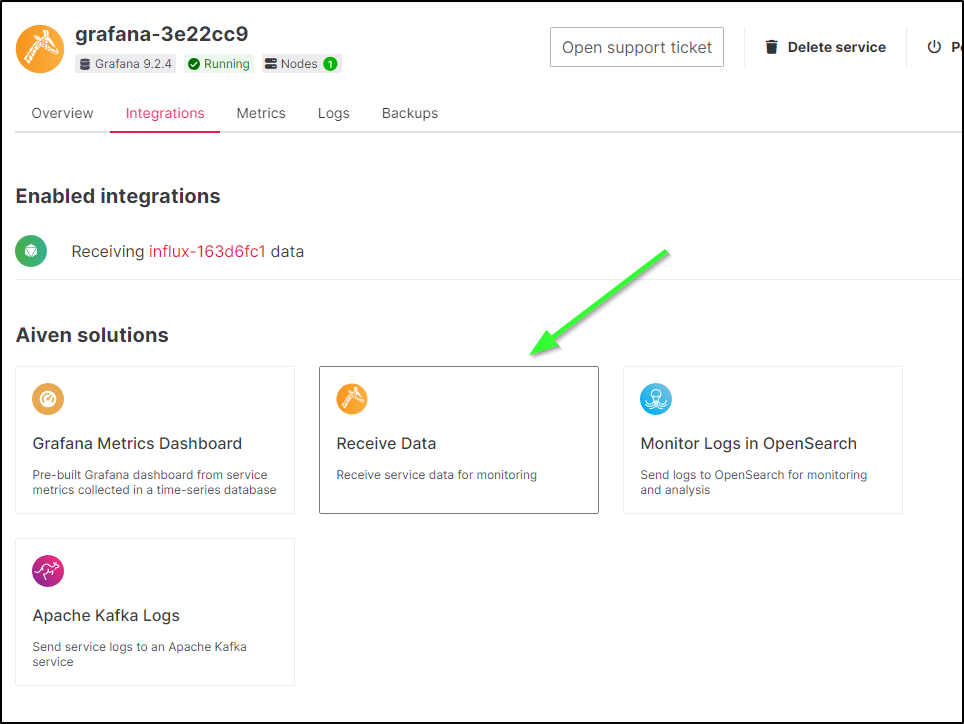
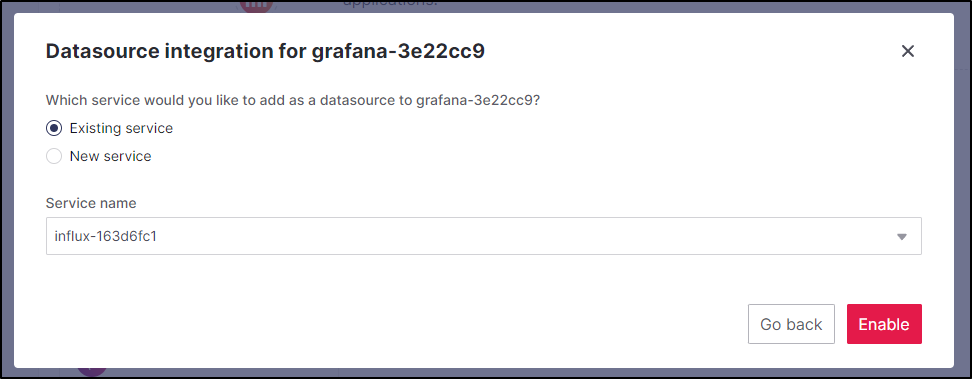
With InfluxDB now running, let’s add it to Kafka Metrics
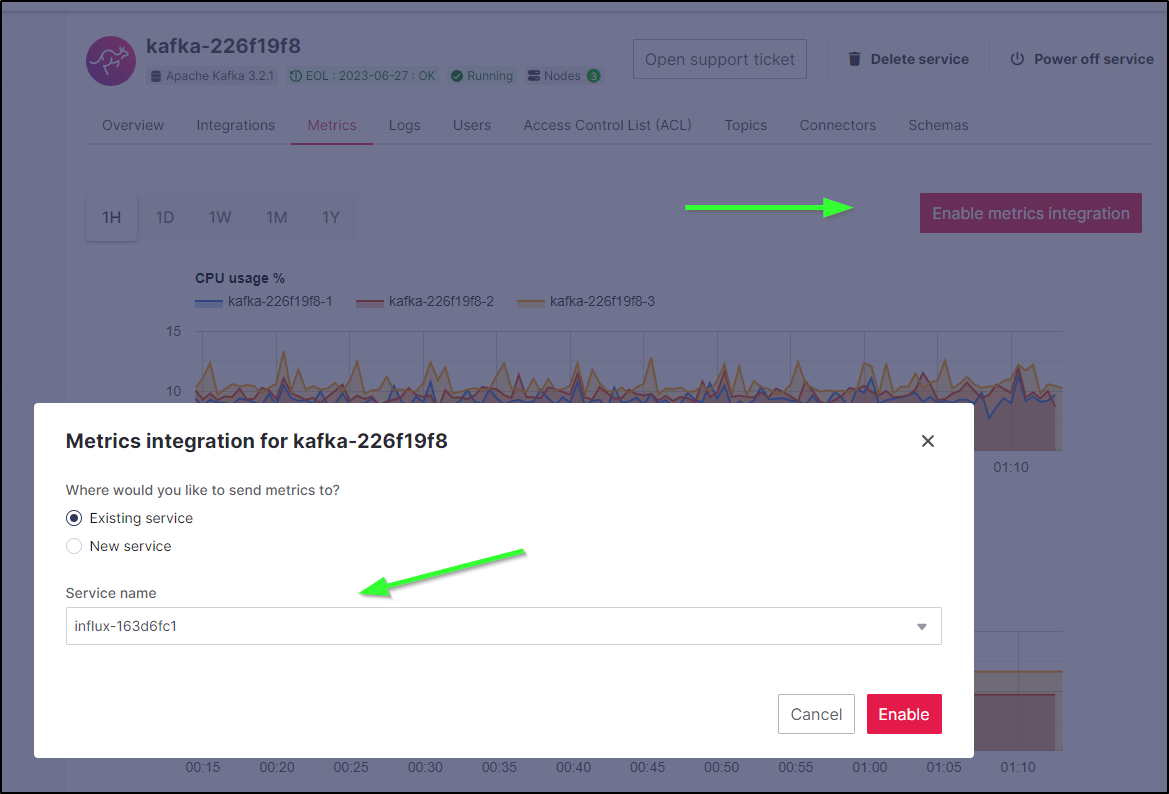
In Grafana, we’ll then add a new Integration
We’ll want to “Receive Data”
At which point we can choose the InfluxDB
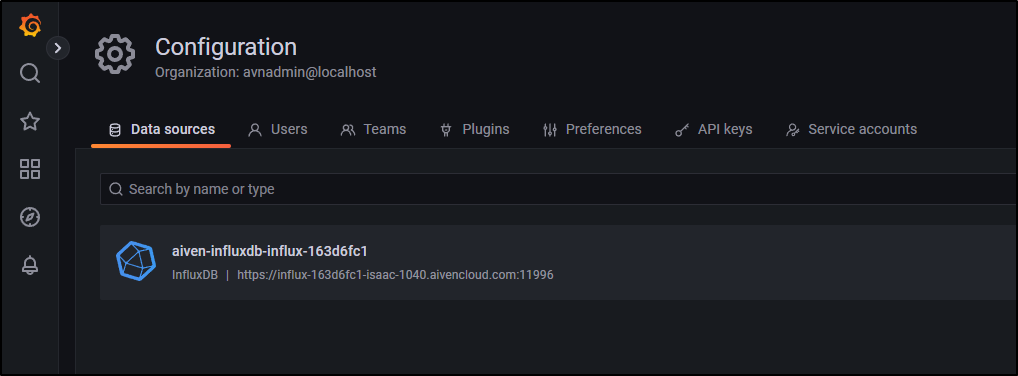
Within Grafana we now see InfluxDB listed in Data Sources
To use it, we can use Influx QL
e.g.
SELECT * FROM "_internal".."database" LIMIT 10
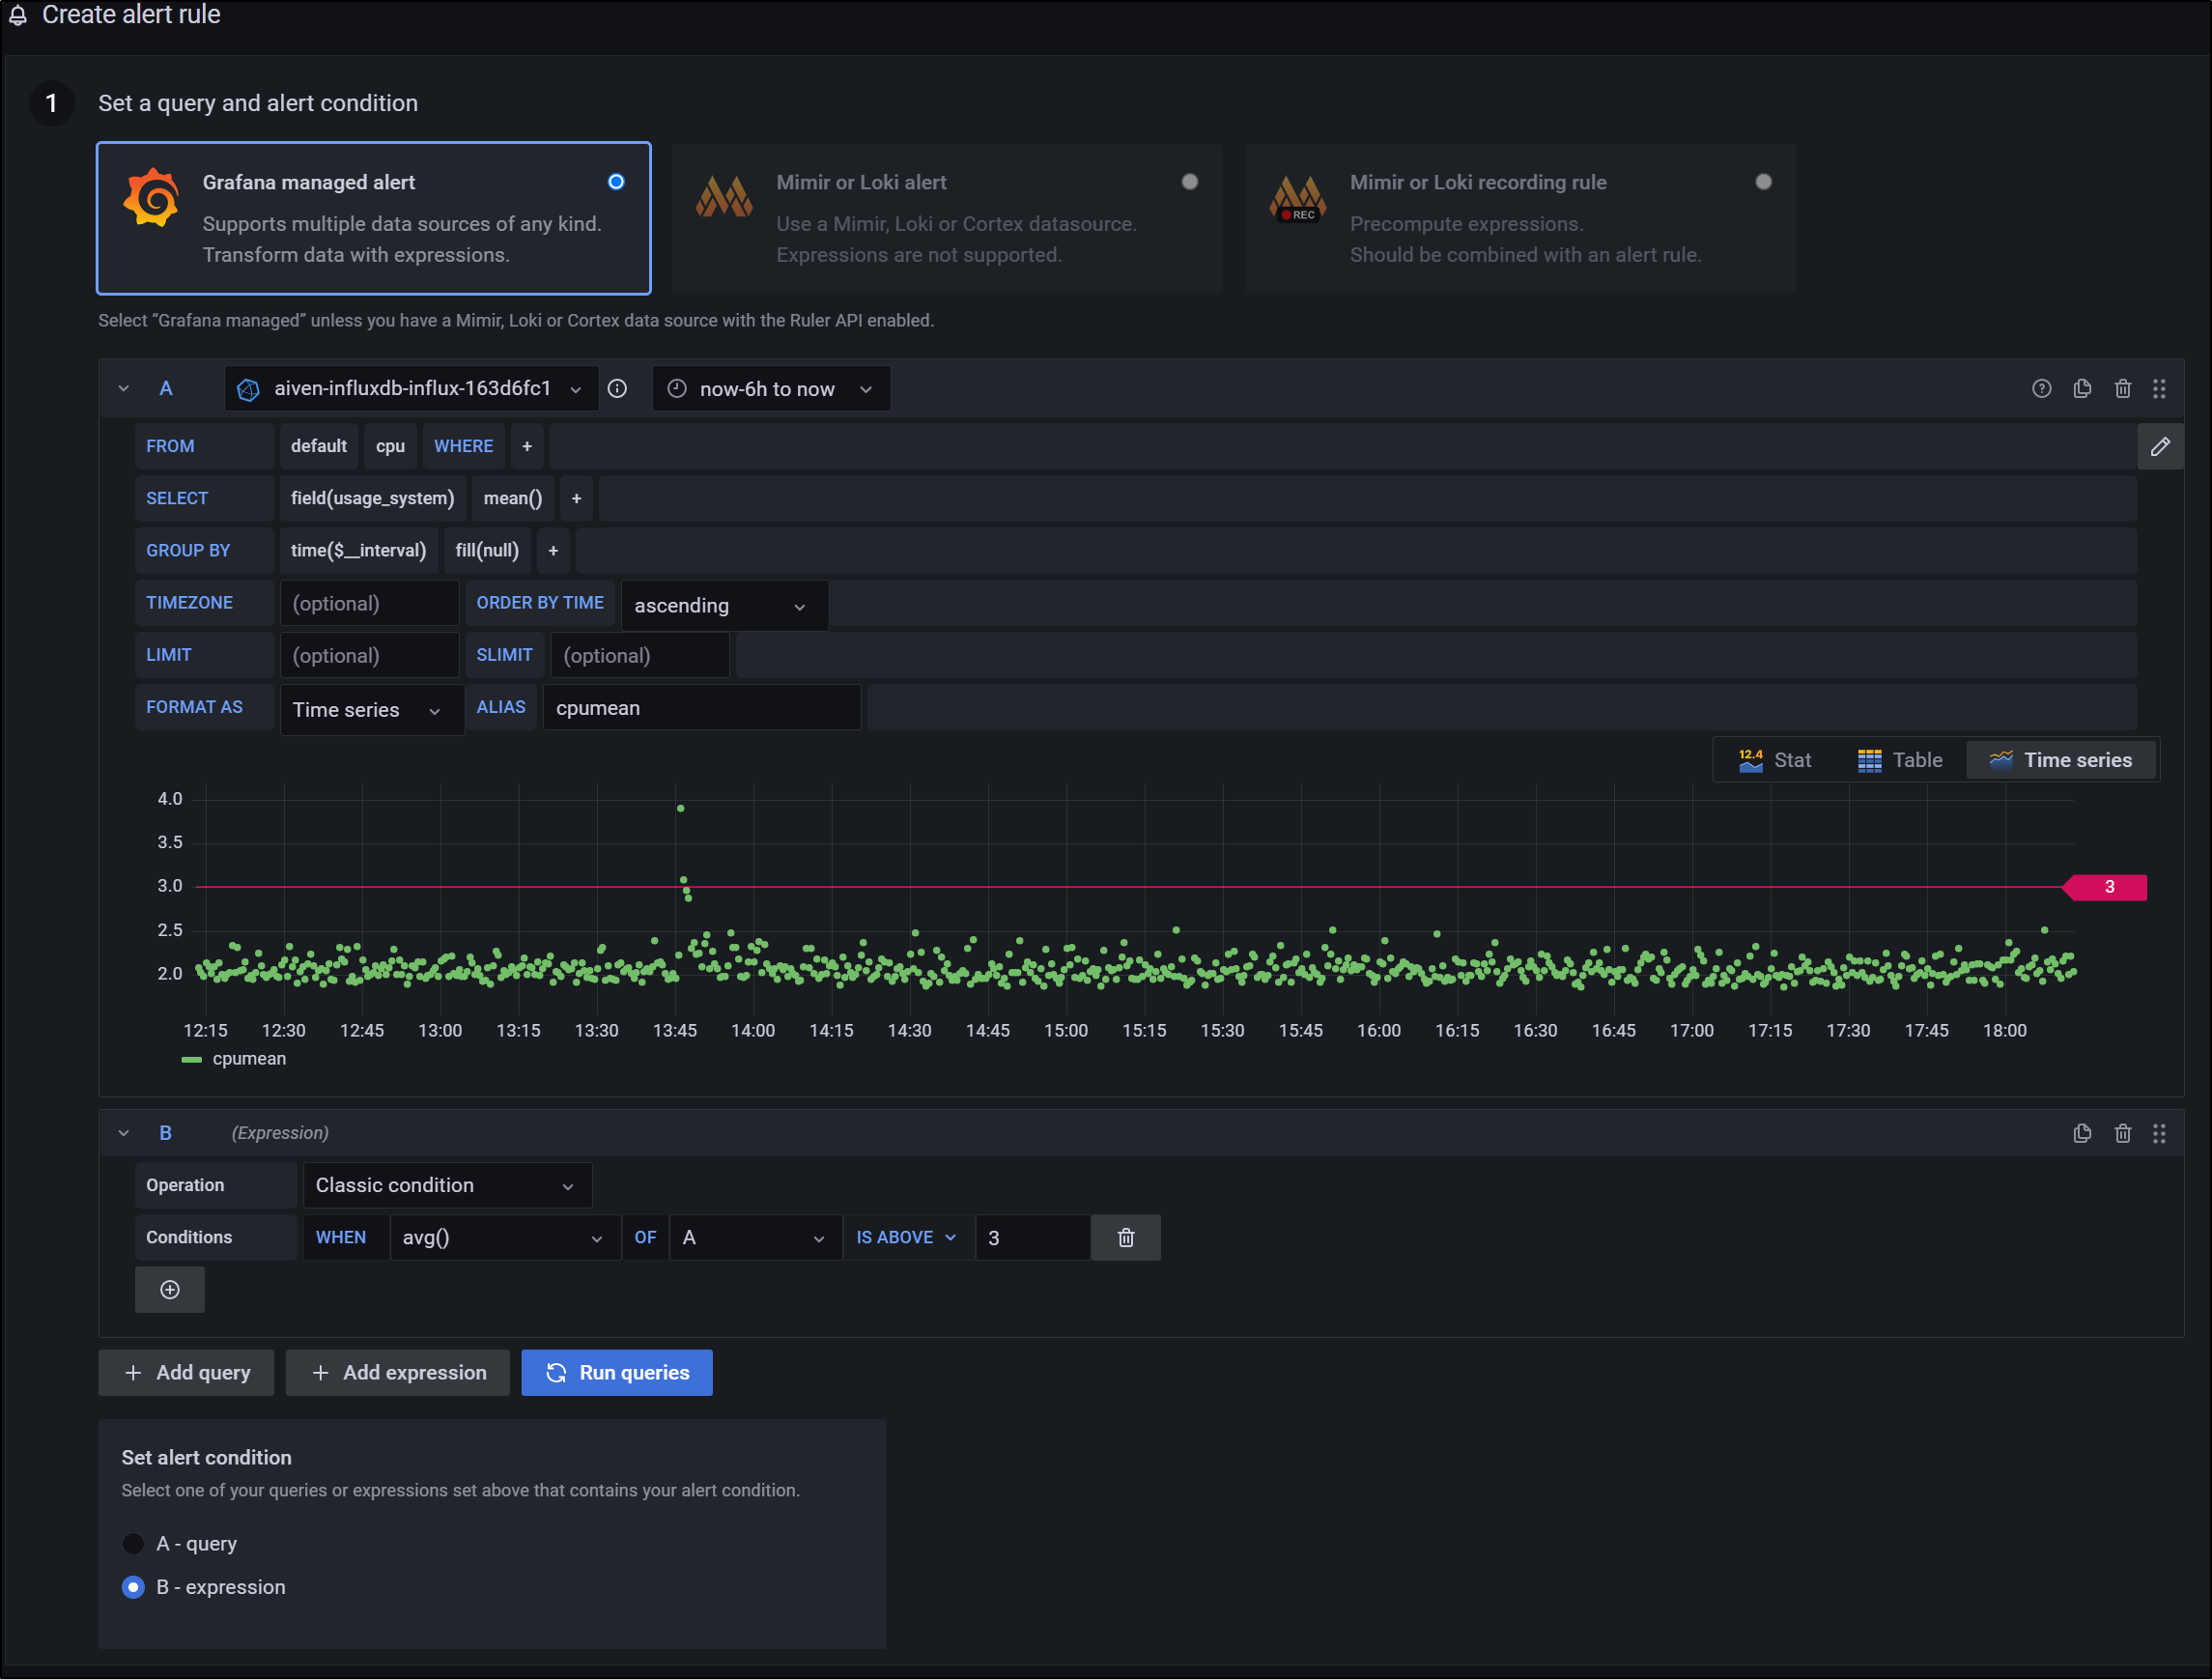
Or us the Explore query creator. For instance, query the CPU usage
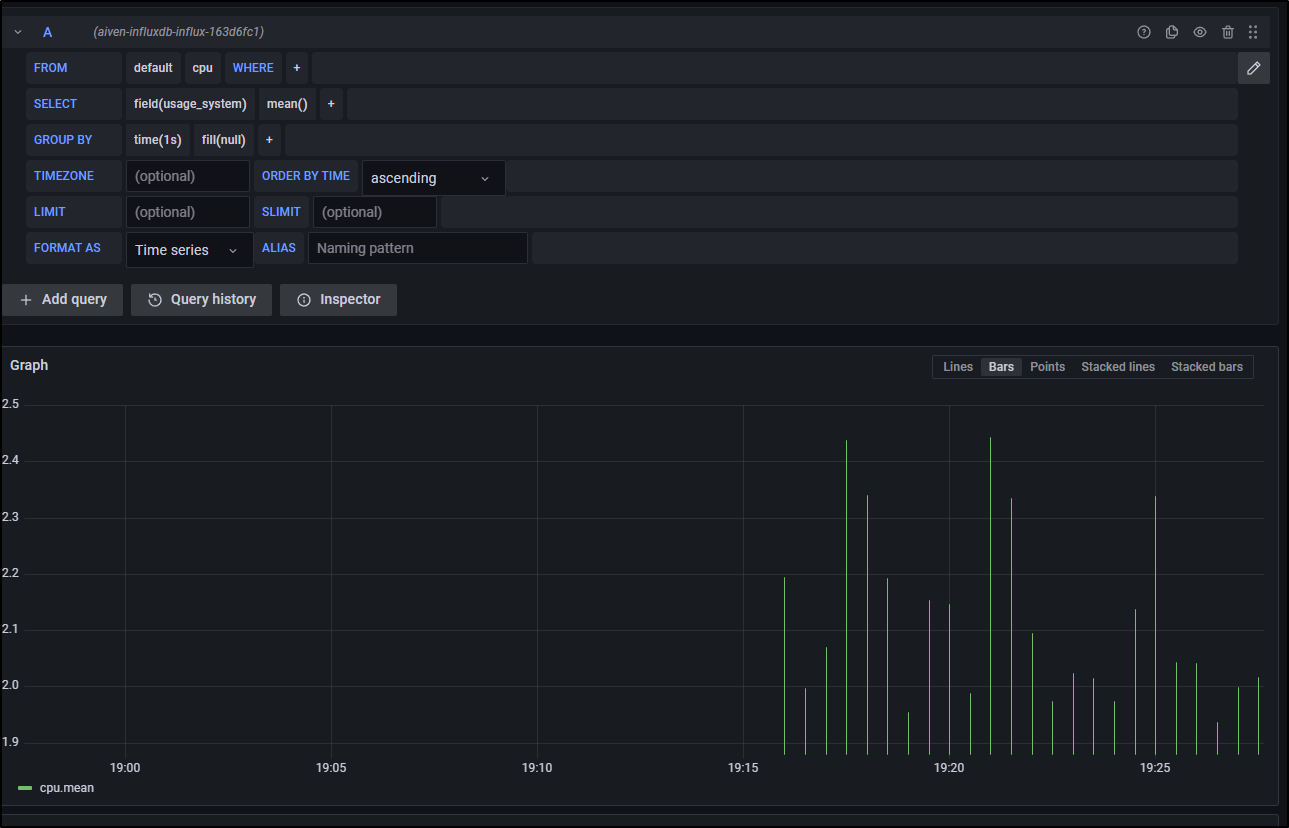
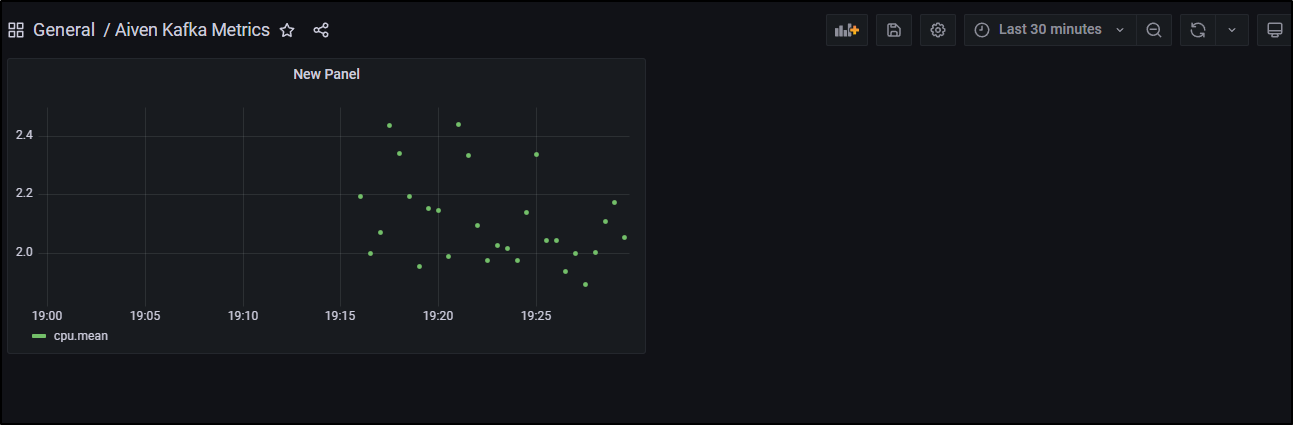
I can then add it to a new Dashboard
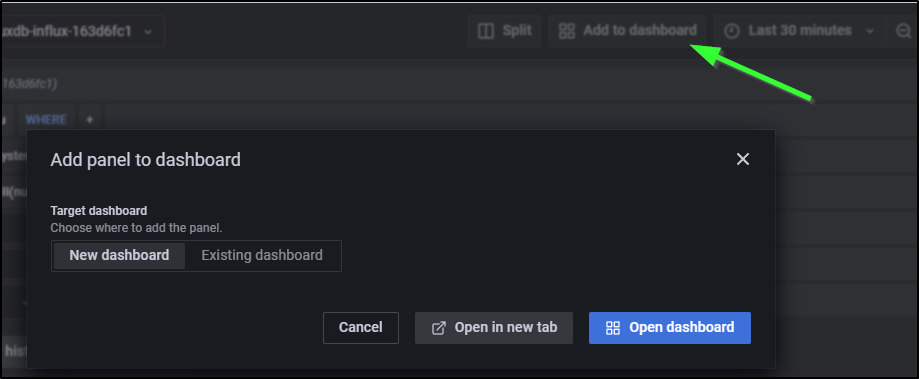
and save it with a name
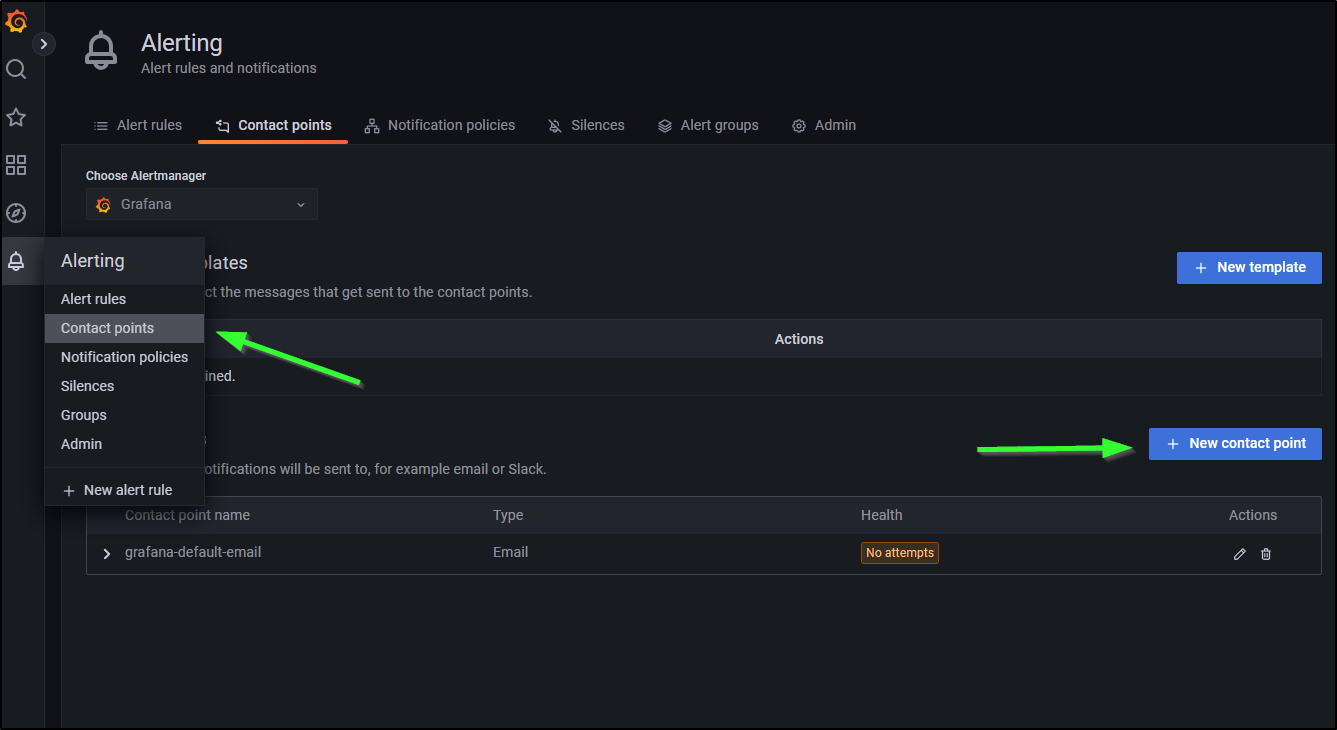
Alerting with Grafana
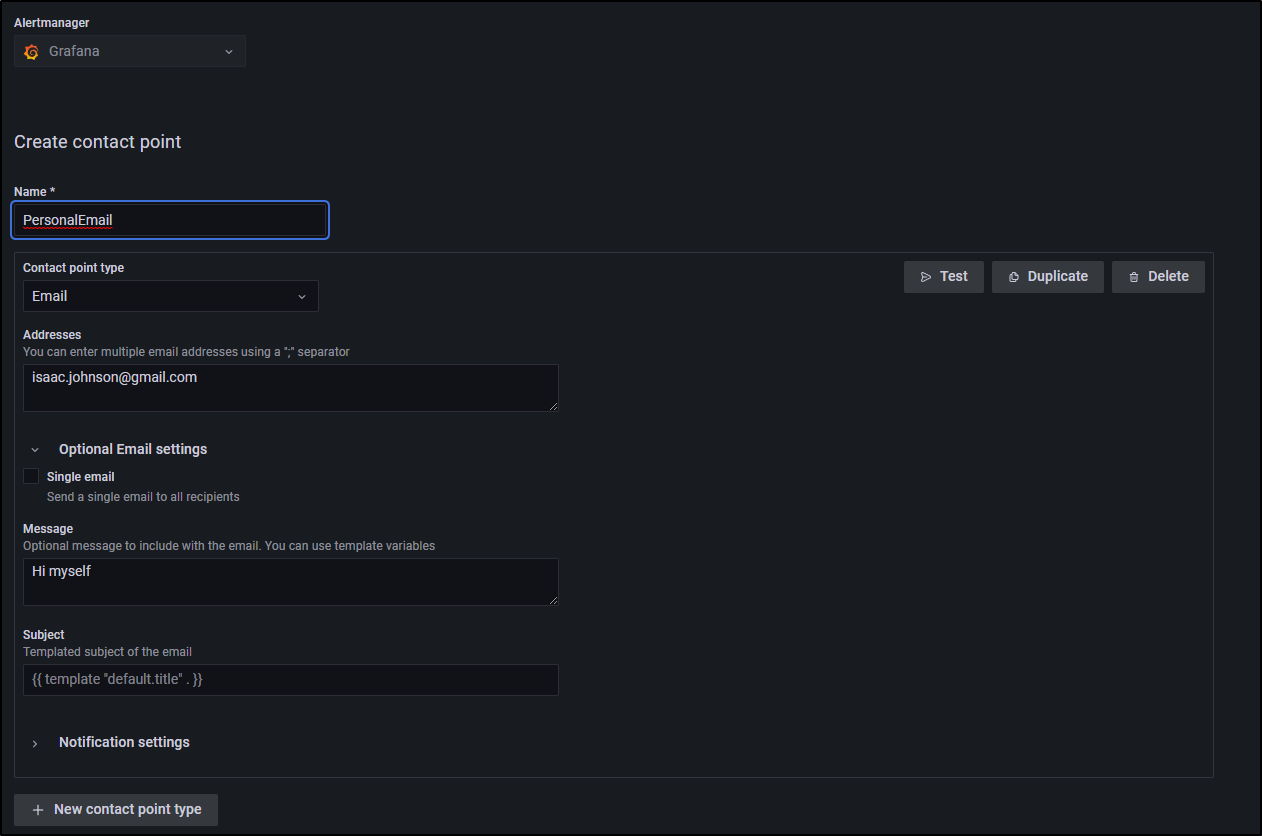
To send any kind of alert, we first need to define a “contact point”
We can get there from Alerting/Contact Points, then selecting “New contact point”
We can, for instance, define an email address to which we will send alerts.
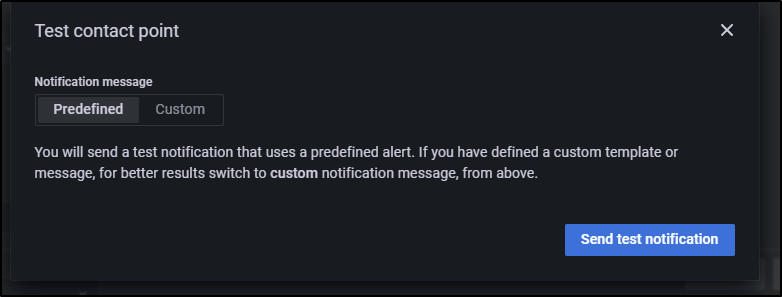
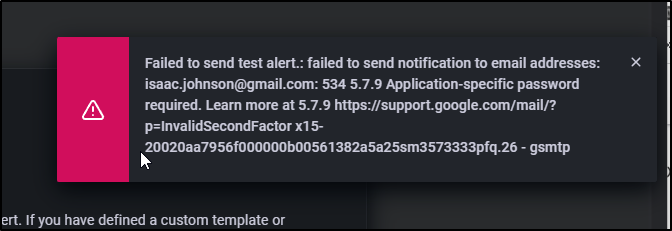
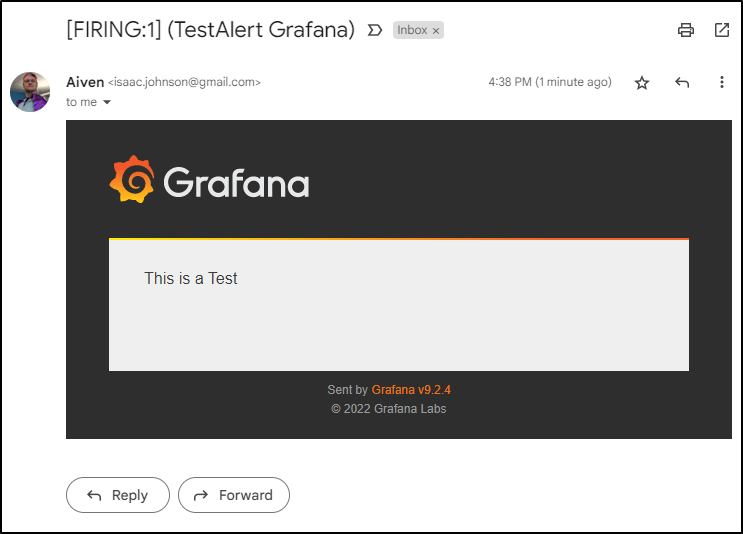
We can send a test mail
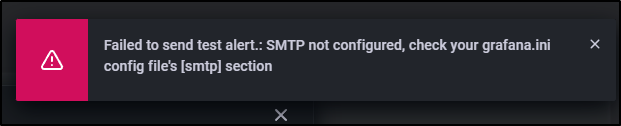
However, this just informed me SMTP was not setup out of the box
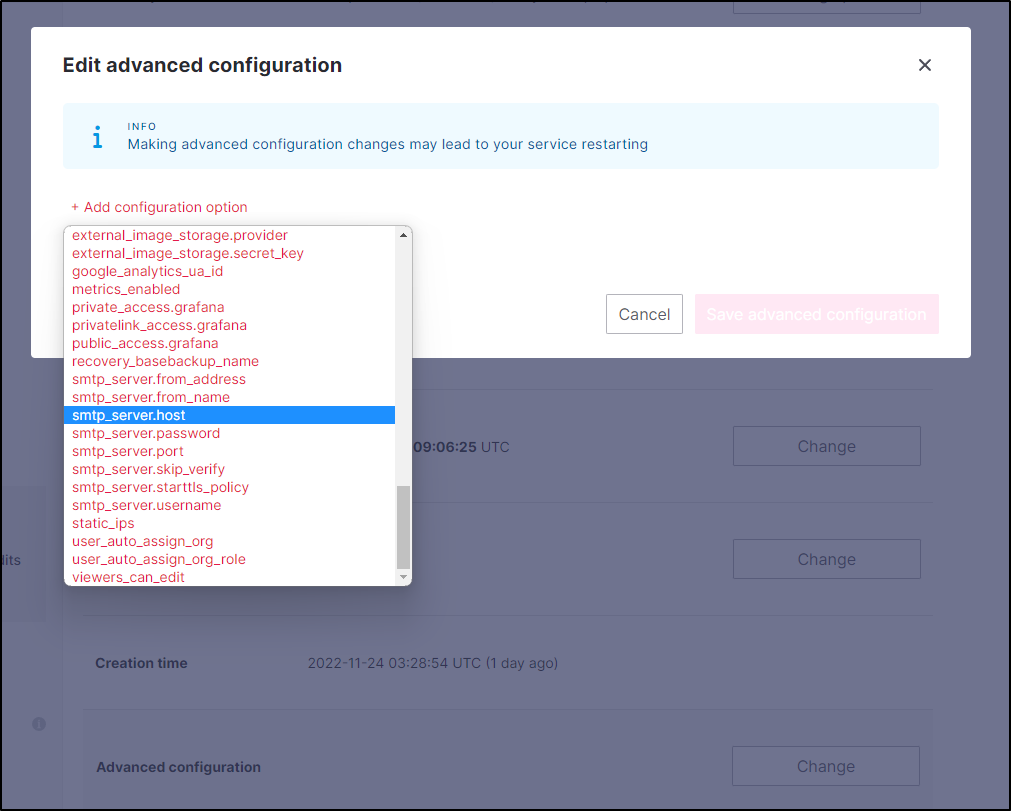
In an on-prem install, we would likely change the .ini file used by Grafana to set the [SMTP] section.
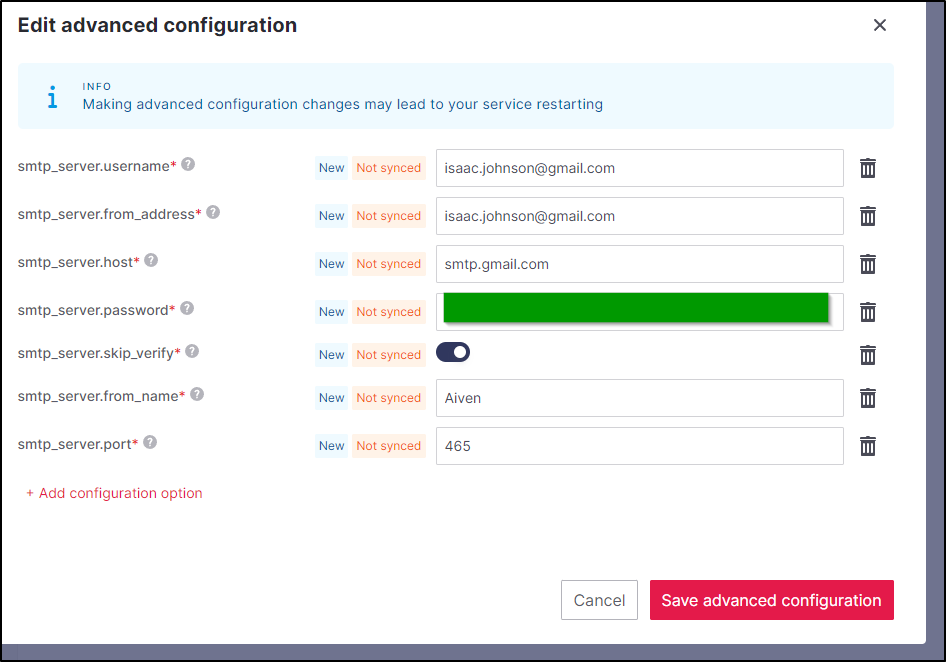
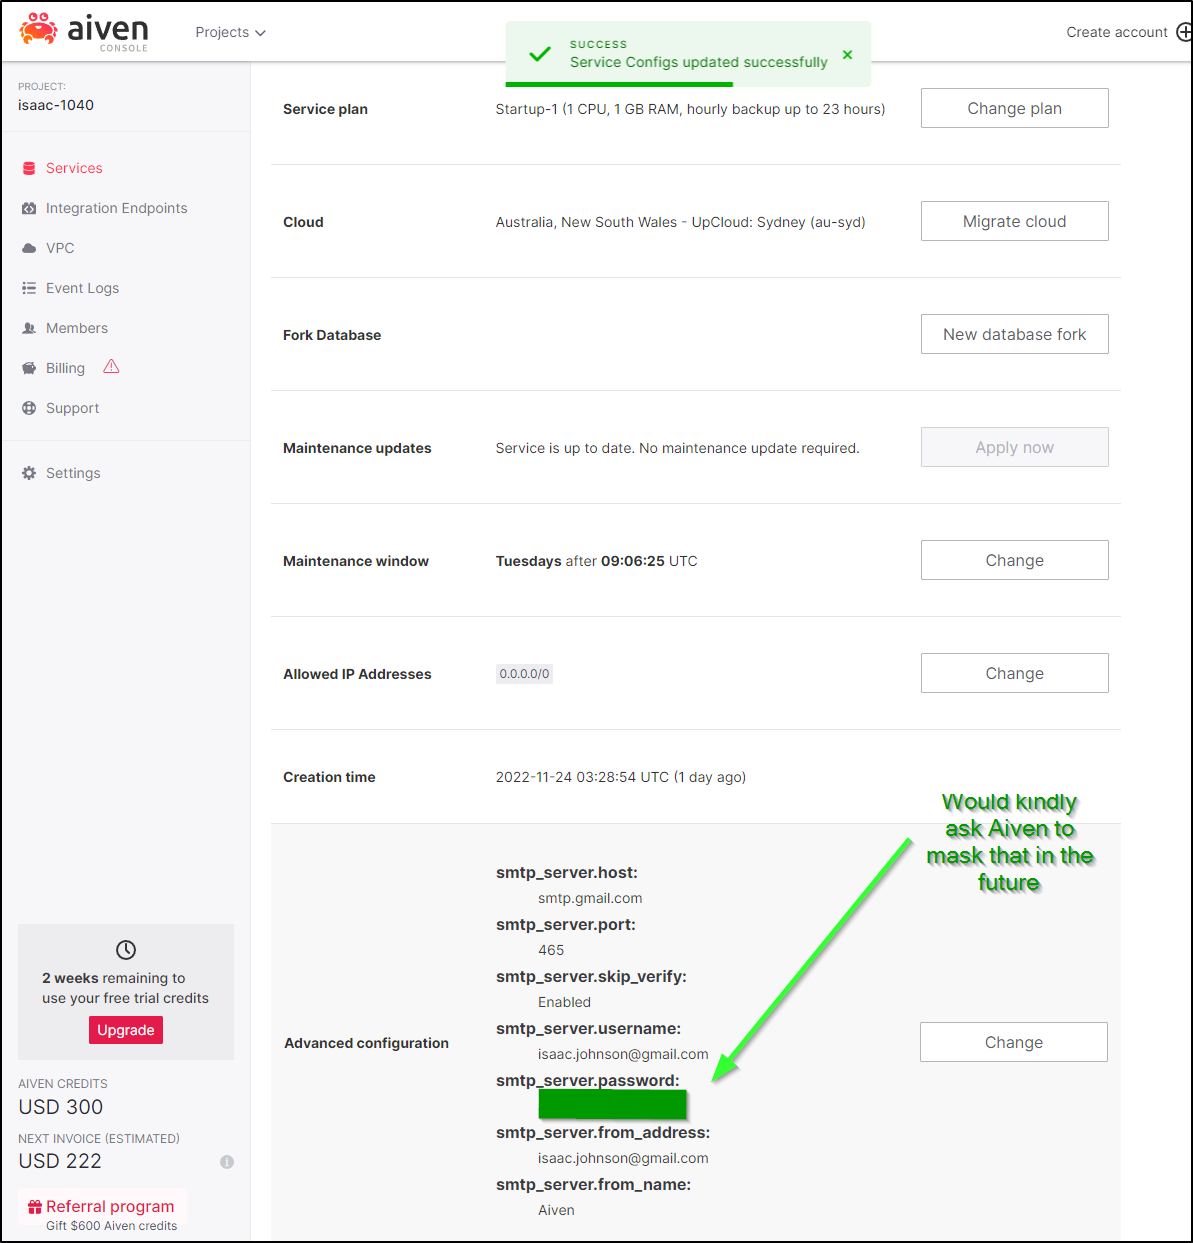
For Aiven.io, we will do it in the Advanced Configuration area
I’ll set the settings for GMAIL
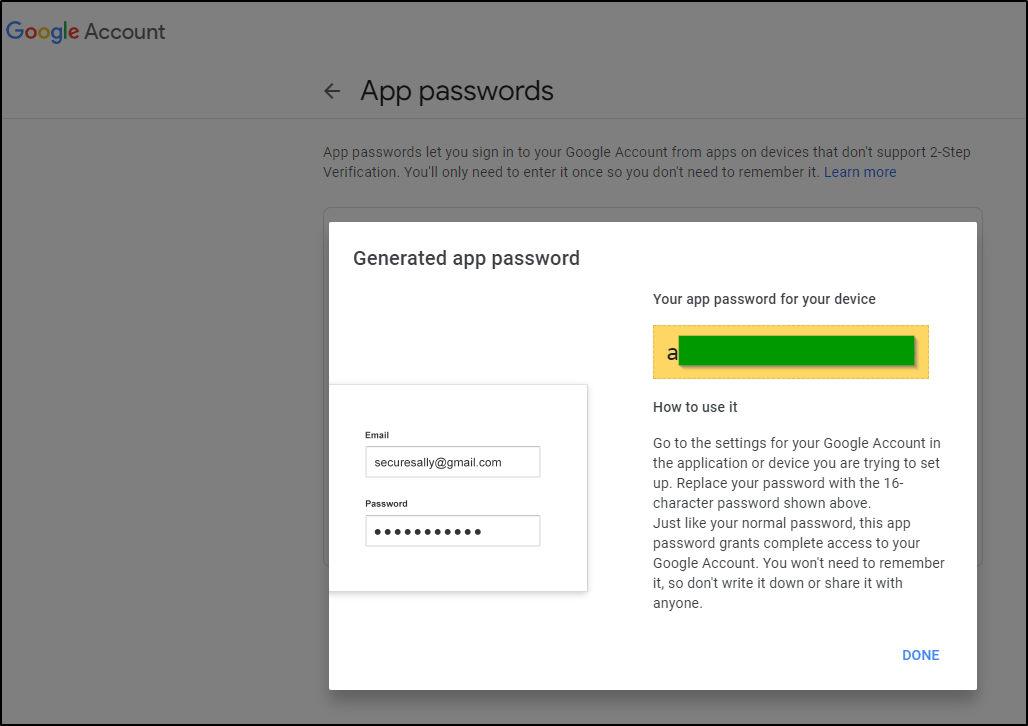
I found using a real 2FA password won’t work.
You need to follow these steps to generate an “App” password we can use for STMP
which I can now see in the list (and revoke later)
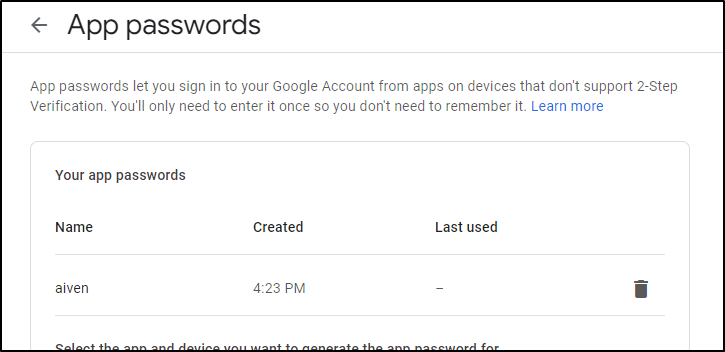
Which brings me to a minor issue I have with Aiven - I don’t like seeing my passwords left visible plain text
and we can see it worked
Creating Grafana alerts
Before we being, we’ll create a folder

Then we can create a query
we can set the evaluation behavior
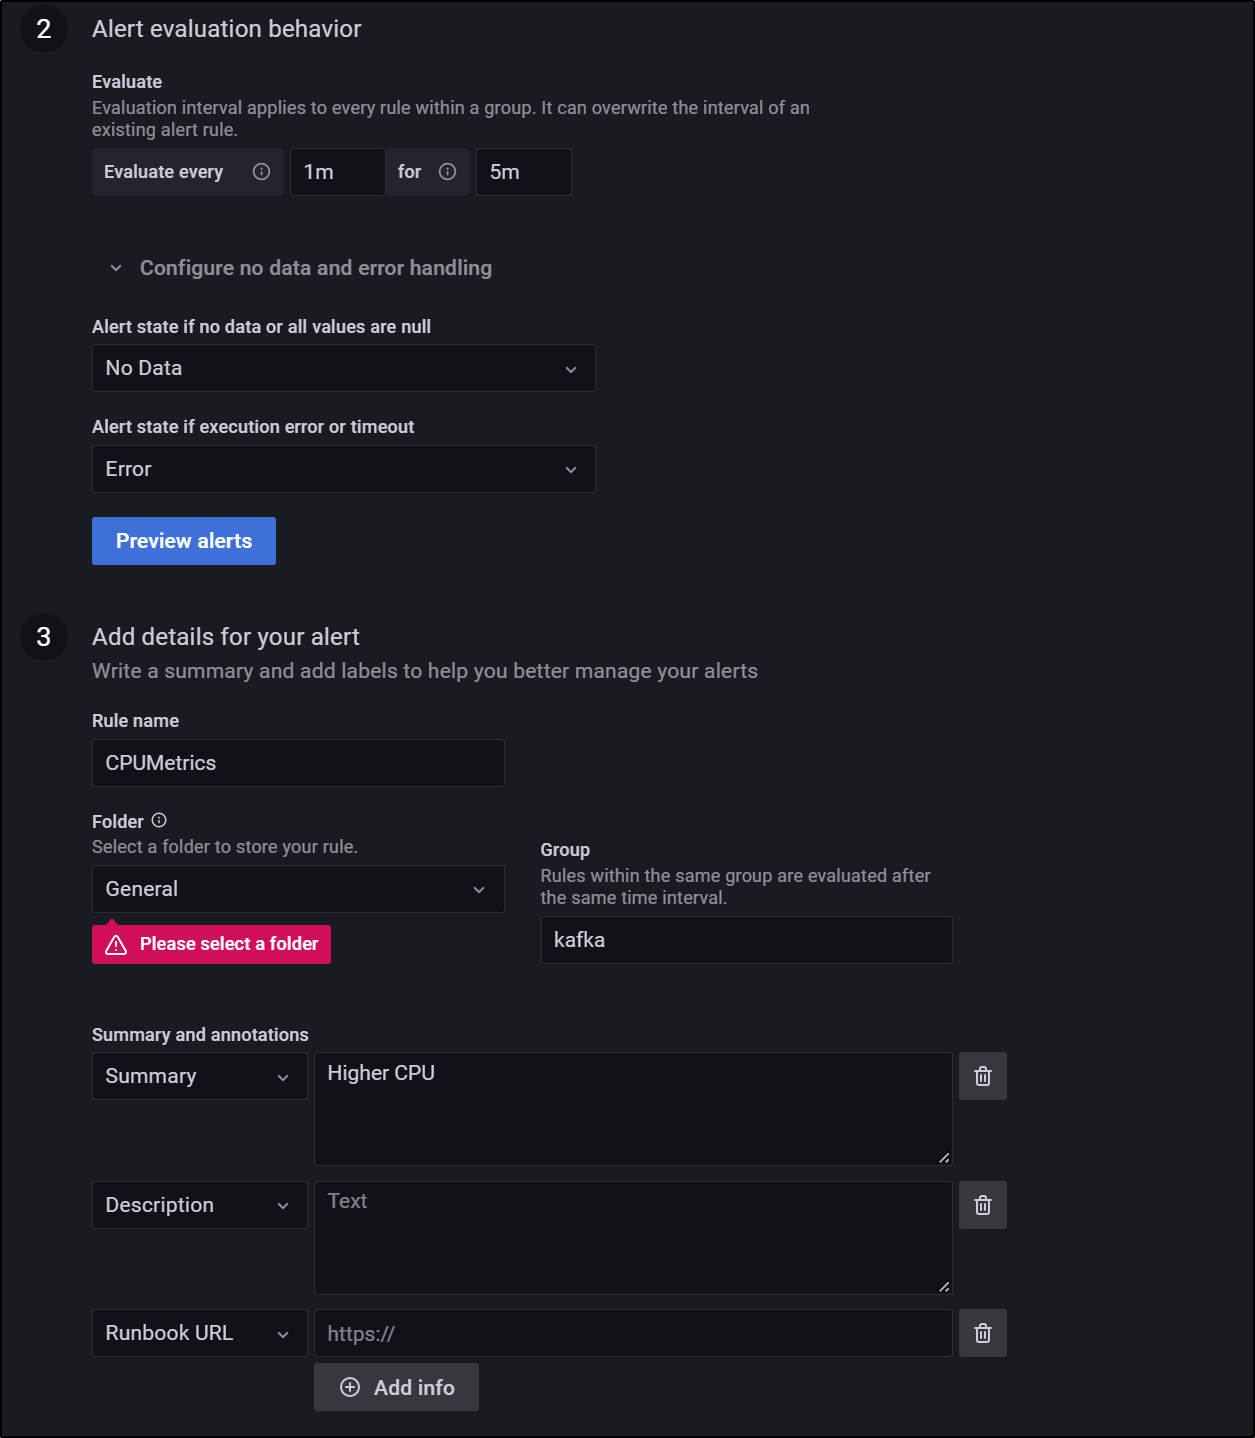
then set our notification label
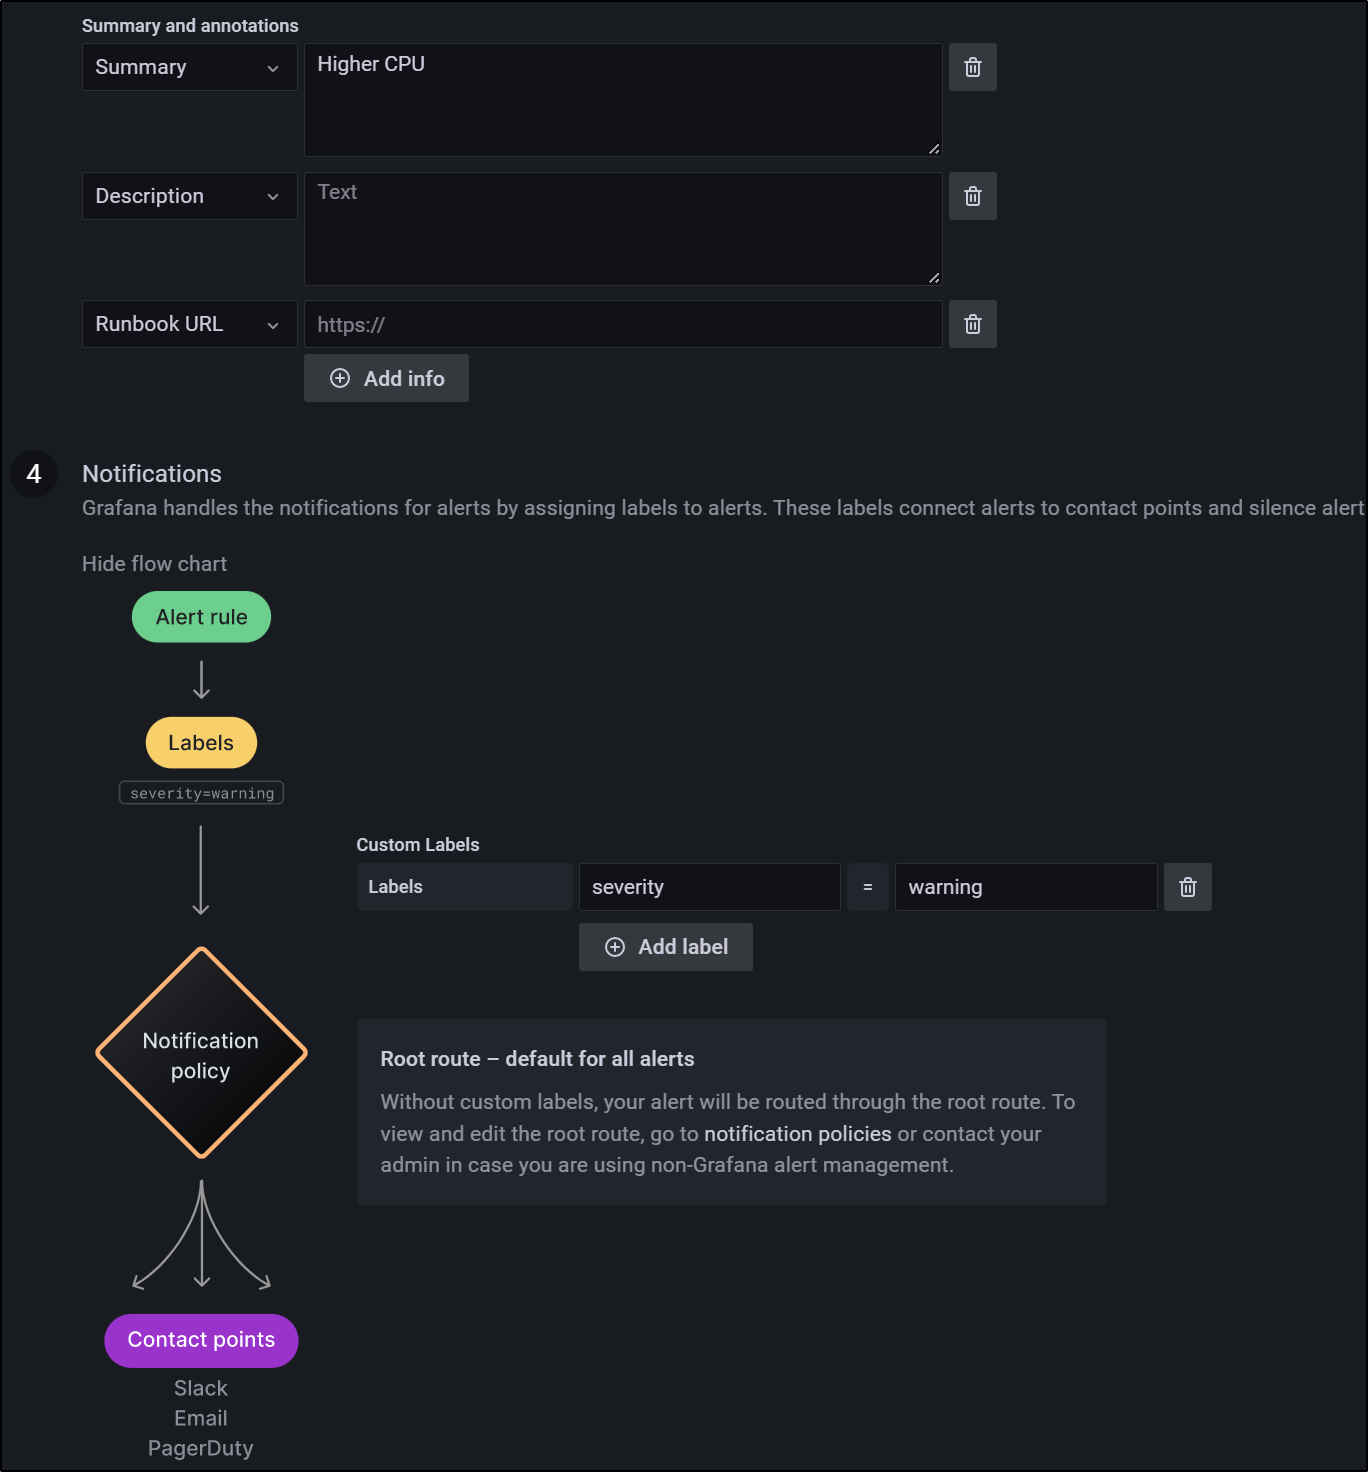
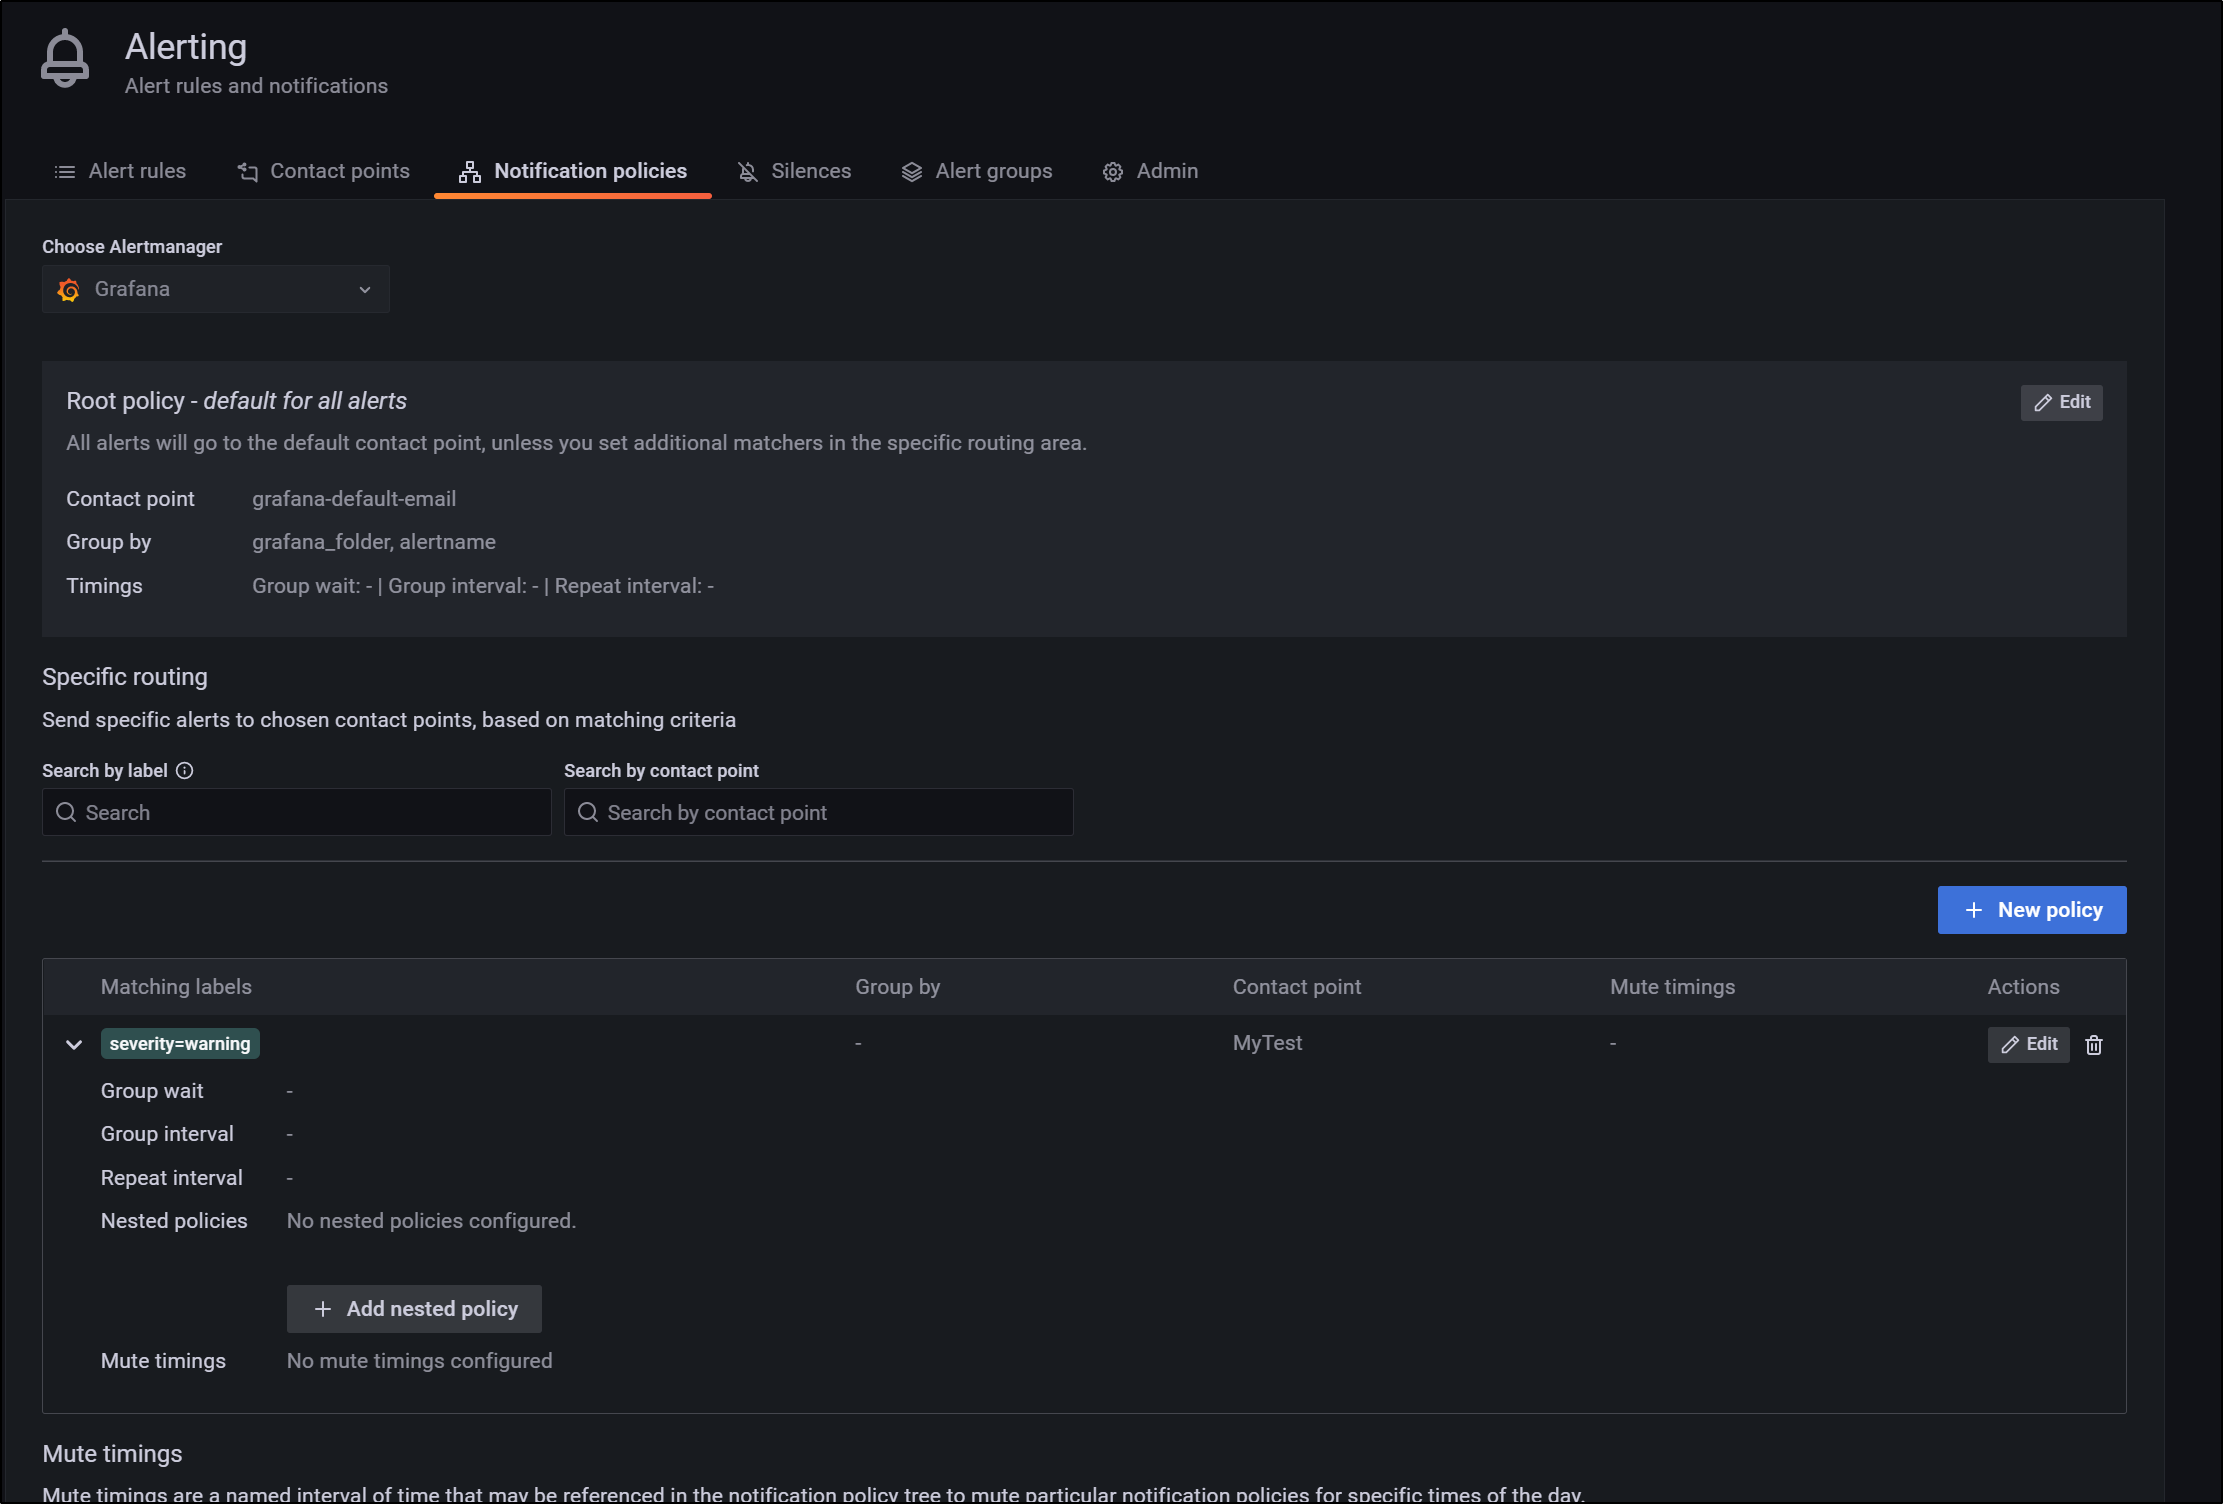
We can now create a Notification Policy that uses it
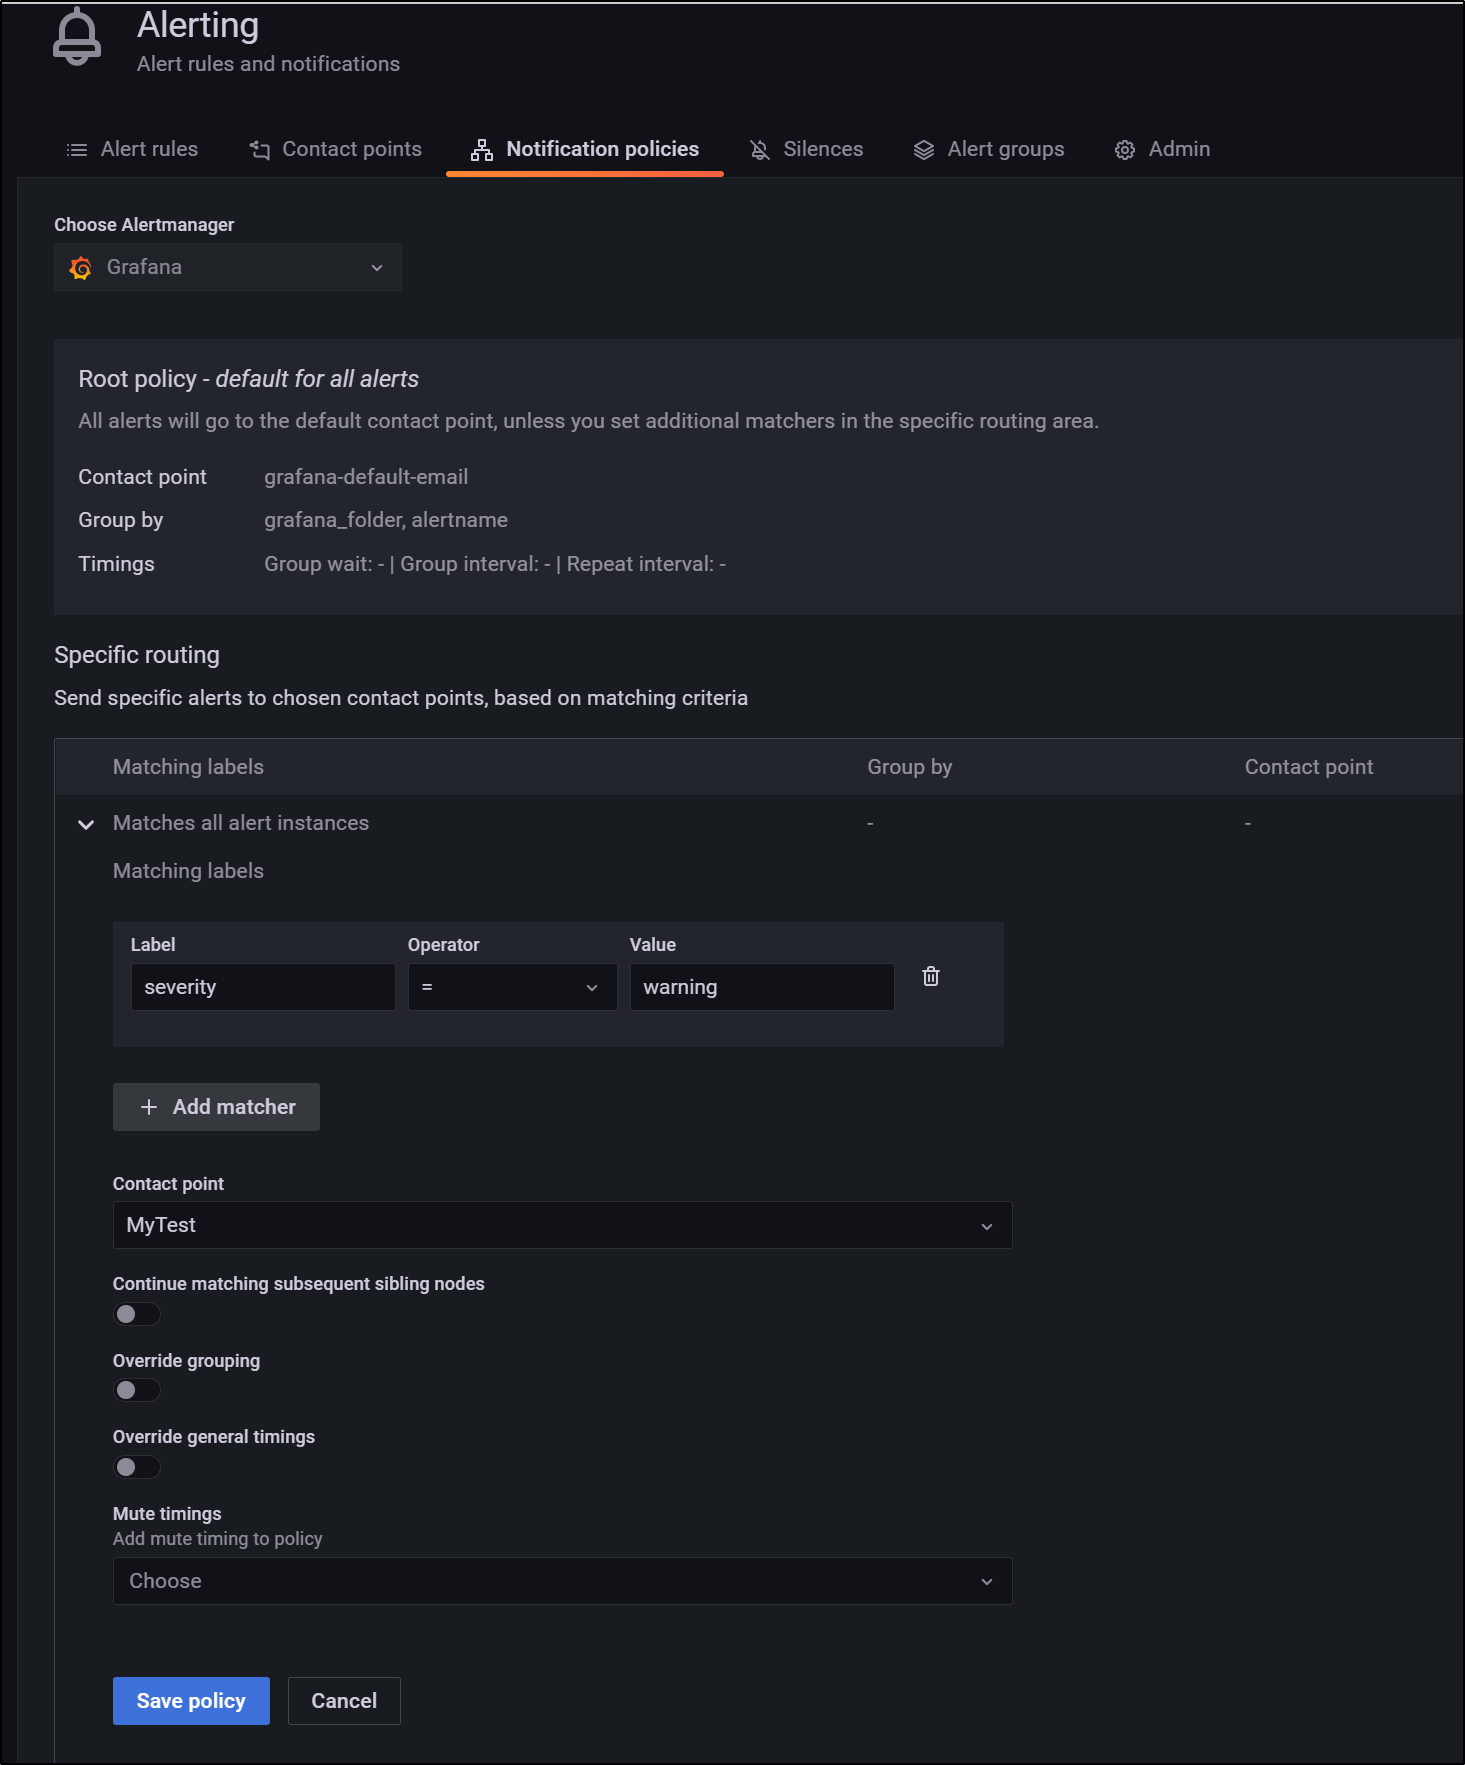
and now we can see it has been saved
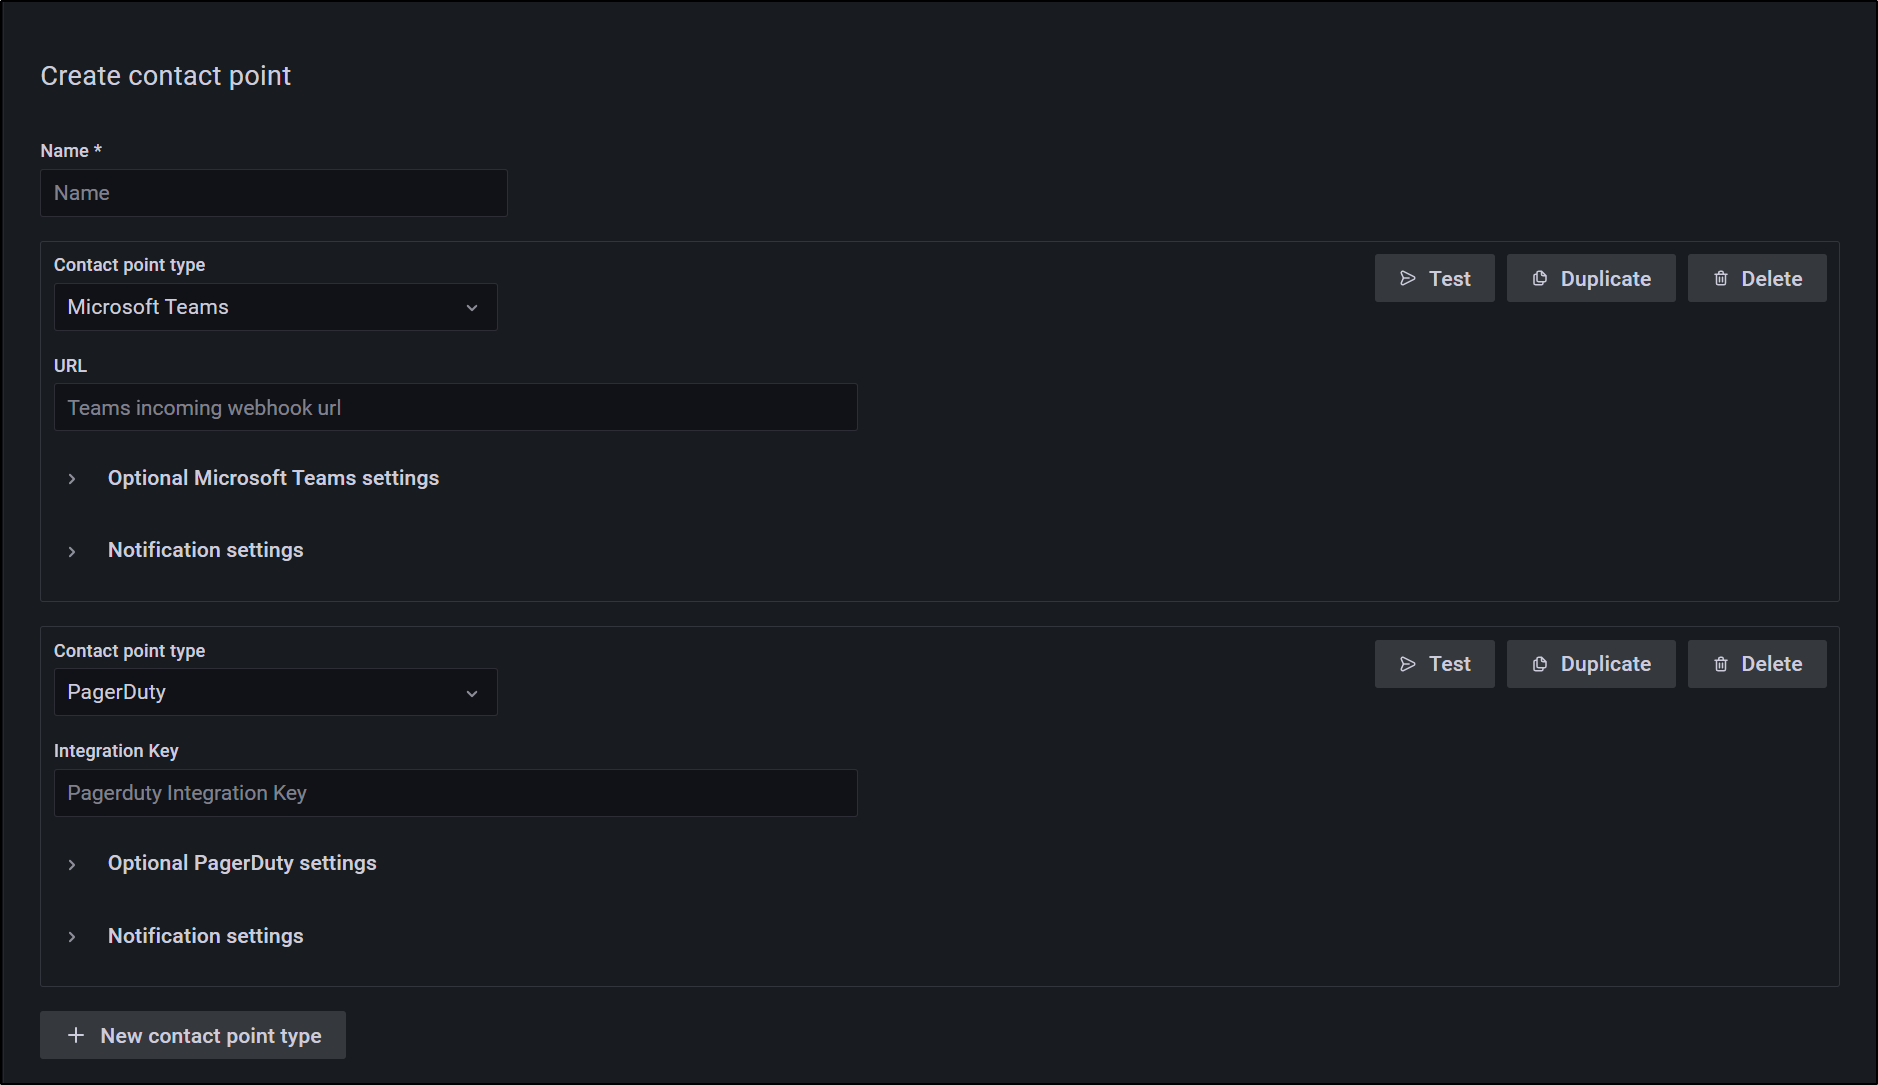
We can create other contact points such as Teams and Pagerduty
Quick Note on Teams: This has been plaguing me for a while - I can never sign in. I’ve been stymied by this over and over for a long while. I finally figured it out today. There are two (insert profane explicative) Teams apps. One with Blue and one with a White “T” tile.
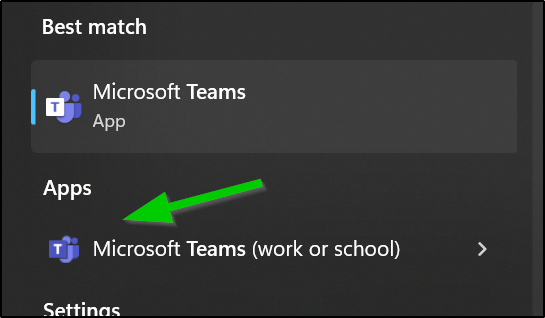
The White tile, which Windows would always suggest when searching for teams is not going to let you sign into Orgs. The blue tile will. I think only recently did they add “(work or school)” to the App name.
Real Alerts and Metrics
Several days later I actually got a real alert
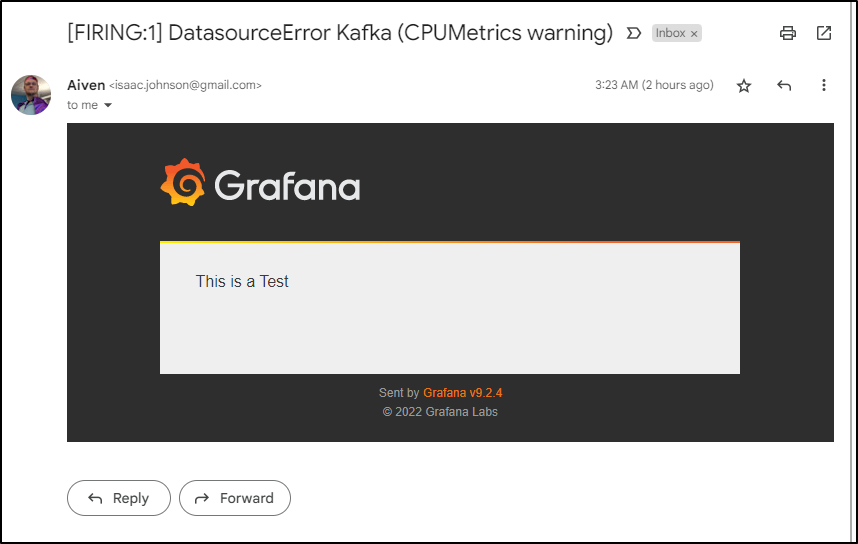
Had I set a proper description, I might have put in a link to wiki pages, or who to call, perhaps a runbook on remediation.
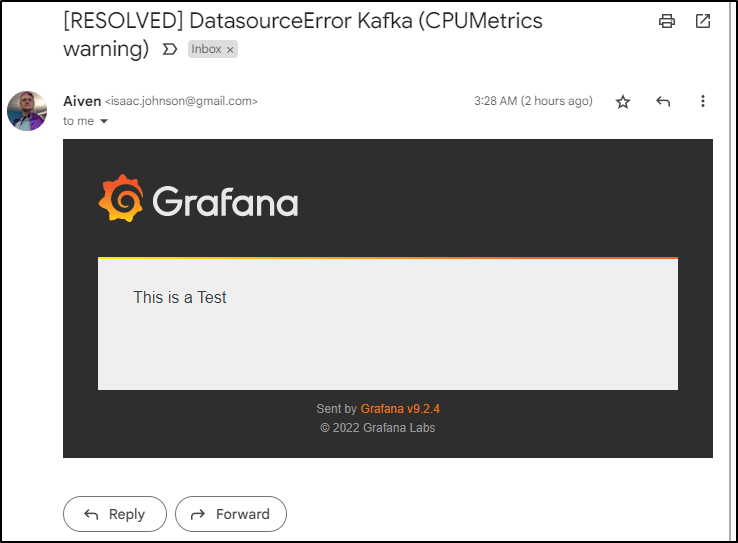
However as we can see above, 5 minutes later it was resolved.
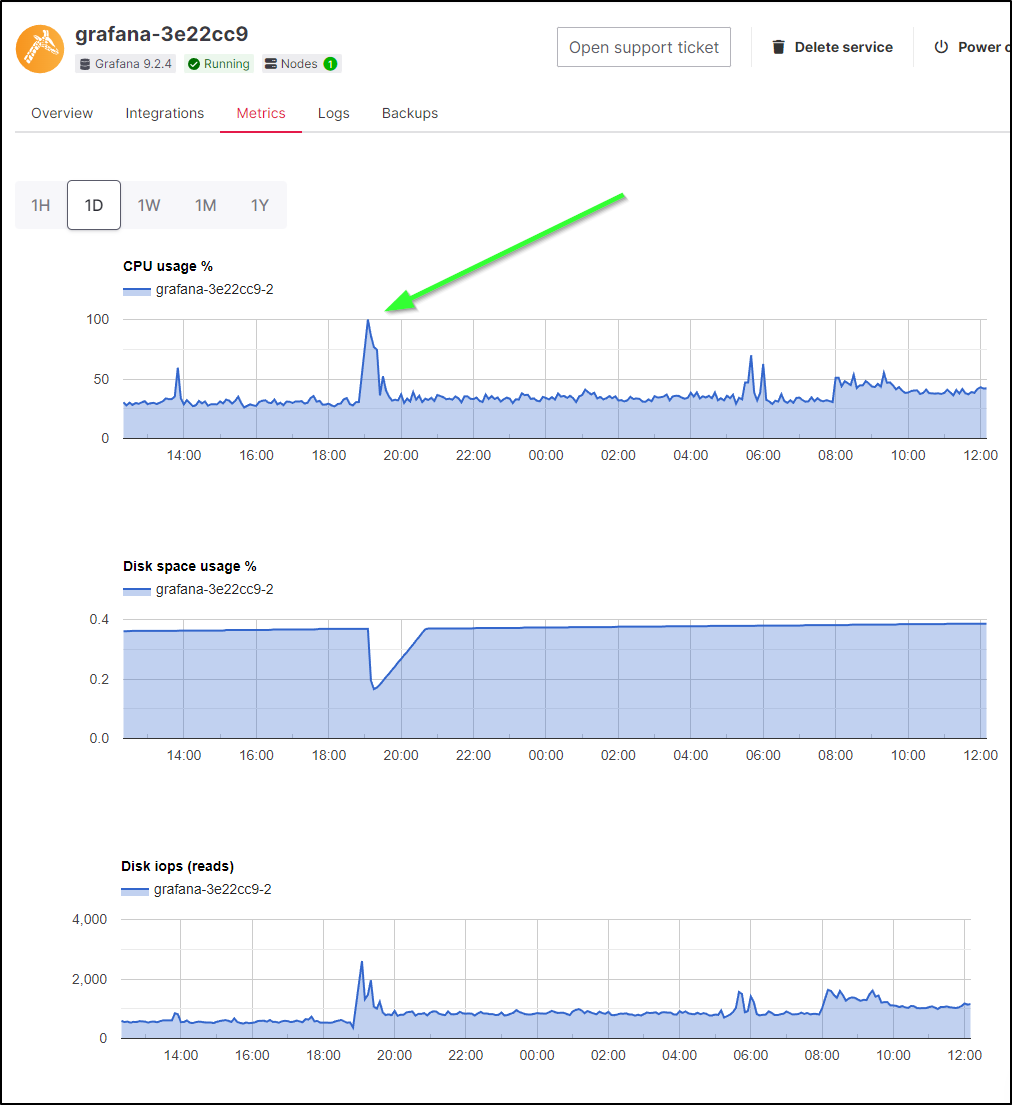
While the error message would lead me to believe it was from Kafka, the Spike (since I aggregated all the metrics) was actually from Grafana itself (times are in Zulu/GMT)
I’m only sending out Kafka Metrics to Datadog and Cloudwatch
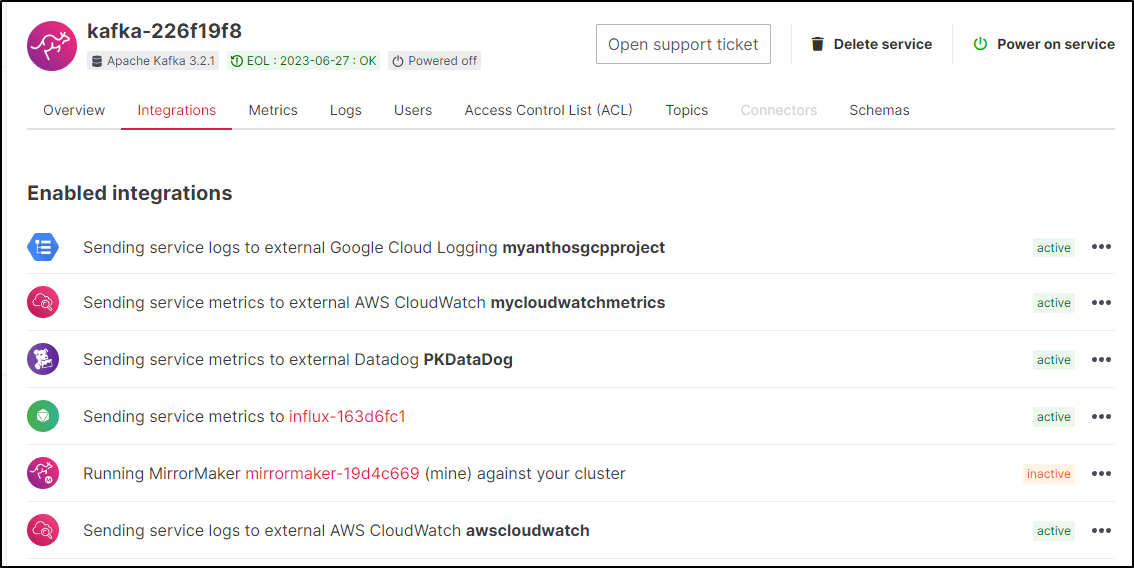
But we can see that in both cases, our Kafka cluster was fine
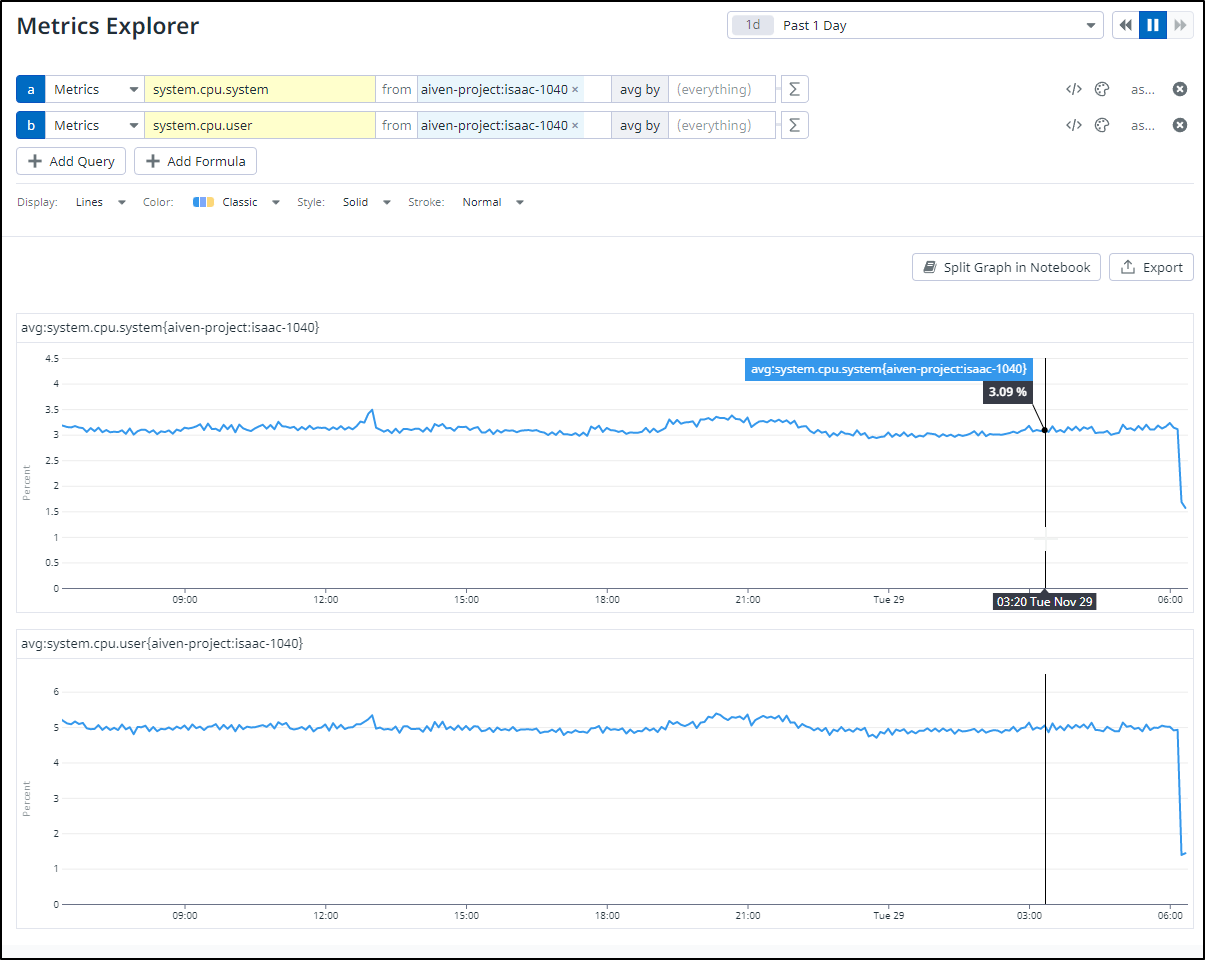
(The drop at the end is because I just stopped the cluster in the last 5 minutes)
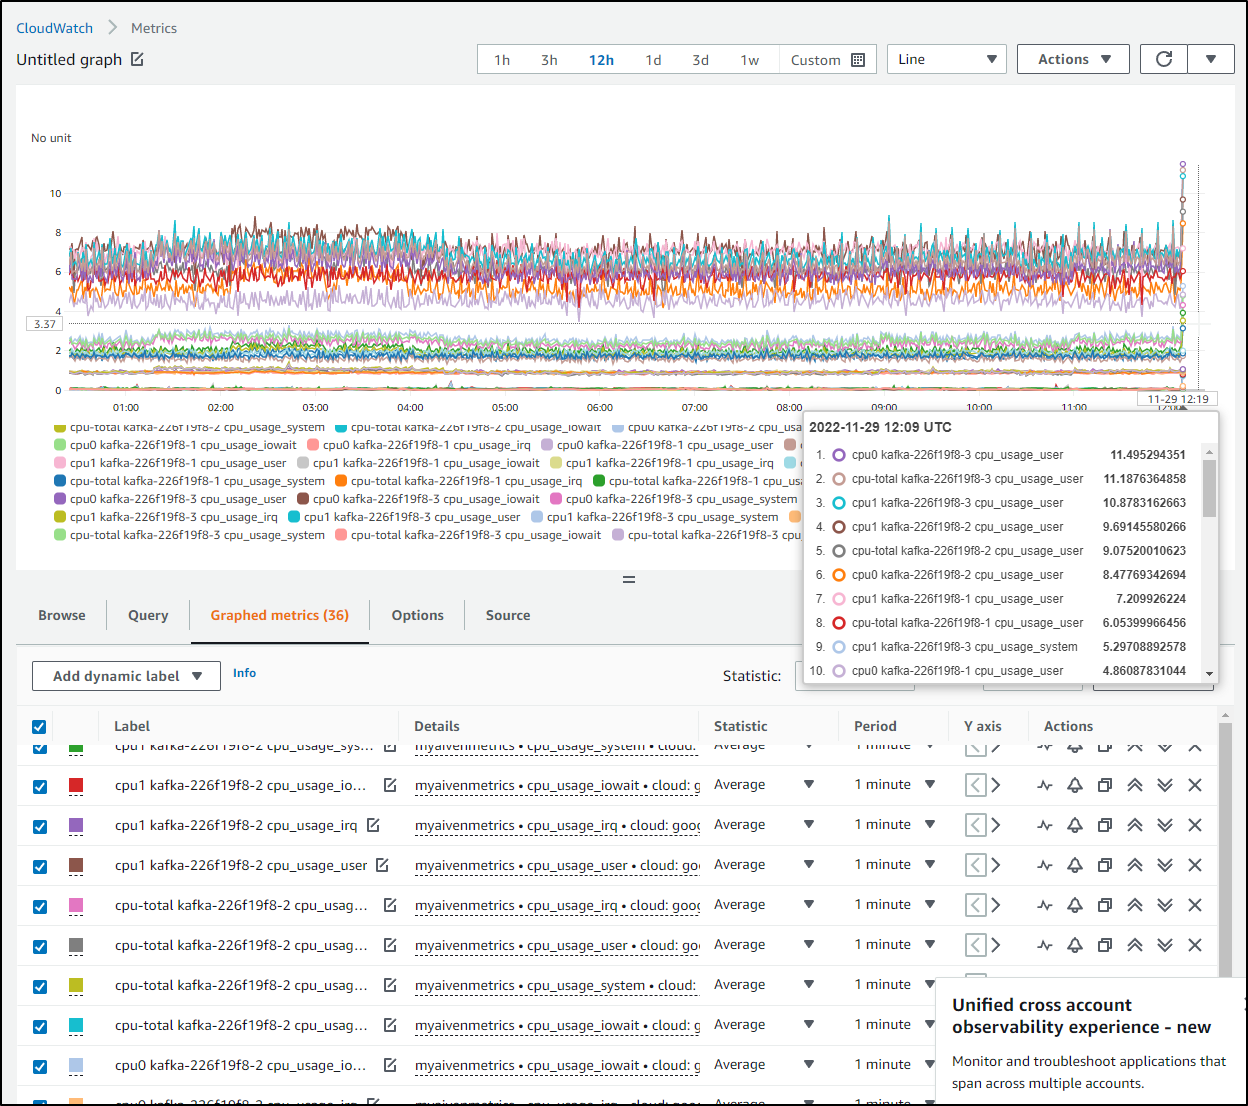
I can see similar (including the drop off of delivered metrics) in Cloudwatch
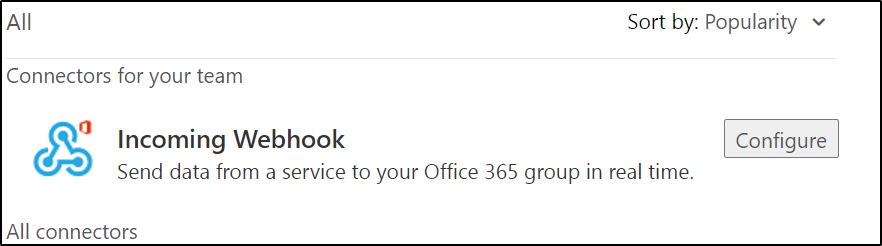
Setting up Teams
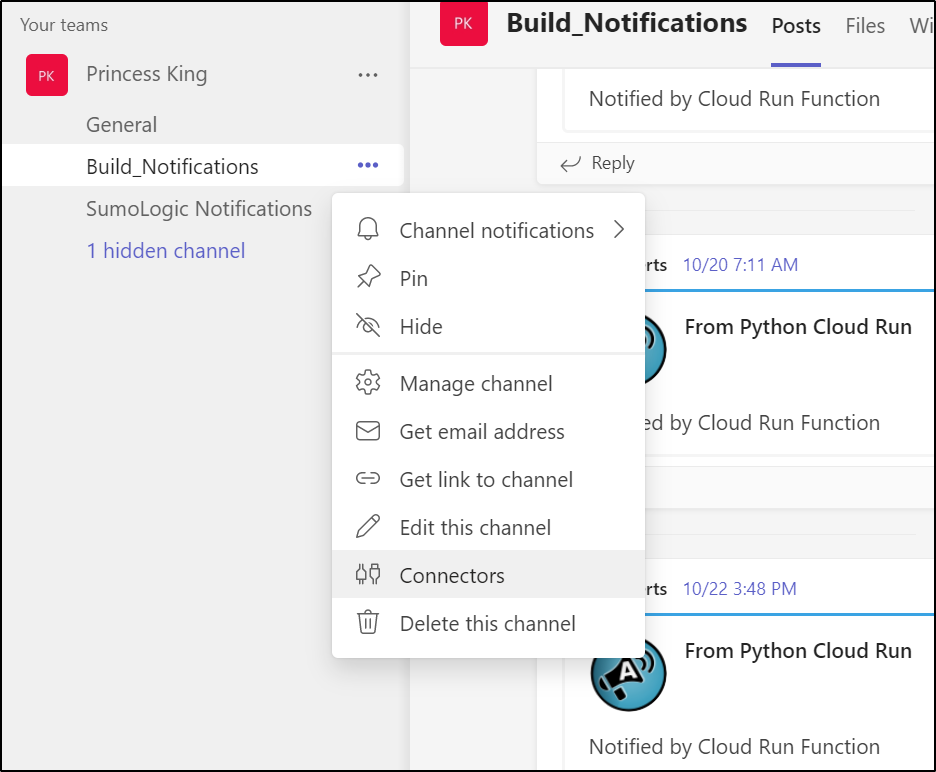
We can go to the Connectors for the Channel
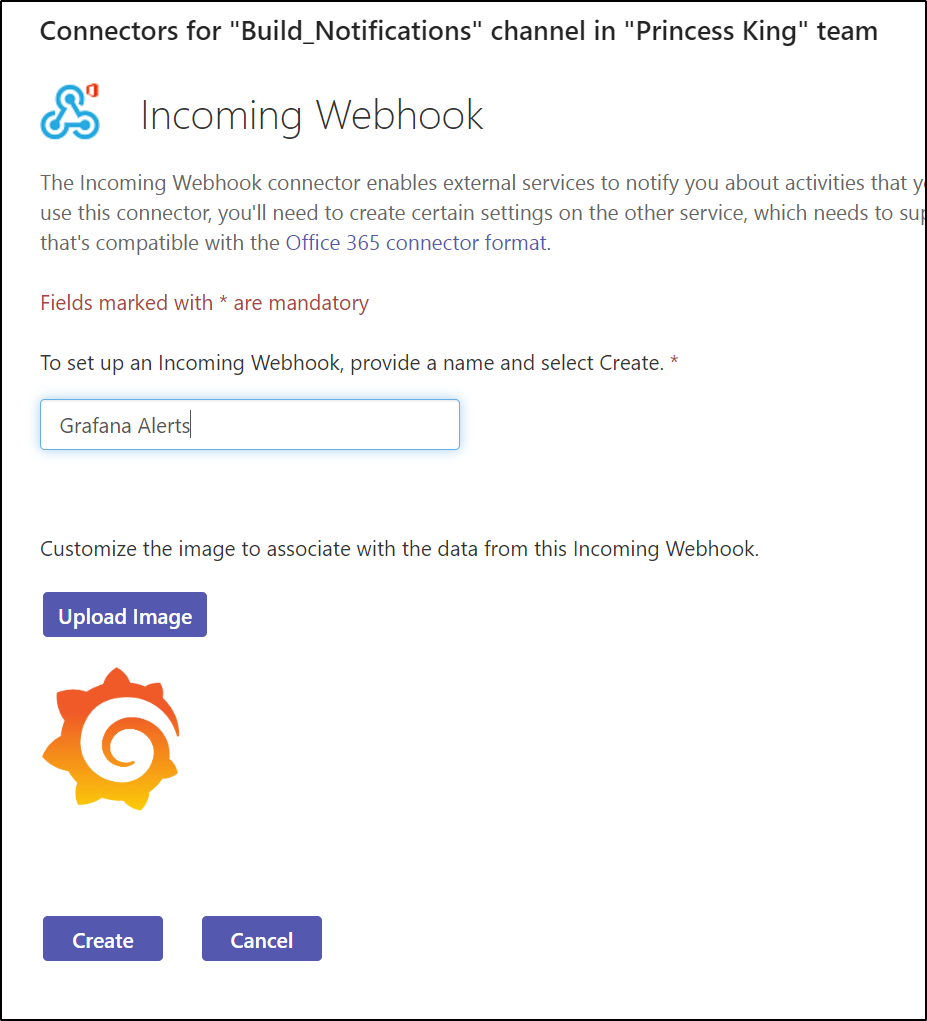
Then we’ll configure an Incoming Webhook
I’ll use an icon (which I’ll leave for you to grab here):

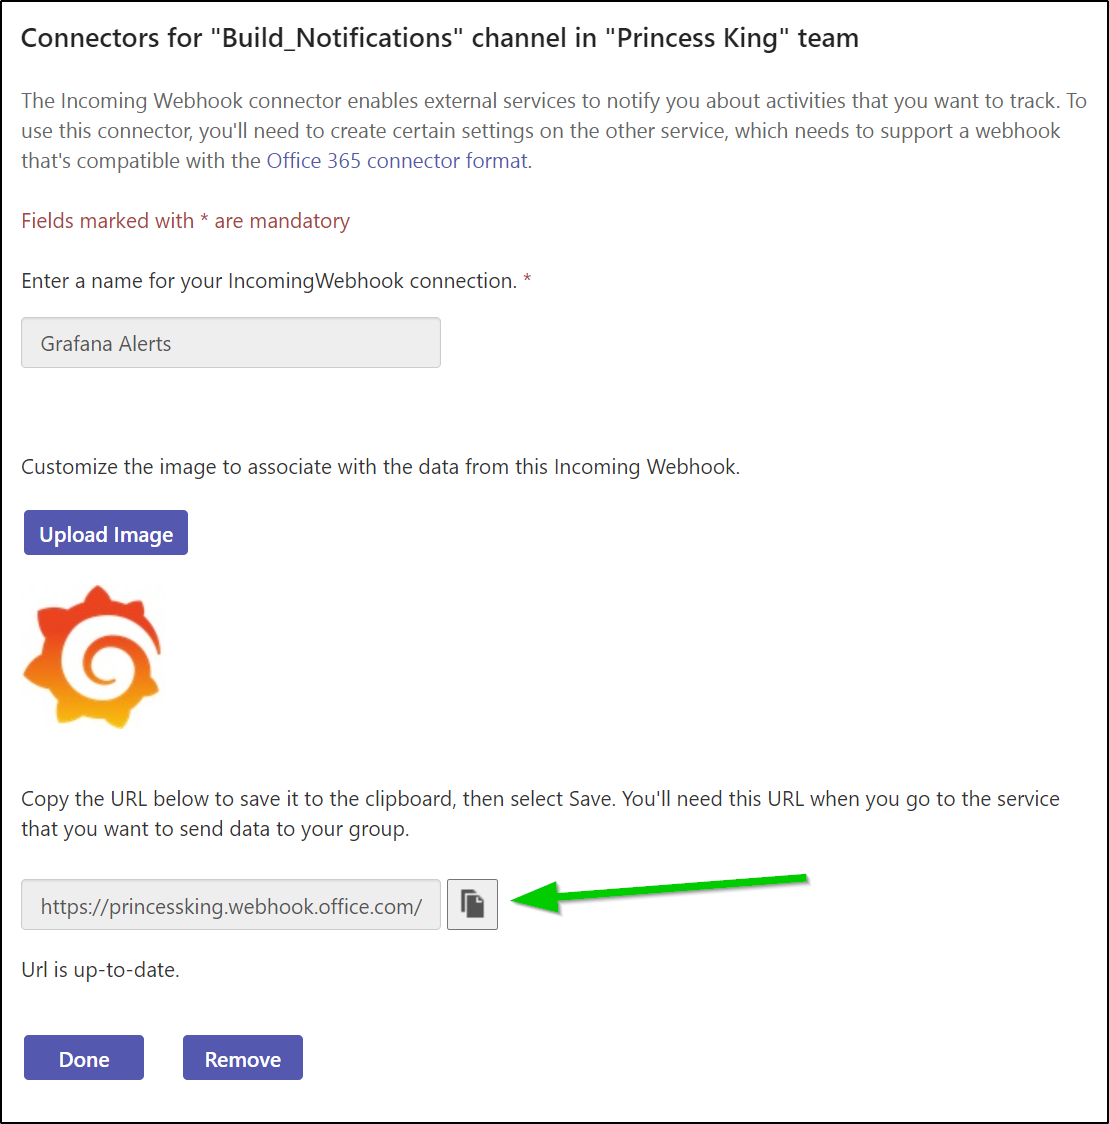
And we can fill out the Webhook details
We’ll then want to copy that URL
Back in Grafana we can setup a Teams Notification Contact Type
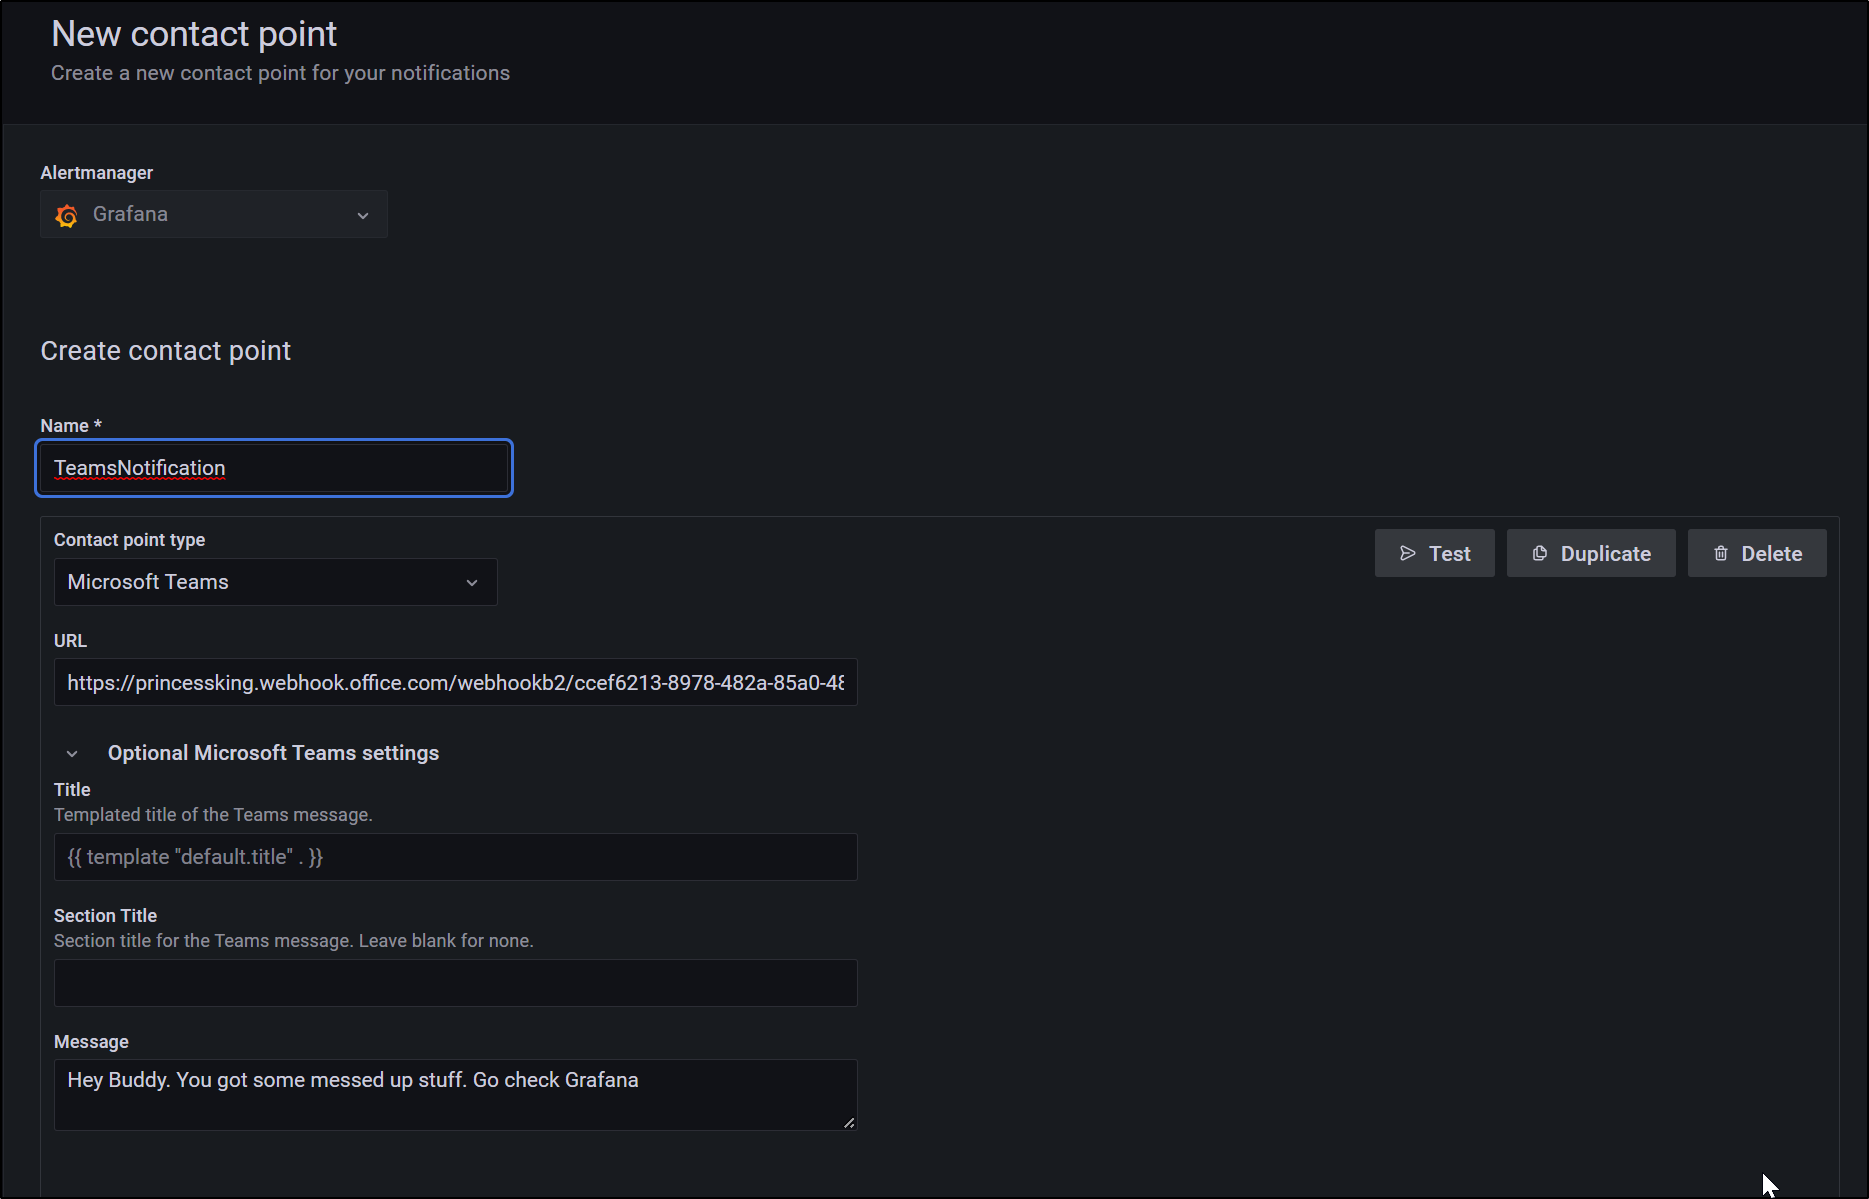
And then test it
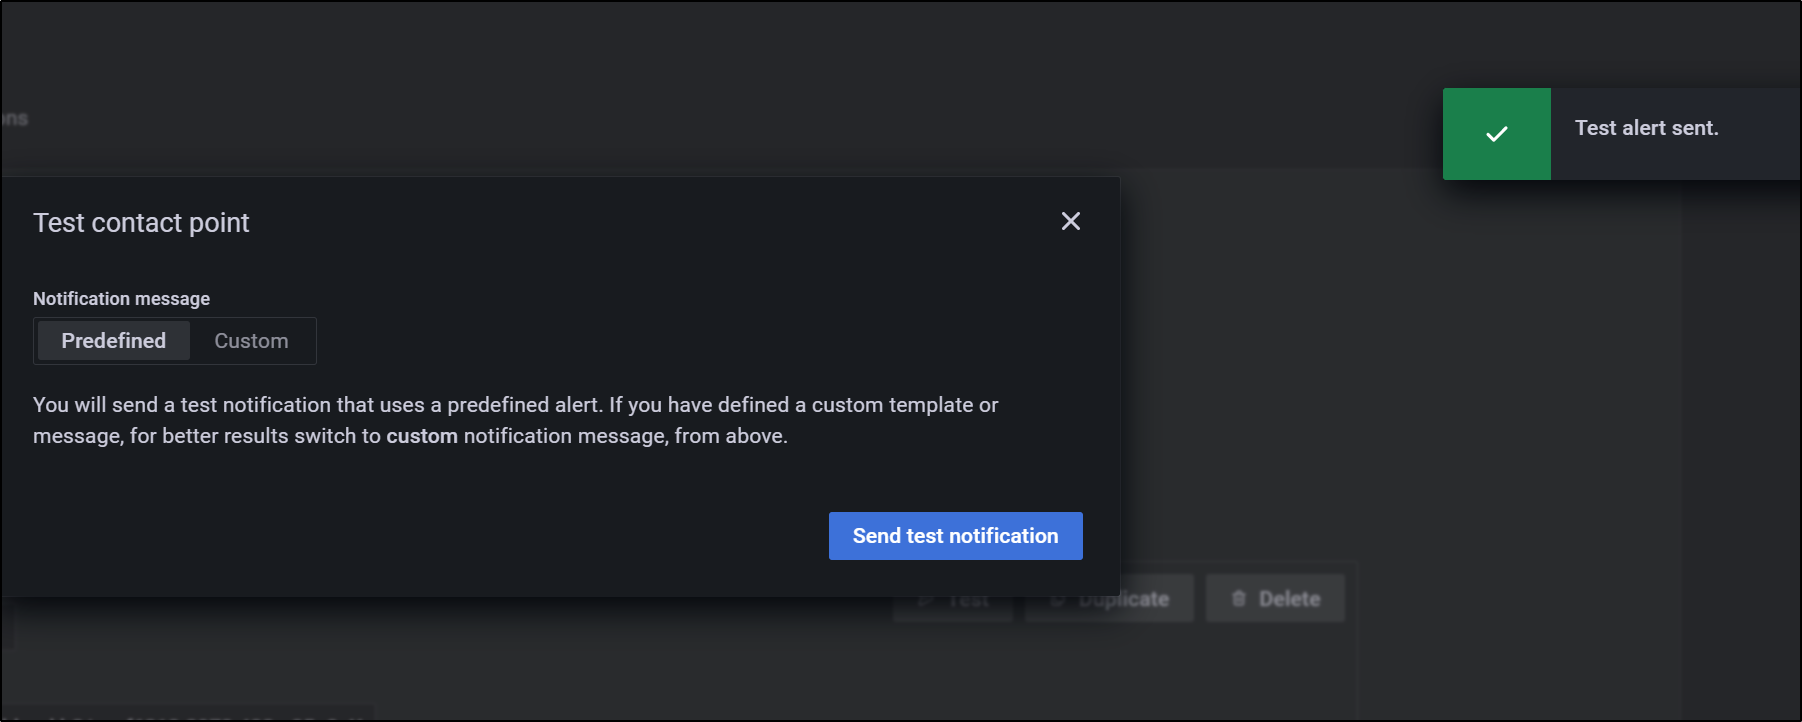
And see the results
Discord
More and more, I’m seeing my colleagues looking to Discord as the ‘new’ Slack. Let’s setup discord (which unlike teams doesn’t require me to endlessly sign out and in again to swap orgs).
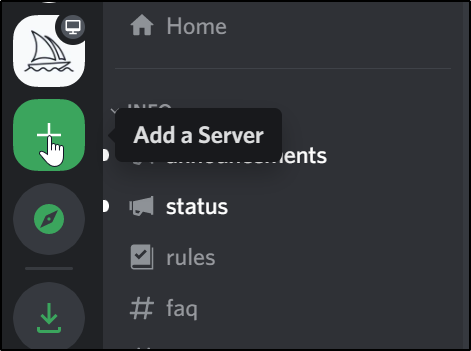
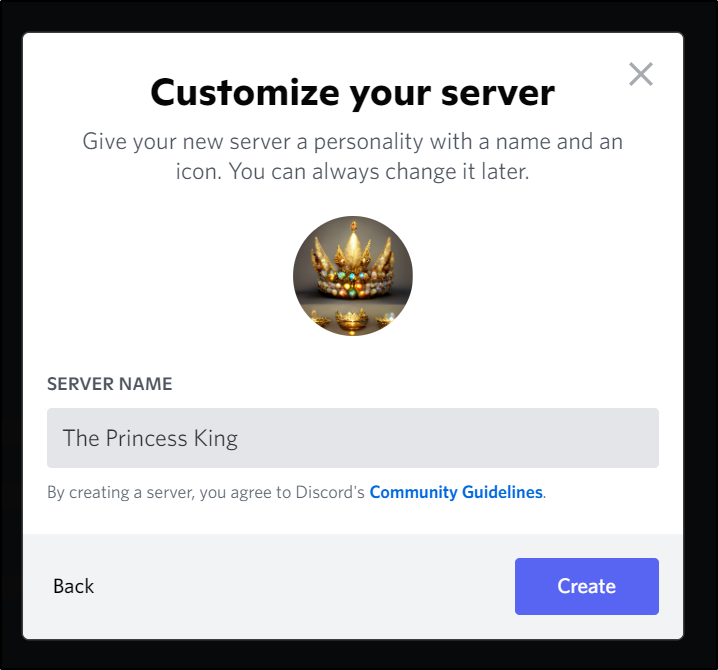
I’ll go ahead and “Add a server”
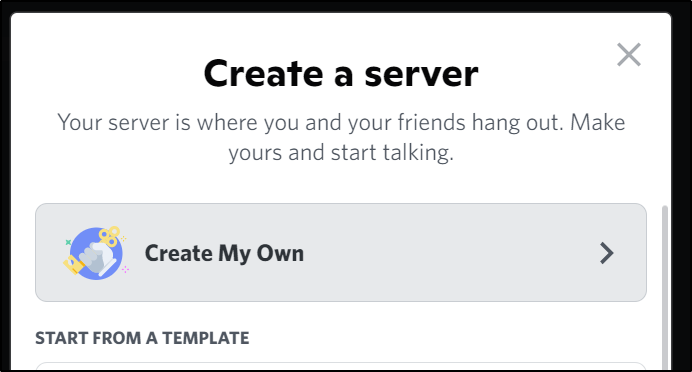
Then I’ll choose to “Create My Own”
I’ll likely just say for “Me and my friends” on the next prompt. I don’t think it matters.

Then we can give it name and icon
We can right-click the server icon to get to Integrations so we can add the webhook
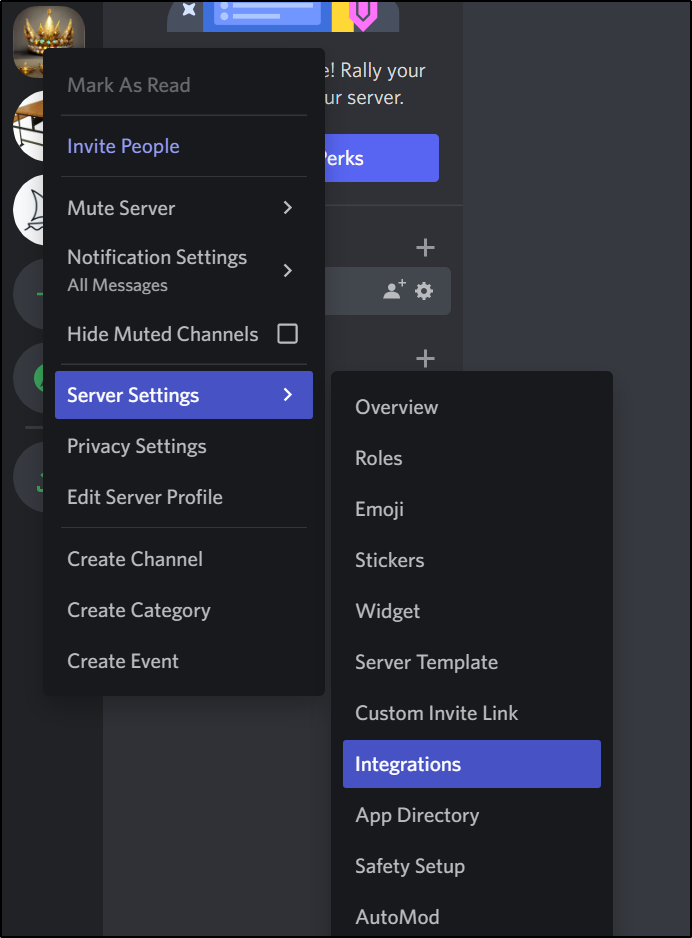
which brings us to the Integrations page
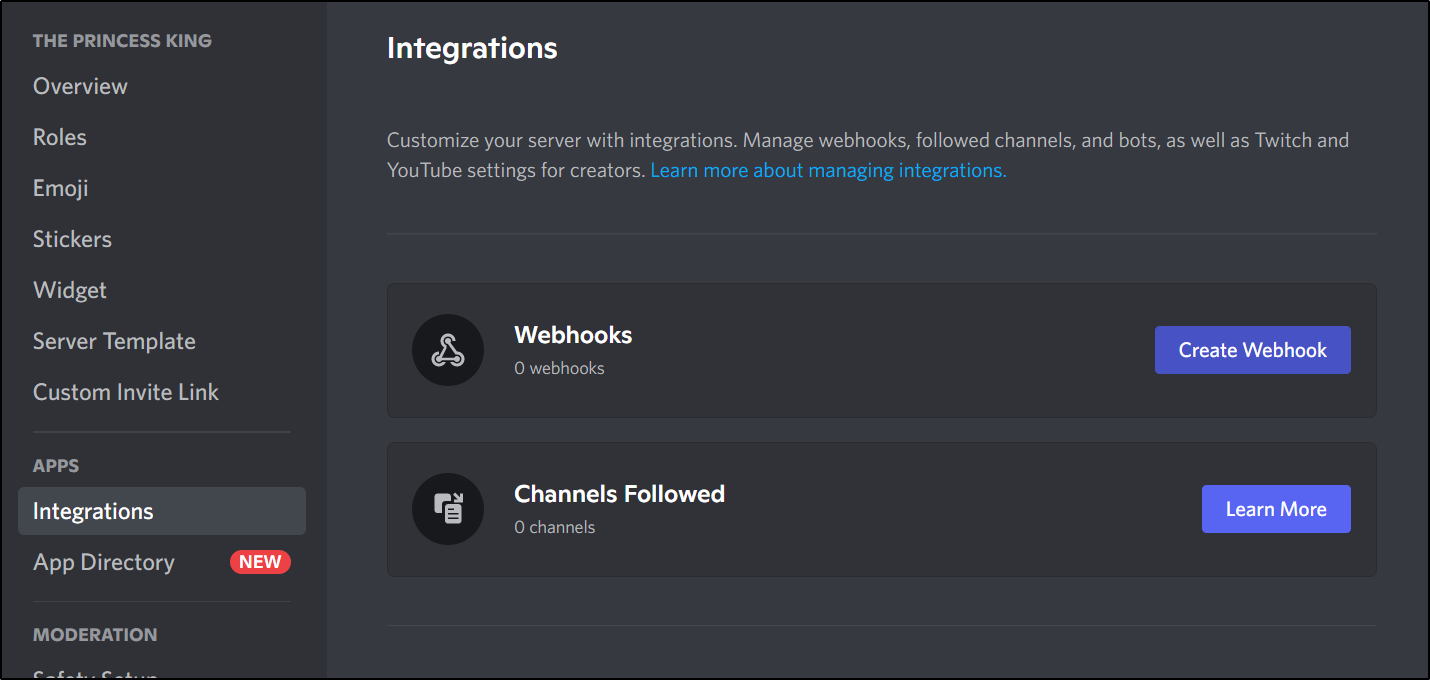
Just like in Teams, we can the Grafana icon
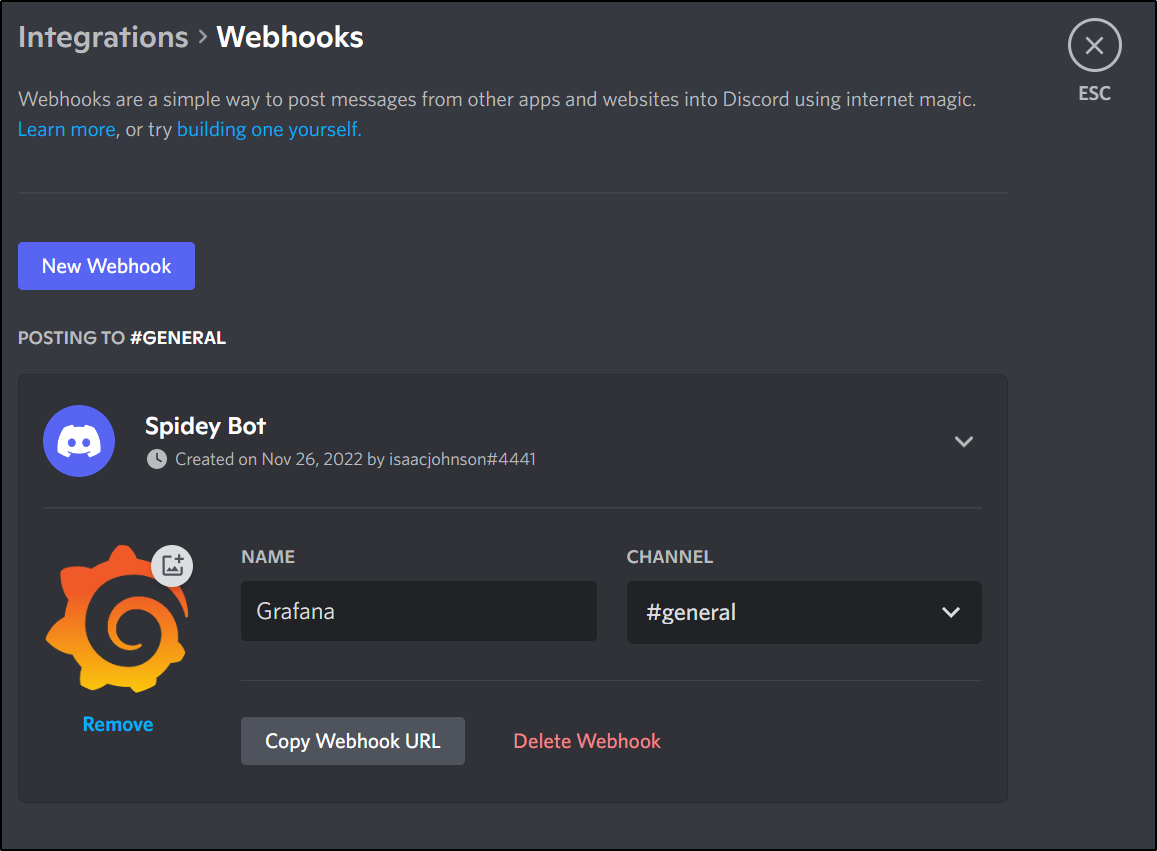
I can “Copy Webhook URL” which puts it in the clipboard. Something like
https://discord.com/api/webhooks/1046asdfasdfsadfasdfasdfasdfa/asdfsadfsadfasdfasdfasdf
We can now use that as a Contact Point in Grafana
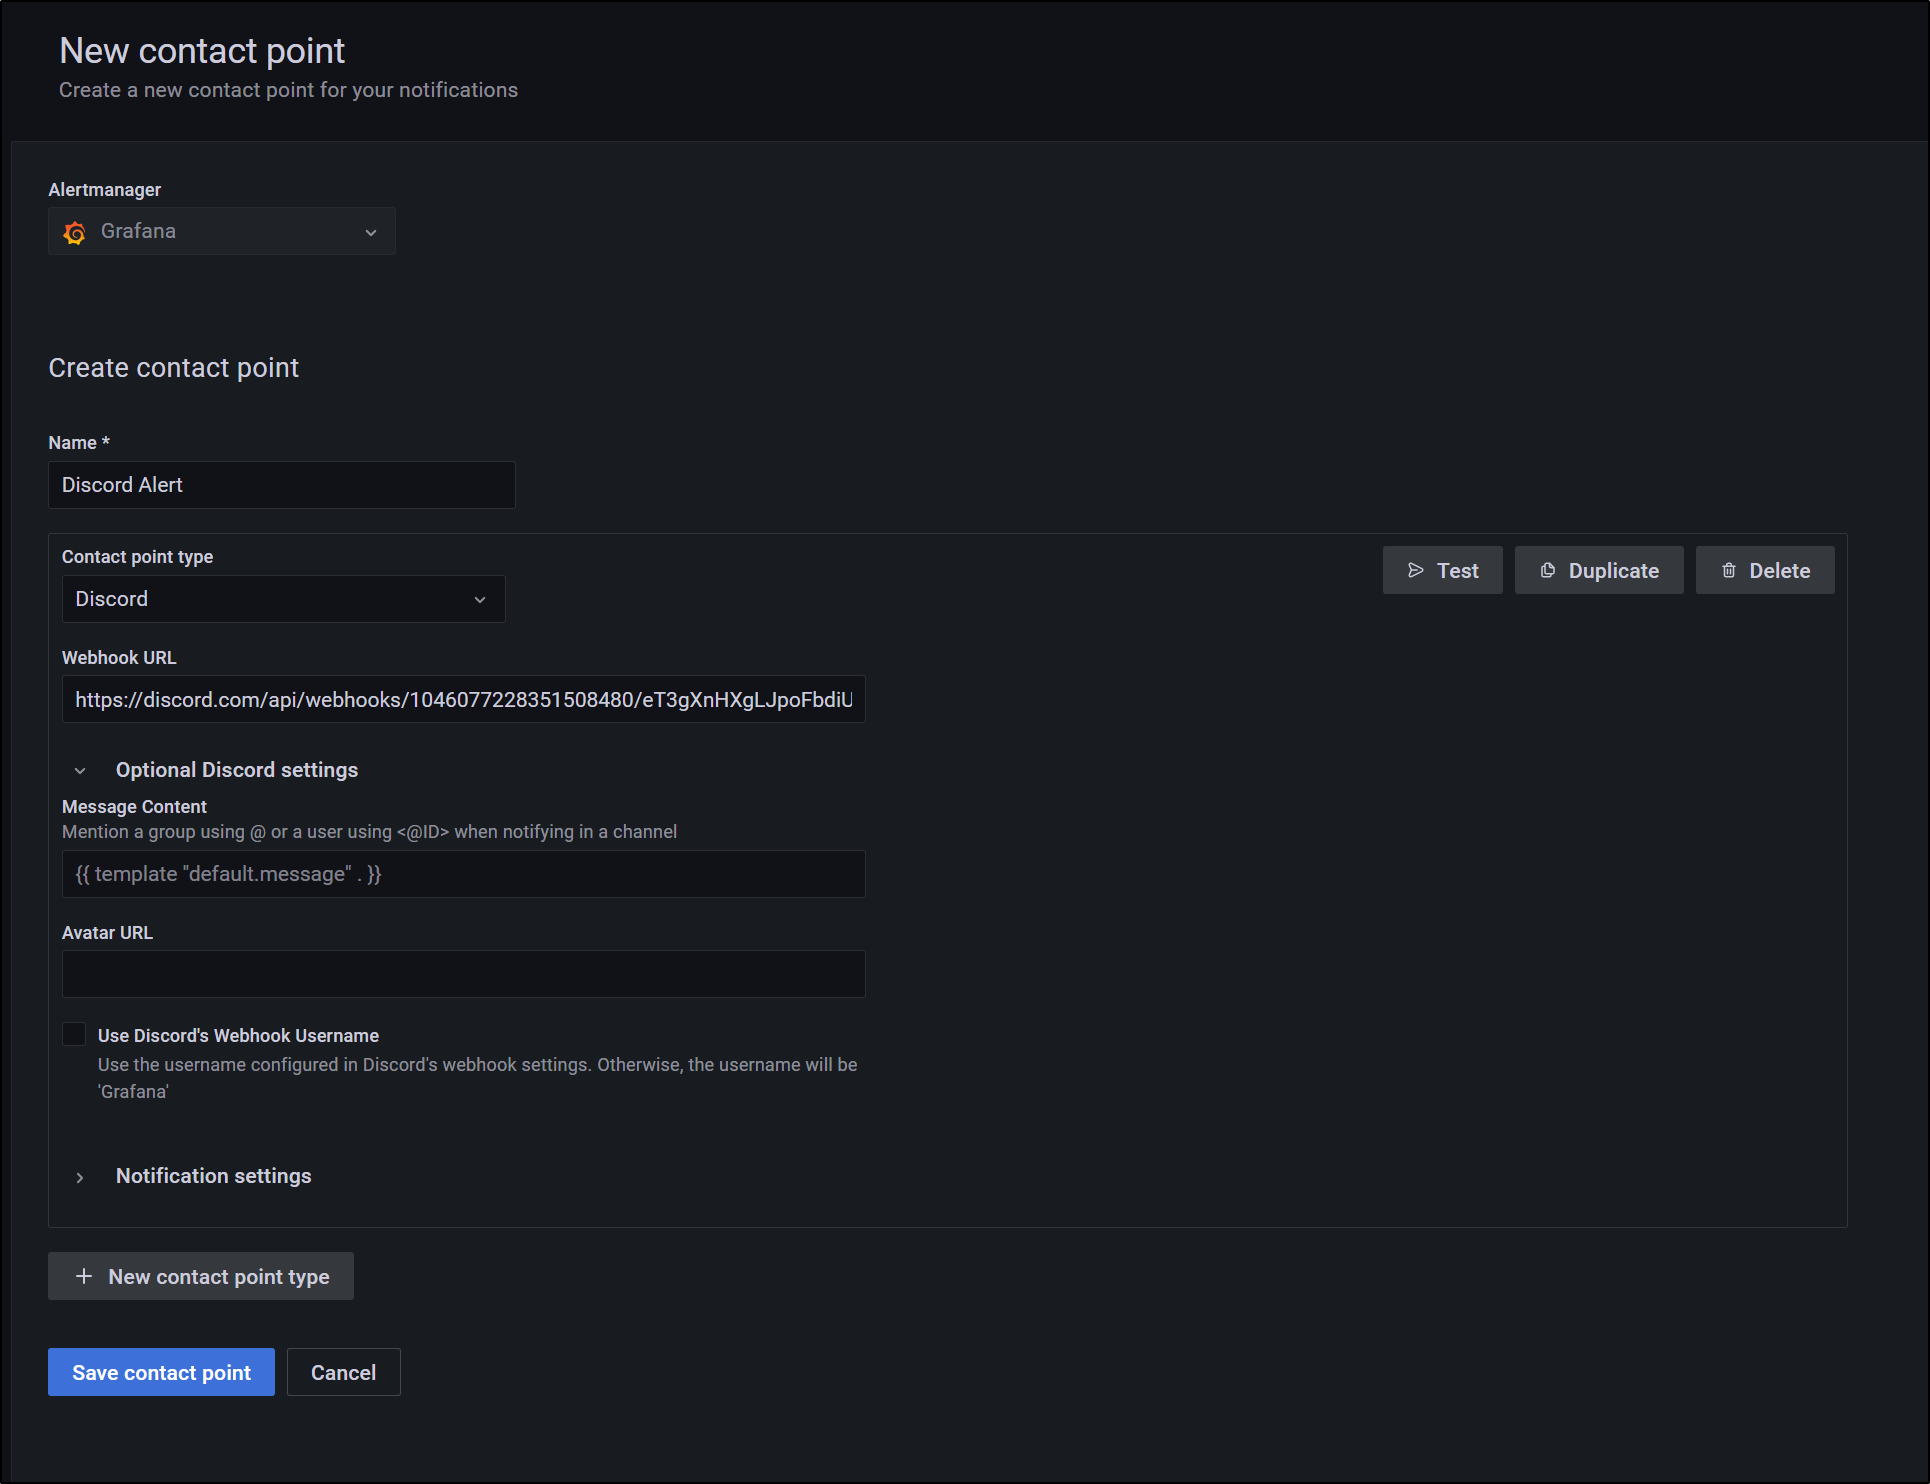
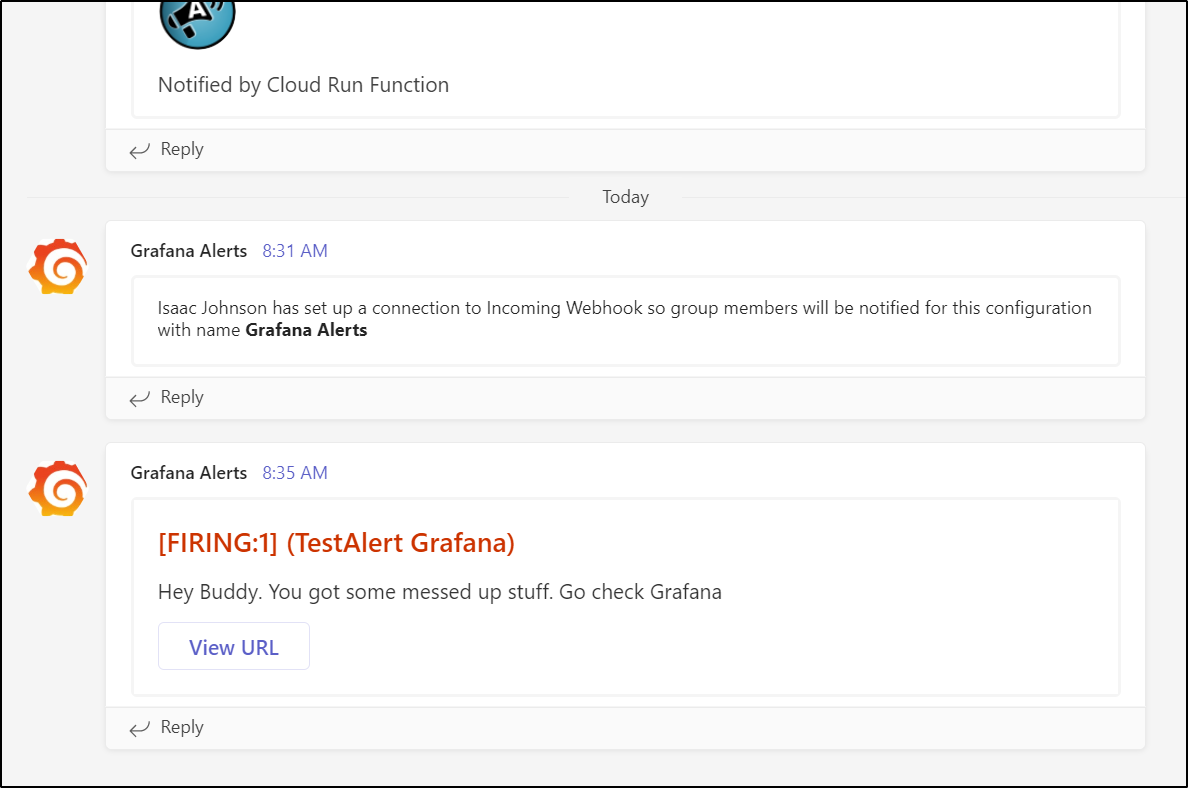
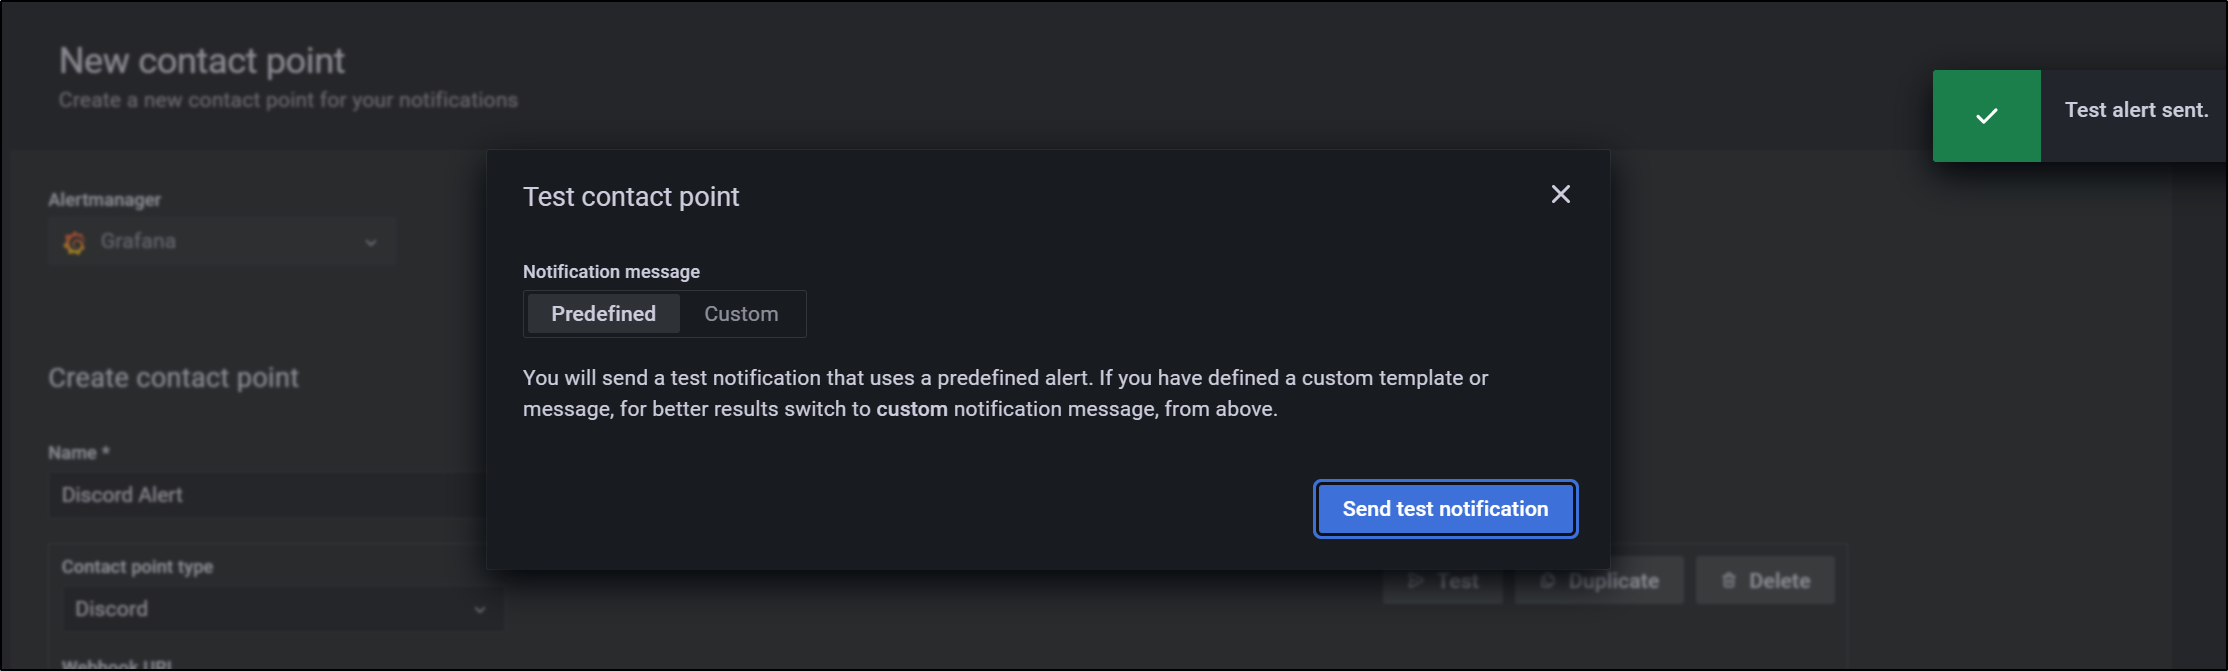
As before, we can test the alert
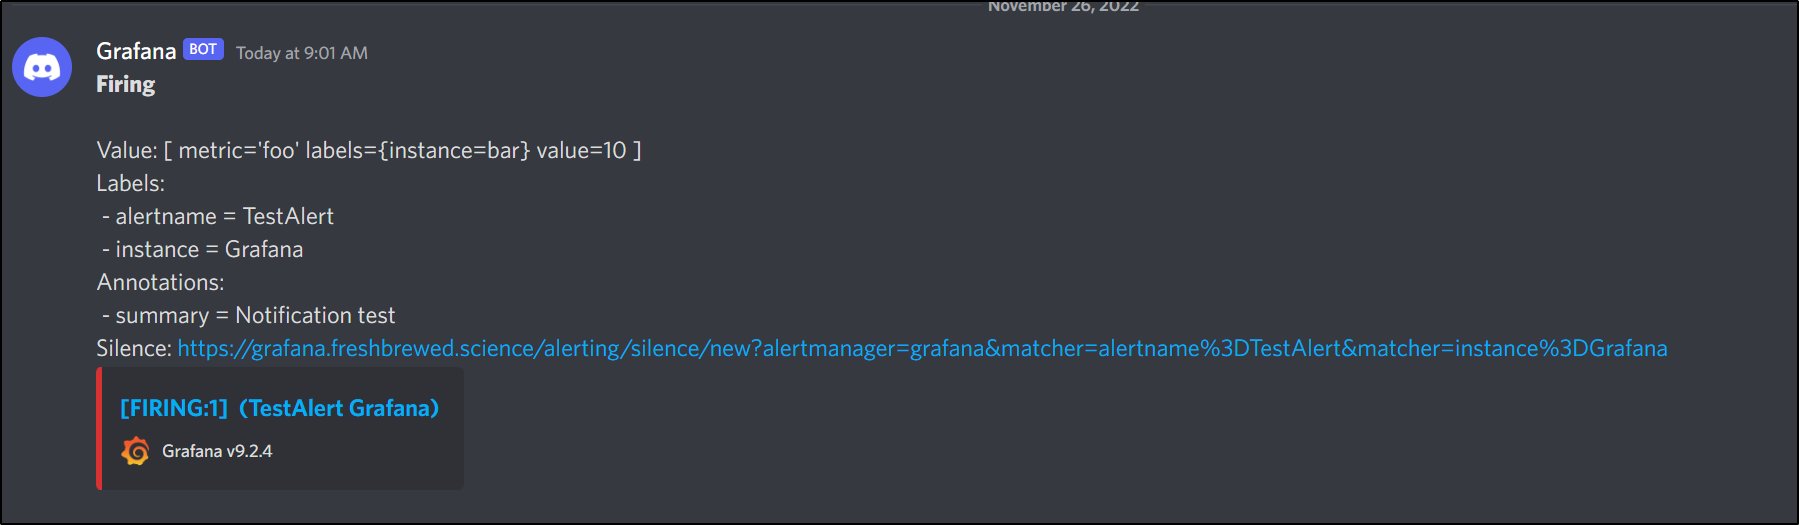
and see it fires in our ‘#general’ channel
Summary
Today we set up hosted instances of Grafana and Influx DB. We ingested metrics to InfluxDB via native Aiven.io integrations, then turned around and tied the InfluxDB to Grafana. In Grafana we verified we could see these metrics then worked through adding Contact Points, Labels and Alert Policies. We tested sending out alerts to Email, Teams and Discord. Later we received a proper alert from Grafana and looked at Metrics gathered in Aiven, Datadog and AWS to identify the time and service.
Arguably, using InfluxDB and Grafana is a pretty simple setup for those looking for a straightforward hosted APM system - we have InfluxDB and Grafana, together for just under $100/mo with our only limitation on server space. We can easily tie these to Aiven.io services or external services. We can even use the private VPC option if we wish to ingest metrics without traversing the public internet using the Aiven.io VPC private endpoint option
Looking at all Aiven.io offers, one can see it isn’t a replacement for our clouds, but a natural complimentary augmentation - creating turnkey supported hosting solutions in an easy to use way. For instance, this vendor first came on my radar when looking for an MSK solution in GCP (where no Managed Kafka option presently exists).