Published: Nov 29, 2022 by Isaac Johnson
In our first post we explored Aiven.io to create and manage a hosted Kafka cluster as well as a MirrorMaker instance. We explored sending metrics to Datadog and using MirrorMaker to sync with an on-prem cluster as well as Azure Event Hub.
Today we will explore using Aiven for Redis, and sending Logs from Kafka and Redis to GCP Log Monitor. We’ll then look at AWS CloudWatch for both Metrics and Logs.
Aiven Redis
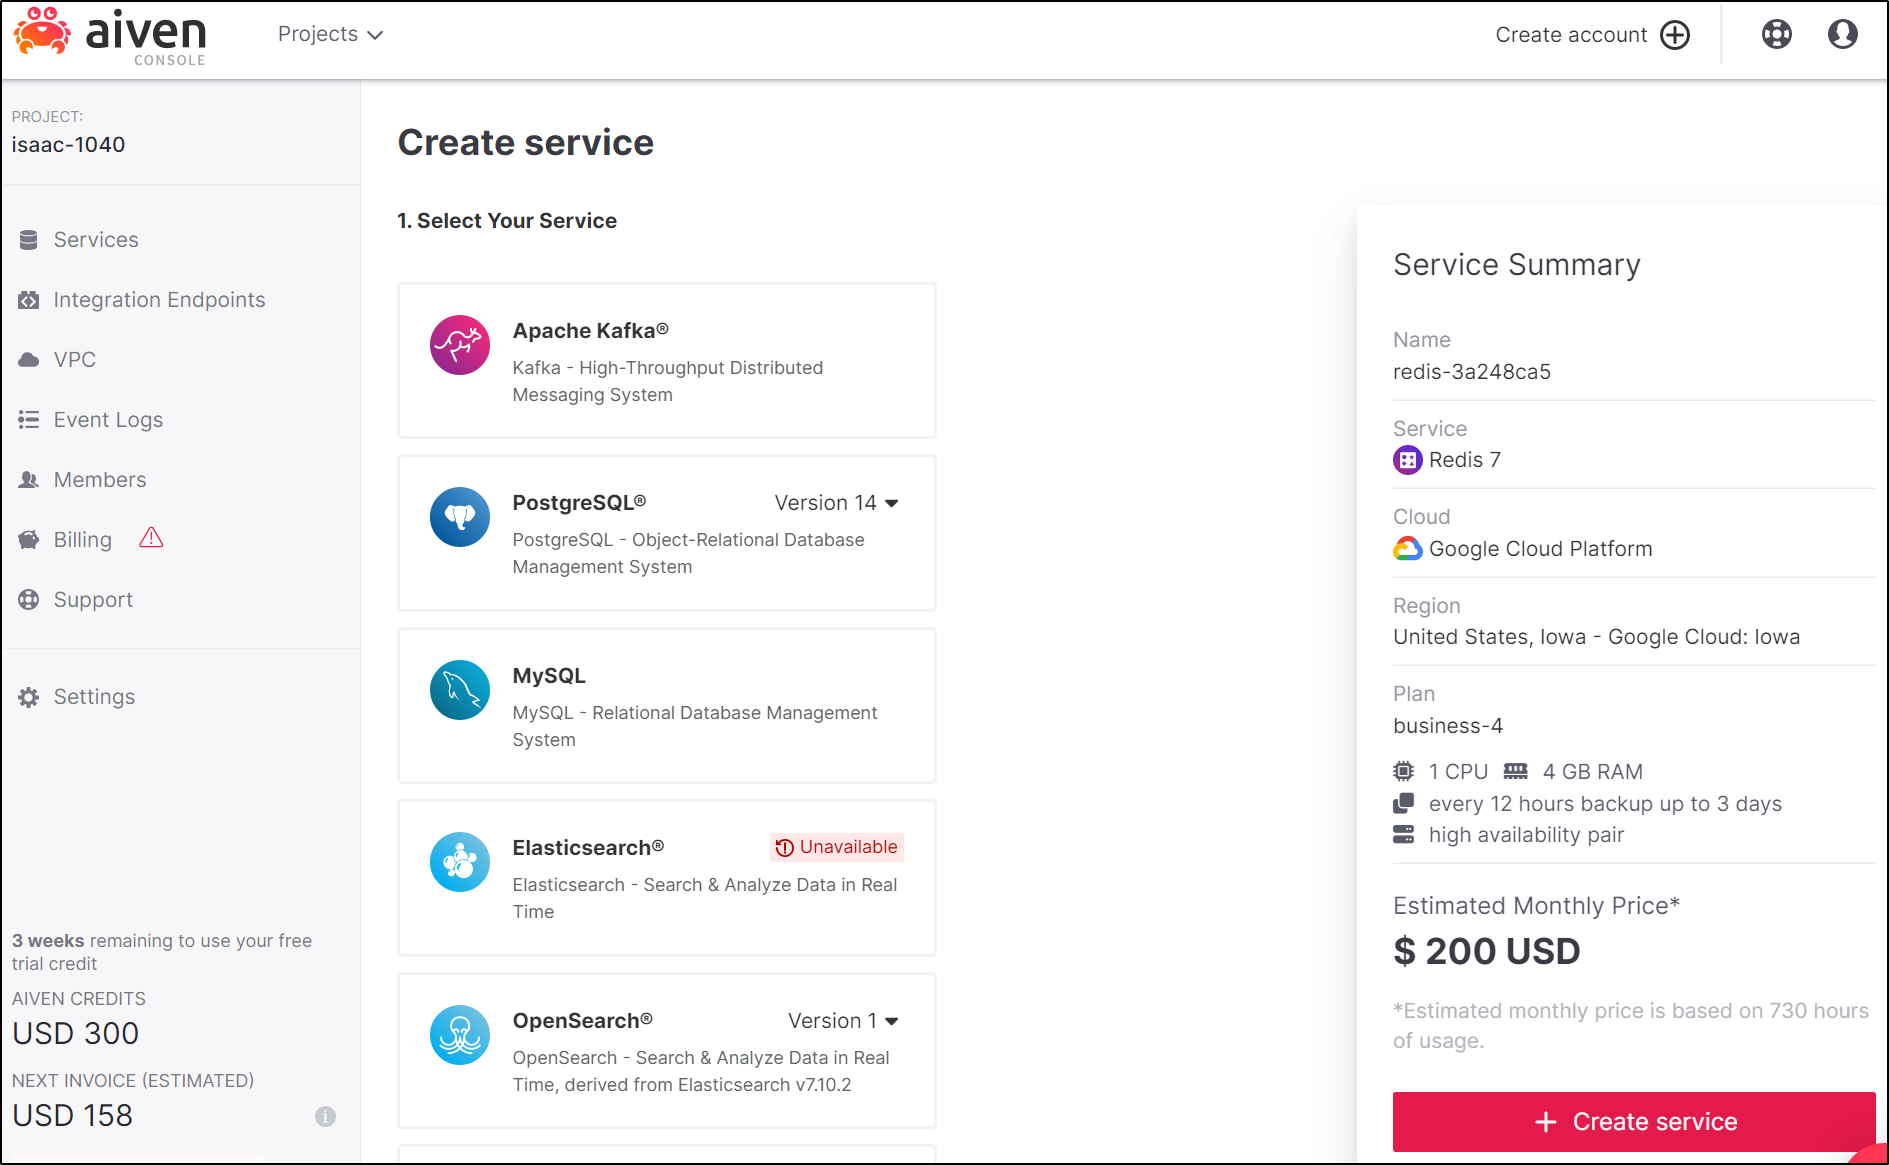
The first step is to go into services and create a Redis Service
Our next step will be to try and connect via a Redis CLI
Since I really don’t care to install a local redis server, I’ll just build from source:
builder@DESKTOP-72D2D9T:~/Workspaces$ git clone https://github.com/redis/redis.git
Cloning into 'redis'...
remote: Enumerating objects: 85618, done.
remote: Counting objects: 100% (31/31), done.
remote: Compressing objects: 100% (31/31), done.
remote: Total 85618 (delta 9), reused 9 (delta 0), pack-reused 85587
Receiving objects: 100% (85618/85618), 121.71 MiB | 7.64 MiB/s, done.
Resolving deltas: 100% (62172/62172), done.
builder@DESKTOP-72D2D9T:~/Workspaces$ cd redis/
builder@DESKTOP-72D2D9T:~/Workspaces/redis$ git checkout 3.0
Branch '3.0' set up to track remote branch '3.0' from 'origin'.
Switched to a new branch '3.0'
builder@DESKTOP-72D2D9T:~/Workspaces/redis$ make redis-cli
cd src && make redis-cli
make[1]: Entering directory '/home/builder/Workspaces/redis/src'
... snip
Then fix the perms and link it. We can use ‘-v’ to test
builder@DESKTOP-72D2D9T:~/Workspaces/redis$ chmod 755 src/redis-cli
builder@DESKTOP-72D2D9T:~/Workspaces/redis$ ln -s /home/builder/Workspaces/redis/src/redis-cli /usr/local/bin/redis-cli
builder@DESKTOP-72D2D9T:~/Workspaces/redis$ redis-cli -v
redis-cli 3.0.7 (git:48e24d54)
I actually found troubles connecting with the 3.0 and the 6.0.16 version of redis-cli. But the latest 7.x seems to work fine
builder@DESKTOP-72D2D9T:~/Workspaces/redis$ redis-cli -u 'rediss://default:AVNS_yvSws8sfsXLZd9ywo8o@redis-3a248ca5-isaac-1040.aivencloud.com:11997'
Warning: Using a password with '-a' or '-u' option on the command line interface may not be safe.
redis-3a248ca5-isaac-1040.aivencloud.com:11997>
Testing
builder@DESKTOP-72D2D9T:~/Workspaces/redis$ redis-cli -u 'rediss://default:AVNS_yvSws8sfsXLZd9ywo8o@redis-3a248ca5-isaac-1040.aivencloud.com:11997'
Warning: Using a password with '-a' or '-u' option on the command line interface may not be safe.
redis-3a248ca5-isaac-1040.aivencloud.com:11997> set TEST VAL1234
OK
(3.96s)
redis-3a248ca5-isaac-1040.aivencloud.com:11997> get TEST
"VAL1234"
(2.10s)
redis-3a248ca5-isaac-1040.aivencloud.com:11997> exit
Next, I’ll send Metrics to Datadog
GCP Logging
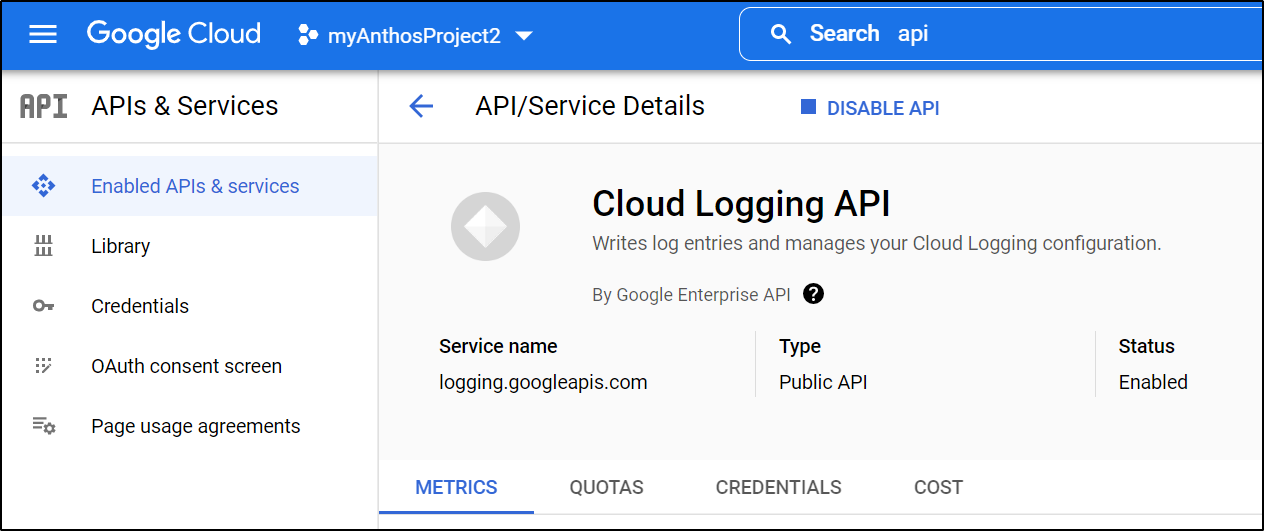
We need to ensure the Logging API is enabled
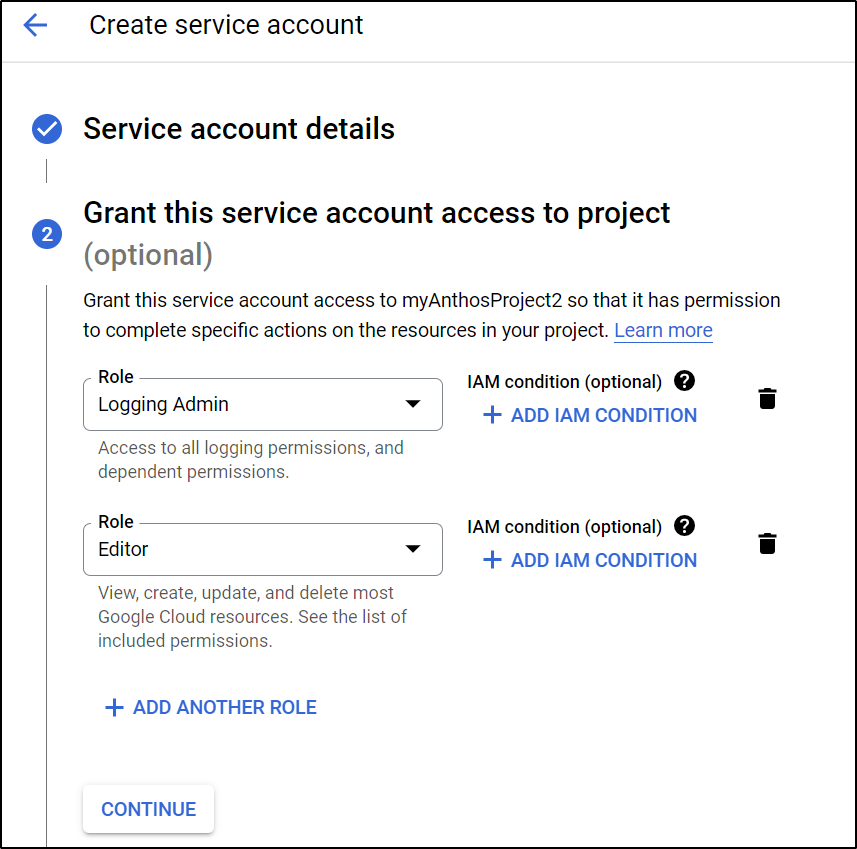
Then create a service account
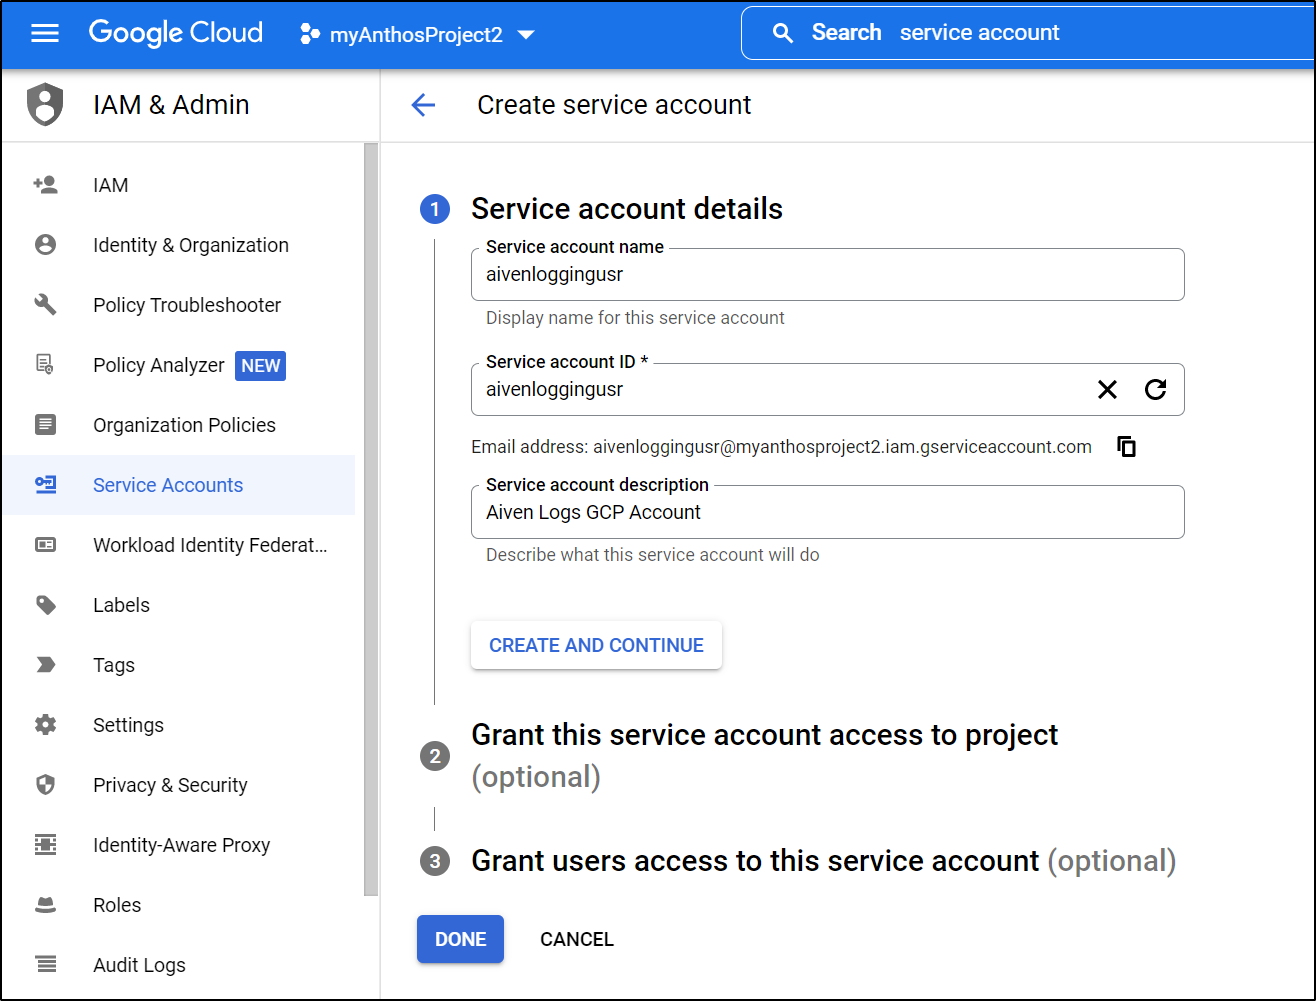
I’m likely going overkill, but I’m going to add to the Logging Admin Role and Editor role. I really want roles/logging.logWriter and roles/editor but the GCP UI is rather lacking
I’ll want to get the service key JSON next
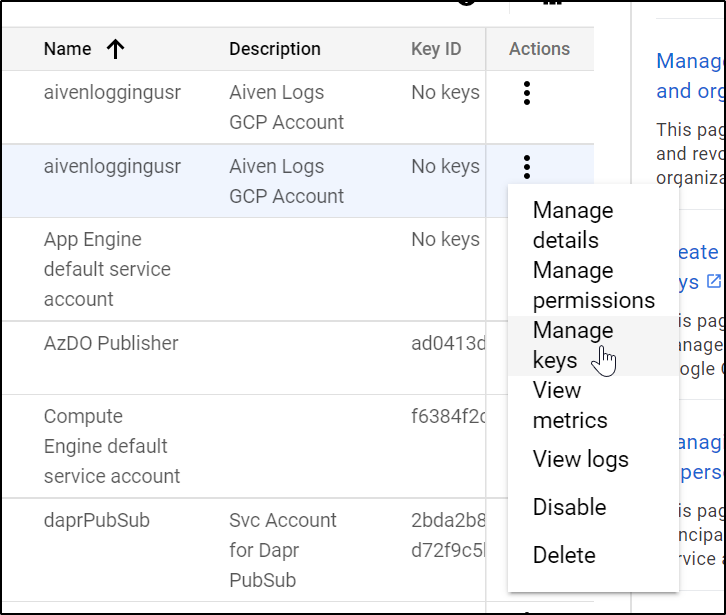
from there I can create a new key
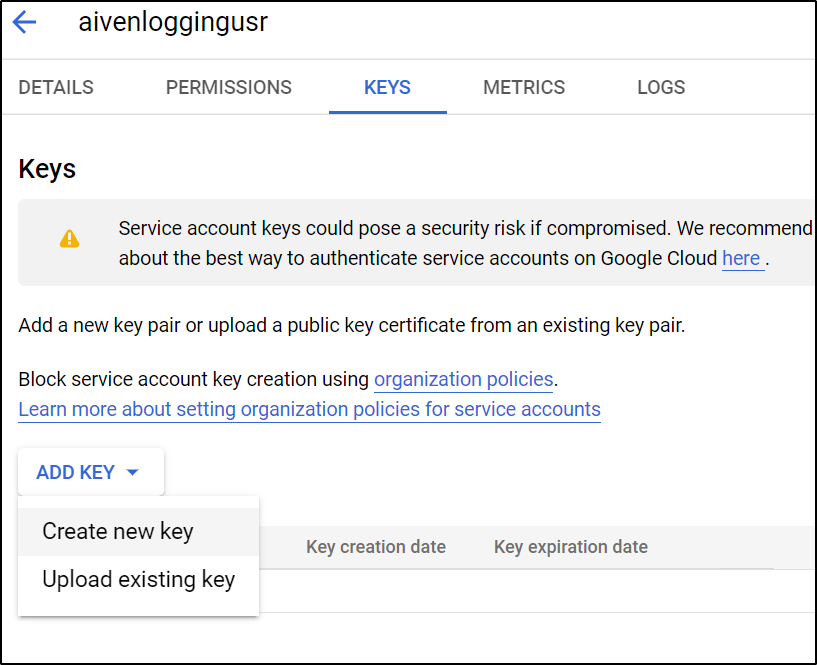
choose JSON
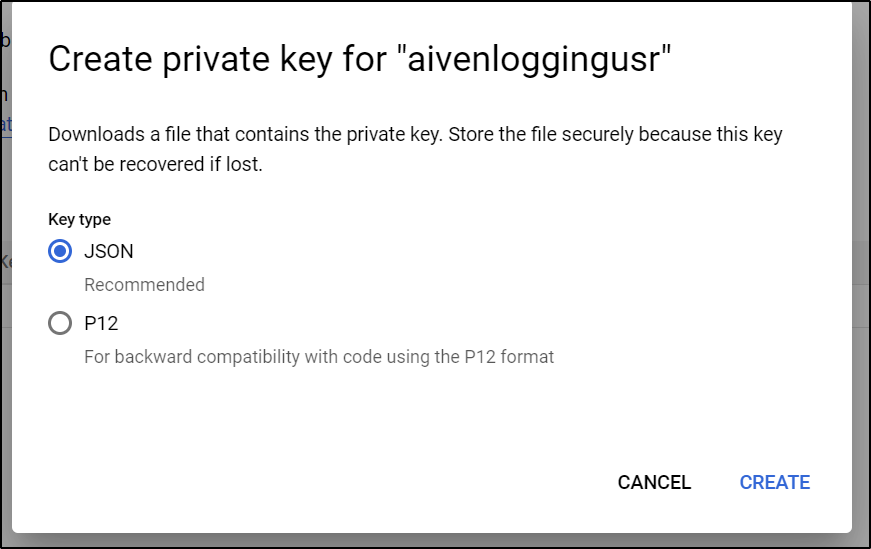
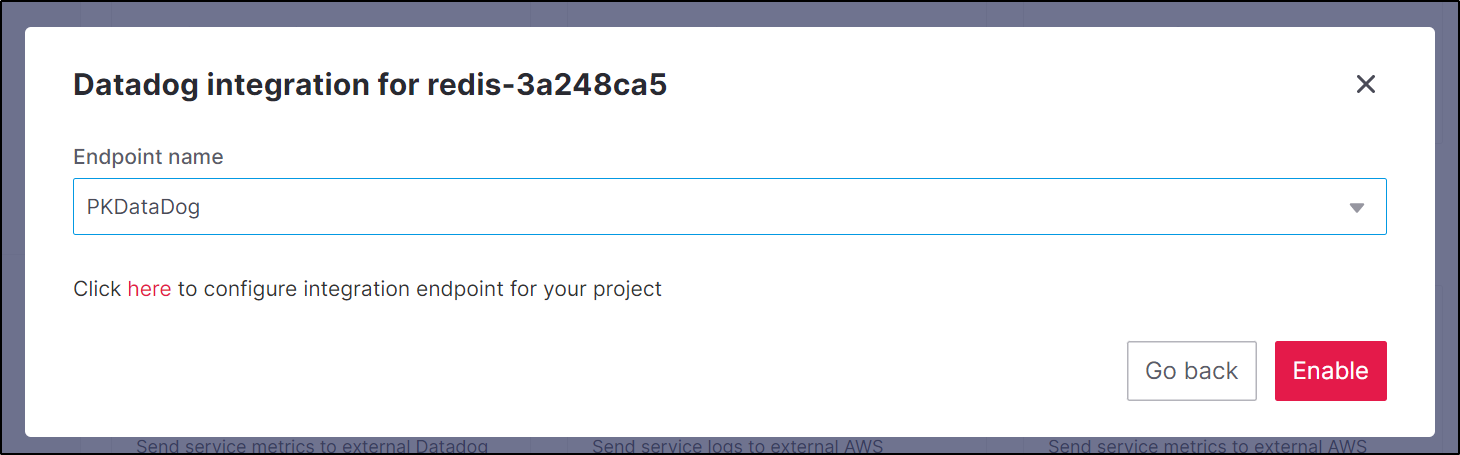
This then downloads it locally. We can now use that in the Aiven.io Integrations setup window
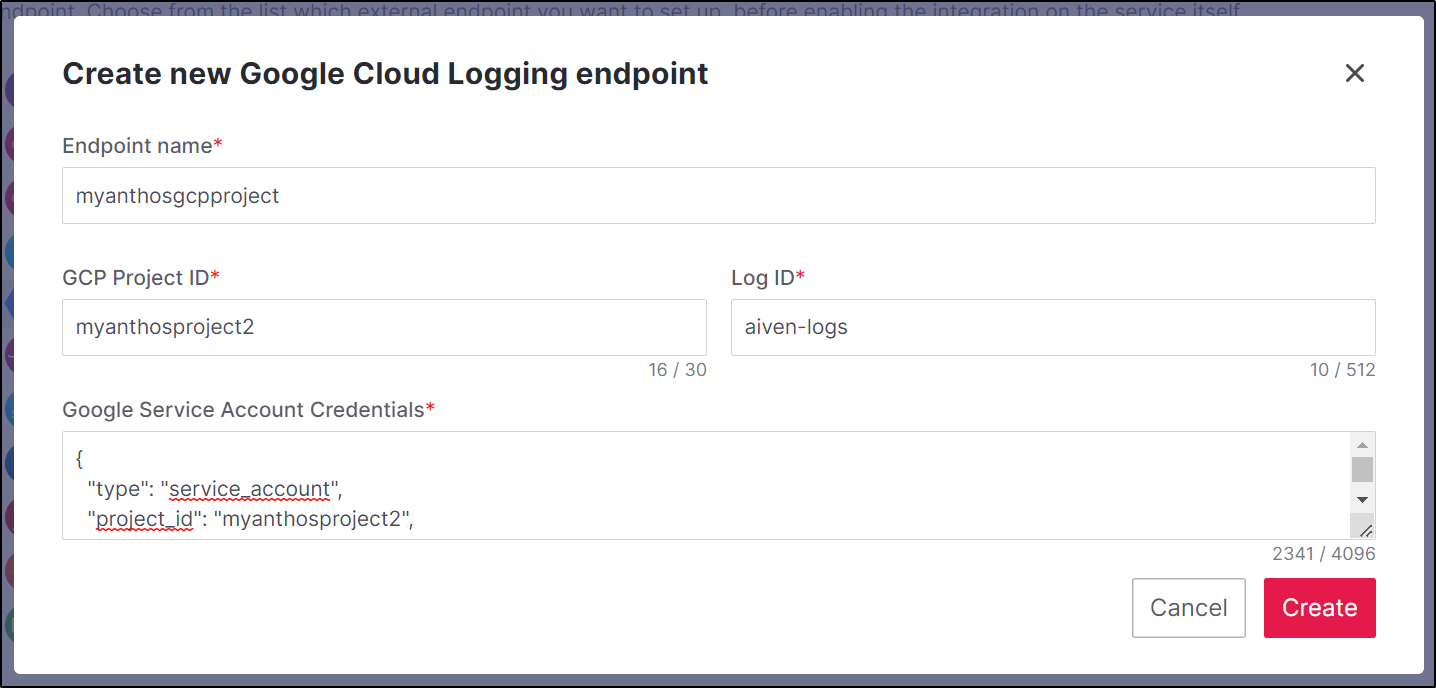
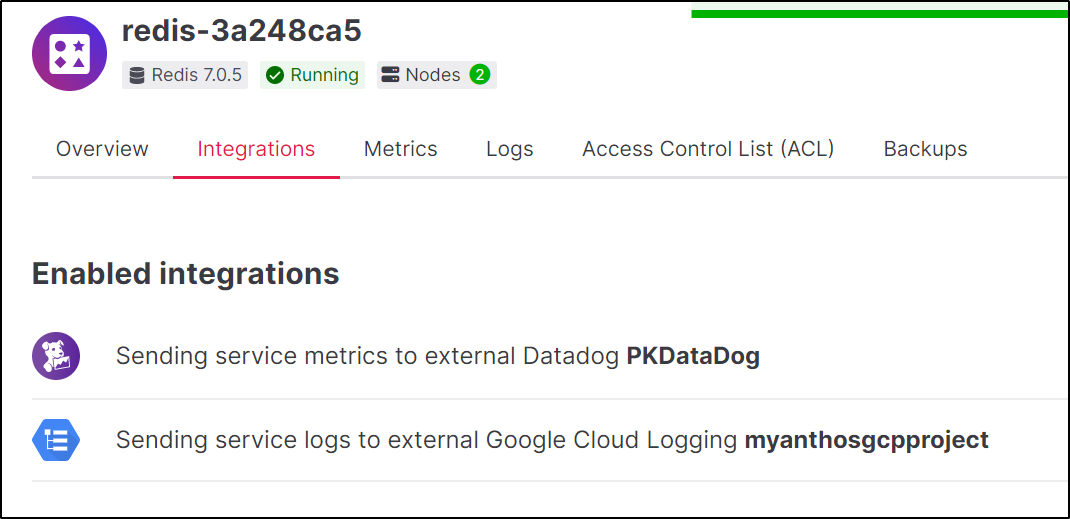
We can now pick that in our Integrations section of the service
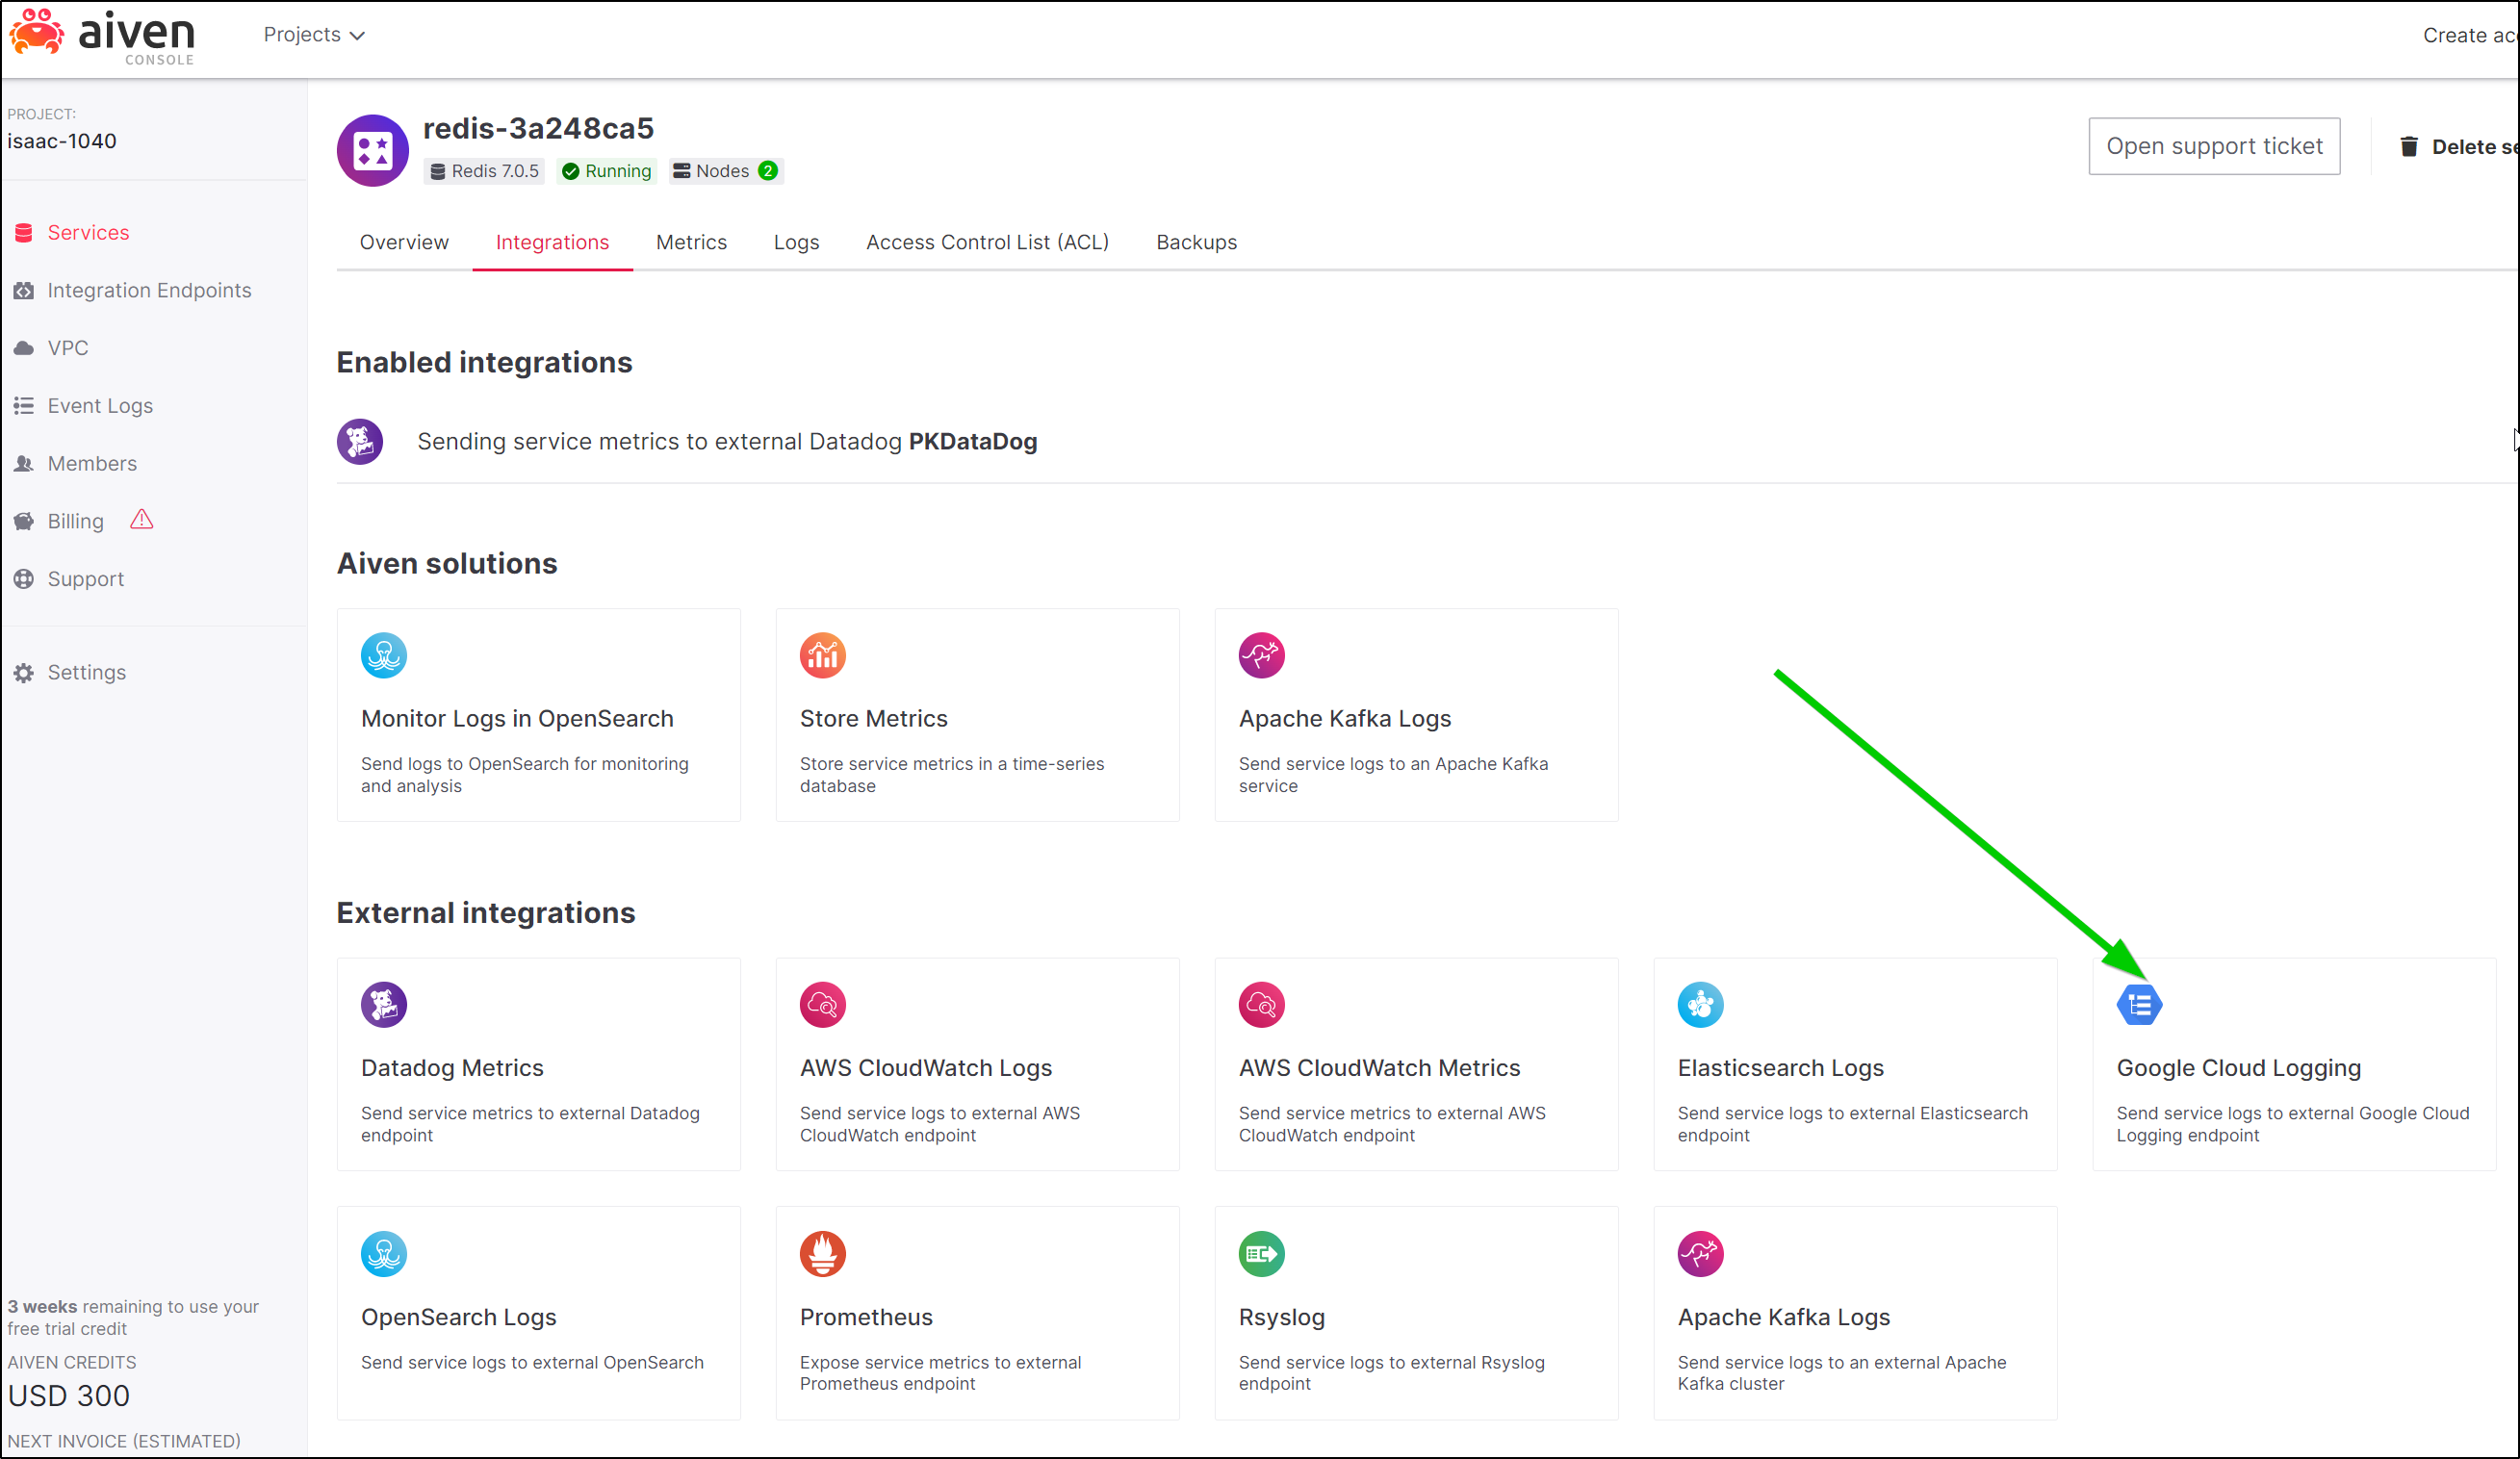
We can now see we are sending Logs to GCP and Metrics to DD for Redis
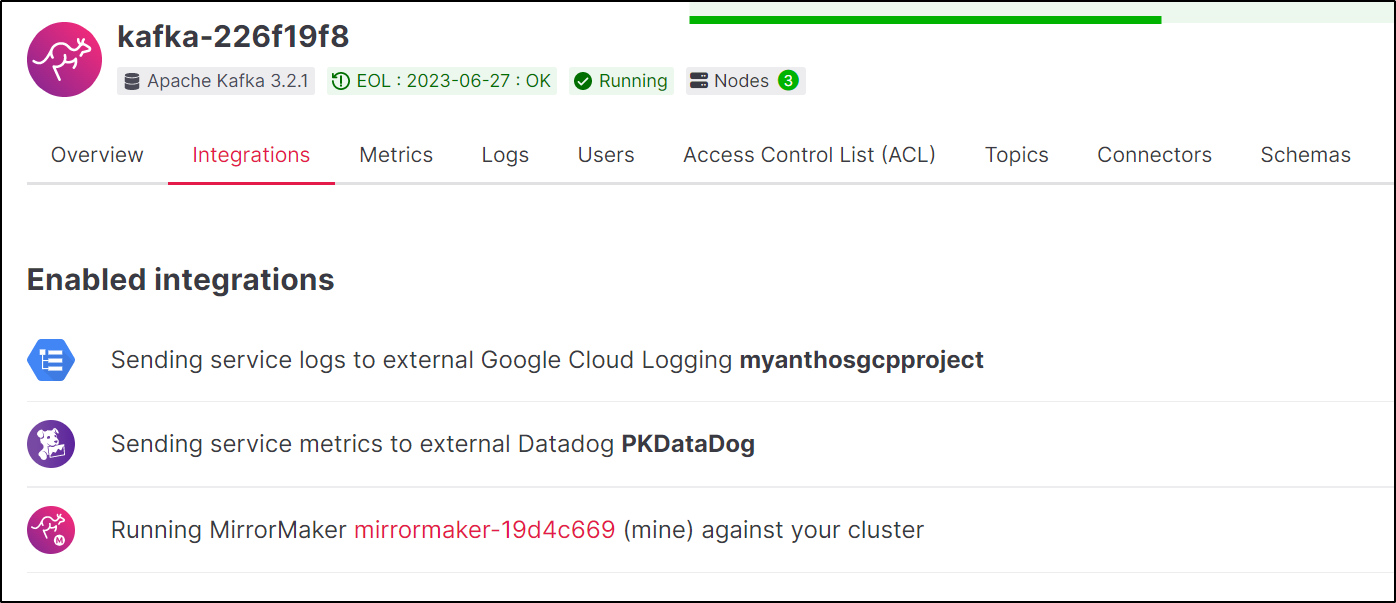
and I can do the same for Kafka
We can almost immediately see the logs show up in StackDriver
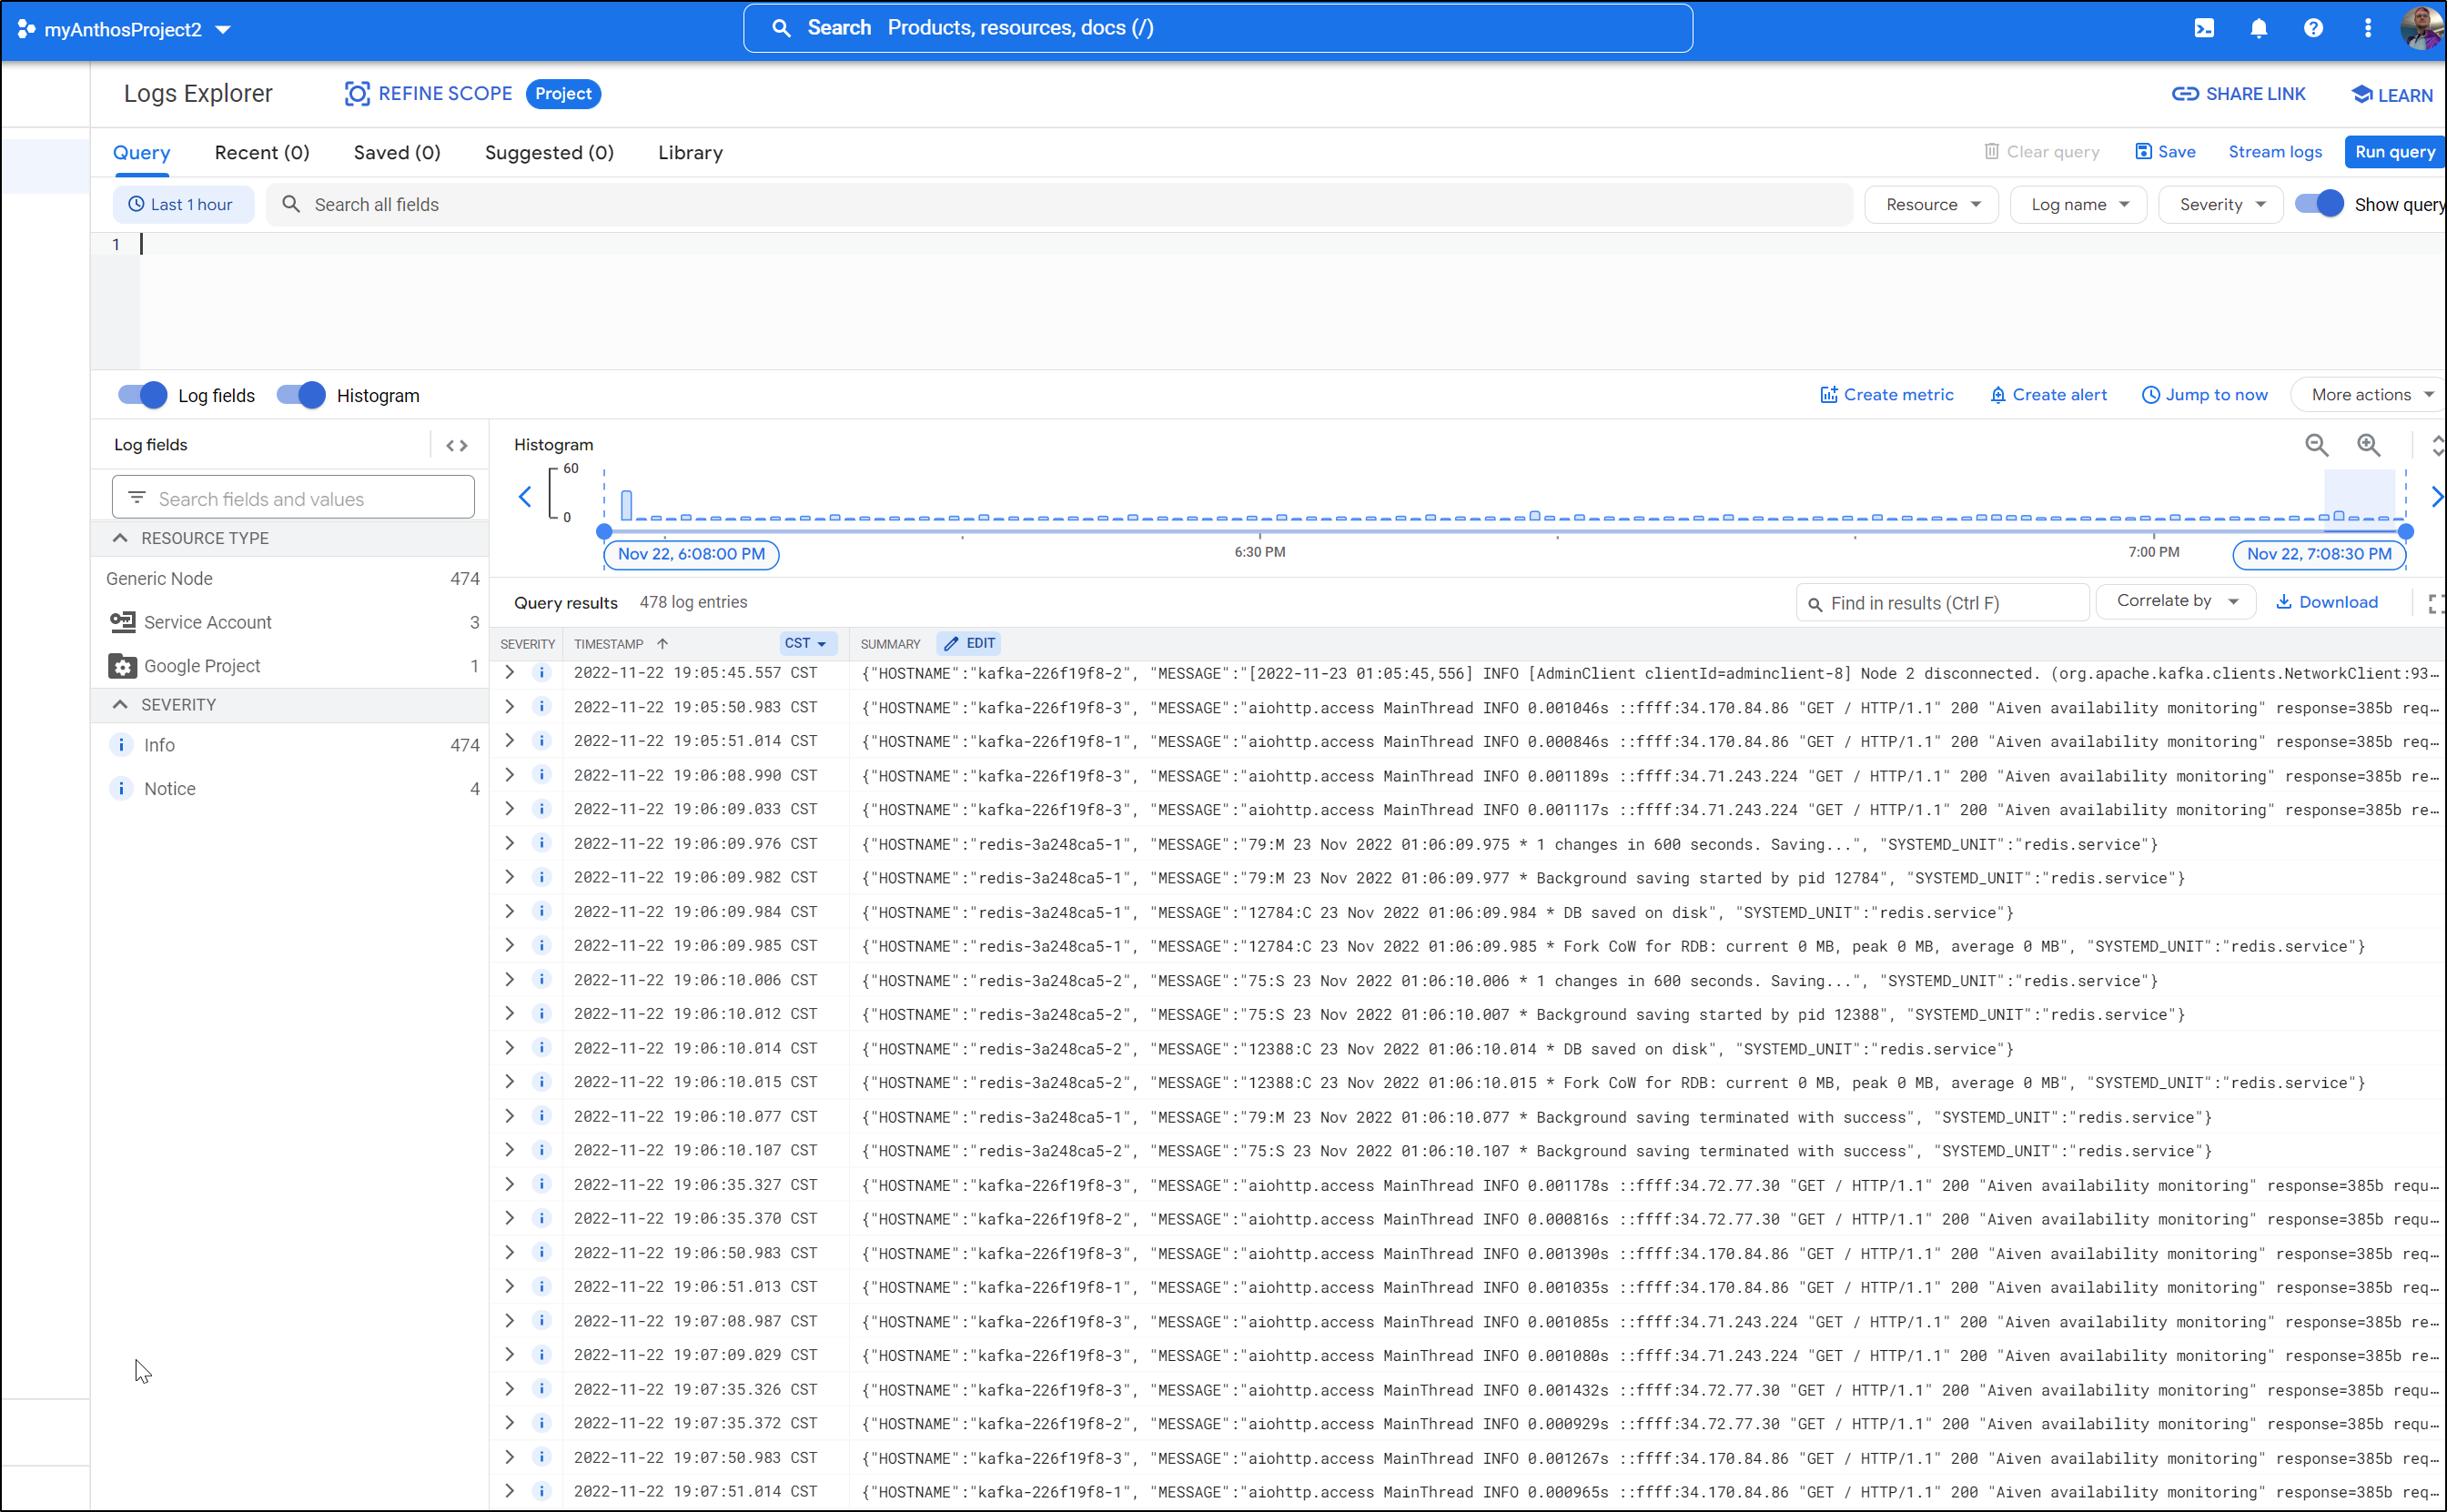
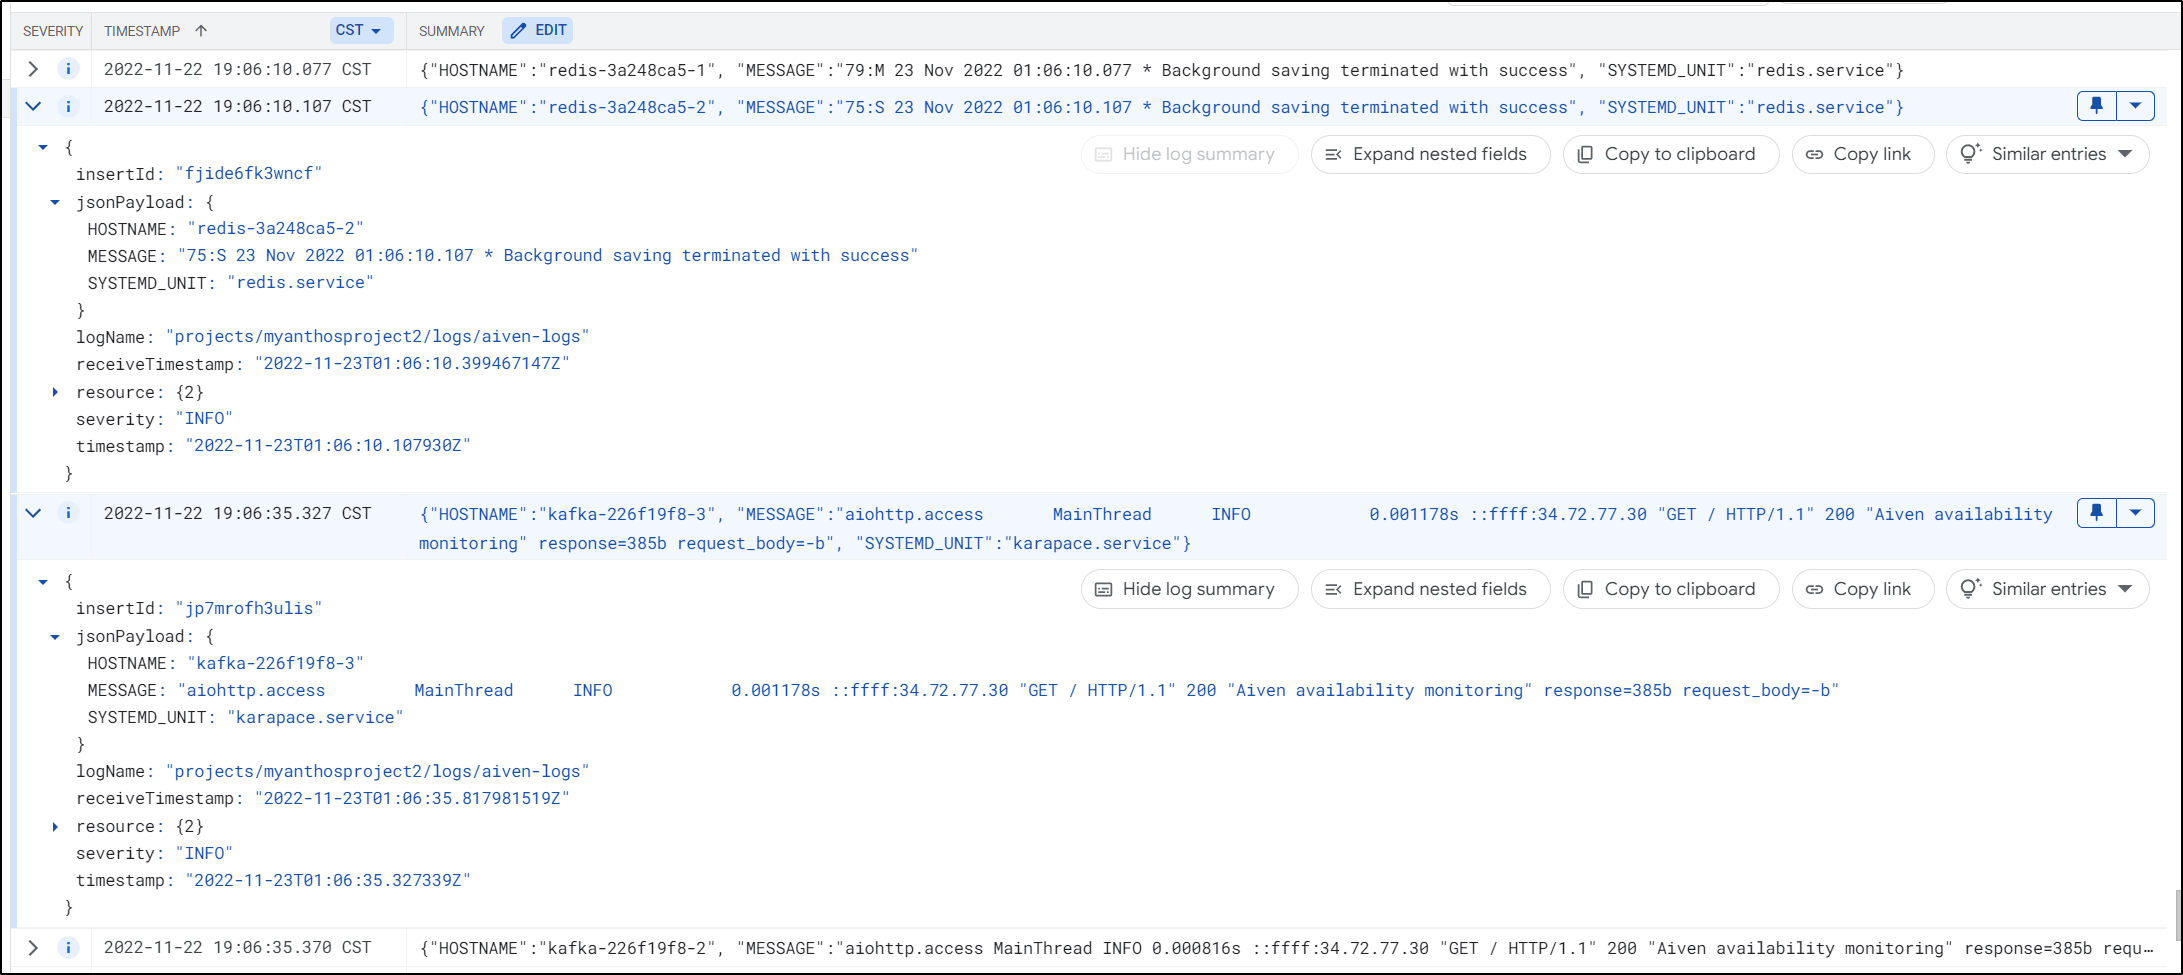
We can see an example of the kind of data being sent into GCP Logging
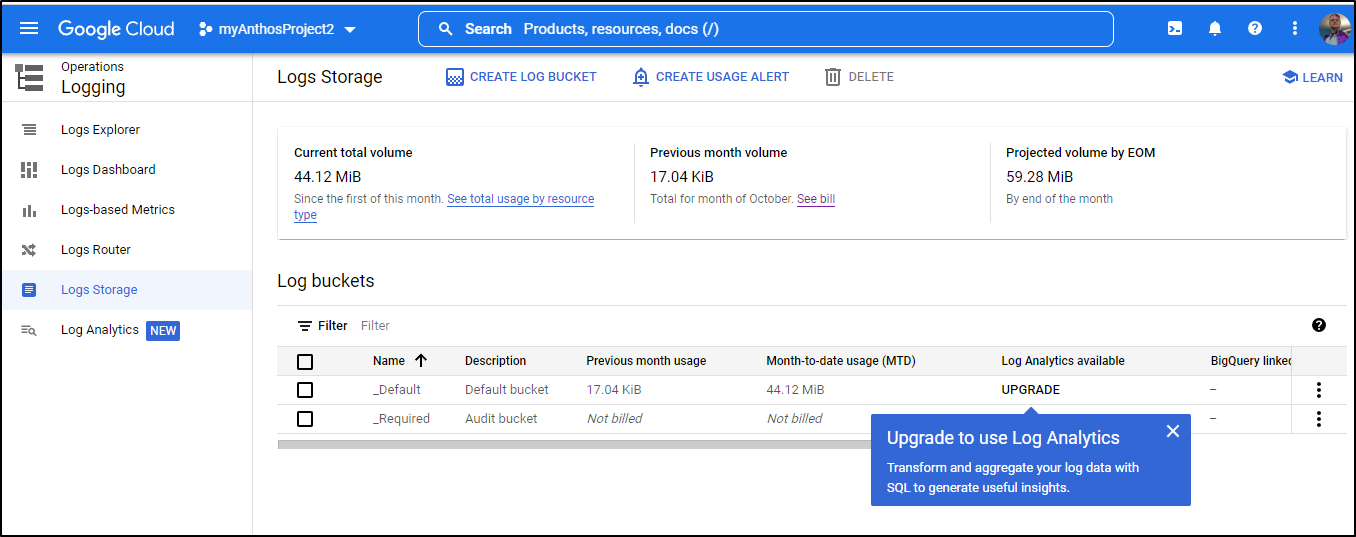
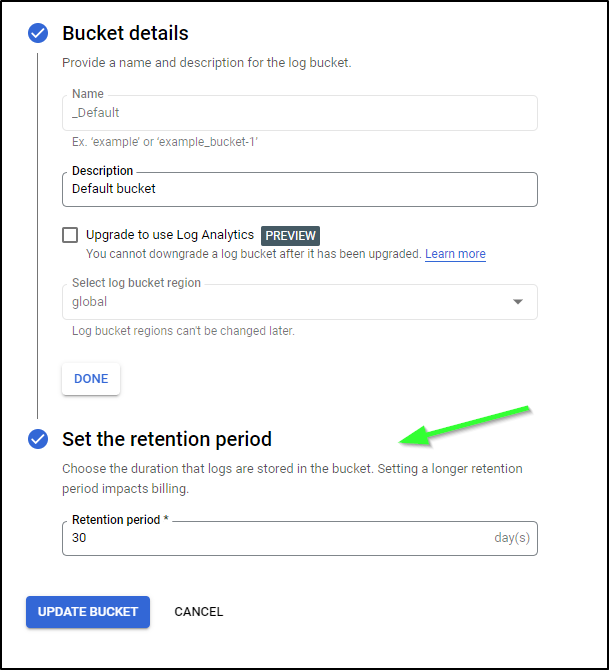
One thing you may want to do to avoid costs building up is to set a log storage retention policy.
We can go to Logs Storage in Logging (the popup upselling advert is GCPs not mine)
Then we can “edit bucket” from the 3-dot menu
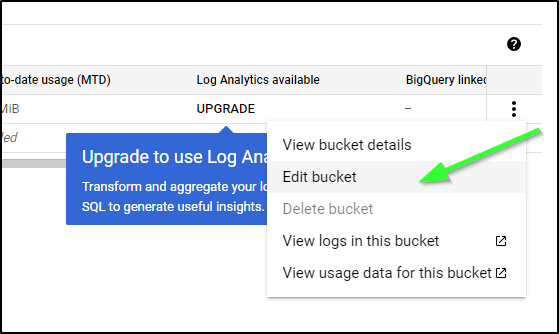
and set a value lower if you need to
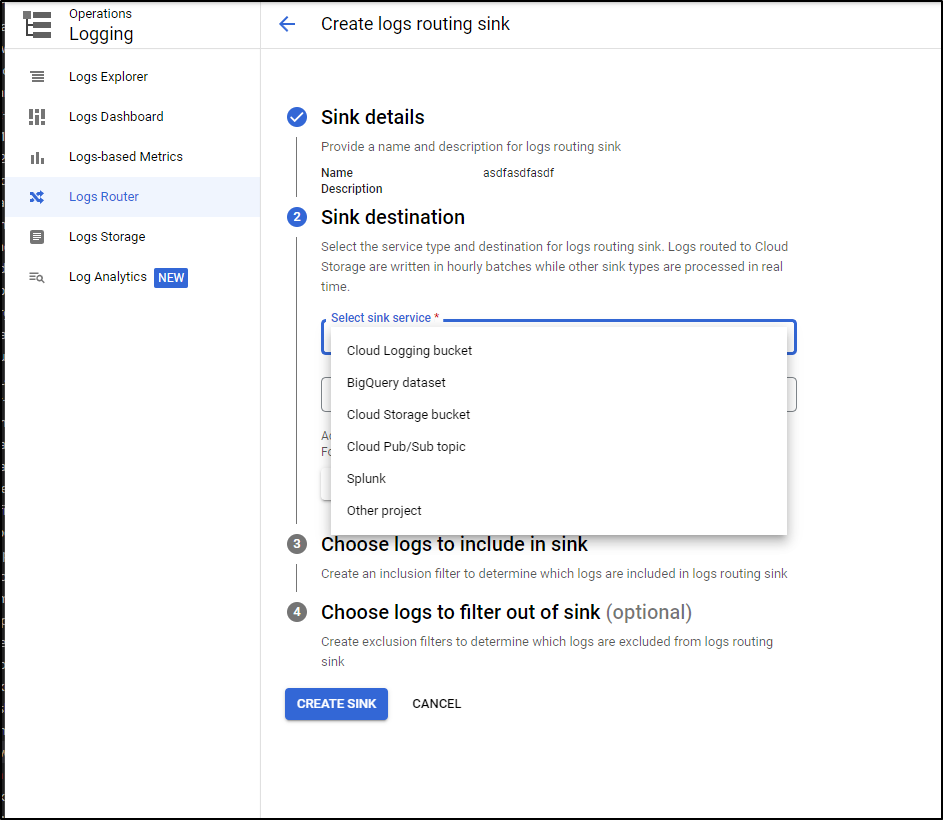
We can also create a Sink from GCP Logging if we want to send to pub/sub (to send to Datadog) or directly into Splunk
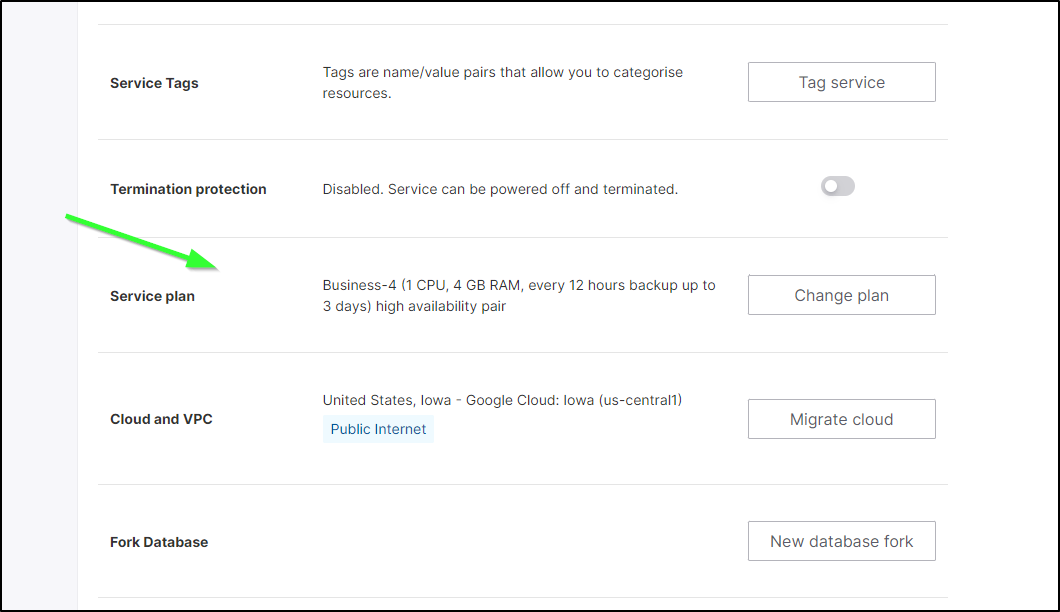
Scaling a service
We saw how to create a service in the UI, but what if we want to scale up or down our instance?
We just need to change the plan
For instance, I can move from teh US$200/mo plan for Redis down to the smallest business $70/mo
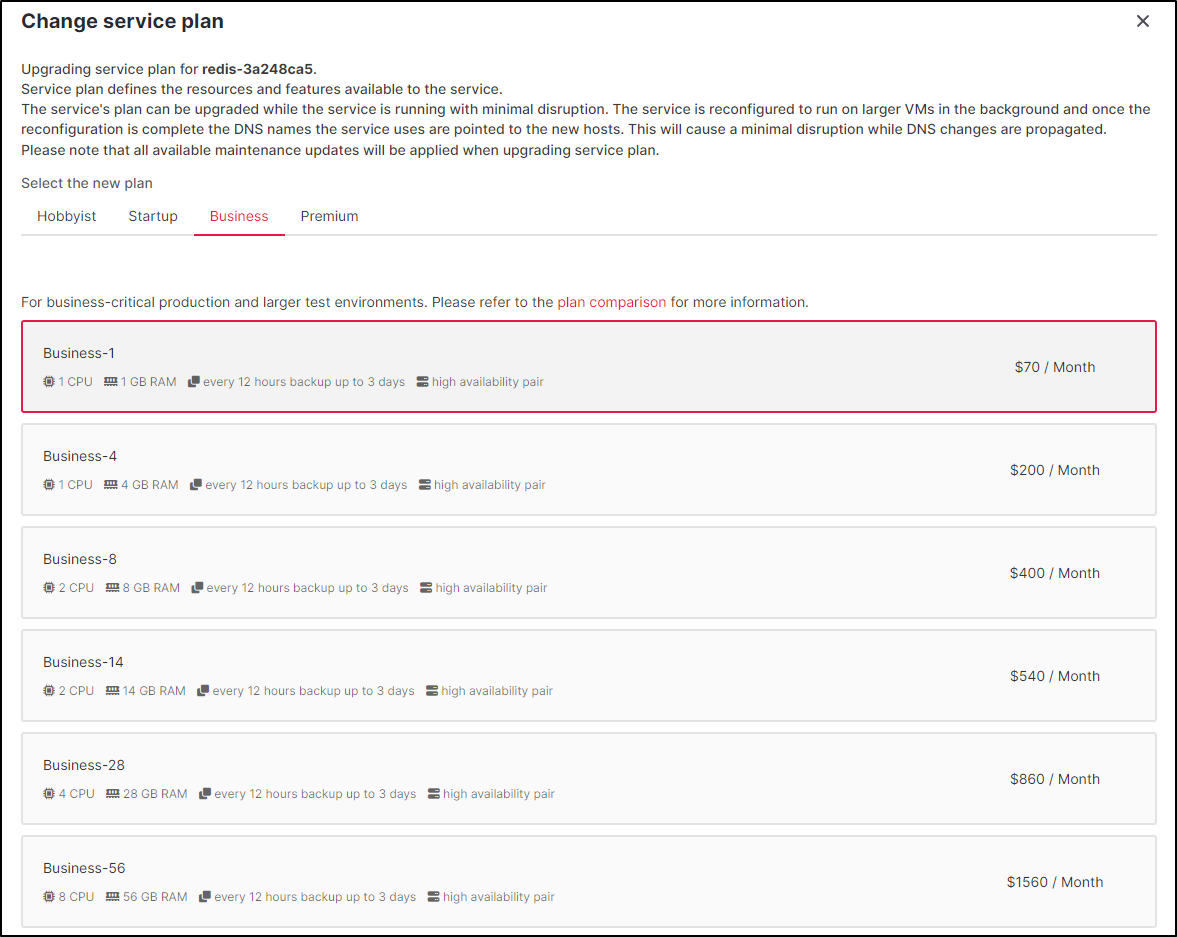
The plans, for Redis, at the moment go from US$19/mo
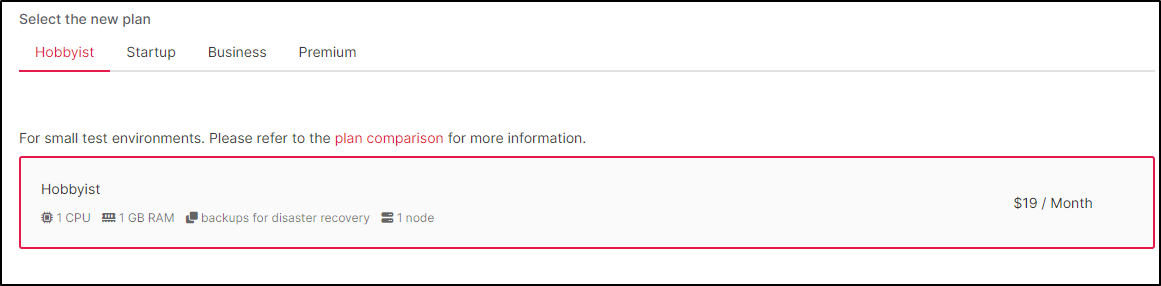
Up to $8150/mo for the largest in GCP
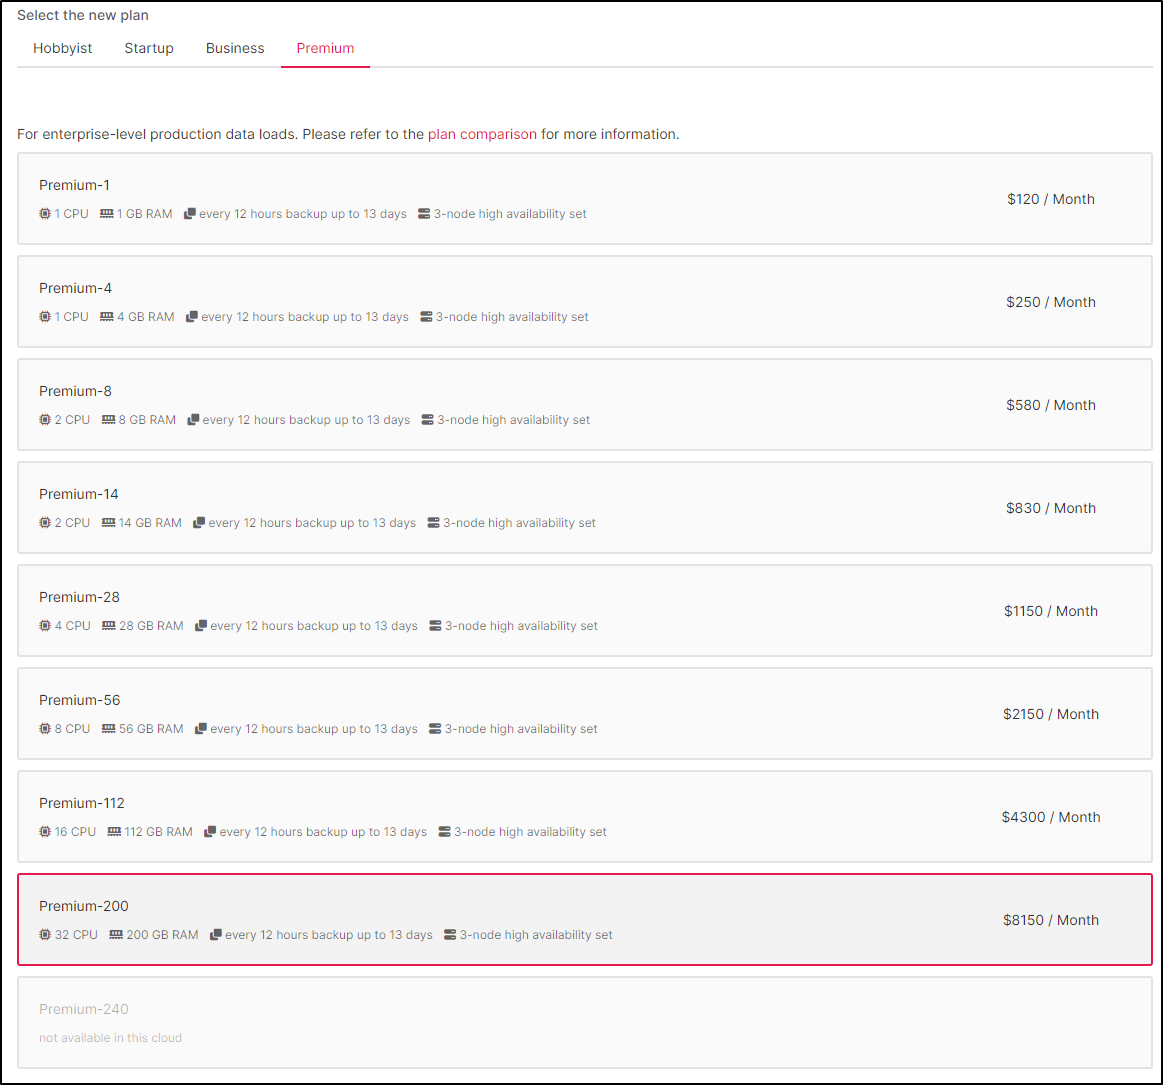
And again, these prices are by month and I believe (but do not know) that pricing is hourly. Thus, if we wanted to fire up the largest Redis for a test run, an hour would be roughly US$11.16 for that hour which isn’t bad if testing a system under load.
Cloudwatch logs
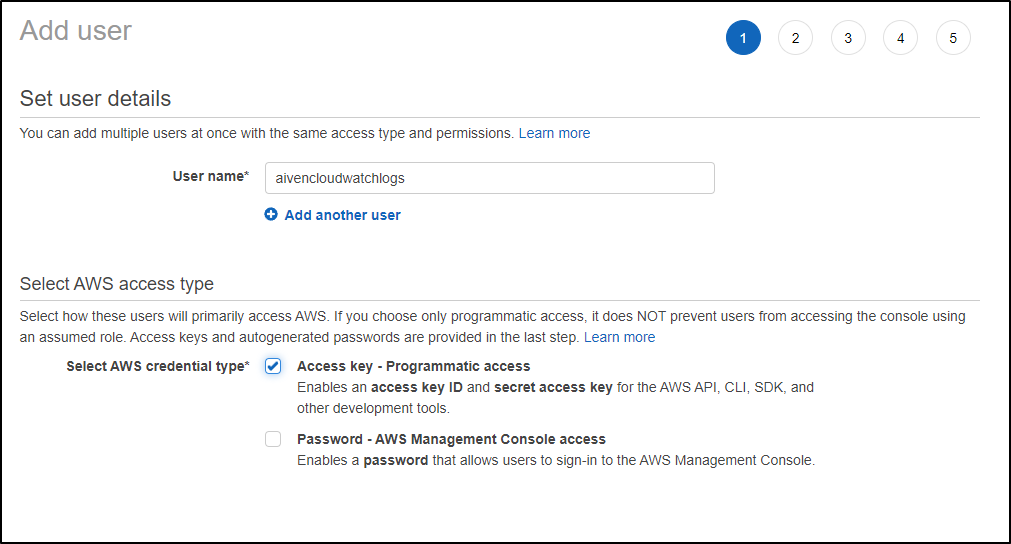
Before we can send logs to Cloudwatch, we need an IAM user setup
In AWS IAM, I’ll create a user with only programmitic access
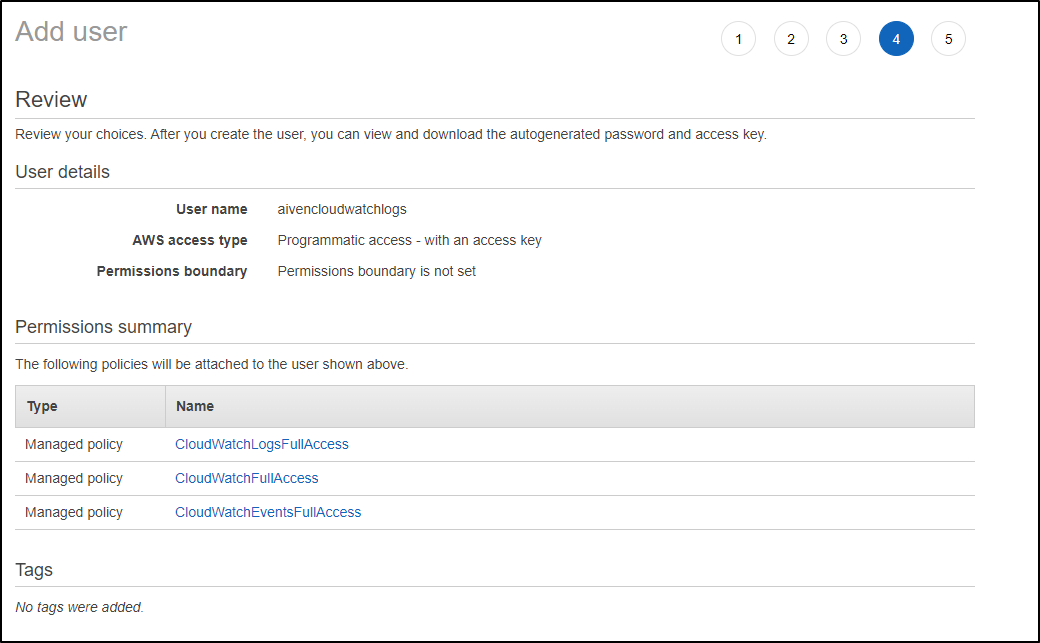
The policies you pick largely depend on what you plan to do with this IAM user. If you want to just send logs, CloudWatchLogsFullAccess would do it. If you want Metrics, use CloudWatchEventsFullAccess. If you think you may want both, just use CloudWatchFullAccess.
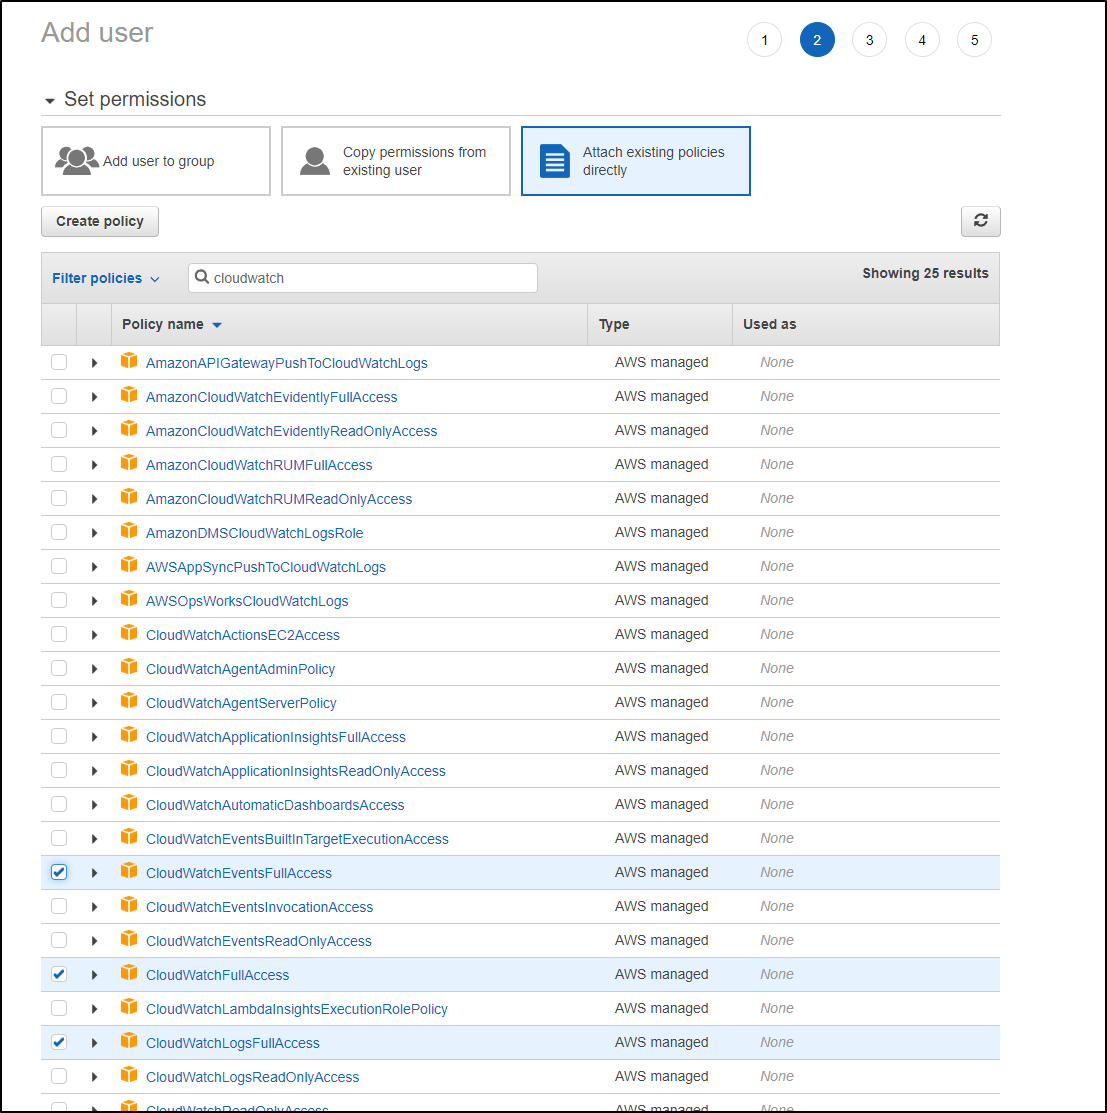
I’ll just use all three and create my user
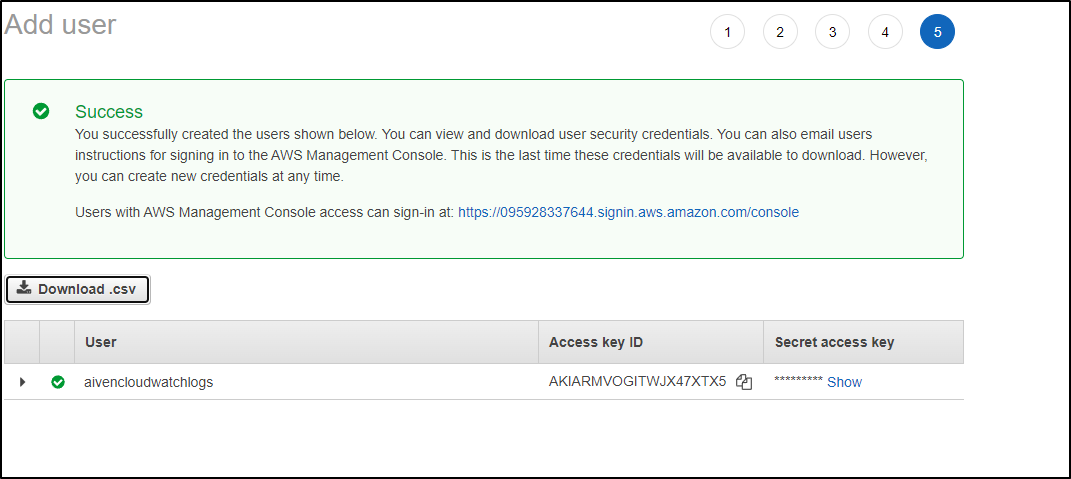
You can then get your IAM ID and Key
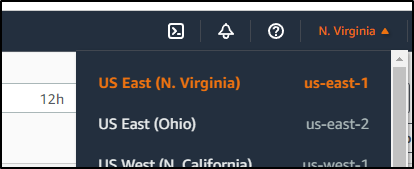
Lastly, you’ll want to determine the region. For no particular reason, I tend to use us-east-1
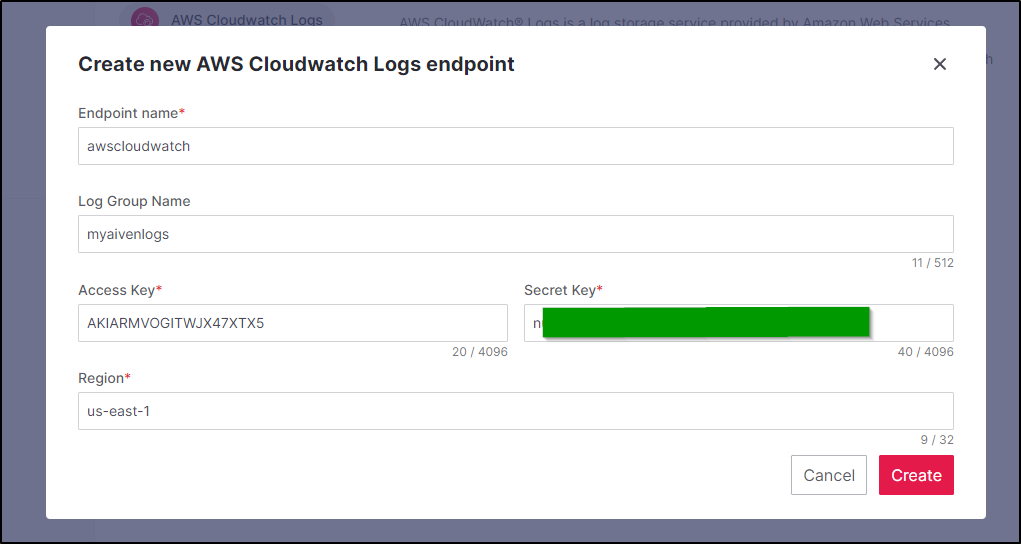
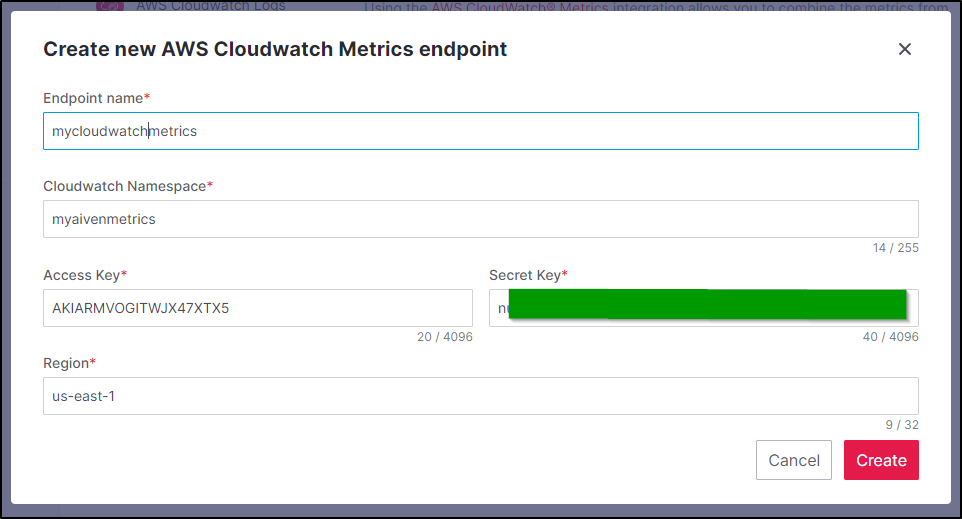
Back in Aiven.io, we’ll add the AWS Cloudwatch Logs Endpoint
Since I’m here, I’ll also handly the CW Metrics
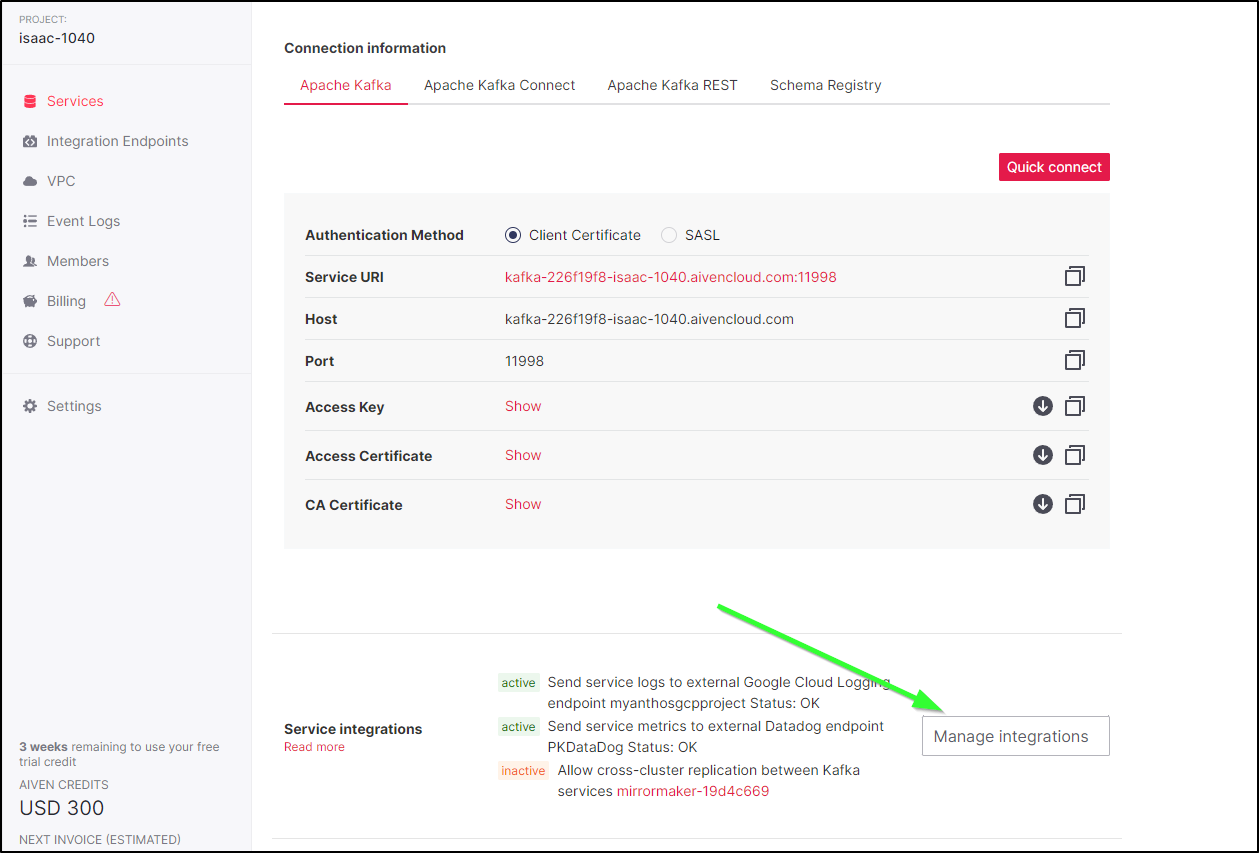
I’ll pick a service, such as Kafka, and click Manage Integrations
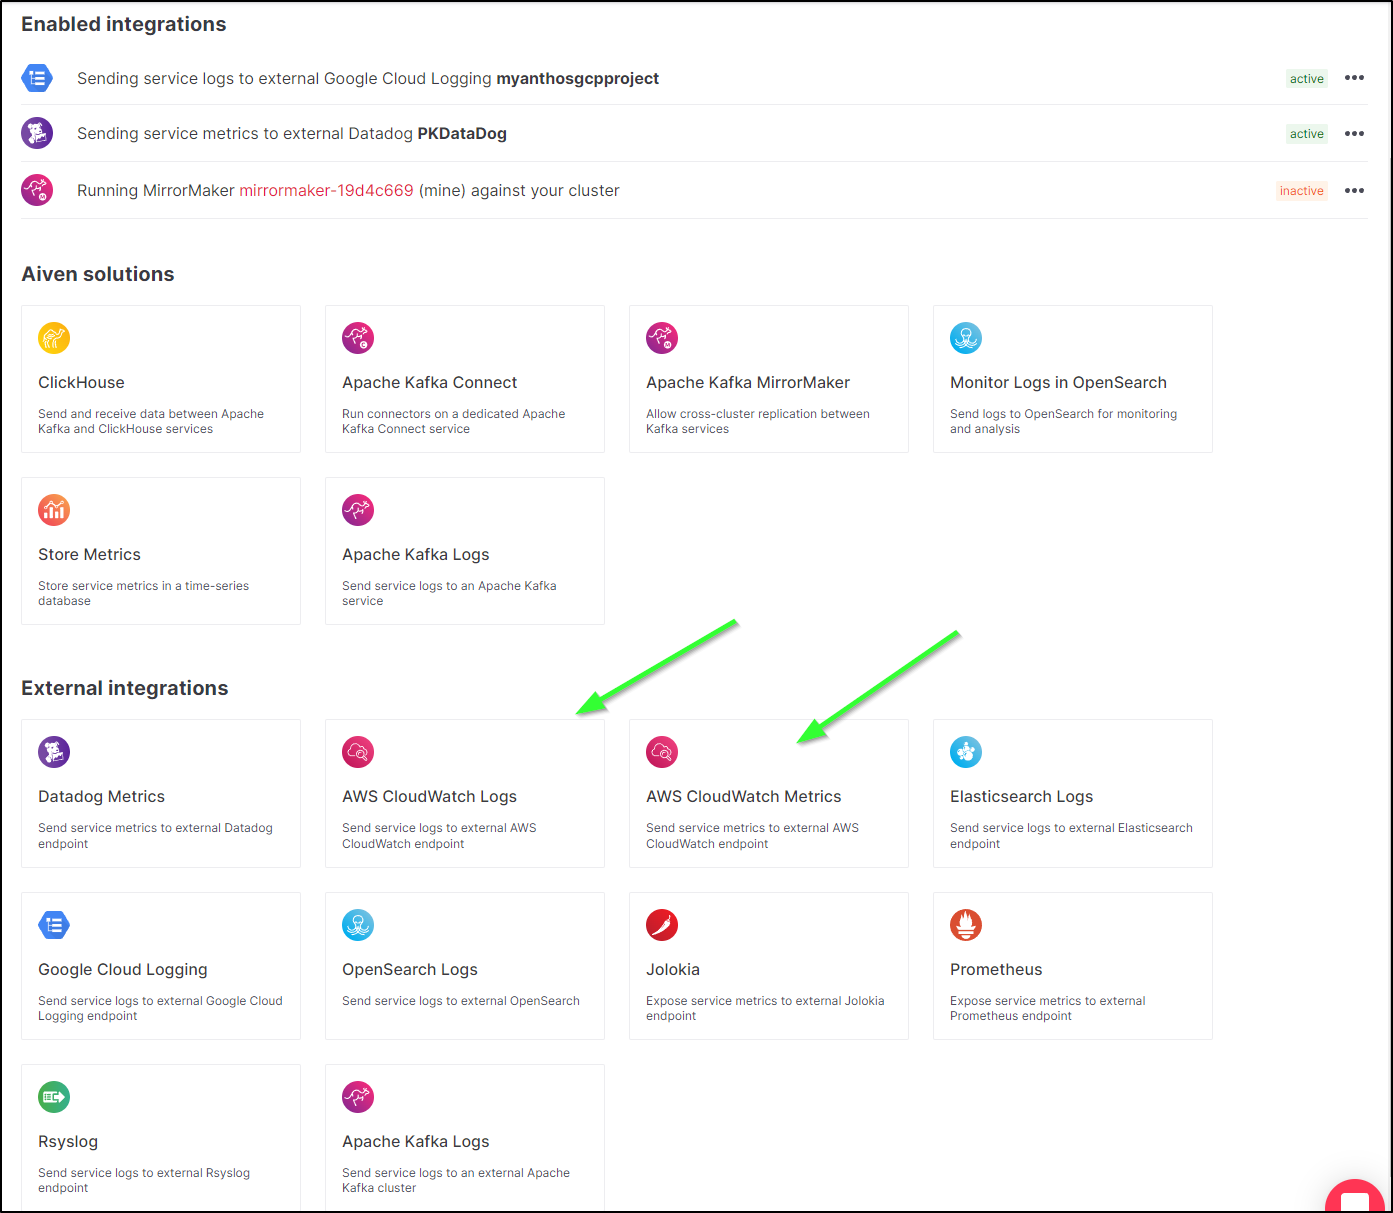
I’ll then add Cloudwatch Logs and Metrics
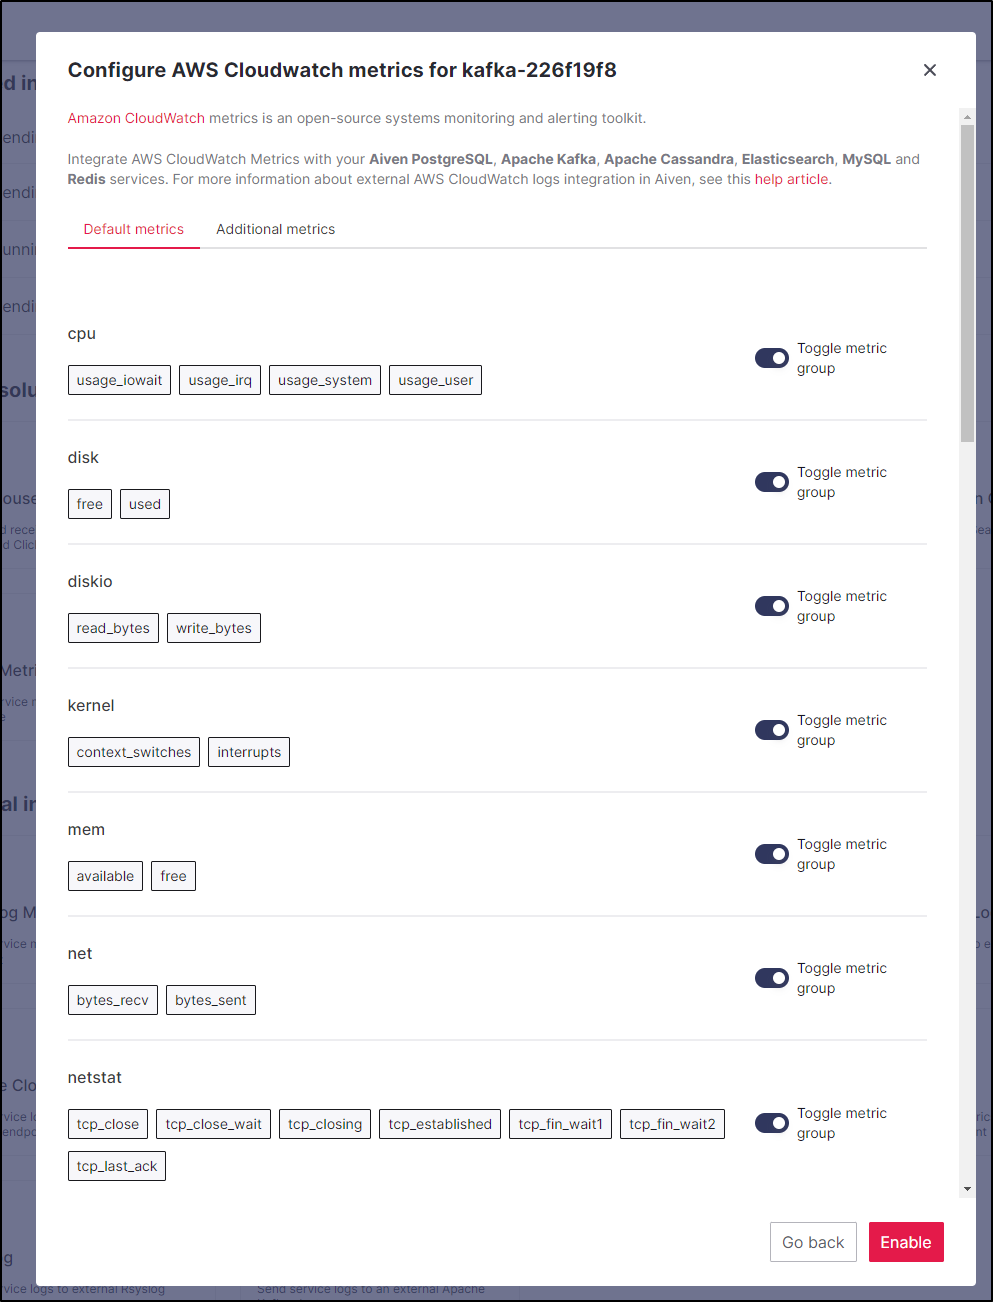
When adding Cloudwatch Metrics, you can chose which Metrics you want to send to AWS Cloudwatch (by default, all are enabled)
Immediately, I saw Aiven logs appear as a new Group in AWS
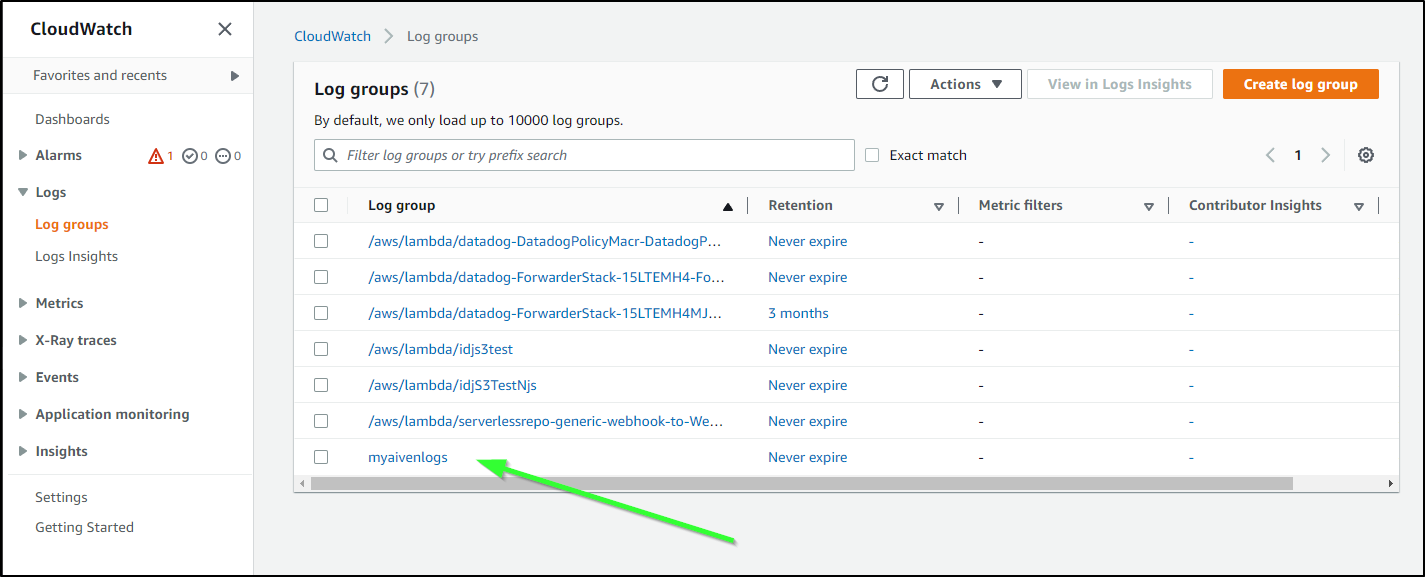
You’ll see that log streams have been added retroactively for past logs - not just logs going forward
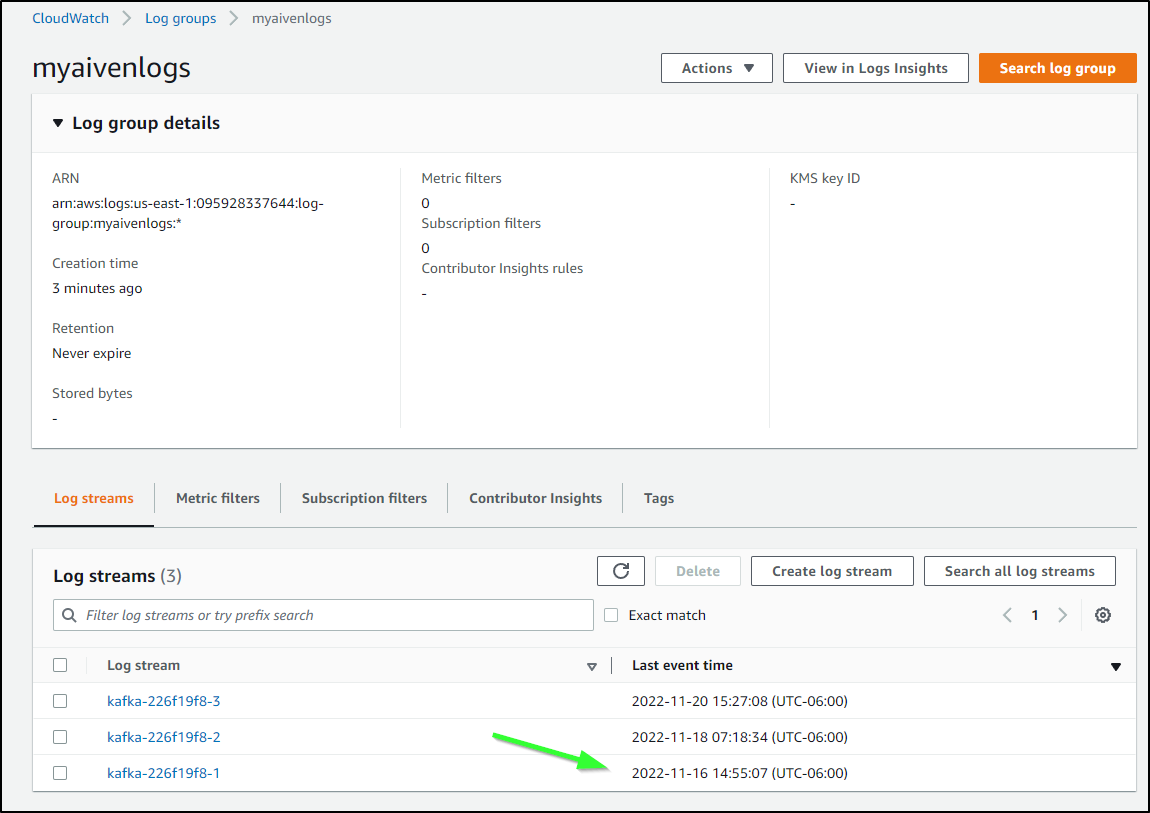
If I explore one to see the messages being delivered
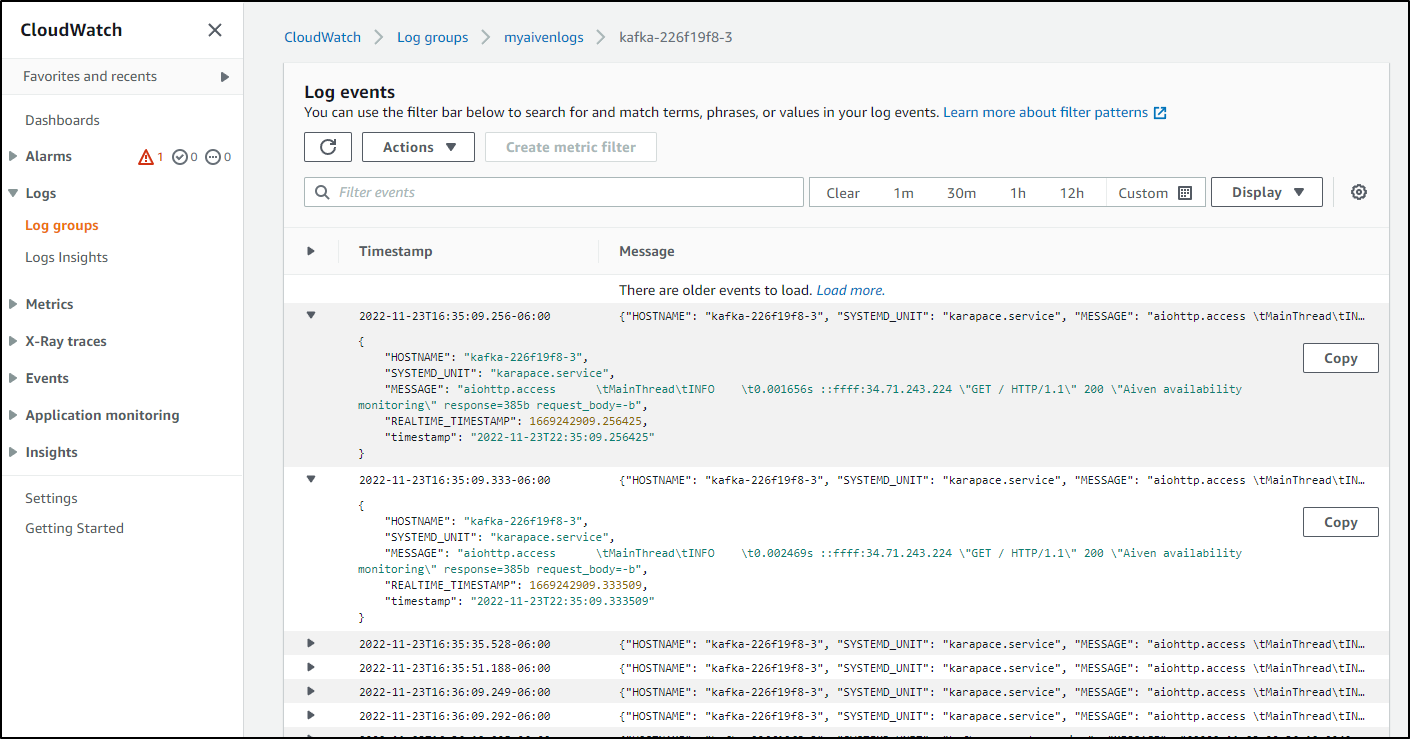
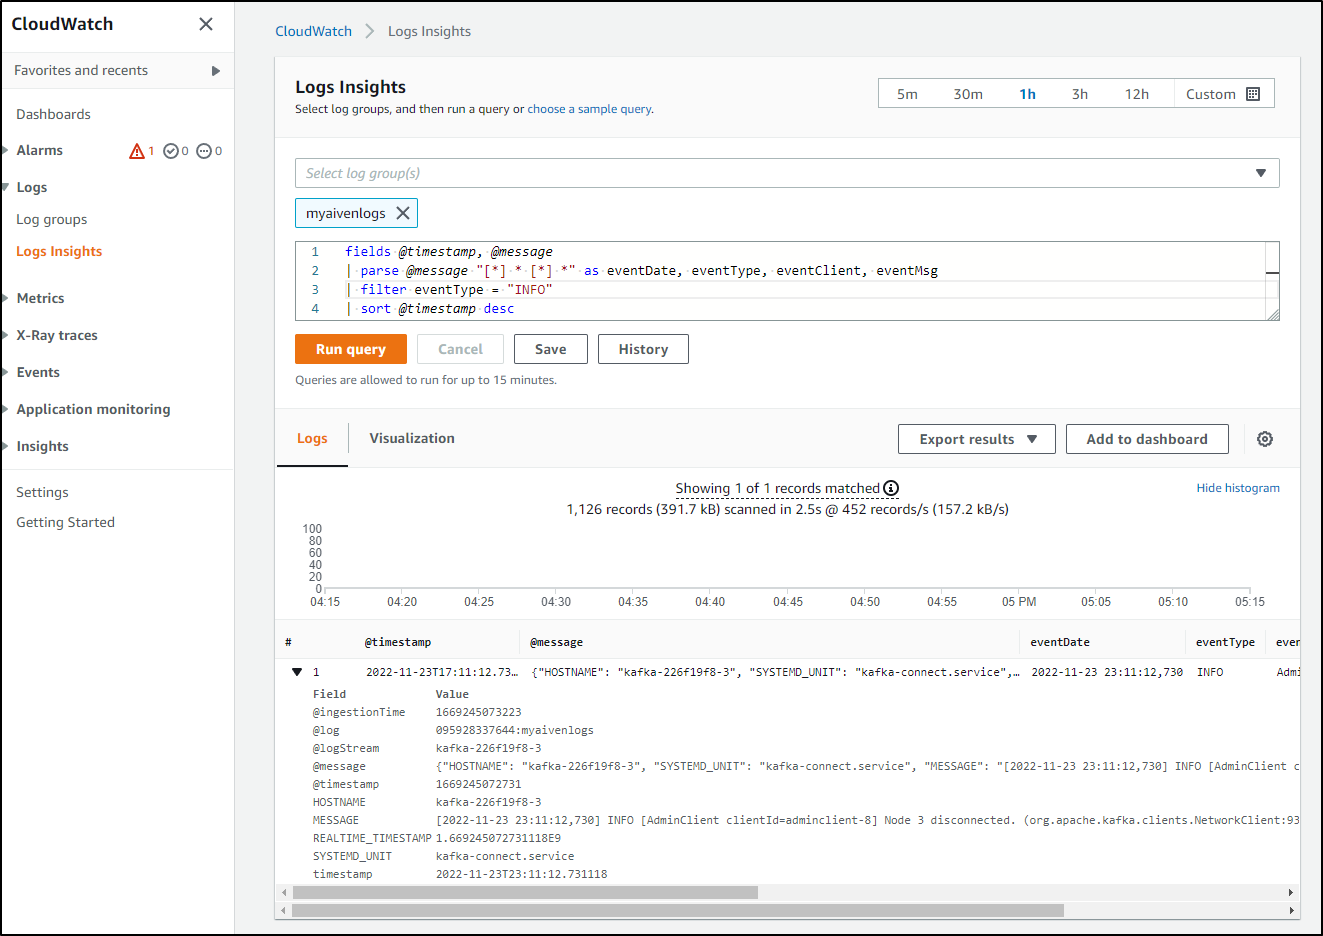
That means I can use the logs in Logs Insights to parse and find certain types
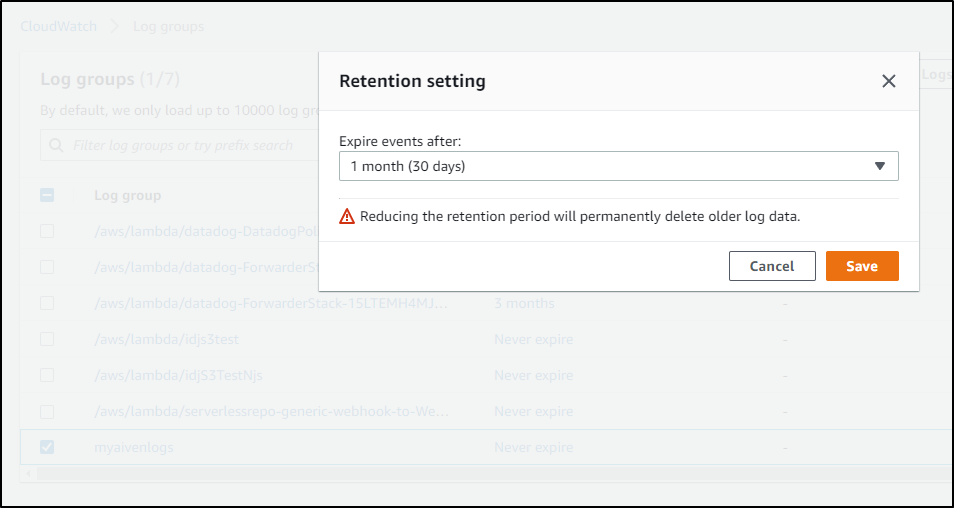
As always, I like to point out that logs that are infinitely stored can really start to cost over time. I recommend going to the retention settings:
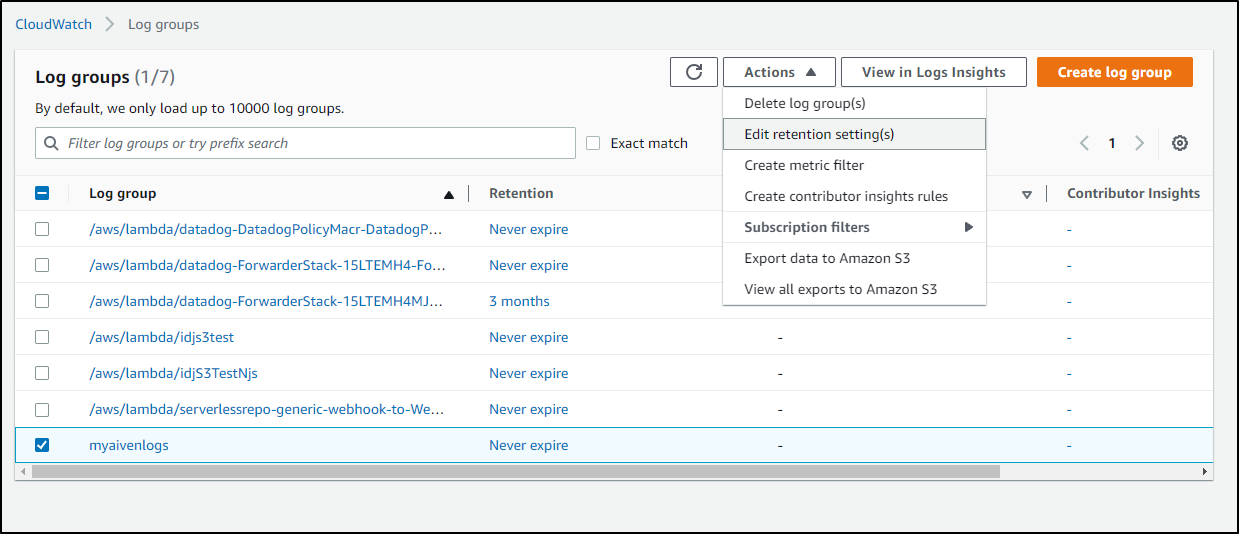
and reducing to the minimum duration you care about
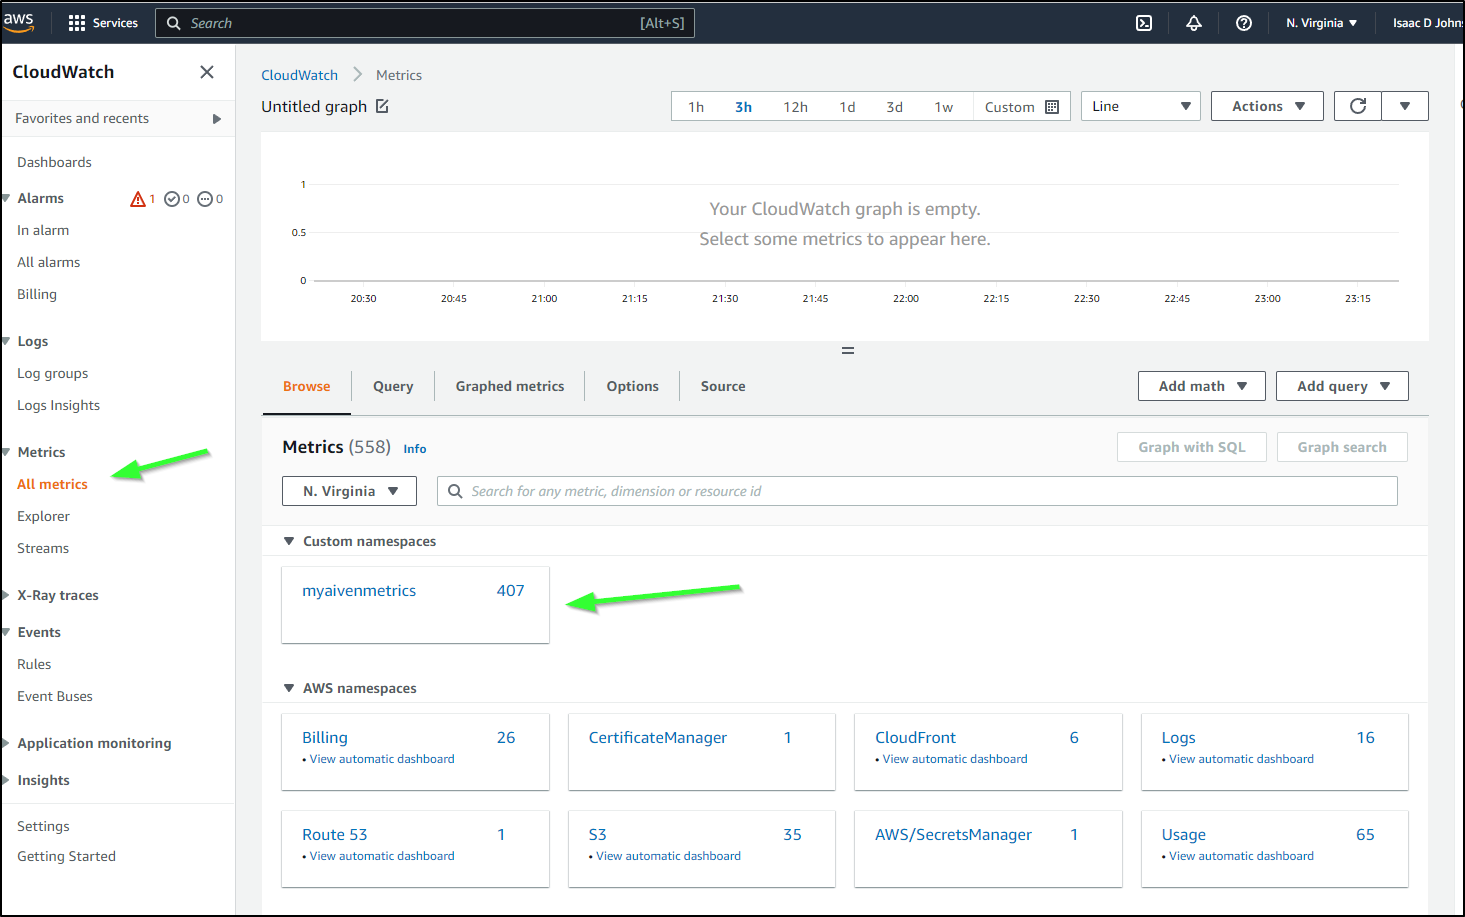
AWS Cloud Metrics
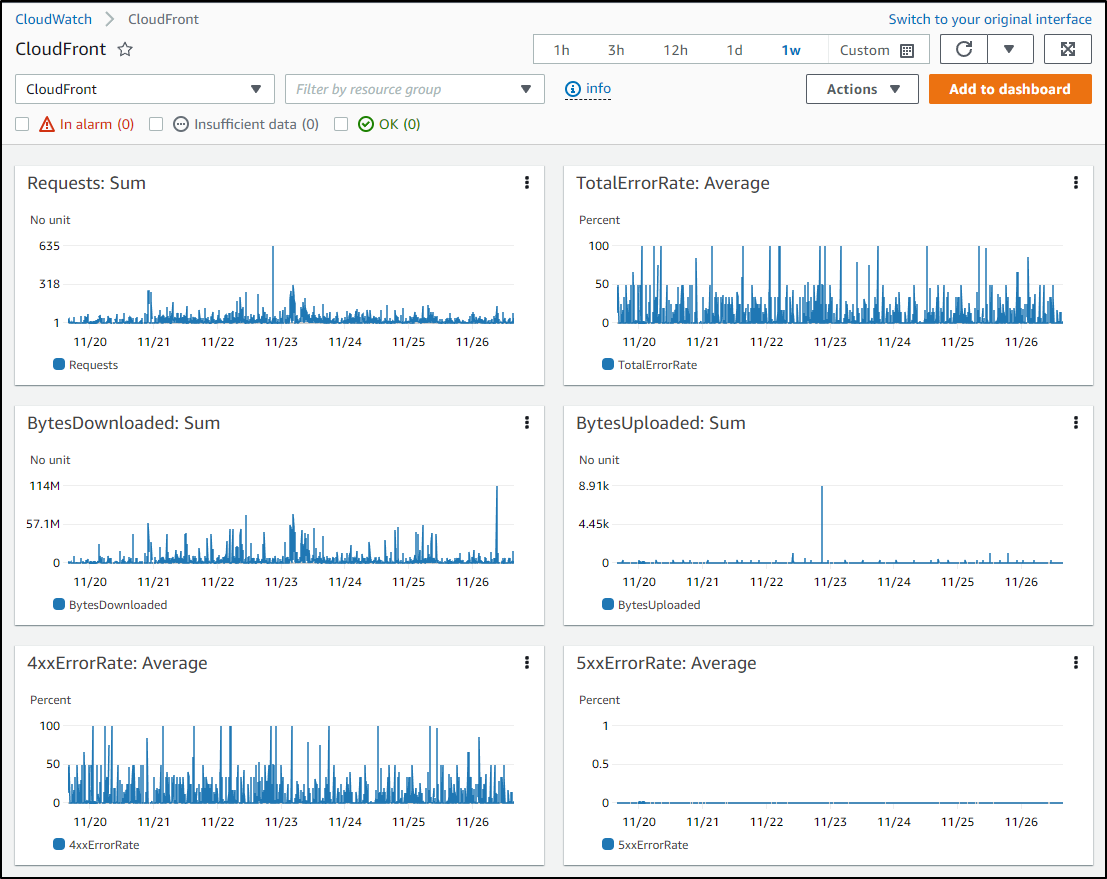
As you recalled, like logs, we sent Metrics to AWS as well
We can see those in Cloud Metrics
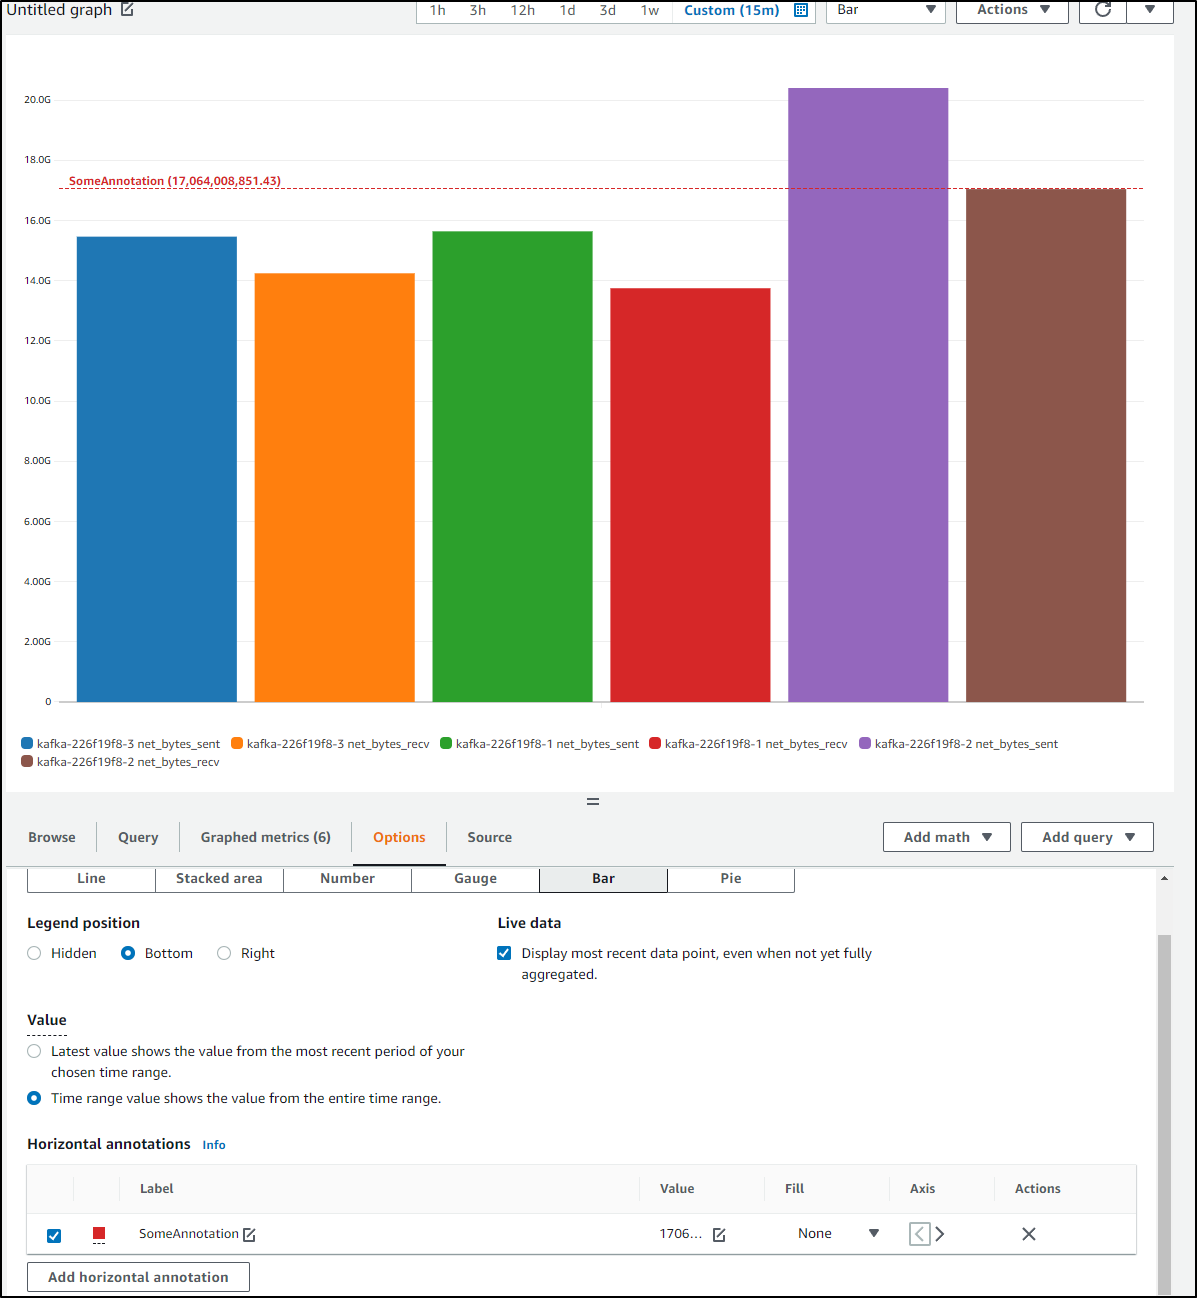
With Metrics, I can create graphs, such as bytes received by Kafka
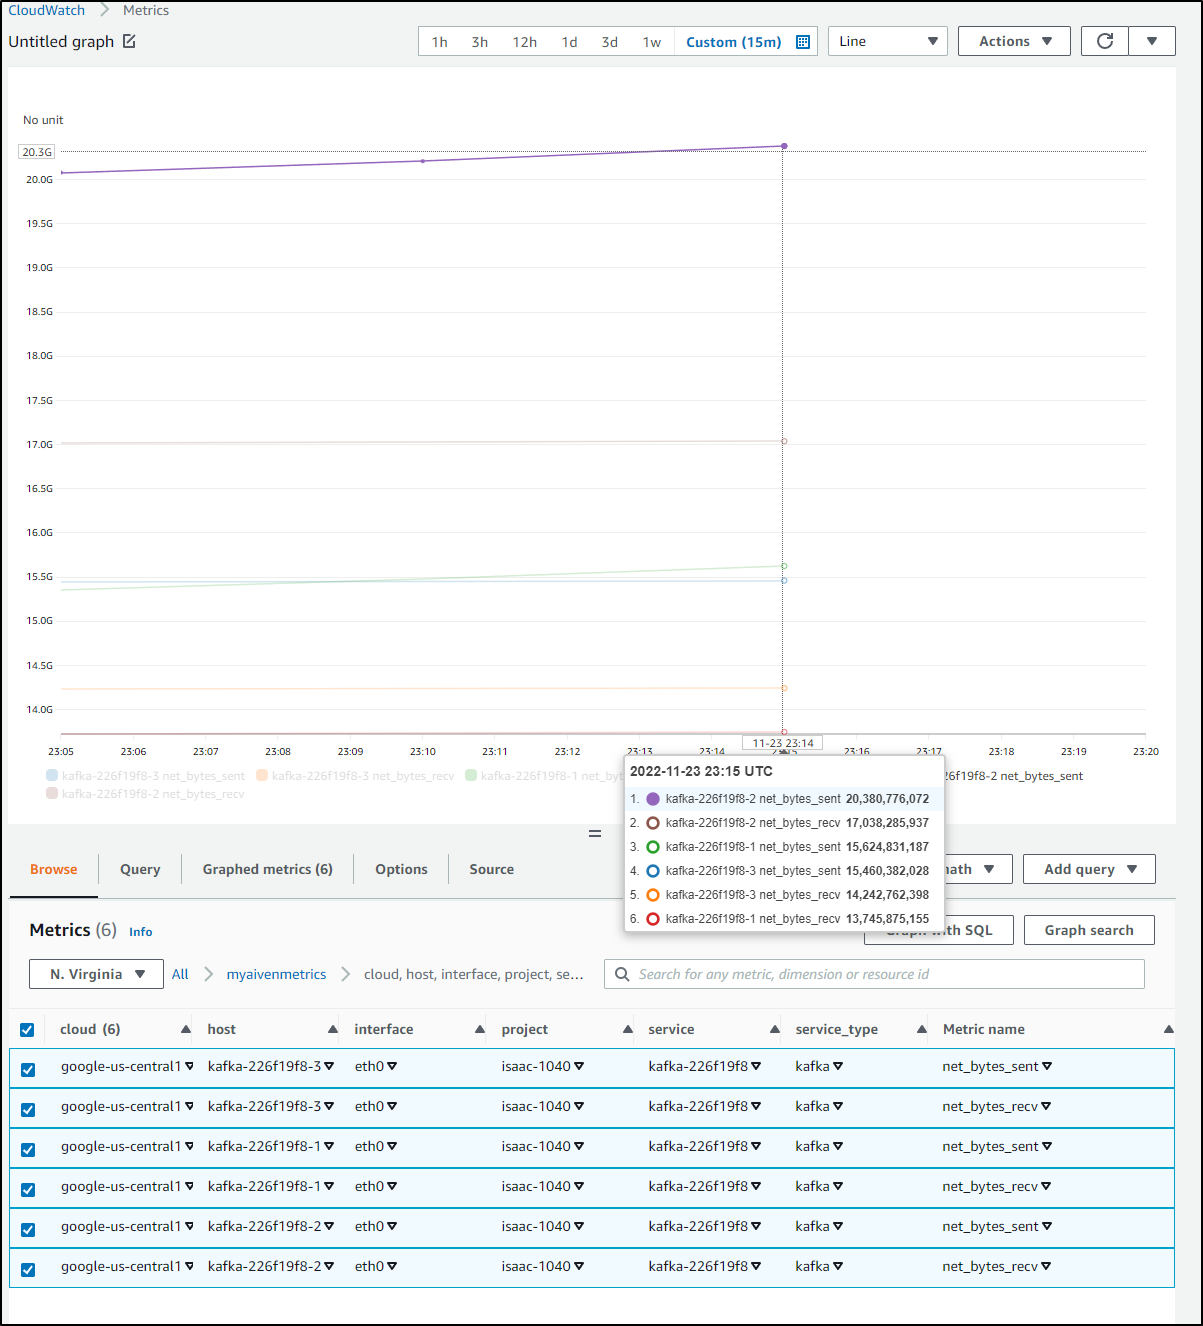
Perhaps tweaking the style or adding annotations
In time, we can see plenty of data gathered from Aiven
Summary
Today we looked at setting up a hosted Redis instance in Aiven.io. We setup an IAM user and showed how to set up AWS CloudWatch for Metrics and Logs. We demonstrated integration Aiven.io logs and metrics into AWS and also showed how to minimize costs.
We can now use CloudWatch with SNS to trigger SNS alerts or Lambdas.
In our next blog, we’ll wrap the series looking at Grafana, InfluxDB for monitors and alerts.