Published: Feb 22, 2022 by Isaac Johnson
My colleague Paul pointed out a really amazing toolset with which I’ve become rather smitten; k9s. It is a fully OSS Kubernetes CLI tool that does a whole lot of things while staying within the command line. Commands are quick (very ‘vi-like’) and you can drive about your cluster without ever having to lift your fingers from the keyboard.
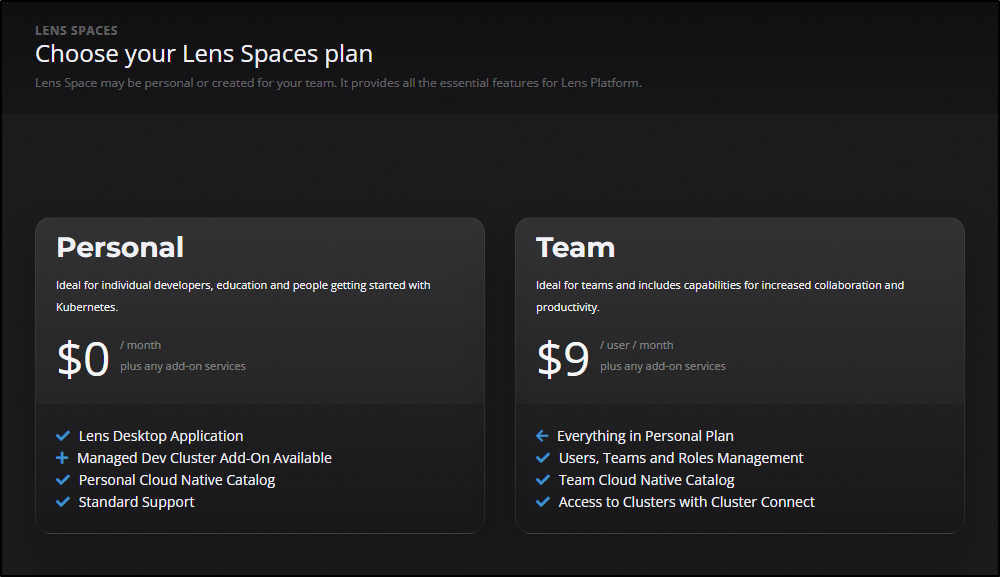
Lens is my other oft-used graphical interface to Kubernetes. At a prior, most of the developers switched over to Lens as it was a lot easier than launching the Kubernetes Dashboard for everyone. It has some commercial offerings as well including teams, storing your creds in the cloud and a hosted cluster option if you want them to manage a cluster for you.
Weave.works has been around a while (2014), but I was not familiar until recently with their Weave Scope product. Scope “automatically detects processes, containers, hosts. No kernel modules, no agents, no special libraries, no coding. Seamless integration with Docker, Kubernetes, DCOS and AWS ECS”.
We’ll take a moment to explore all three with demos and some embedded videos as well.
K9s
To install into WSL, I first needed Homebrew on Linux:
$ /bin/bash -c "$(curl -fsSL https://raw.githubusercontent.com/Homebrew/install/HEAD/install.sh)"
$ echo 'eval "$(/home/linuxbrew/.linuxbrew/bin/brew shellenv)"' >> /home/builder/.profile
# setup this shell
$ eval "$(/home/linuxbrew/.linuxbrew/bin/brew shellenv)"
Note: This step took a very long time to complete
Next, I simply needed to install with brew:
$ brew install derailed/k9s/k9s
Running `brew update --preinstall`...
==> Homebrew is run entirely by unpaid volunteers. Please consider donating:
  https://github.com/Homebrew/brew#donations
==> Auto-updated Homebrew!
Updated 1 tap (homebrew/core).
==> New Formulae
linux-headers@5.16
==> Updated Formulae
Updated 21 formulae.

==> Tapping derailed/k9s
Cloning into '/home/linuxbrew/.linuxbrew/Homebrew/Library/Taps/derailed/homebrew-k9s'...
remote: Enumerating objects: 788, done.
remote: Counting objects: 100% (372/372), done.
remote: Compressing objects: 100% (186/186), done.
remote: Total 788 (delta 90), reused 0 (delta 0), pack-reused 416
Receiving objects: 100% (788/788), 86.15 KiB | 1.91 MiB/s, done.
Resolving deltas: 100% (192/192), done.
Tapped 1 formula (12 files, 175.3KB).
==> Downloading https://github.com/derailed/k9s/releases/download/v0.25.18/k9s_Linux_x86_64.tar.gz
==> Downloading from https://objects.githubusercontent.com/github-production-release-asset-2e65be/1675
######################################################################## 100.0%
==> Installing k9s from derailed/k9s
🍺  /home/linuxbrew/.linuxbrew/Cellar/k9s/0.25.18: 5 files, 52.9MB, built in 1 second
==> Running `brew cleanup k9s`...
Disable this behaviour by setting HOMEBREW_NO_INSTALL_CLEANUP.
Hide these hints with HOMEBREW_NO_ENV_HINTS (see `man brew`).
Showing that it is available:
$ k9s info
 ____  __.________
|    |/ _/   __   \______
|      < \____    /  ___/
|    |  \   /    /\___ \
|____|__ \ /____//____  >
        \/            \/

Configuration:   /home/builder/.config/k9s/config.yml
Logs:            /tmp/k9s-builder.log
Screen Dumps:    /tmp/k9s-screens-builder
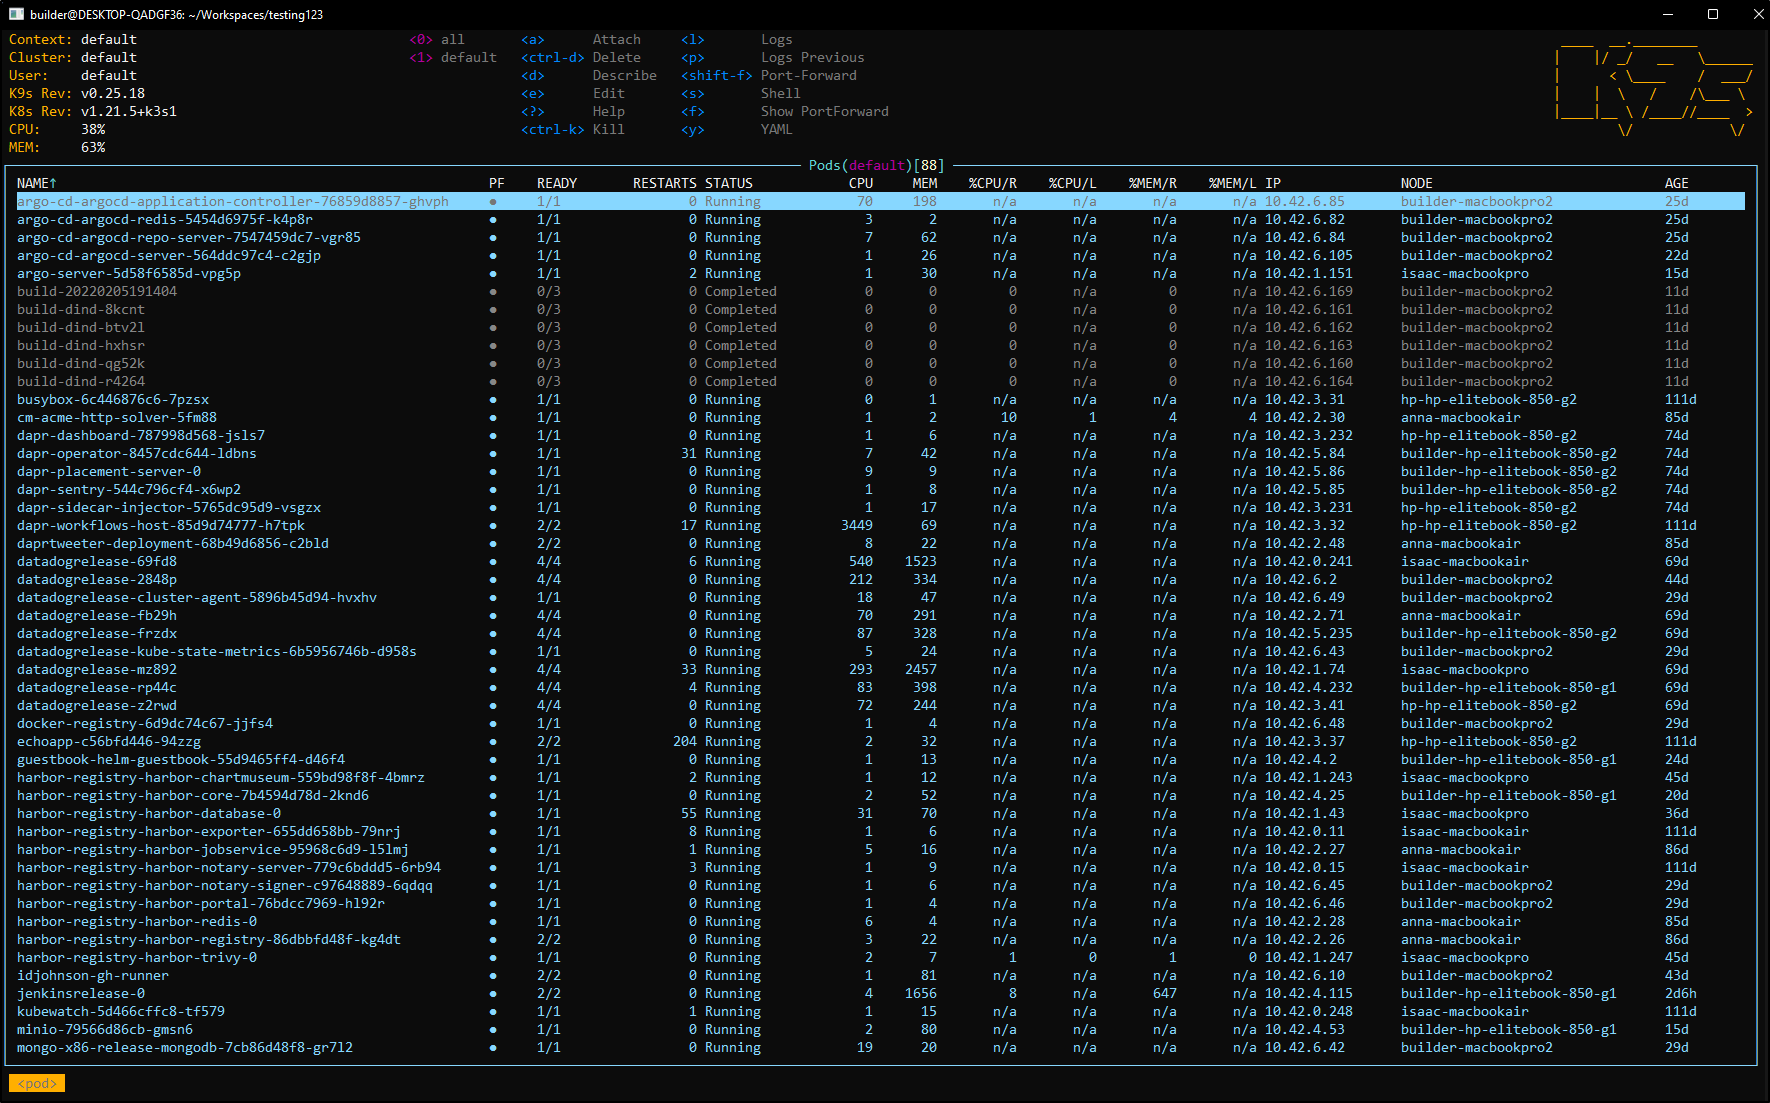
Let’s fire it up in my default namespace. Since monospace will wrap at this point, I’ll use screenshots, but be aware this is just text in a console (and it adjusts as I resize the window)
This makes it easy to look at the containers in a pod
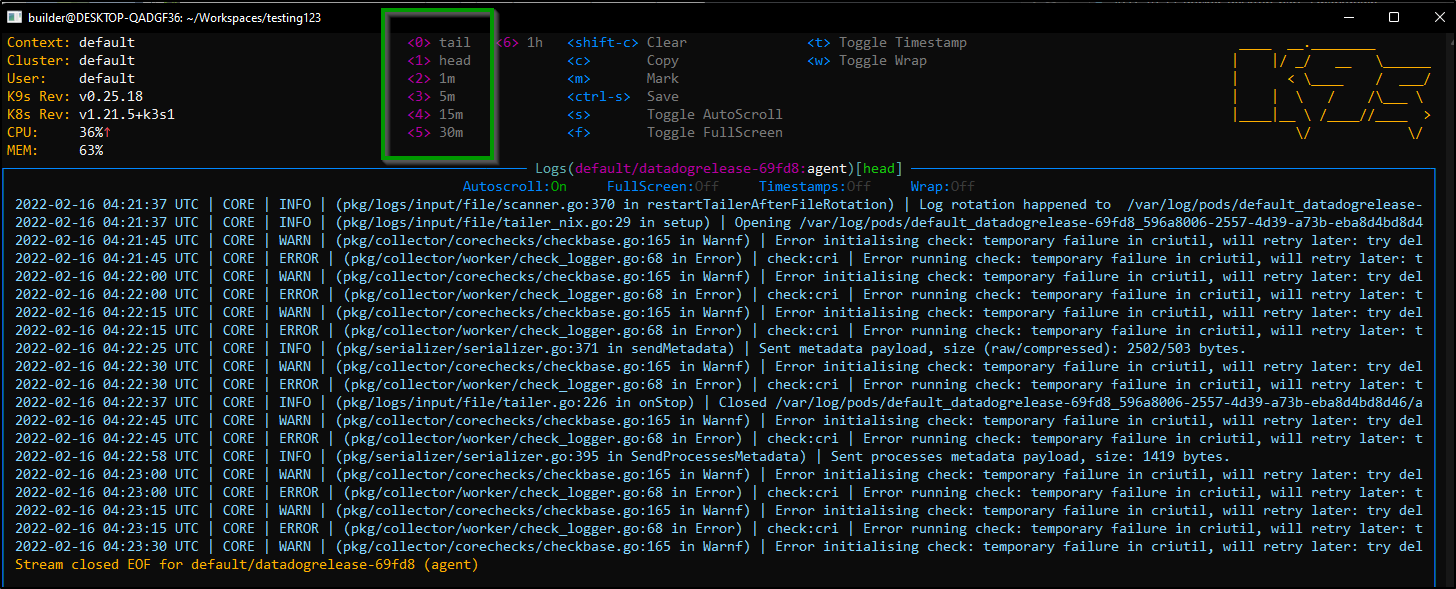
And from there, we can get logs
we can scroll to various time frames of logs using 0-5:
Using escape sends us back in windows.
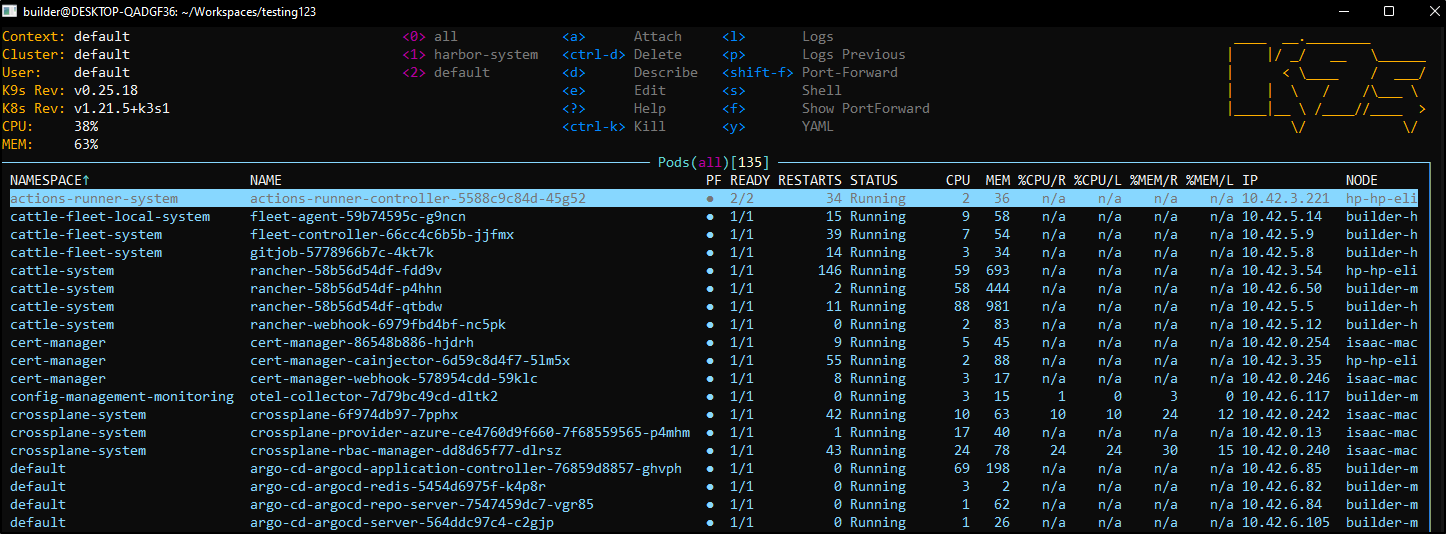
if we launch with all namespaces: k9s --all-namespaces will let us navigate over all our namespaces:
If we look at the help section, we can see we can run with tokens or readonly. We can even do screen dumps directly
$ k9s --help
K9s is a CLI to view and manage your Kubernetes clusters.

Usage:
  k9s [flags]
  k9s [command]

Available Commands:
  completion  generate the autocompletion script for the specified shell
  help        Help about any command
  info        Print configuration info
  version     Print version/build info

Flags:
  -A, --all-namespaces                 Launch K9s in all namespaces
      --as string                      Username to impersonate for the operation
      --as-group stringArray           Group to impersonate for the operation
      --certificate-authority string   Path to a cert file for the certificate authority
      --client-certificate string      Path to a client certificate file for TLS
      --client-key string              Path to a client key file for TLS
      --cluster string                 The name of the kubeconfig cluster to use
  -c, --command string                 Overrides the default resource to load when the application launches
      --context string                 The name of the kubeconfig context to use
      --crumbsless                     Turn K9s crumbs off
      --headless                       Turn K9s header off
  -h, --help                           help for k9s
      --insecure-skip-tls-verify       If true, the server's caCertFile will not be checked for validity
      --kubeconfig string              Path to the kubeconfig file to use for CLI requests
      --logFile string                 Specify the log file (default "/tmp/k9s-builder.log")
  -l, --logLevel string                Specify a log level (info, warn, debug, trace, error) (default "info")
      --logoless                       Turn K9s logo off
  -n, --namespace string               If present, the namespace scope for this CLI request
      --readonly                       Sets readOnly mode by overriding readOnly configuration setting
  -r, --refresh int                    Specify the default refresh rate as an integer (sec) (default 2)
      --request-timeout string         The length of time to wait before giving up on a single server request
      --screen-dump-dir string         Sets a path to a dir for a screen dumps
      --token string                   Bearer token for authentication to the API server
      --user string                    The name of the kubeconfig user to use
      --write                          Sets write mode by overriding the readOnly configuration setting

Use "k9s [command] --help" for more information about a command.
So if I save the log having passed in the directory, it dumps to a subfolder:
$ pwd
/home/builder/Workspaces/testing123
$ k9s --screen-dump-dir /home/builder/Workspaces/testing123

$ cat default/actions-runner-system-actions-runner-controller-5588c9c84d-45g52-1645041362966067788.log
Waiting for logs...
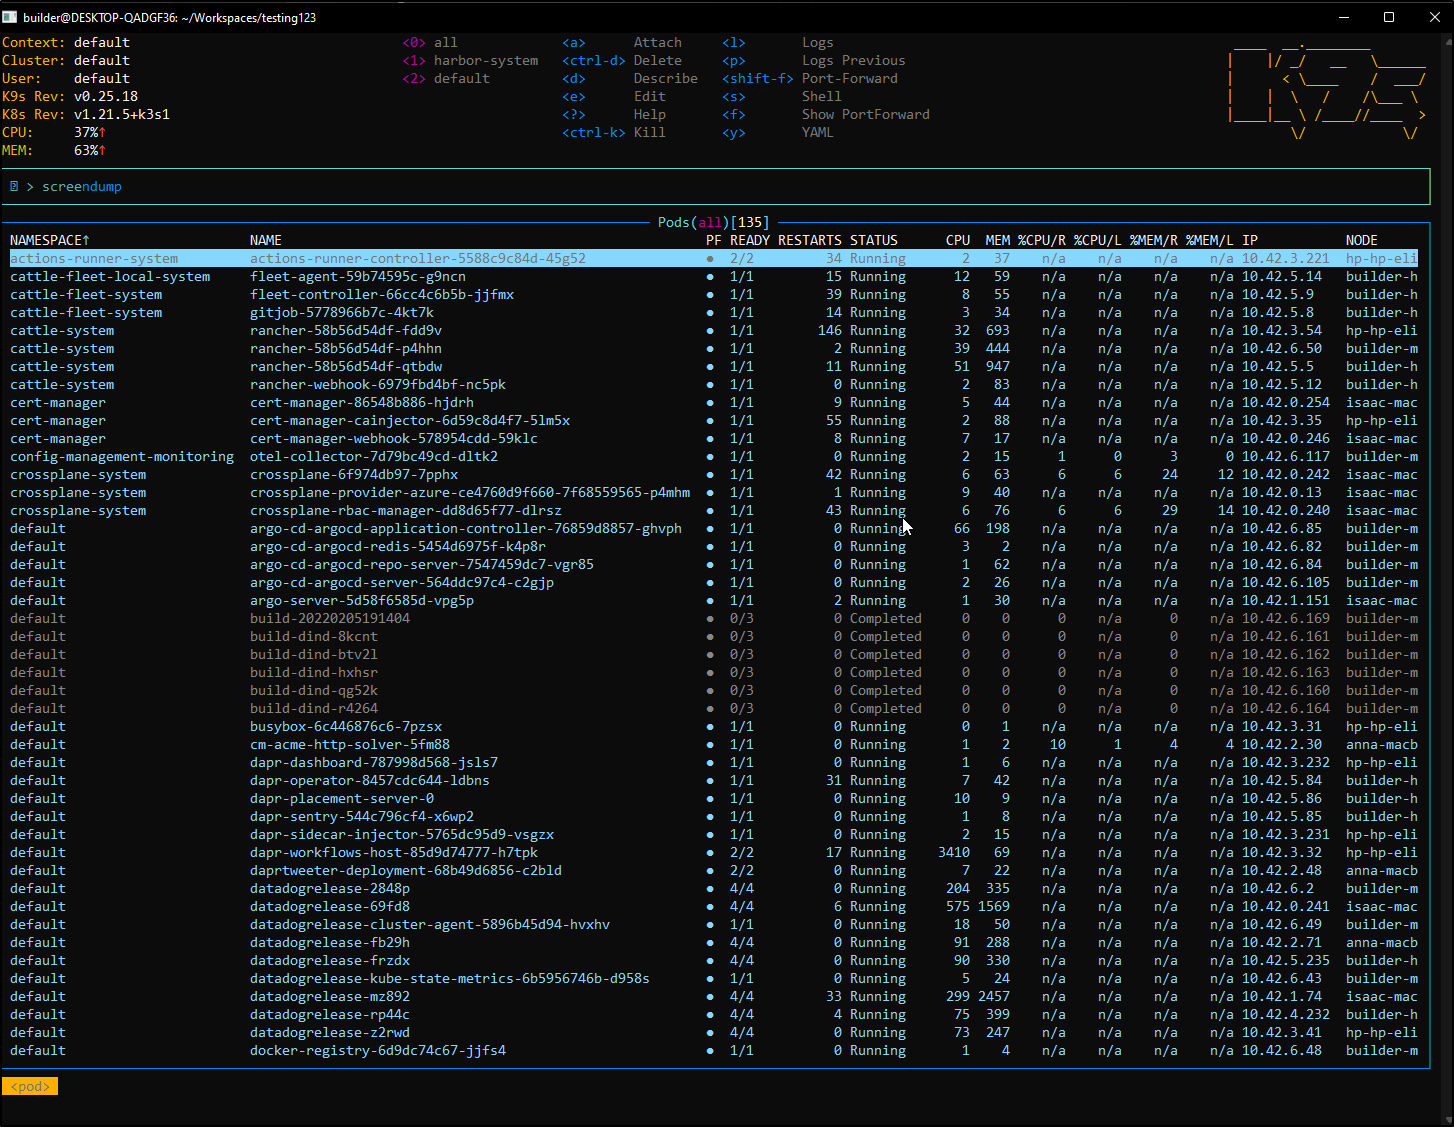
And like VI, i can use “:” to issue commands, such as screendumps
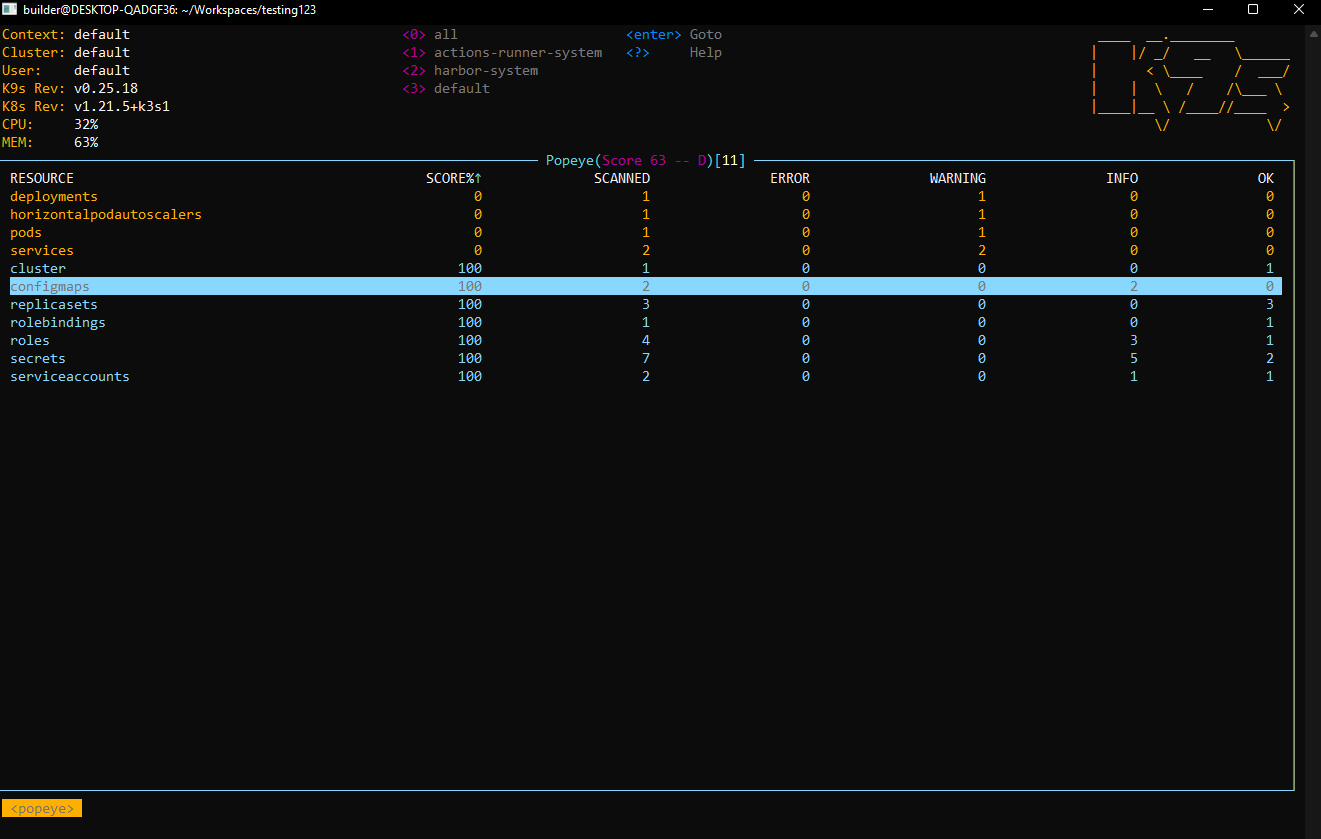
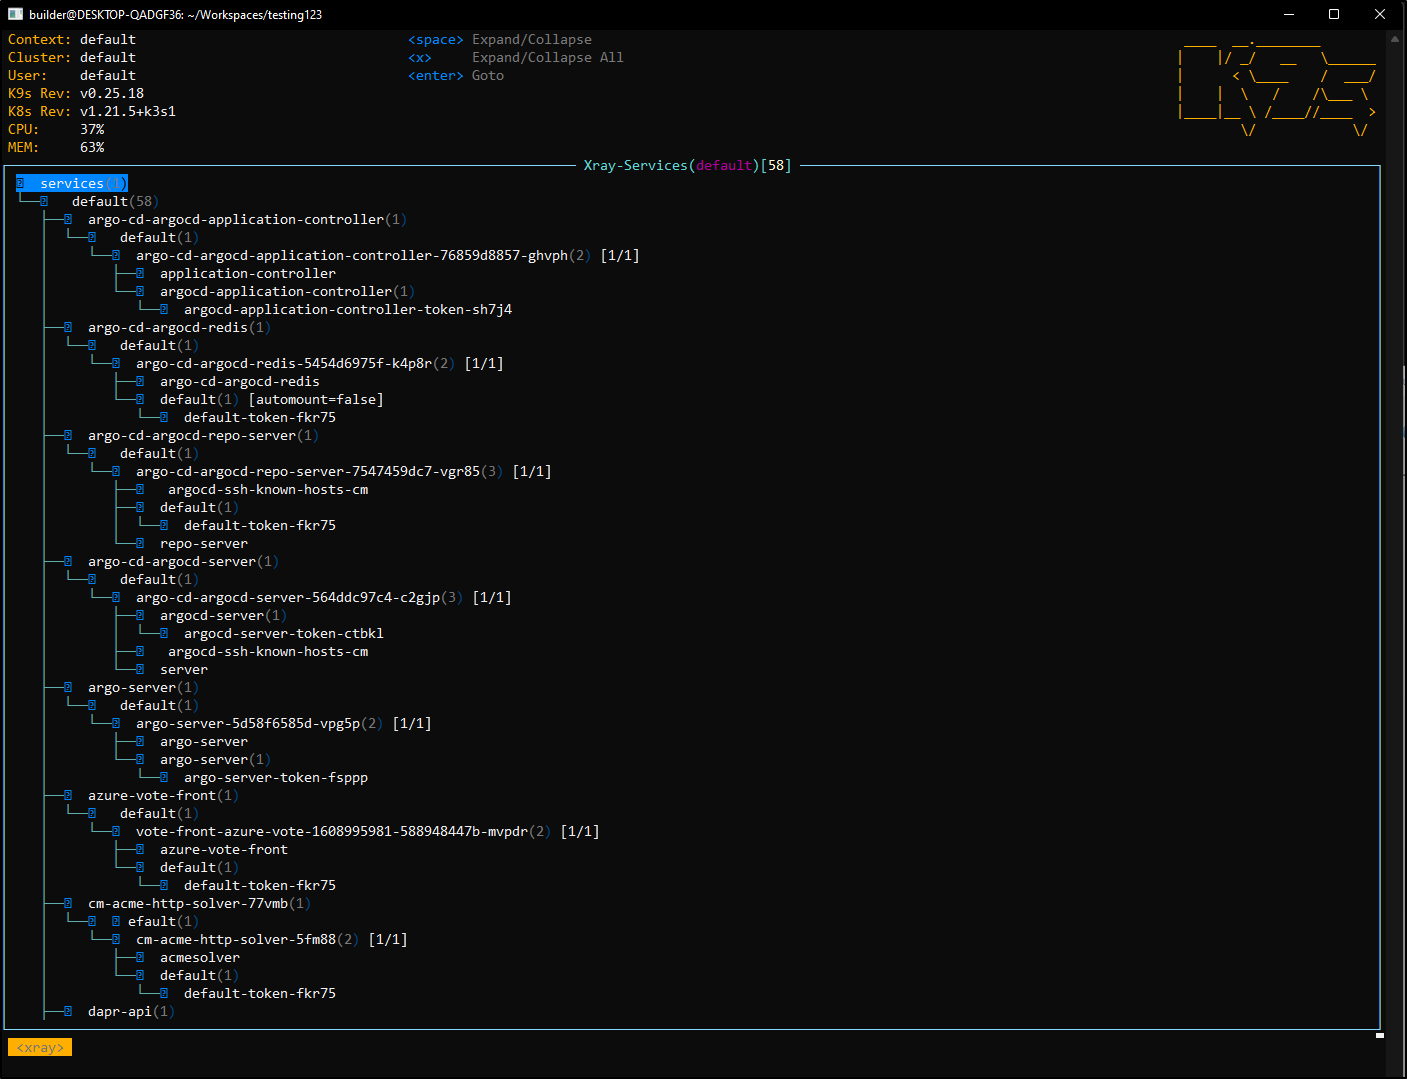
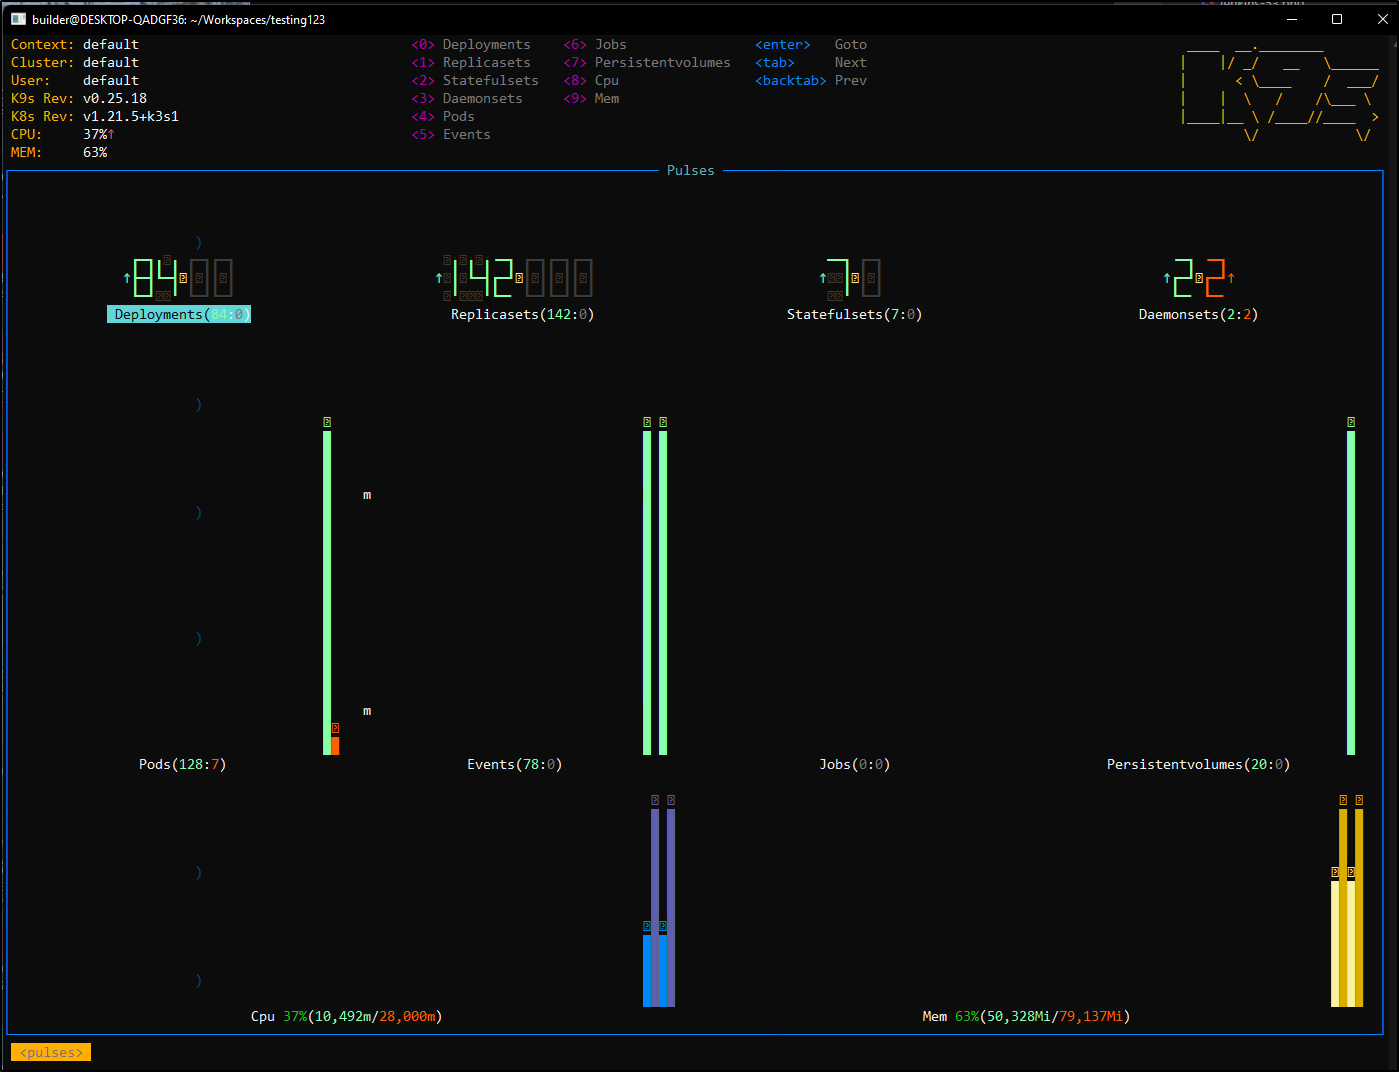
There are a few interesting views such as:
Popeye (e.g. : popeye)
X-Ray (e.g. : xray svc default)
and Pulses (e.g. : pu)
any top level resource can be found using the shortcuts such as : sts or : pods, etc.
Another handy feature is ctrl-s to get a shell in any pod (for which a shell is possible, of course)
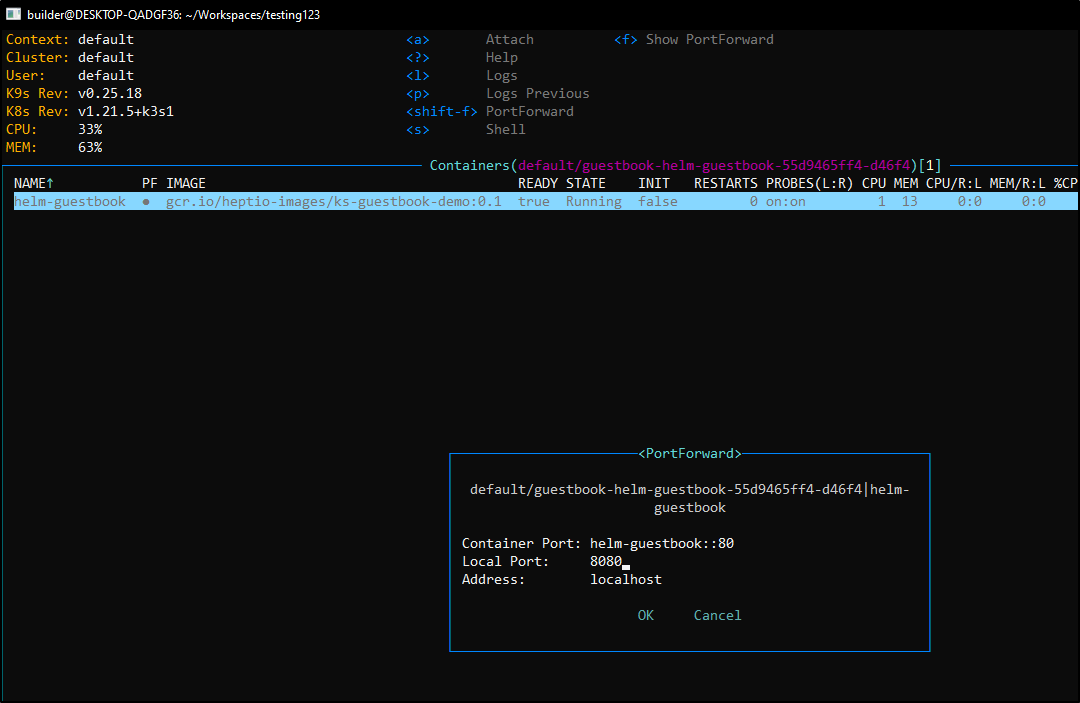
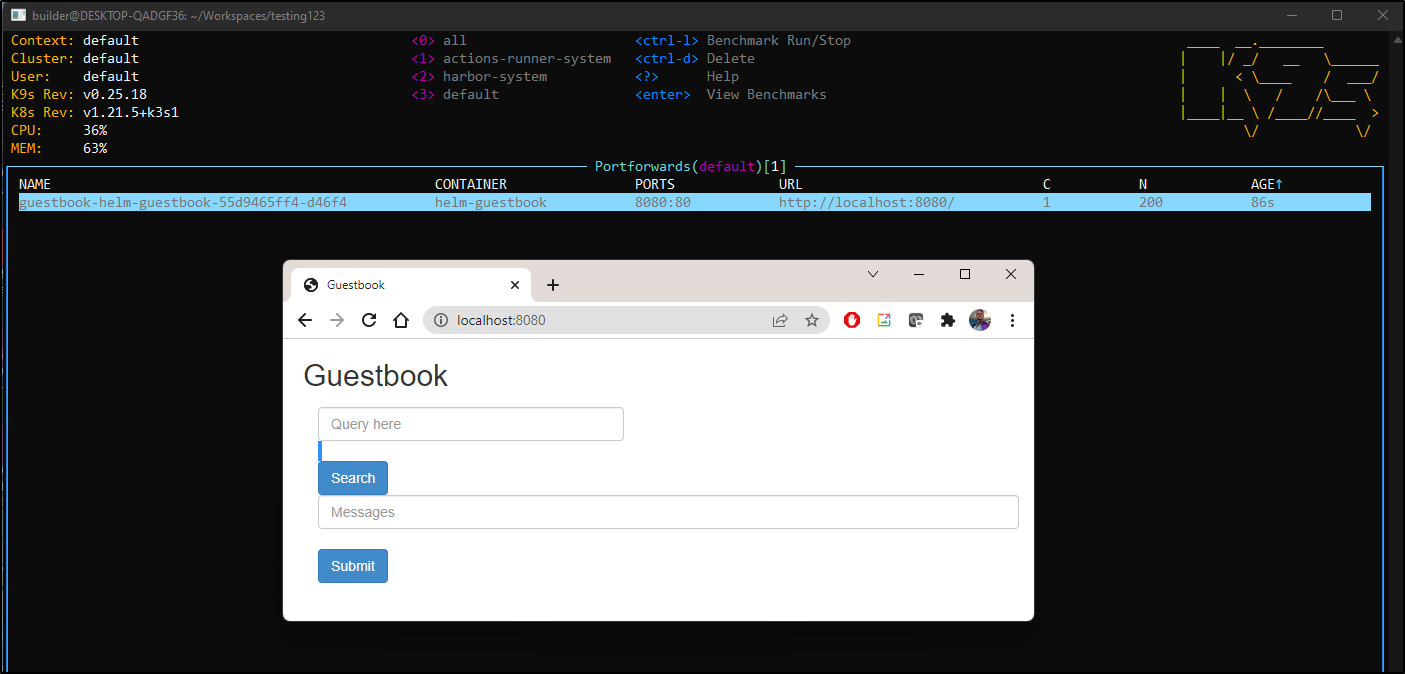
shift-f lets us port-forward
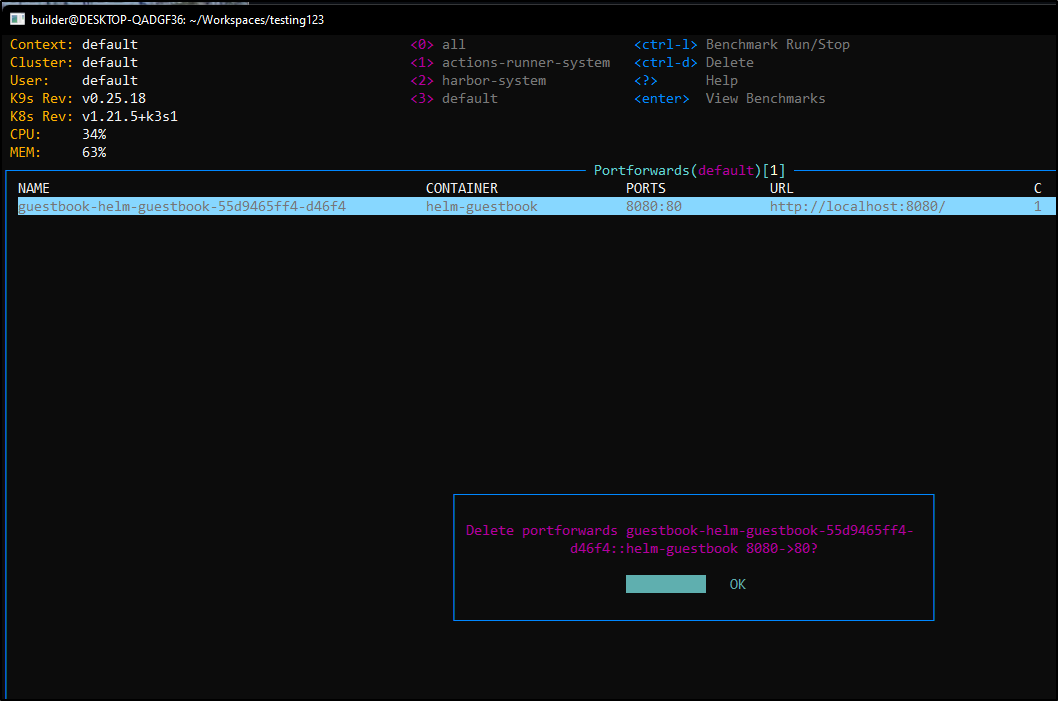
we can use : pf to see active port-forwards
and from there you can ctrl-d to remove the port-forward
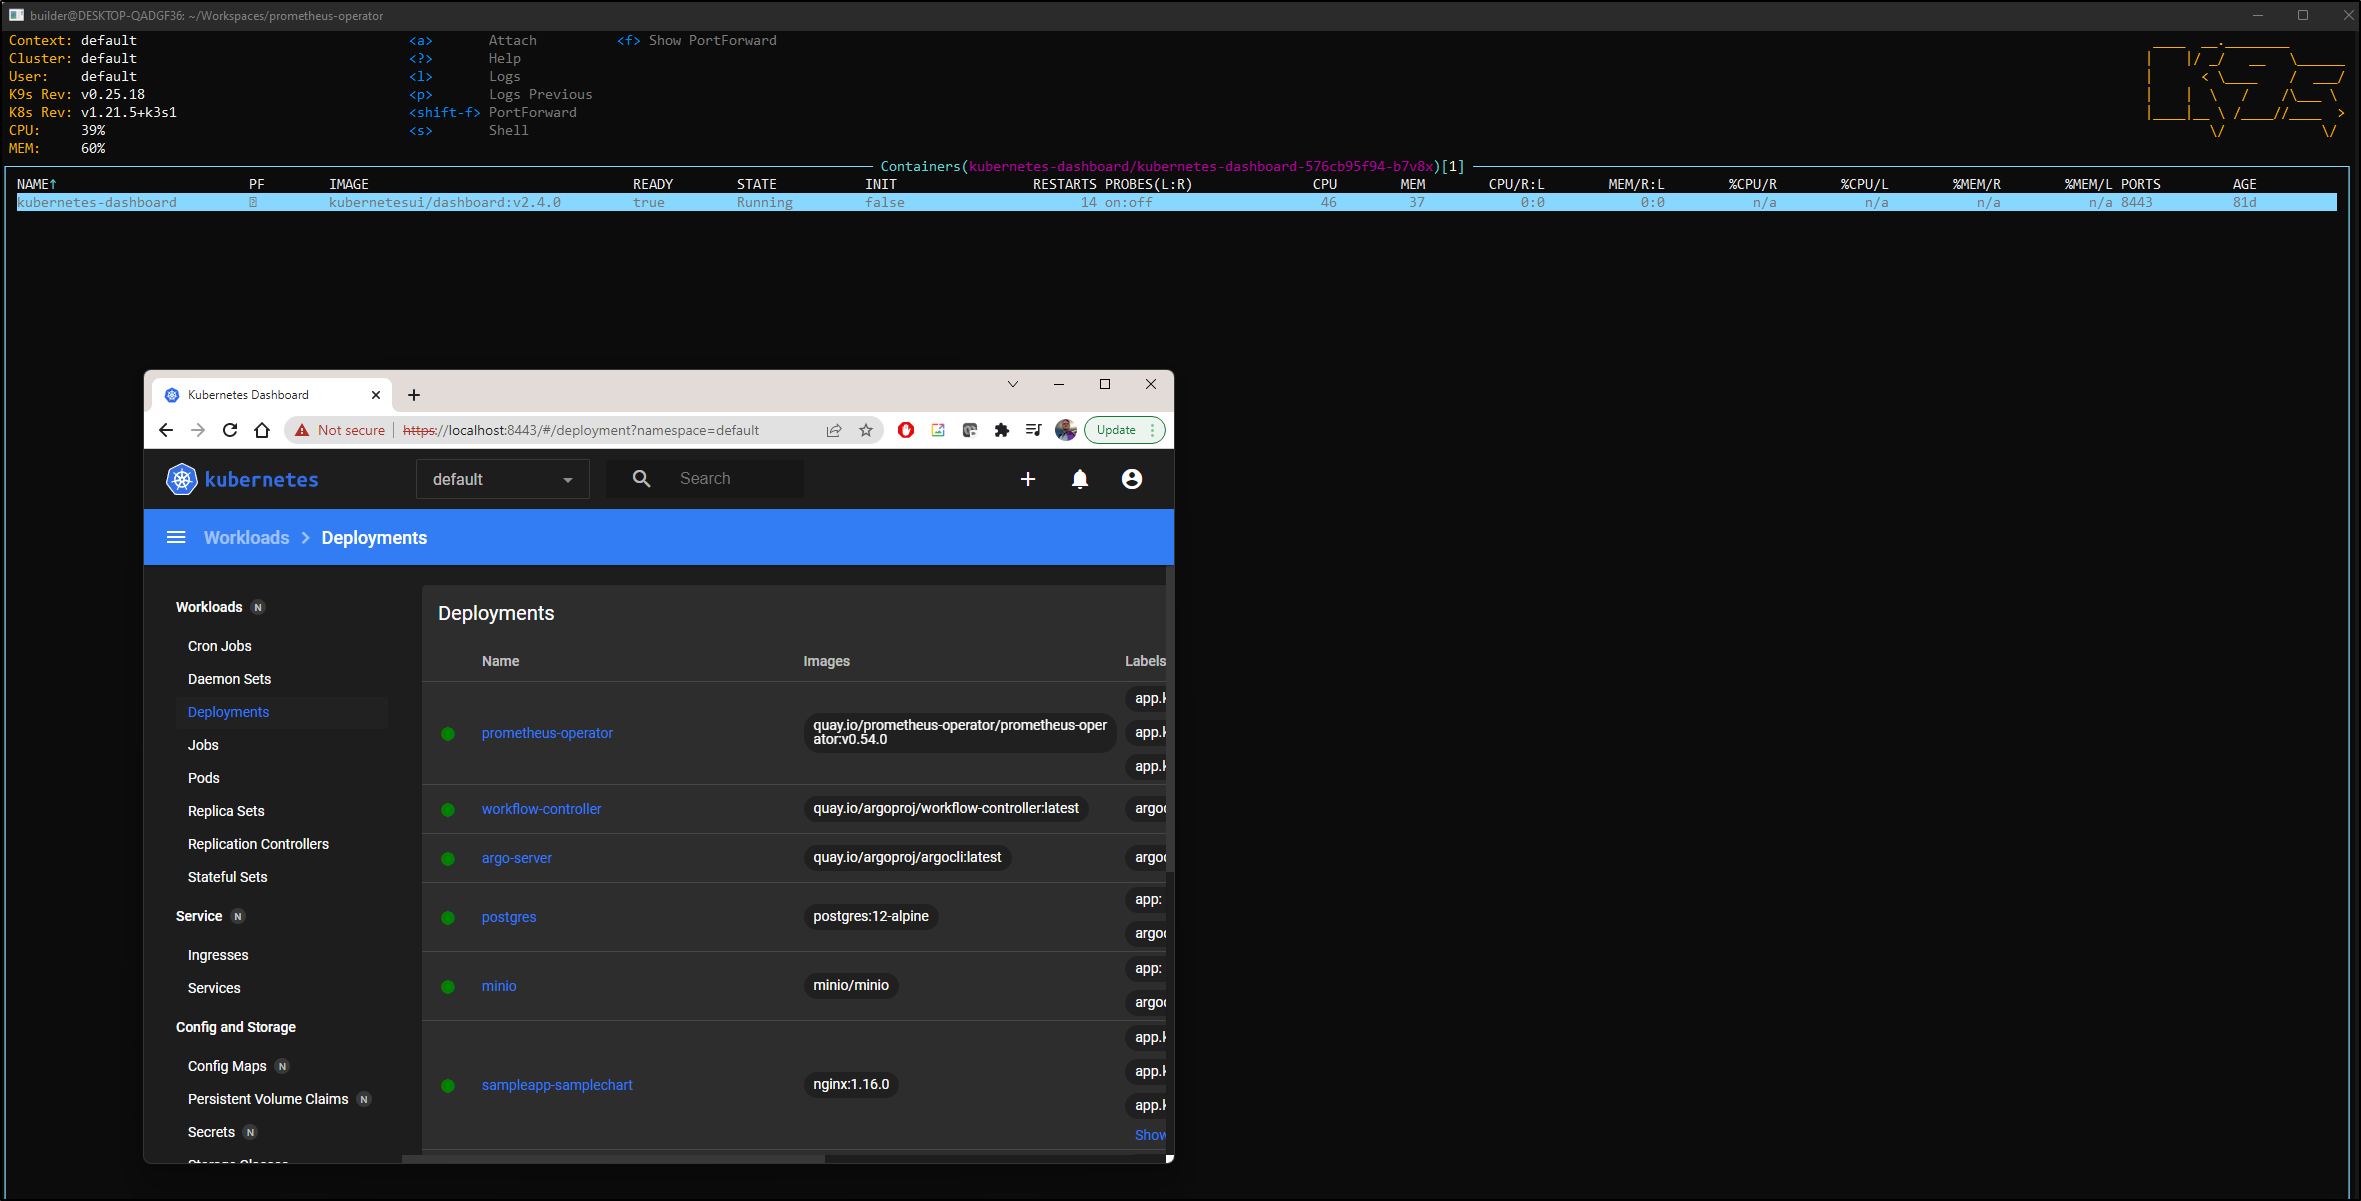
One common use I have with k9s is to quickly port-forward to the k8s dashboard
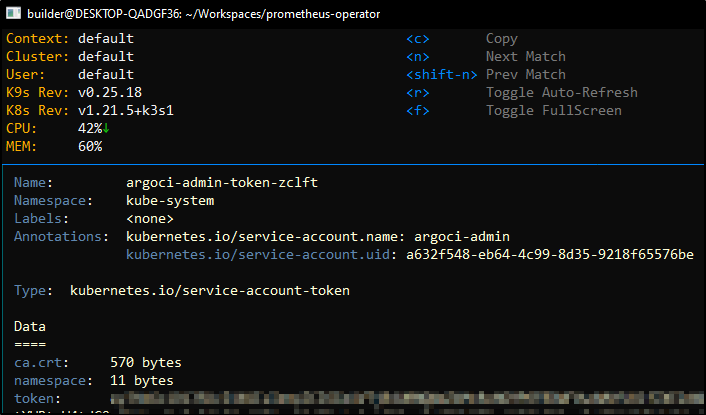
and since we are in k9s, it’s easy enough to fetch the token we need to login
Lens
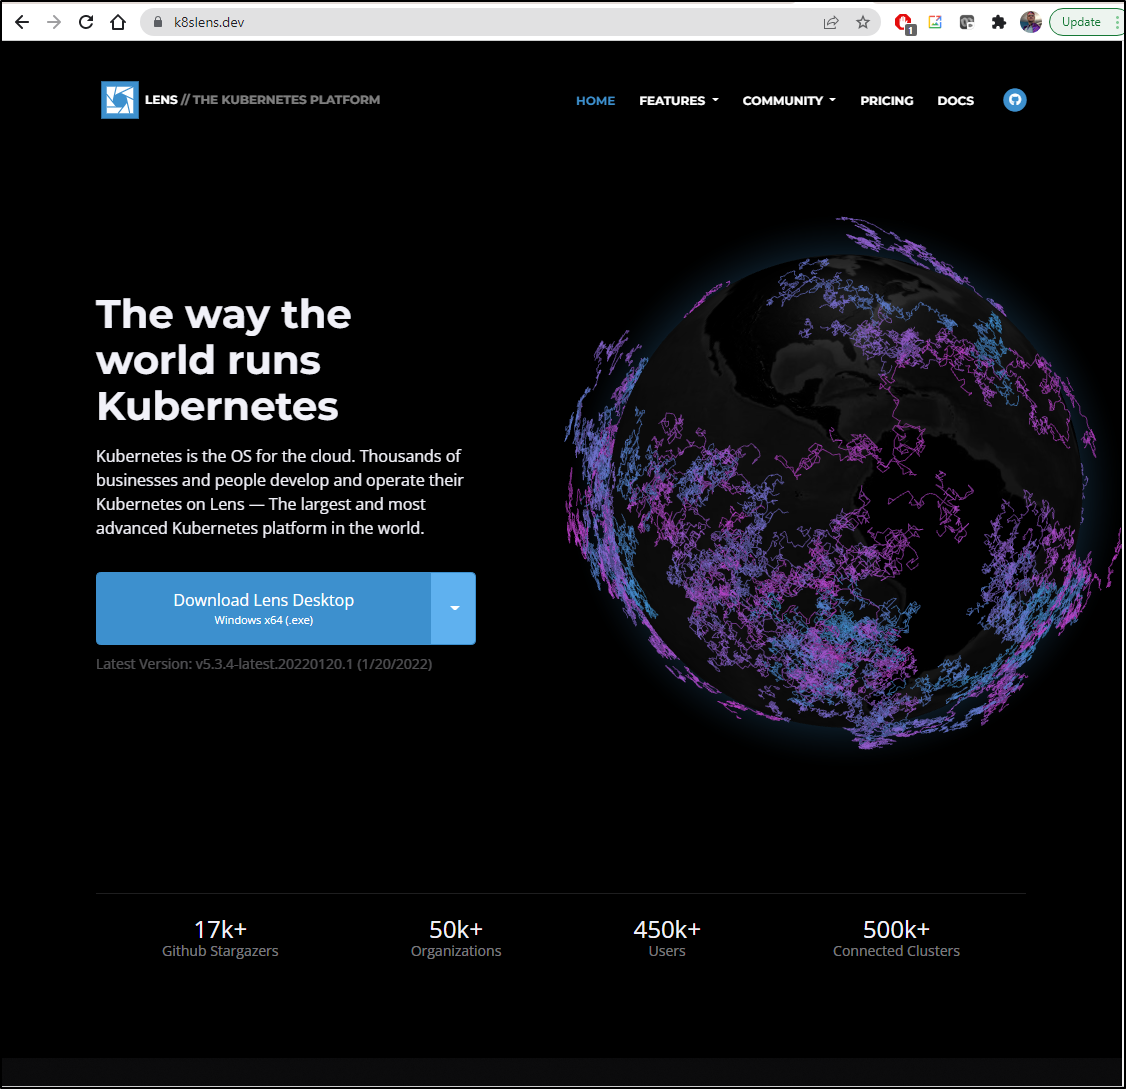
Lens can be downloaded from their home page. The Github Getting Started guide also has details.
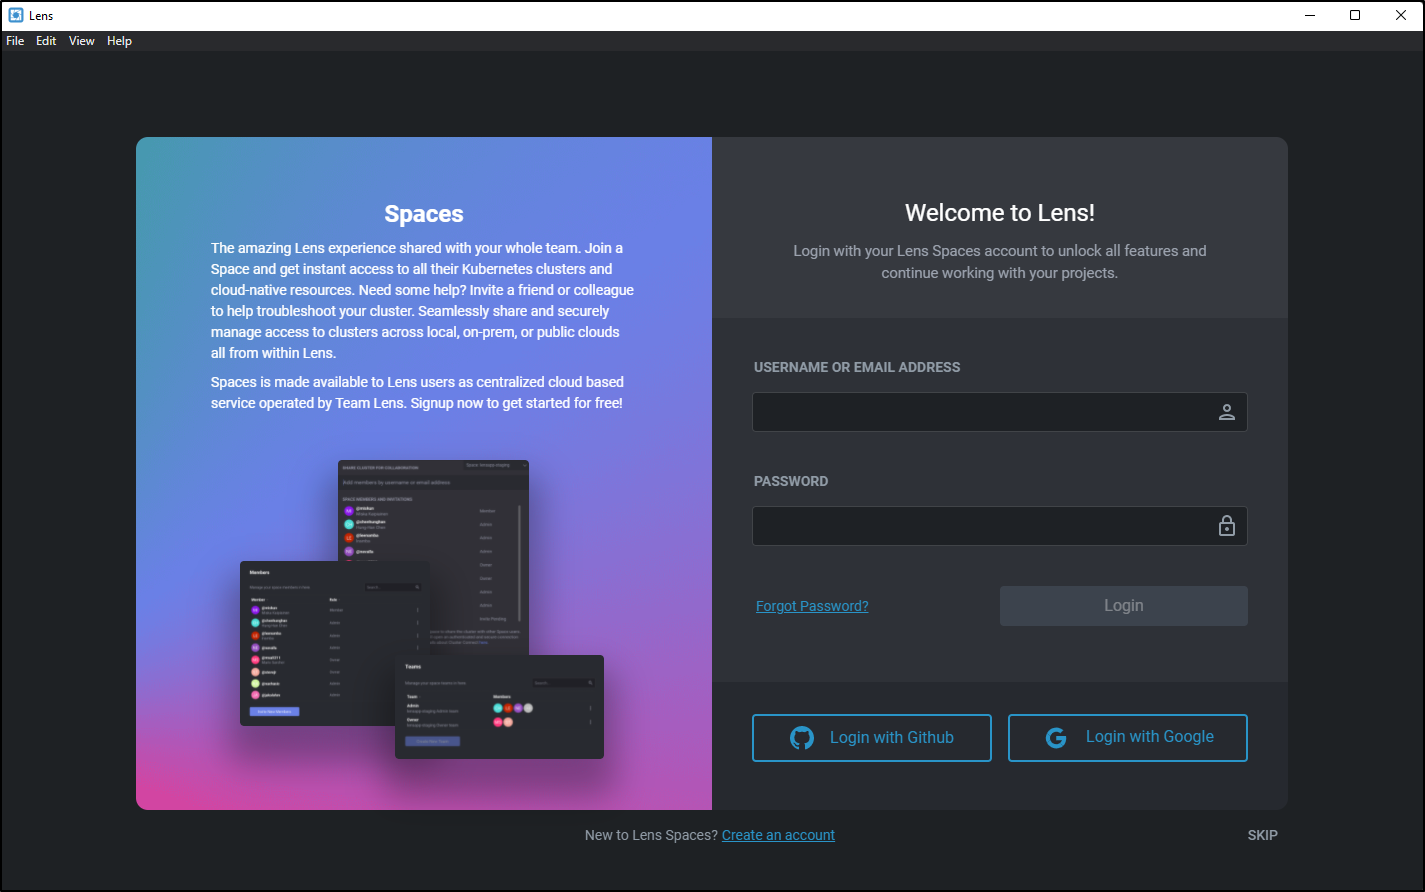
We can (optionally) choose to login
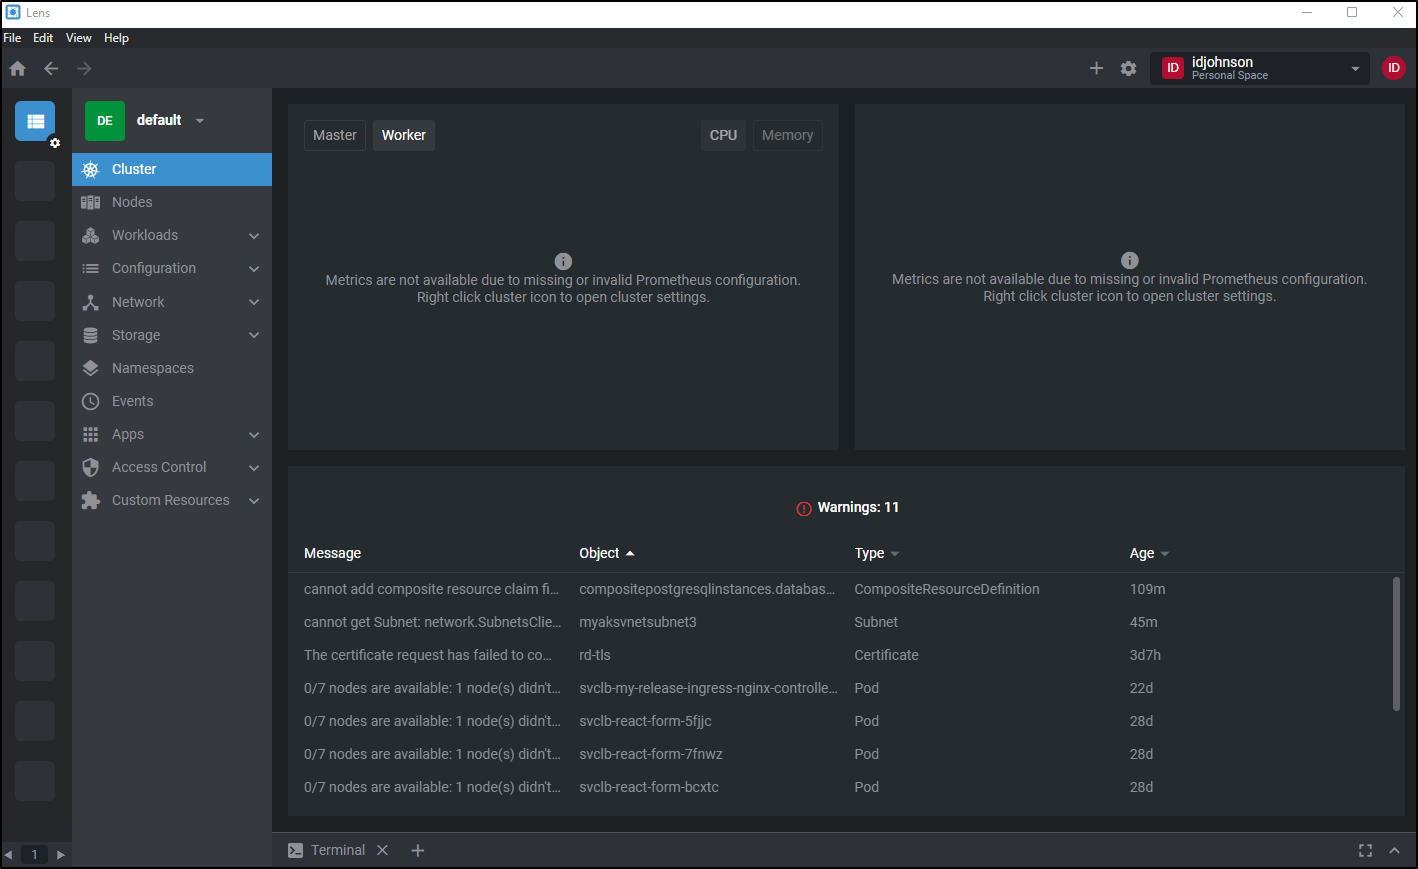
With Lens we can view deployments (workloads), namespaces etc from a single pane
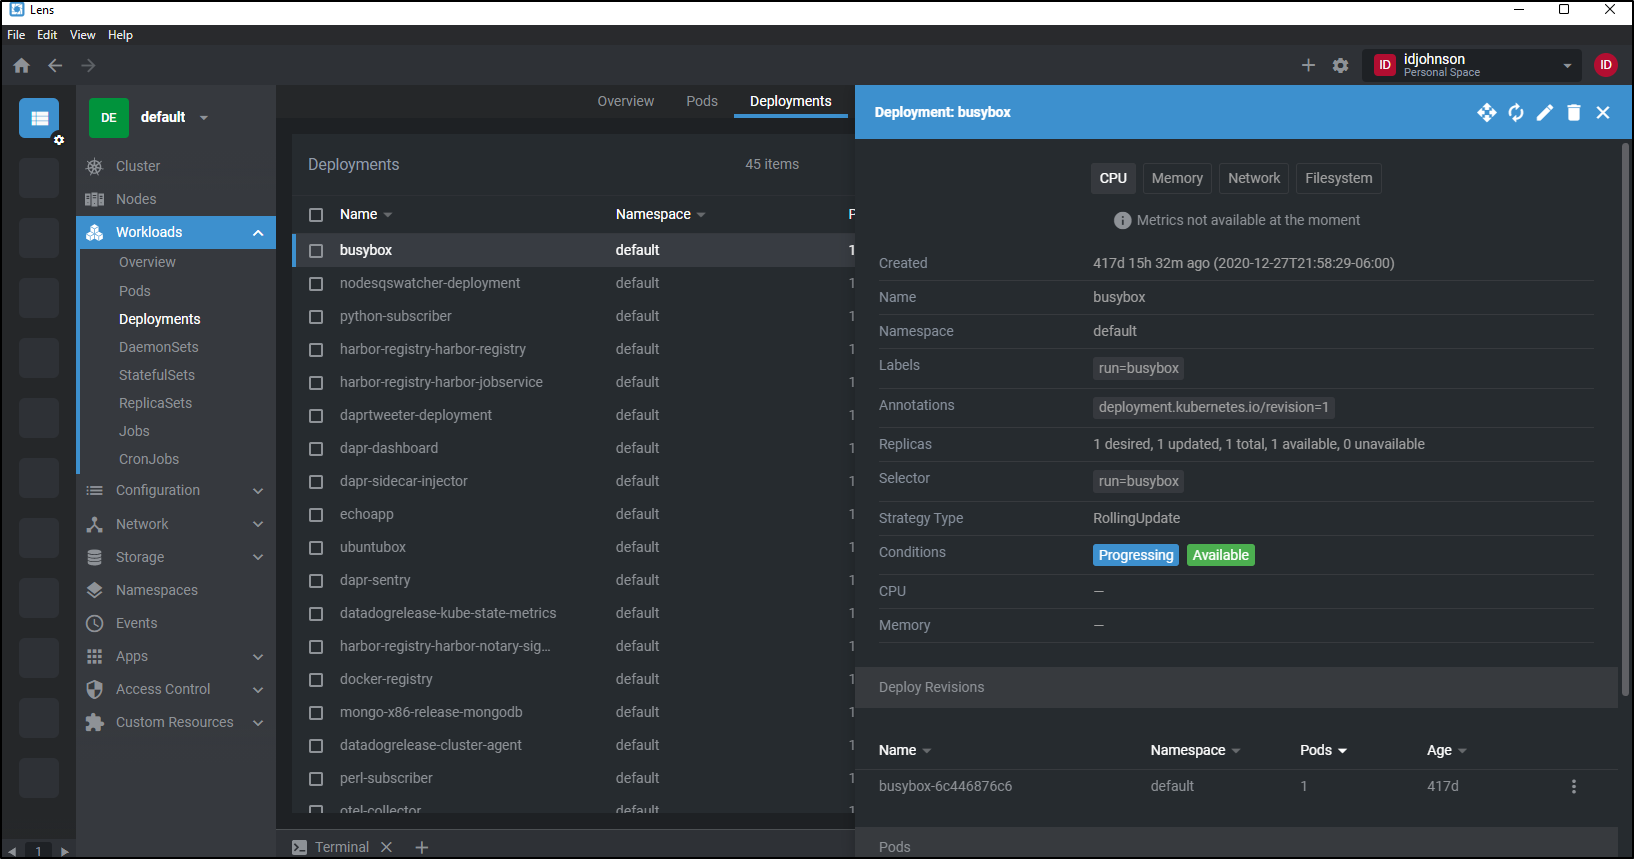
For instance, we can look up a deployment and determine specifics about the pods running in it
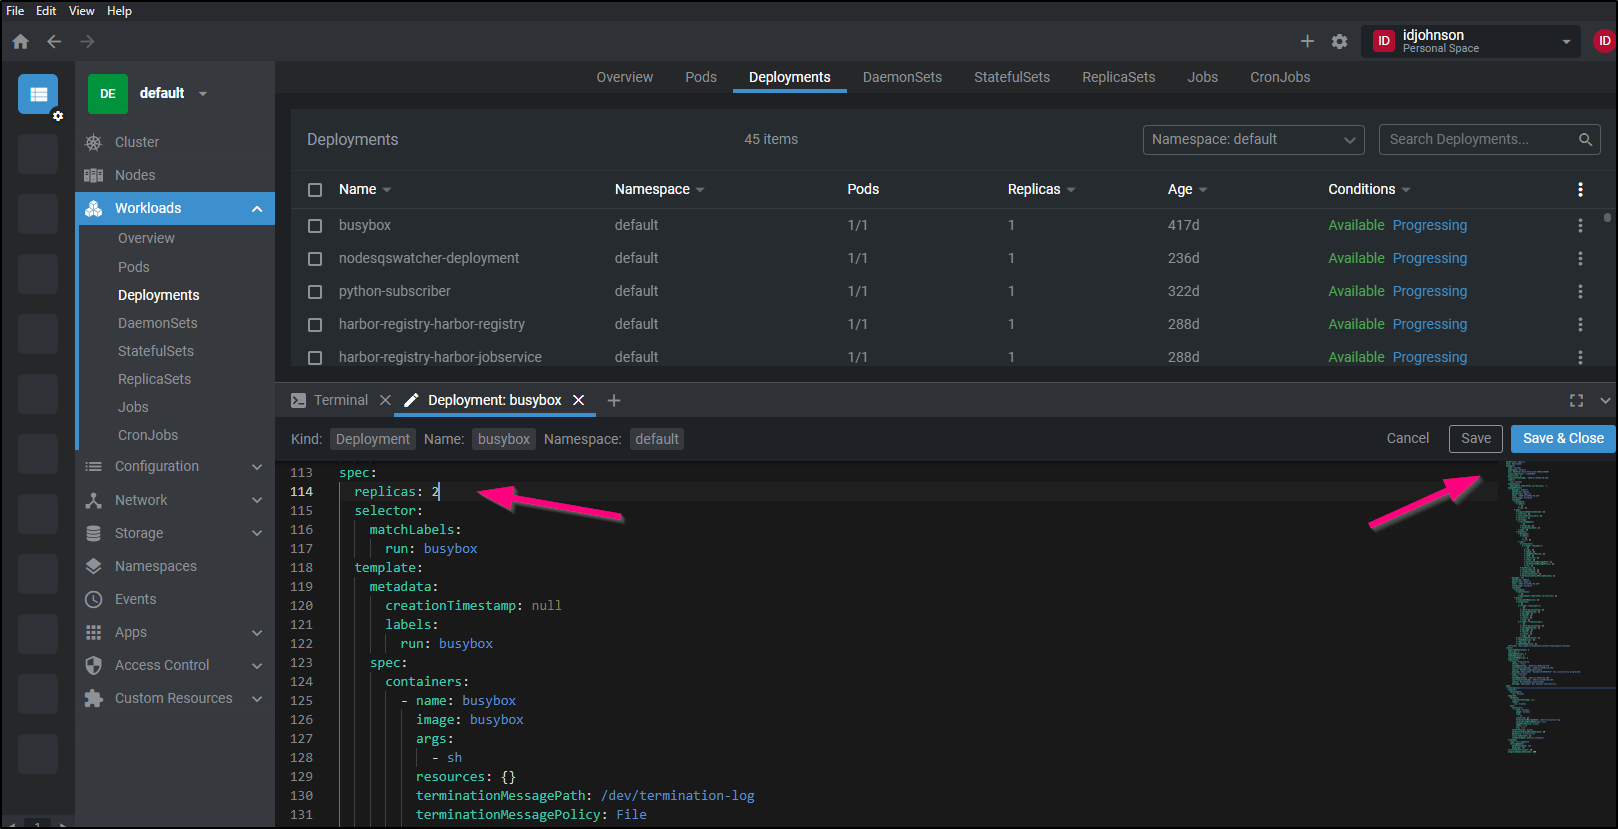
For instance, perhaps we want to update the number of replicas. We can easily click the pencil (edit) icon and change the YAML. then click “Save & Close)
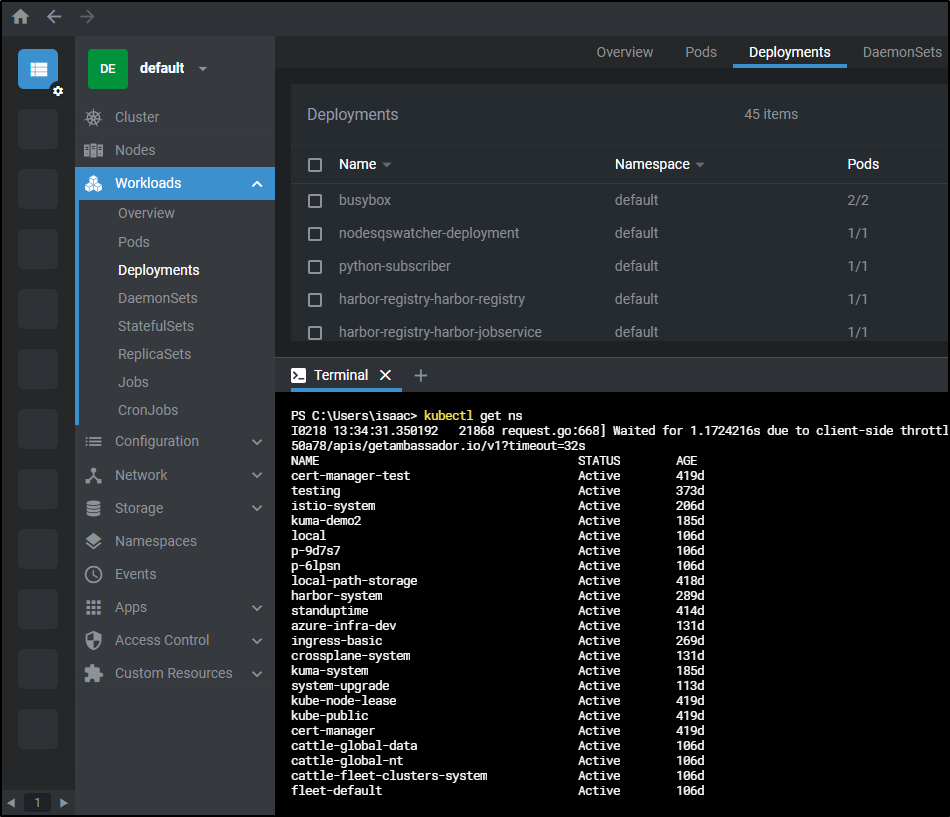
Like VS Code we have a built-in terminal we can use to access objects in our cluster as well.
Another particularly handy feature is being able to quickly look up service account token values with just a couple clicks
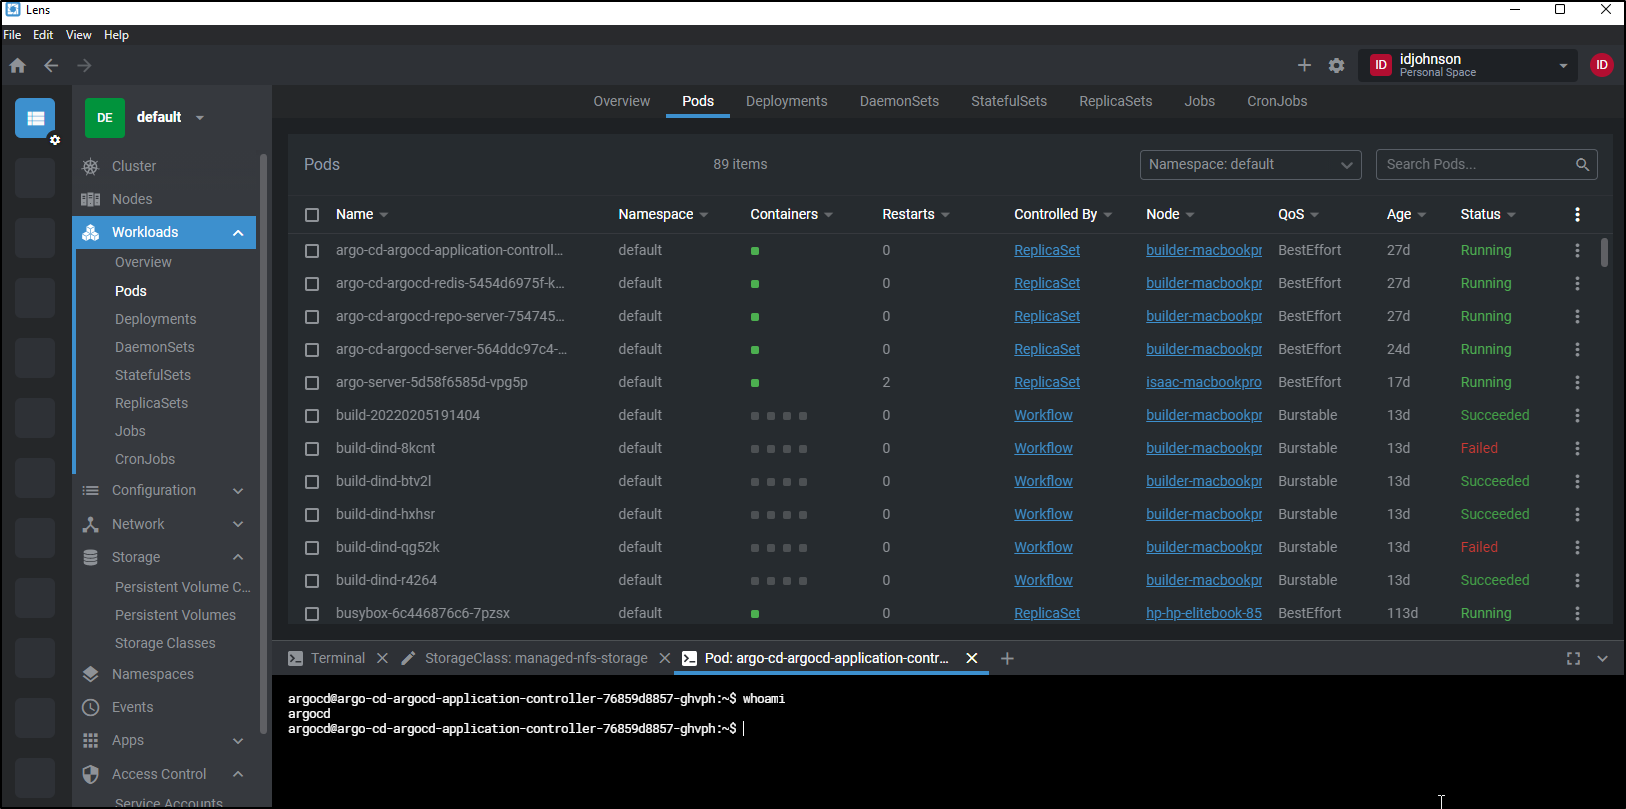
From the Pod View we can open a shell
as we can see:
Team Spaces
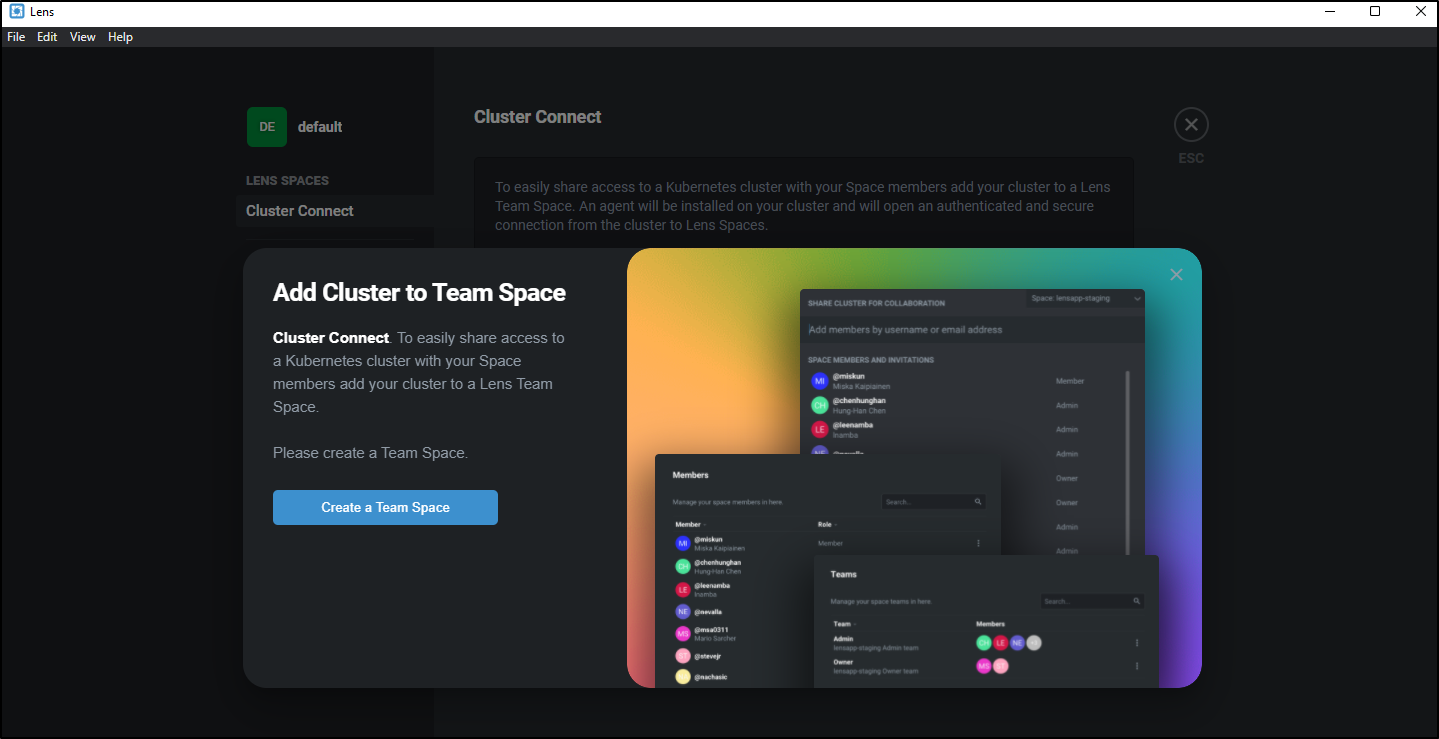
We can share our clusters with others via the Team Space feature
However, that feature seems to only work for Team Spaces which is in a paid tier
Demo
Here we can see some details in my k3s (albeit it cannot fetch prometheus metrics)
We can also see some details from AKS that properly exposes metrics to Lens
Weaveworks
Scope has been around since 2015 and gives us a very complete app for exploring our cluster. Since it can modify the cluster, I’ll not be exposing this externally.
Installing
We can follow the guide here
It is essentially the one-liner:
$ kubectl apply -f "https://cloud.weave.works/k8s/scope.yaml?k8s-version=$(kubectl version | base64 | tr -d '\n')"
namespace/weave created
serviceaccount/weave-scope created
clusterrole.rbac.authorization.k8s.io/weave-scope created
clusterrolebinding.rbac.authorization.k8s.io/weave-scope created
deployment.apps/weave-scope-app created
service/weave-scope-app created
deployment.apps/weave-scope-cluster-agent created
daemonset.apps/weave-scope-agent created
This installs Weaveworks into “weave” namespace to which we can port-forward:
kubectl port-forward -n weave "$(kubectl get -n weave pod --selector=weave-scope-component=app -o jsonpath='{.items..metadata.name}')" 4040
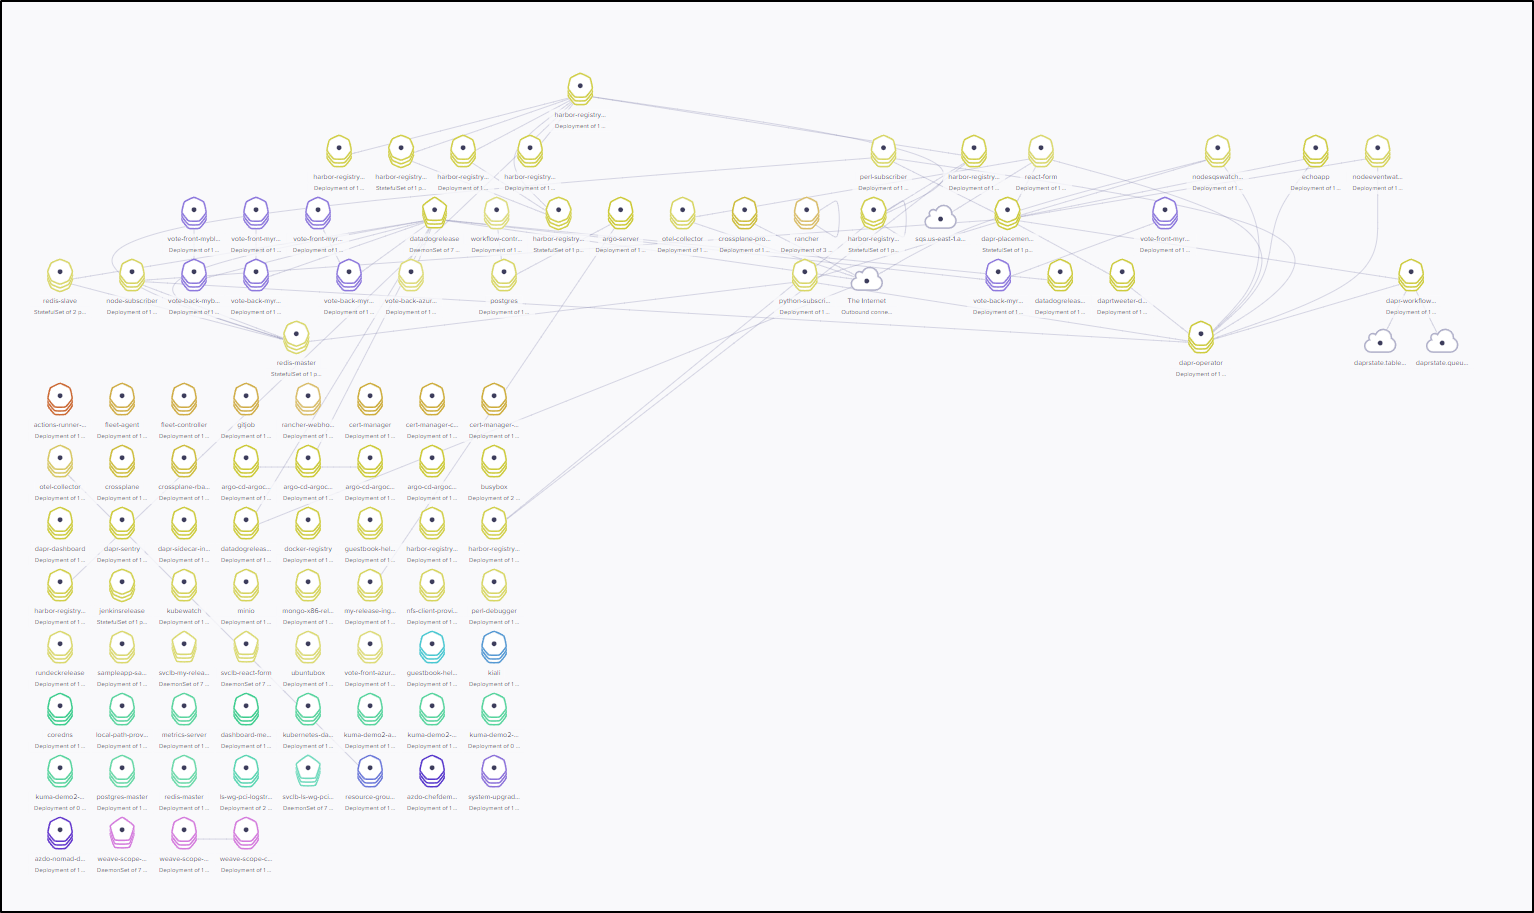
This gave a pretty interesting overview of my cluster
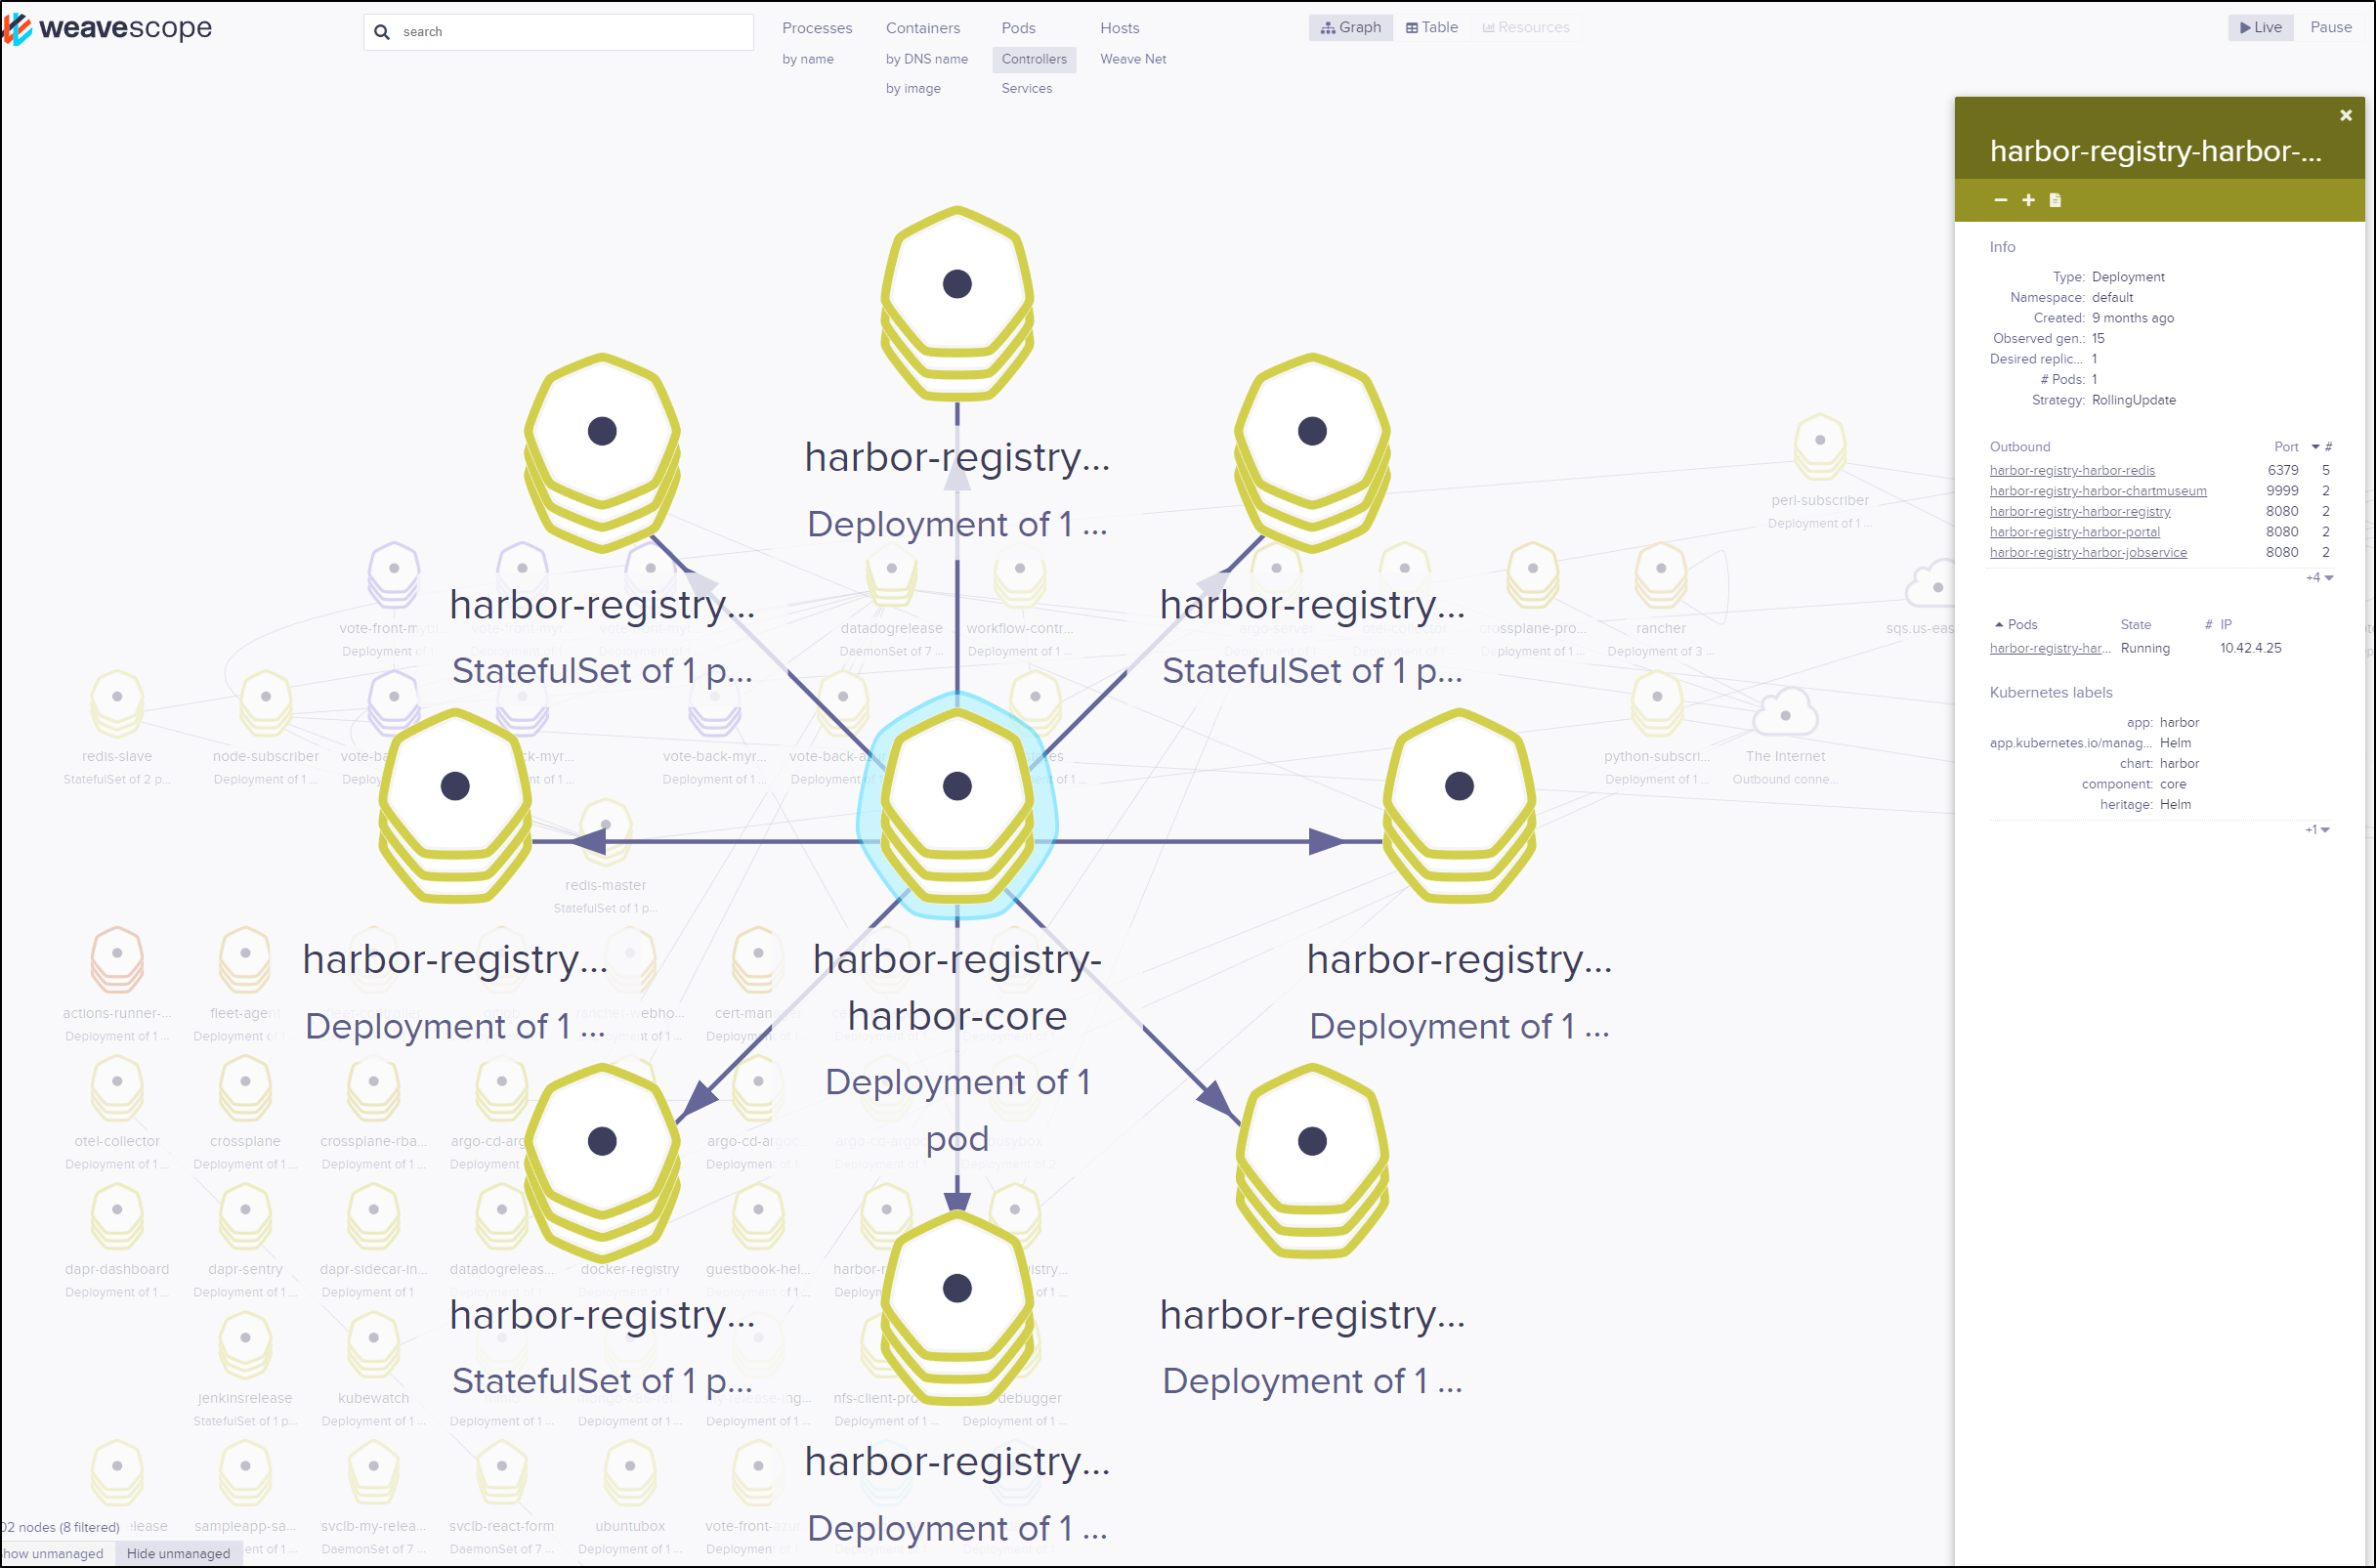
I could pick a pod and see how it related to others. It also showed live outbound connections and details like lables and IP.
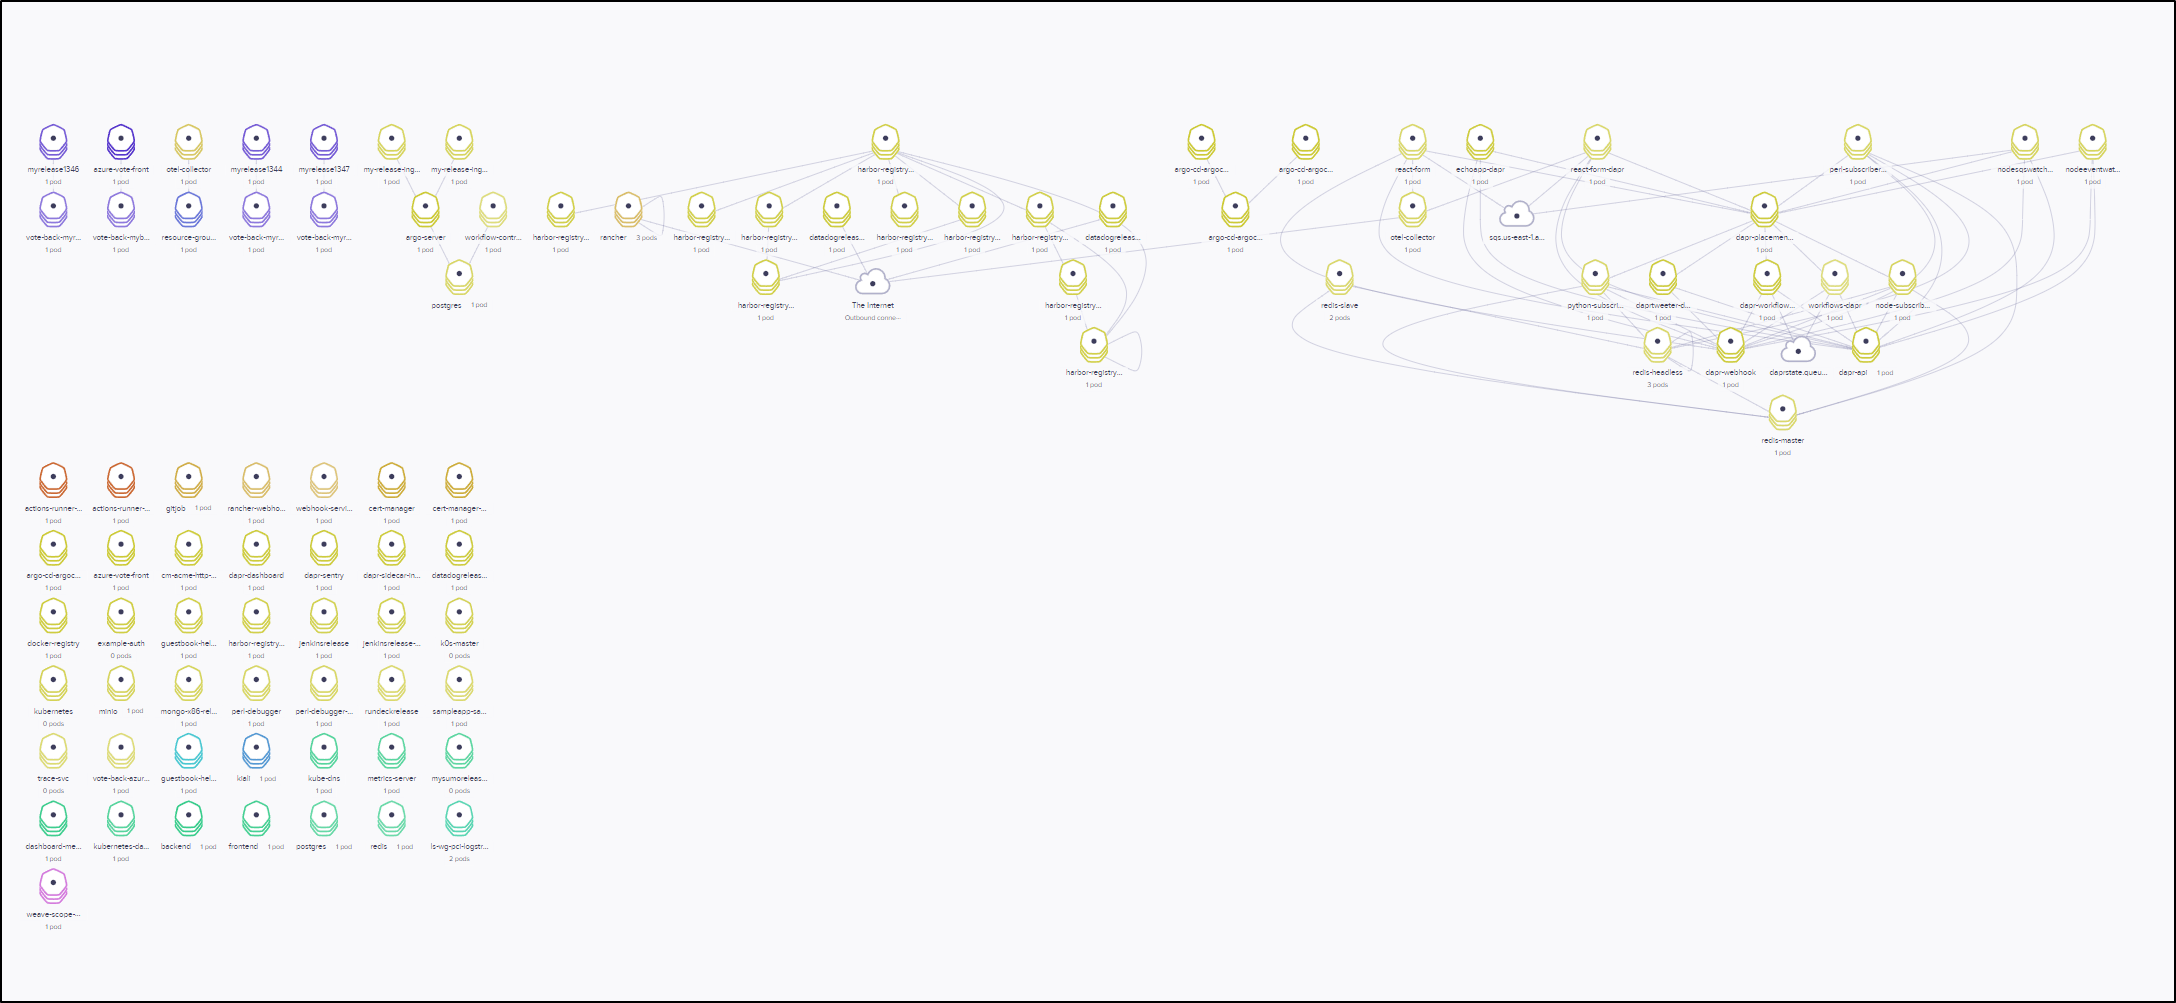
I can also view things from the services point of view
Switching to the table view, I can search, for instance, for a particular service
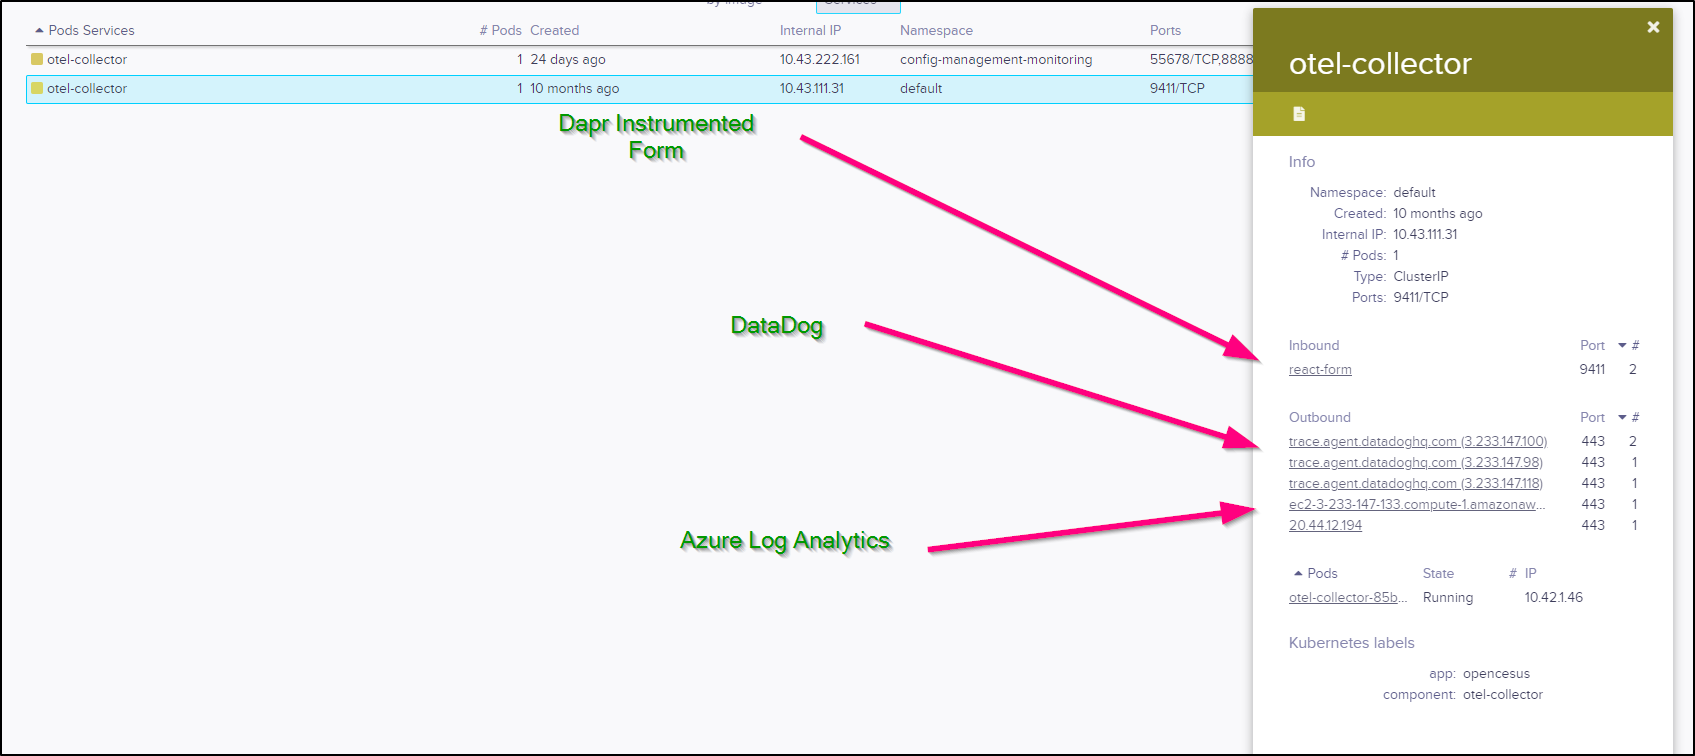
I can see that the Open Telemetry Collector has outbound connections to Datadog and Azure Log Analytics and was likely ingesting trace data from the React Form.
Here we can see navigating Weave.works
Summary
These are just a few of the tools we can use to explore Kubernetes. Lens and k9s offer two easy to use methods to engage with your cluster without needing to fire off kubectl commands over and over.
Weave.works Scope offers a nice way to explore our cluster visually. While APM and logging tools like Datadog, Dynatrace, New Relic and more offer similar, this is really just about visualizing what is in our cluster presently.


