Published: Nov 24, 2021 by Isaac Johnson
In the last article we dug into New Relic for Kubernetes cluster monitoring and automatic APM via Pixie.
Let’s continue by using the provided OpenTelemetry exporter as we had with Datadog and Azure Log Monitoring to view Dapr provided tracing data.
As we explore New Relics offerings, we’ll compare to both Azure and Datadog on experience and pricing.
OpenTelemetry exporter
Let us use the Native Exporter to send our Tracing data up to New Relic similar to what we did with Datadog and ALM. We can see the steps in the docs here.
Basically, it just requires adding a block to our current OpenTelemetry ConfigMap:
exporters:
  newrelic:
    apikey: super-secret-api-key
    timeout: 30s
Here you can see me adding it into the OTel Conf (masking the secrets with *’s, but they are plaintext in the file, of course):
$ kubectl get cm otel-collector-conf -o yaml > otel-collector-conf.yaml
$ vi otel-collector-conf.yaml
$ kubectl get cm otel-collector-conf -o yaml > otel-collector-conf.yaml.bak
$ diff -c otel-collector-conf.yaml.bak otel-collector-conf.yaml
*** otel-collector-conf.yaml.bak        2021-11-11 13:22:49.594125557 -0600
--- otel-collector-conf.yaml    2021-11-11 13:22:44.094125575 -0600
***************
*** 28,33 ****
--- 28,36 ----
        datadog:
          api:
            key: "f********************************************4"
+       newrelic:
+         apikey: "9********************************************L"
+         timeout: 30s

      service:
        extensions: [pprof, zpages, health_check]
***************
*** 35,41 ****
          traces:
            receivers: [zipkin]
            # List your exporter here.
!           exporters: [datadog,azuremonitor,logging]
      # datadog/api maybe?
  kind: ConfigMap
  metadata:
--- 38,44 ----
          traces:
            receivers: [zipkin]
            # List your exporter here.
!           exporters: [datadog,newrelic,logging]
      # datadog/api maybe?
  kind: ConfigMap
  metadata:
Then I’ll apply and rotate the OTel pod to ensure it picks up fresh settings
$ kubectl apply -f otel-collector-conf.yaml
configmap/otel-collector-conf configured
$ kubectl get pods | grep otel
otel-collector-67f645b9b7-w4flh                         1/1     Running   1          14d
$ kubectl delete pod otel-collector-67f645b9b7-w4flh
pod "otel-collector-67f645b9b7-w4flh" deleted
Azure Monitor
Again, i would like to compare and contrast these OTel tools, let’s add Azure Monitor as well.
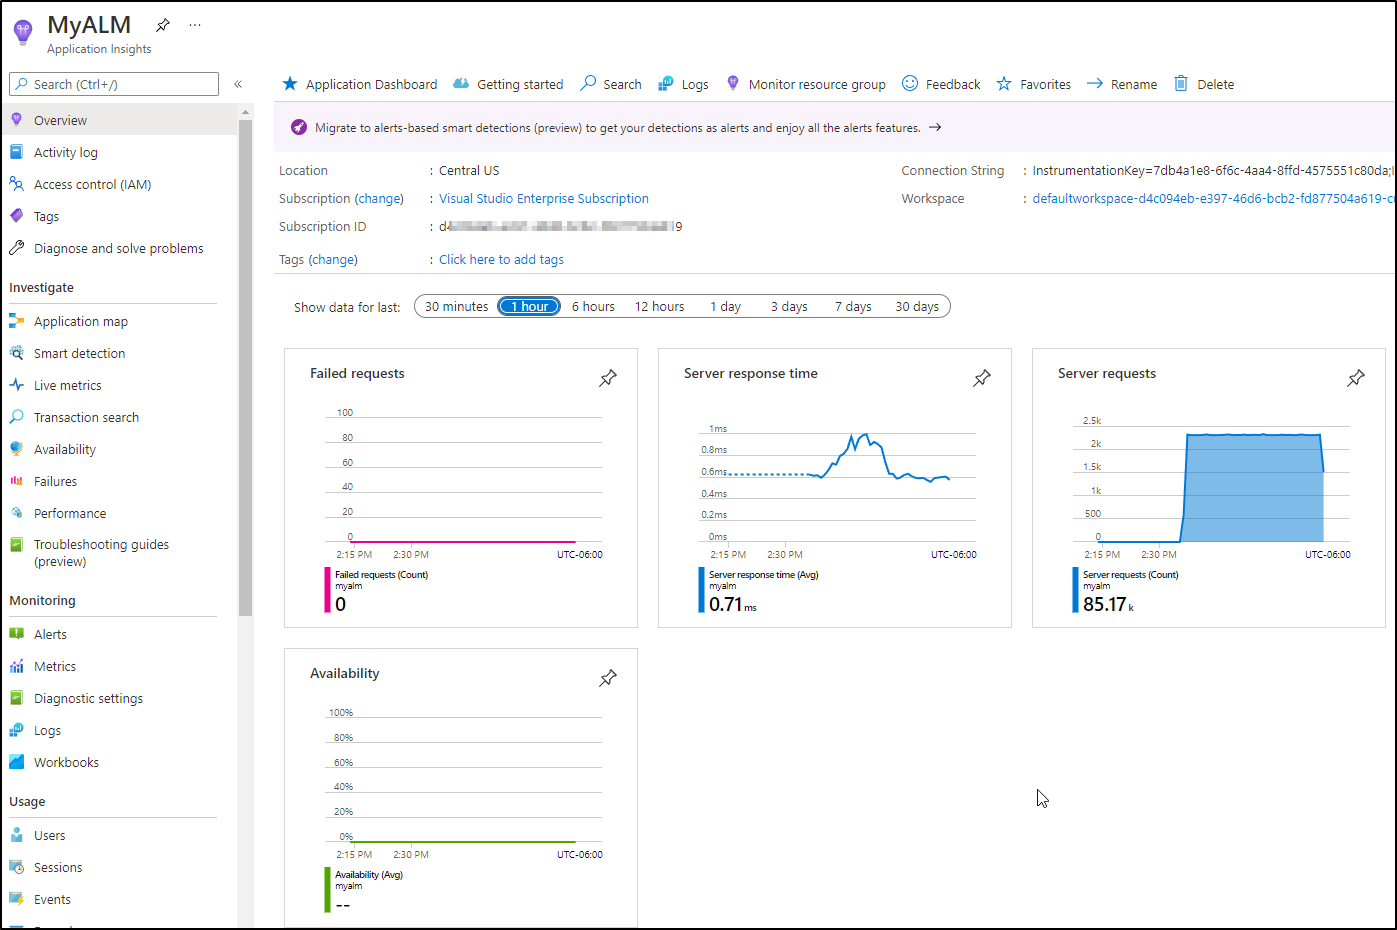
Create an Application Insights workspace in Azure (if you haven’t already):
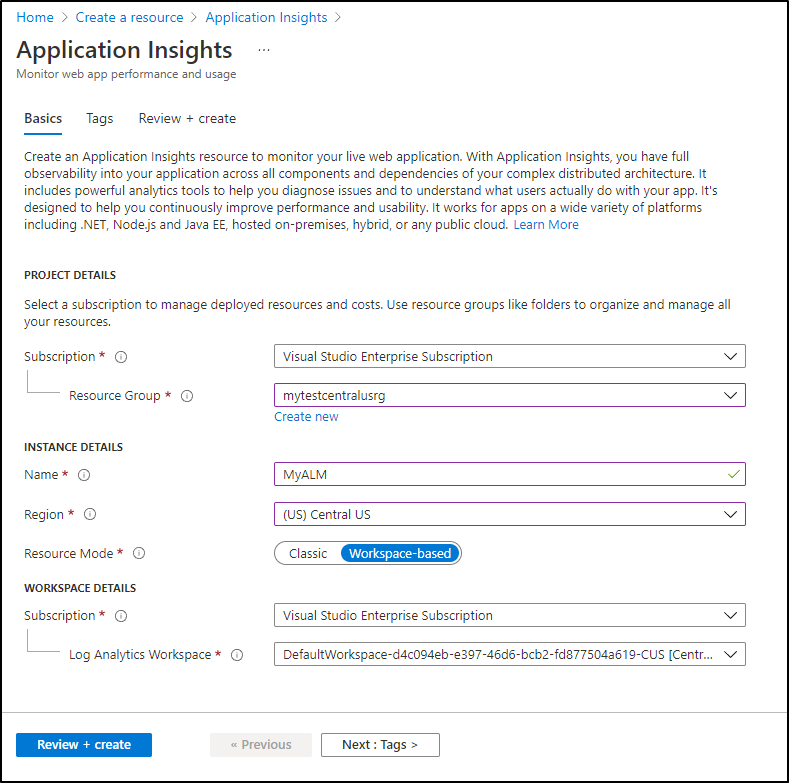
Fill in the details:
When created, go to the Overview to find the Instrumentation key:
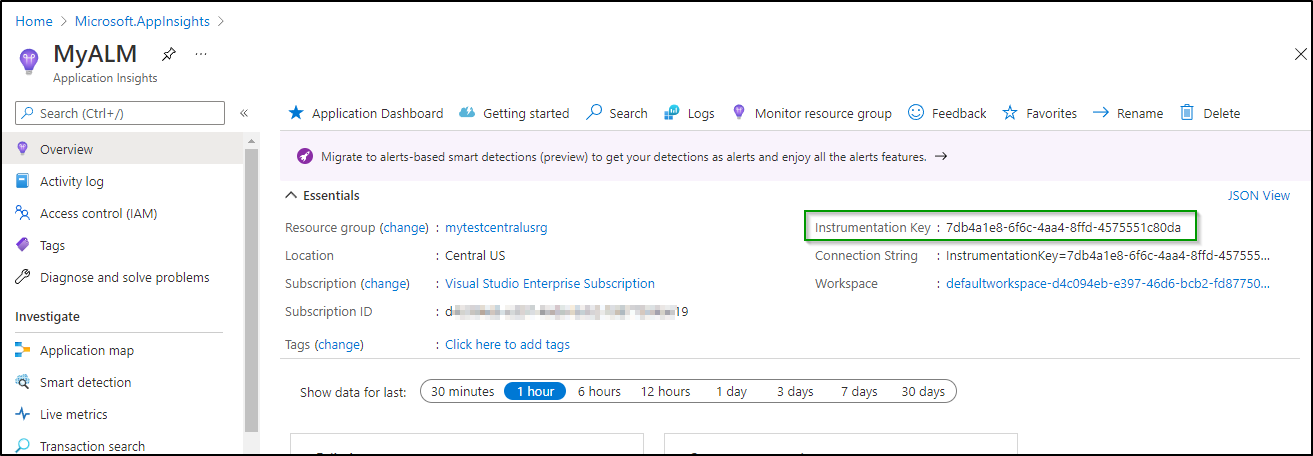
e.g. 7db4a1e8-6f6c-4aa4-8ffd-4575551c80da
The other piece we need is the endpoint which we can get from the Overview or Properties page
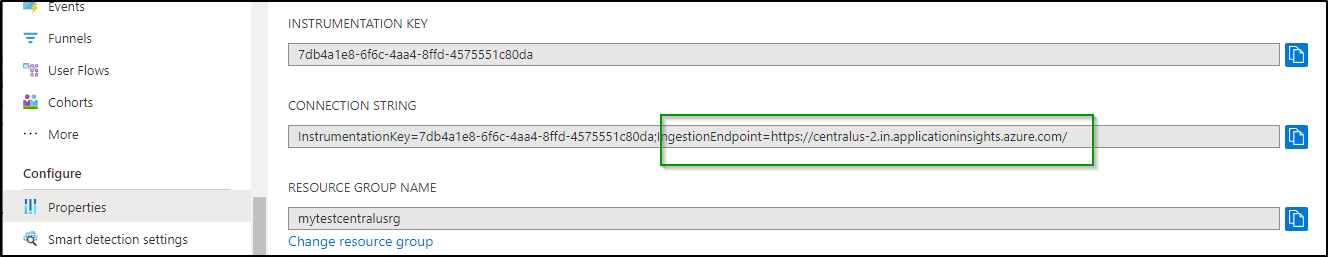
e.g. InstrumentationKey=7db4a1e8-6f6c-4aa4-8ffd-4575551c80da;IngestionEndpoint=https://centralus-2.in.applicationinsights.azure.com/
Now we can update the OTel conf to use it:
apiVersion: v1
data:
  otel-collector-config: |
    receivers:
      zipkin:
        endpoint: 0.0.0.0:9411
    extensions:
      health_check:
      pprof:
        endpoint: :1888
      zpages:
        endpoint: :55679
    exporters:
      logging:
        loglevel: debug
      azuremonitor:
        instrumentation_key: "7db4a1e8-6f6c-4aa4-8ffd-4575551c80da"
        endpoint: "https://centralus-2.in.applicationinsights.azure.com/v2/track"
      datadog:
        api:
          key: "fasdfasfasdasdfasdfasdfasdfasdfasdf4"
      newrelic:
        apikey: casdfasdfsadfsadfasdfasdfasdfAL
        timeout: 30s

    service:
      extensions: [pprof, zpages, health_check]
      pipelines:
        traces:
          receivers: [zipkin]
          # List your exporter here.
          exporters: [azuremonitor, datadog, newrelic, logging]
    # datadog/api maybe?
kind: ConfigMap
metadata:
  creationTimestamp: "2021-04-16T01:10:08Z"
  labels:
    app: opentelemetry
    component: otel-collector-conf
  name: otel-collector-conf
  namespace: default
  resourceVersion: "108148782"
  uid: caae6b5c-b4ea-44f6-8ede-4824a51e2563
Now I’ll apply and rotate the pod to make it take effect:
$ diff otel-collector-conf.yaml otel-collector-conf.yaml.bak2
26,27c26,27
<         instrumentation_key: "7db4a1e8-6f6c-4aa4-8ffd-4575551c80da"
<         endpoint: "https://centralus-2.in.applicationinsights.azure.com/v2/track"
---
>         instrumentation_key: "4dddaa6d-1b0b-48ae-993f-80a4add6c3b0"
>         endpoint: "https://eastus-8.in.applicationinsights.azure.com/v2/track"
$ kubectl apply -f otel-collector-conf.yaml
configmap/otel-collector-conf configured
$ kubectl get pods | grep tel
otel-collector-85b54fbfdc-p5466                         1/1     Running   0          7d22h
$ kubectl delete pod otel-collector-85b54fbfdc-p5466
pod "otel-collector-85b54fbfdc-p5466" deleted
$ kubectl get pods | grep tel
otel-collector-85b54fbfdc-qbxqf                         1/1     Running   0          3m27s
The reason i check that the pod is running after is that on occasion I’ve typo’ed on the conf or had a bad entry, in which case the pod will crash.
I can then check that we are indeed receiving requests:
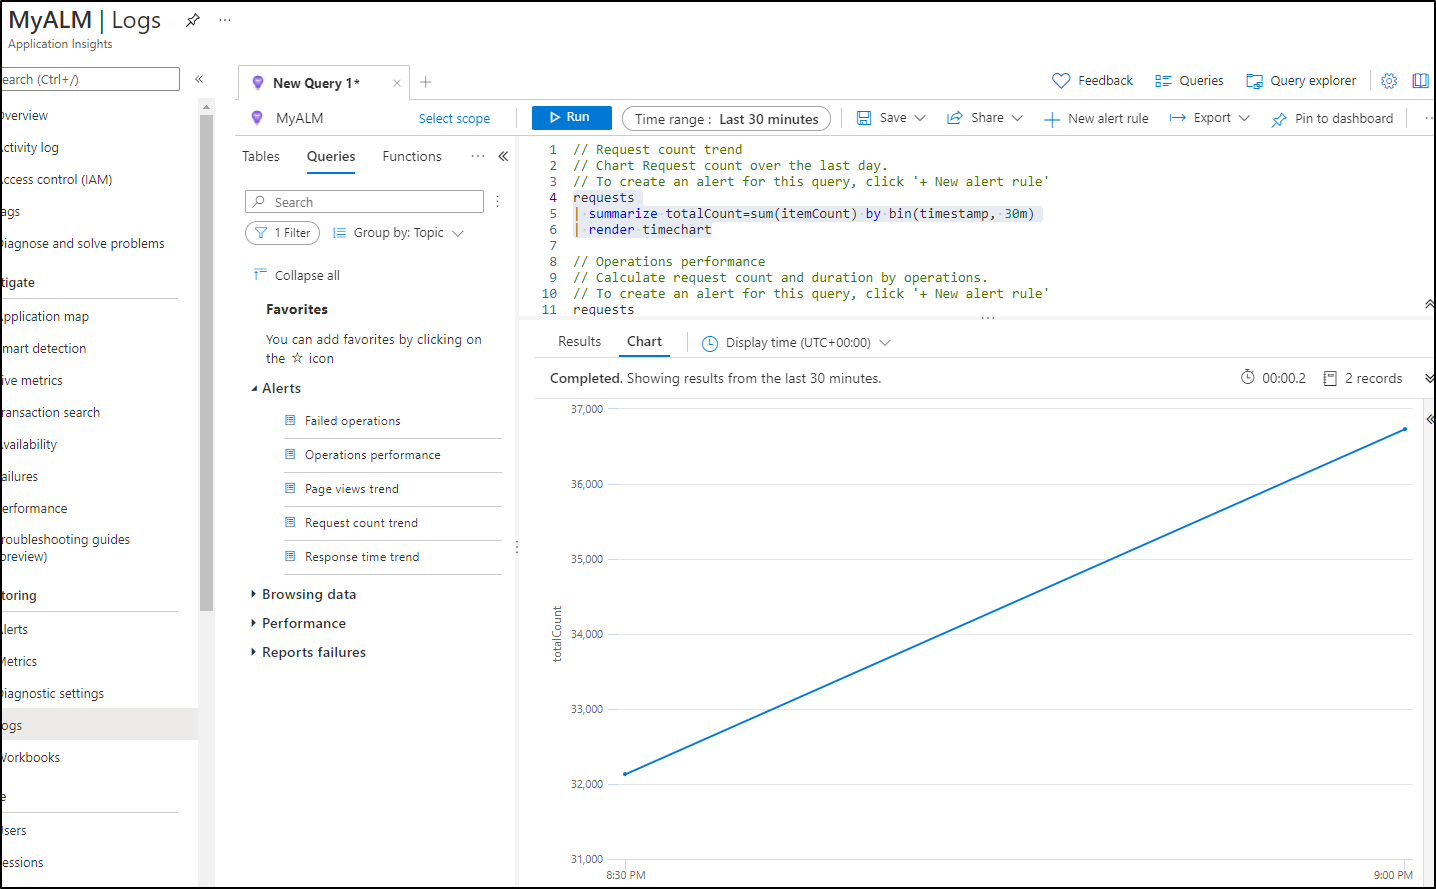
Another way we can check that OTel is populating ALM is via a Query:
requests
| summarize totalCount=sum(itemCount) by bin(timestamp, 30m)
| render timechart
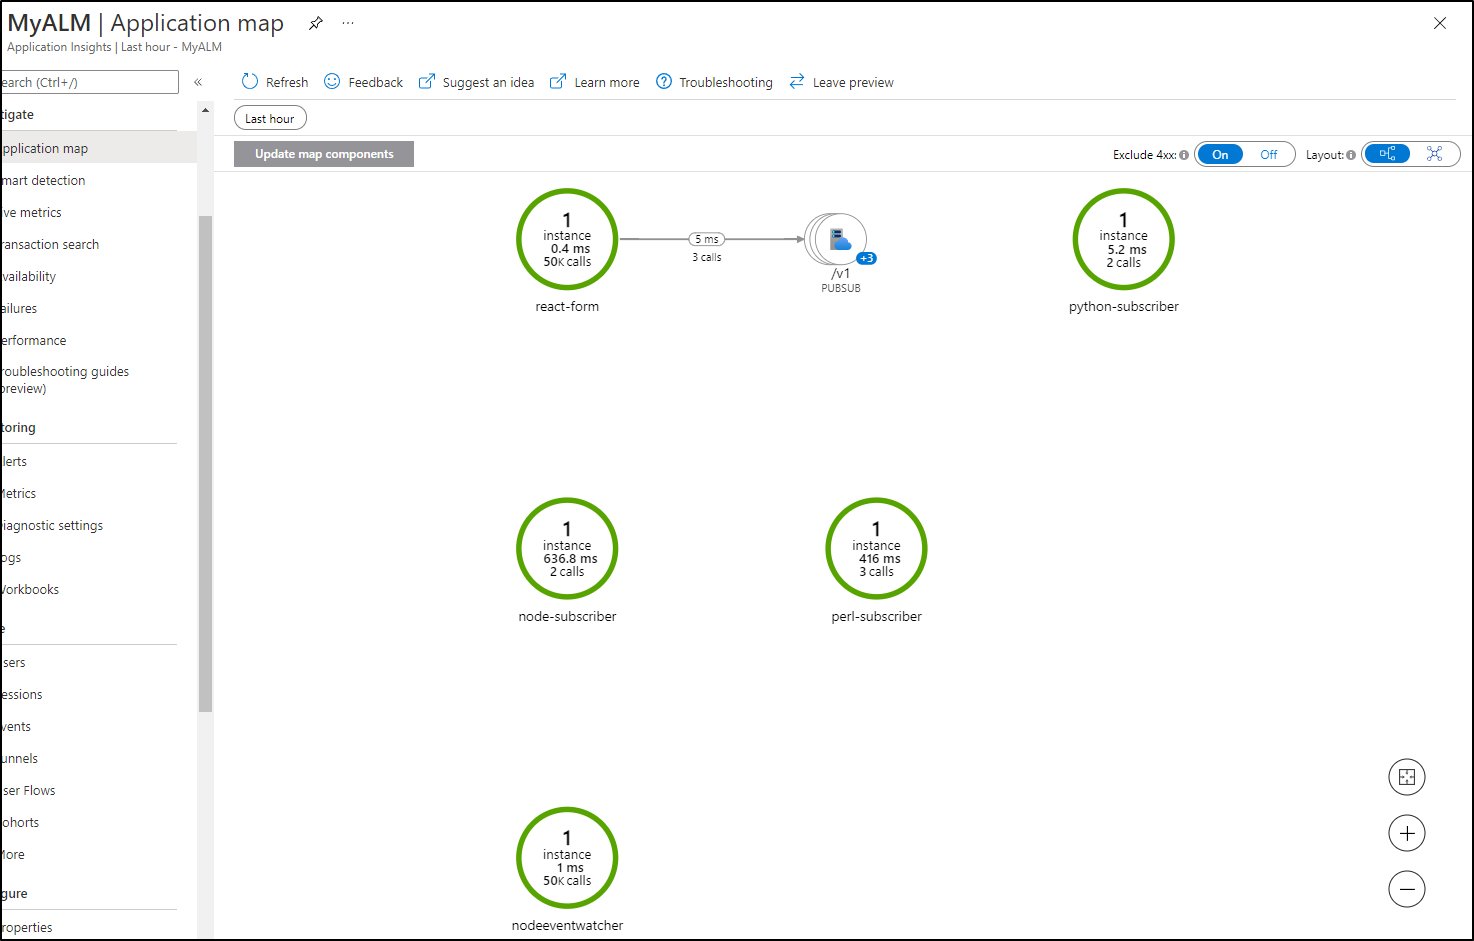
What is nice is that I have a few prior apps on this cluster already.
So without hammering endpoints, the Application map found two instances

To populate more data, I port-forwarded in my cluster to a few endpoints and hit the URLs
$ kubectl port-forward vote-front-azure-vote-1608995981-588948447b-mvpdr 8080:80
$ kubectl port-forward react-form-79c7989844-5gz7r 8080:8080
$ kubectl get pods | grep perl
$ kubectl describe pod perl-subscriber-57778545dc-tztsq
$ kubectl port-forward perl-subscriber-57778545dc-tztsq 8080:8080
And now we see a few more instances as exposed via Dapr to OTel
Datadog and APM
We can see those same services showing up in the APM section of Datadog:
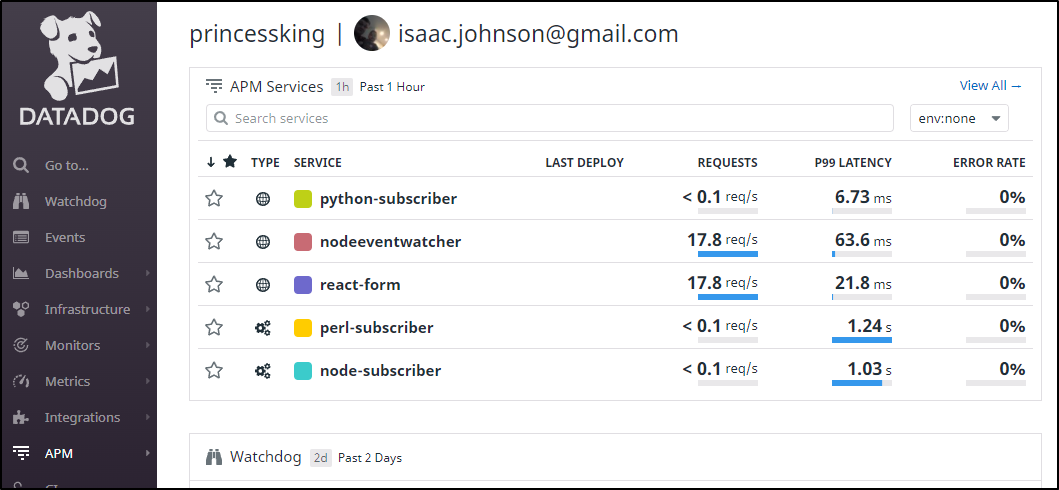
But when we go to the service map, it is clear Datadog used more data to corelate the services determining that indeed, when i hit the react-form to populate 3 redis queues to trigger other pub-subs, it maps to the other instances
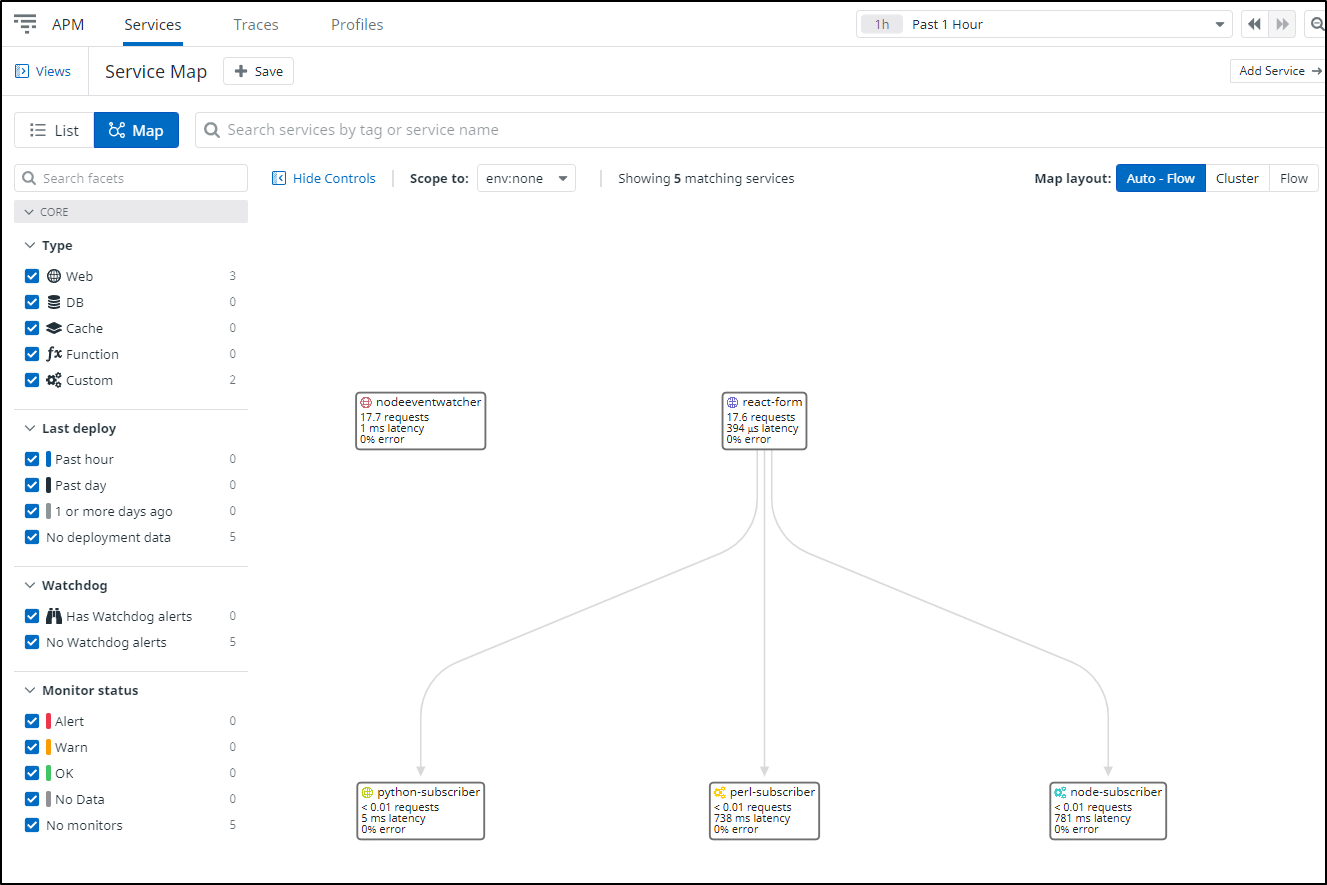
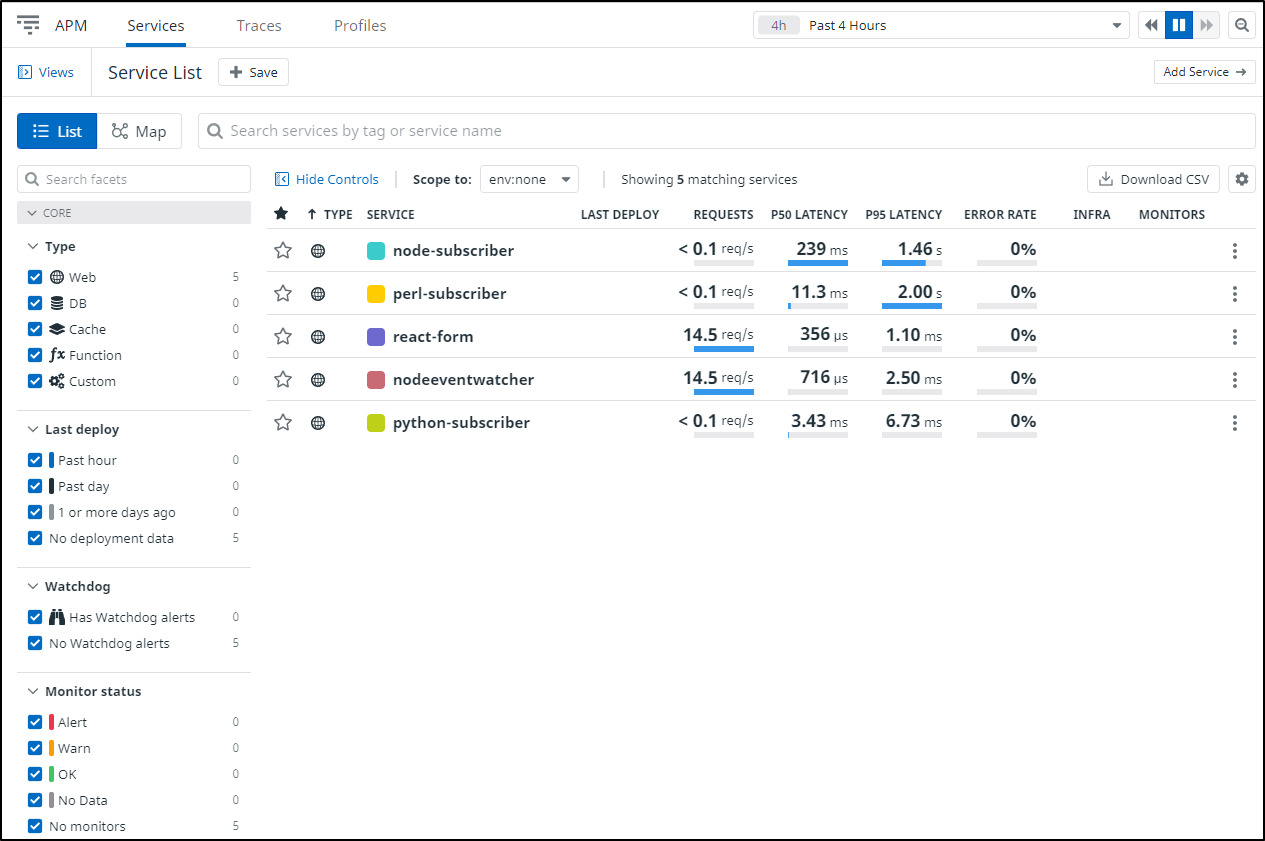
New Relic and APM
I tried many times to get the “Service Maps” section to work. Invariably it would just show me a table of data, not a map.
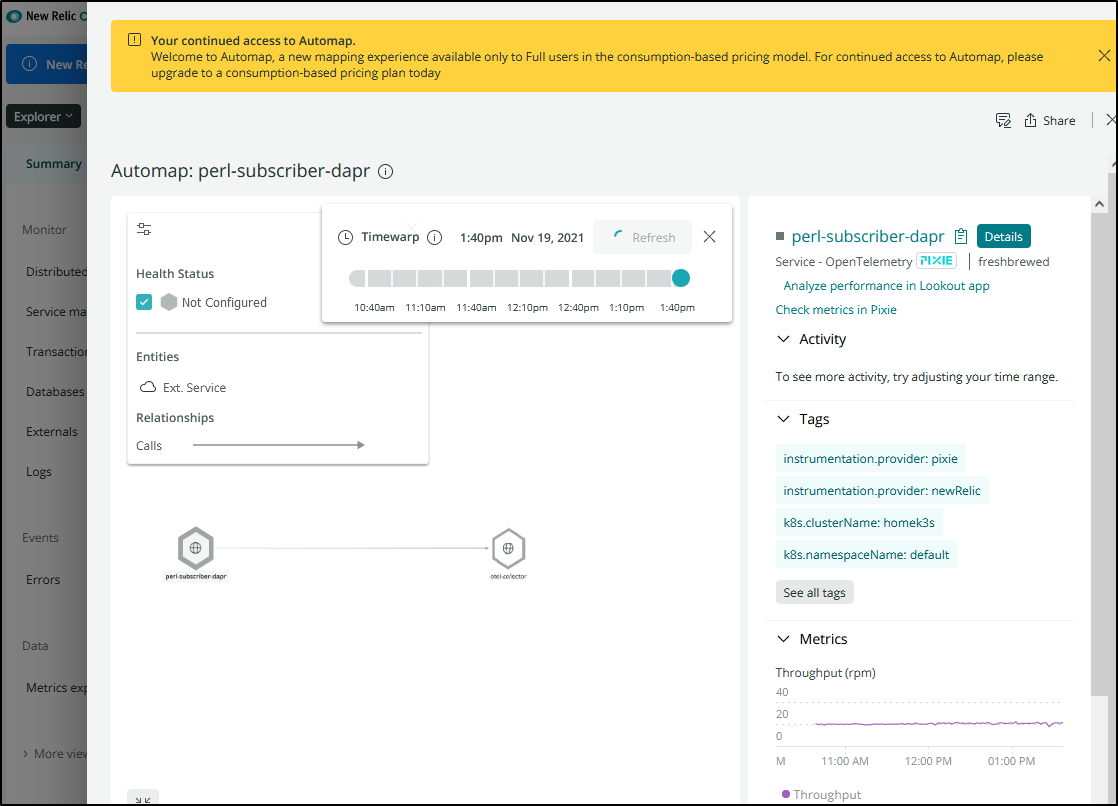
I could find a service and see that indeed the perl subscriber is tied to the react form via pubsub:
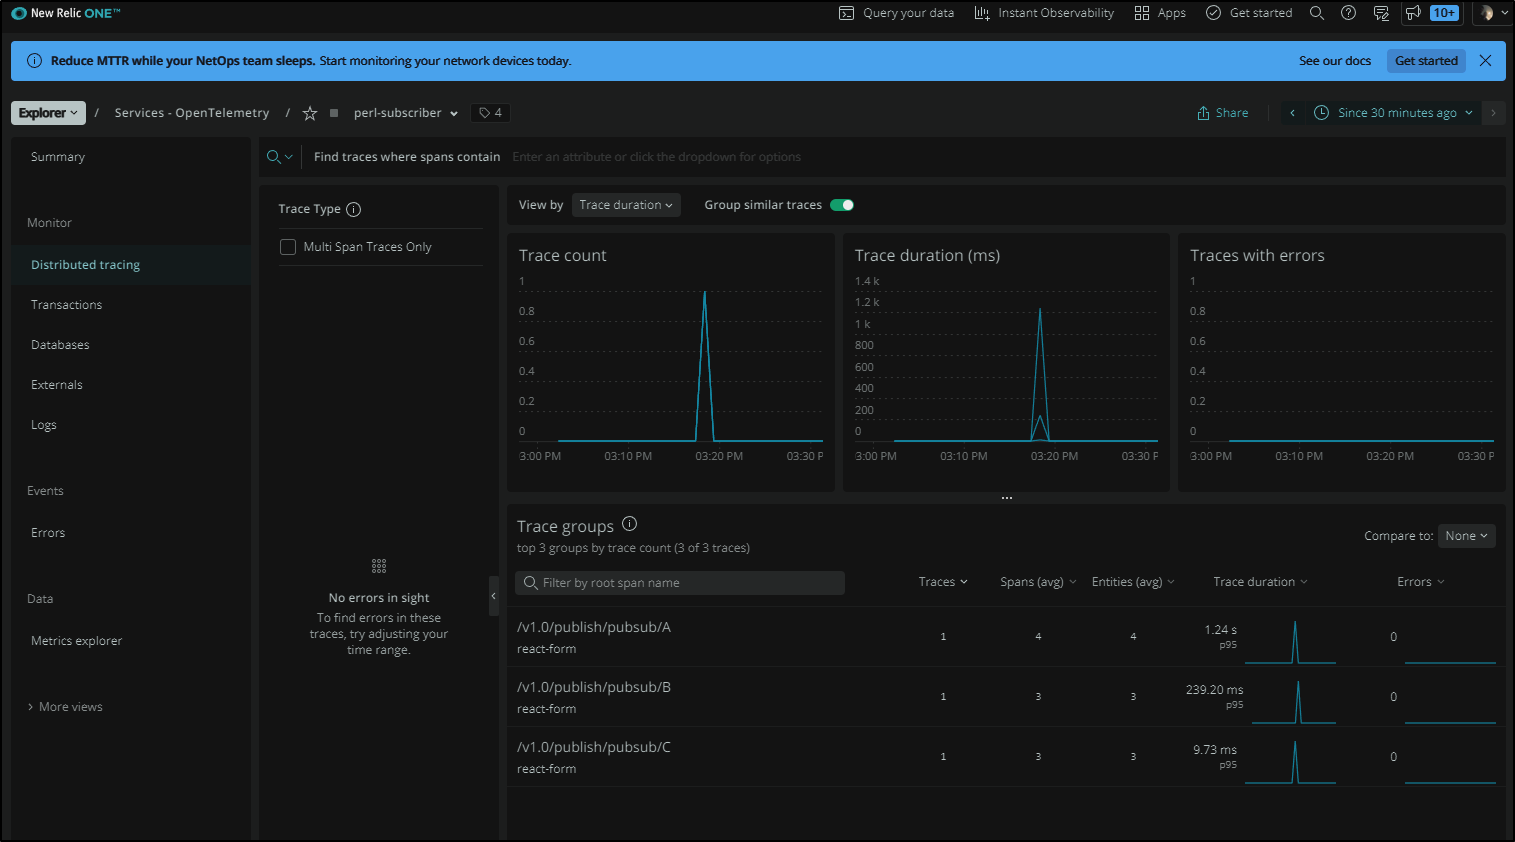
and if we navigate to that service’s overview:
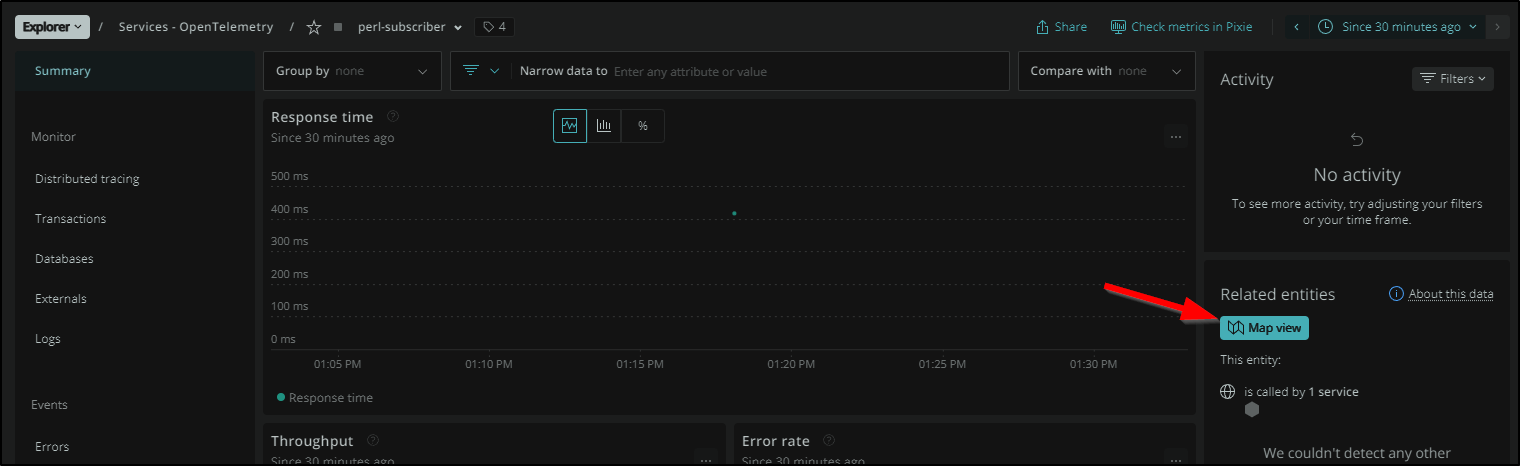
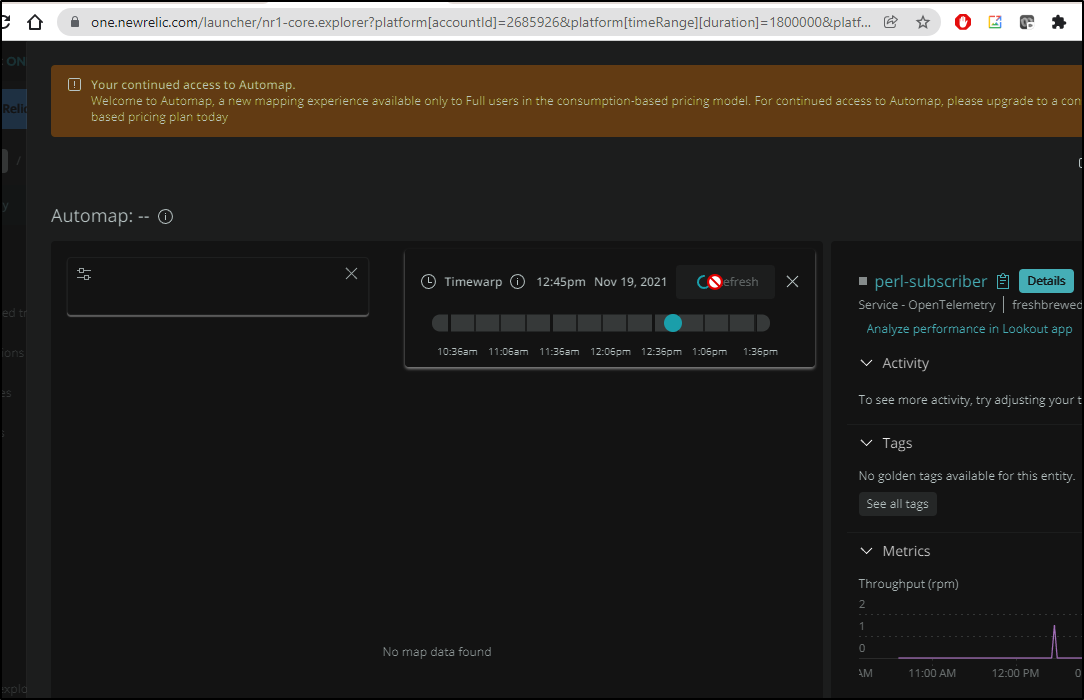
we can click the Map View to see that in some fashion it is related to react-form…
Well i did.. now i cannot. I cannot refresh on the slider and there is a nag-a-gram about upgrading to a consumption plan.
I could get the Dapr sidecar to show it does talk to the OTel Collector, however
And if we go to the OTel collector, we can see which services it ties to:
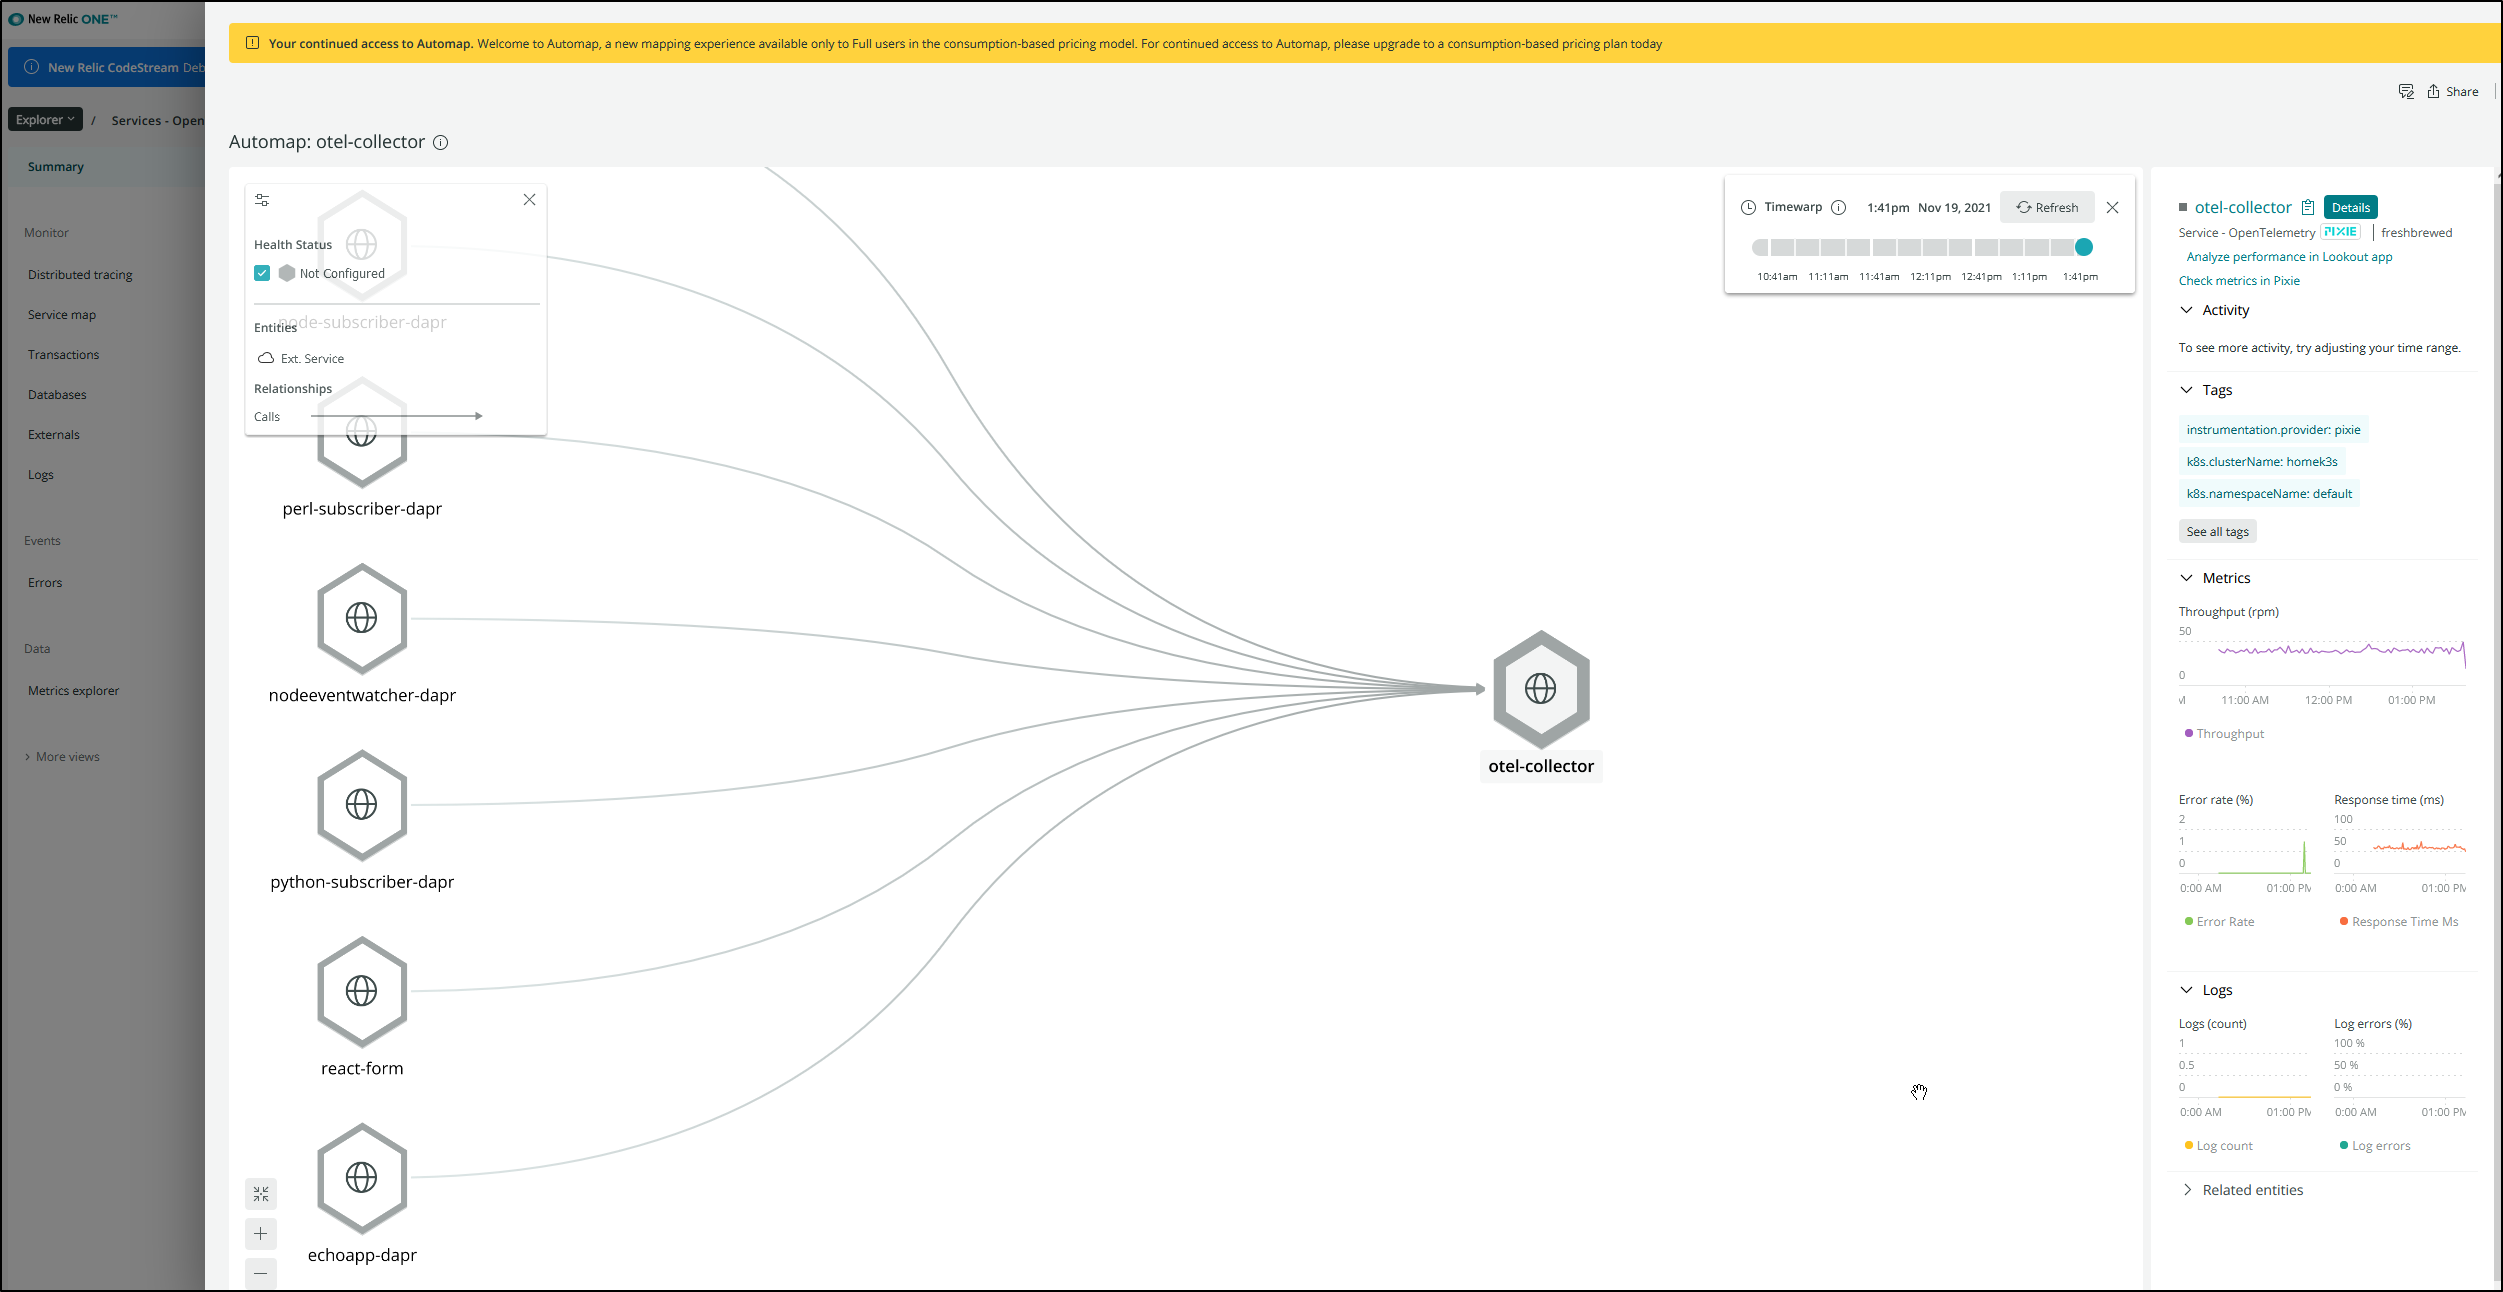
What is interesting is that this connectivity is being pulled from a very low level since Open Telemetry wouldn’t expose itself as a service. None of the other tools found these low level connections (sidecar relationships)
If I go to Datadog, I can only see the services that Dapr explicitly picked up via the applied appconfig profile annotation:
Custom Node JS: Direct Instrumentation
Since we tried directly instrumenting with Lightstep we should try the same with NewRelic.
We can see the steps to follow via the “Add Data” wizard for Node
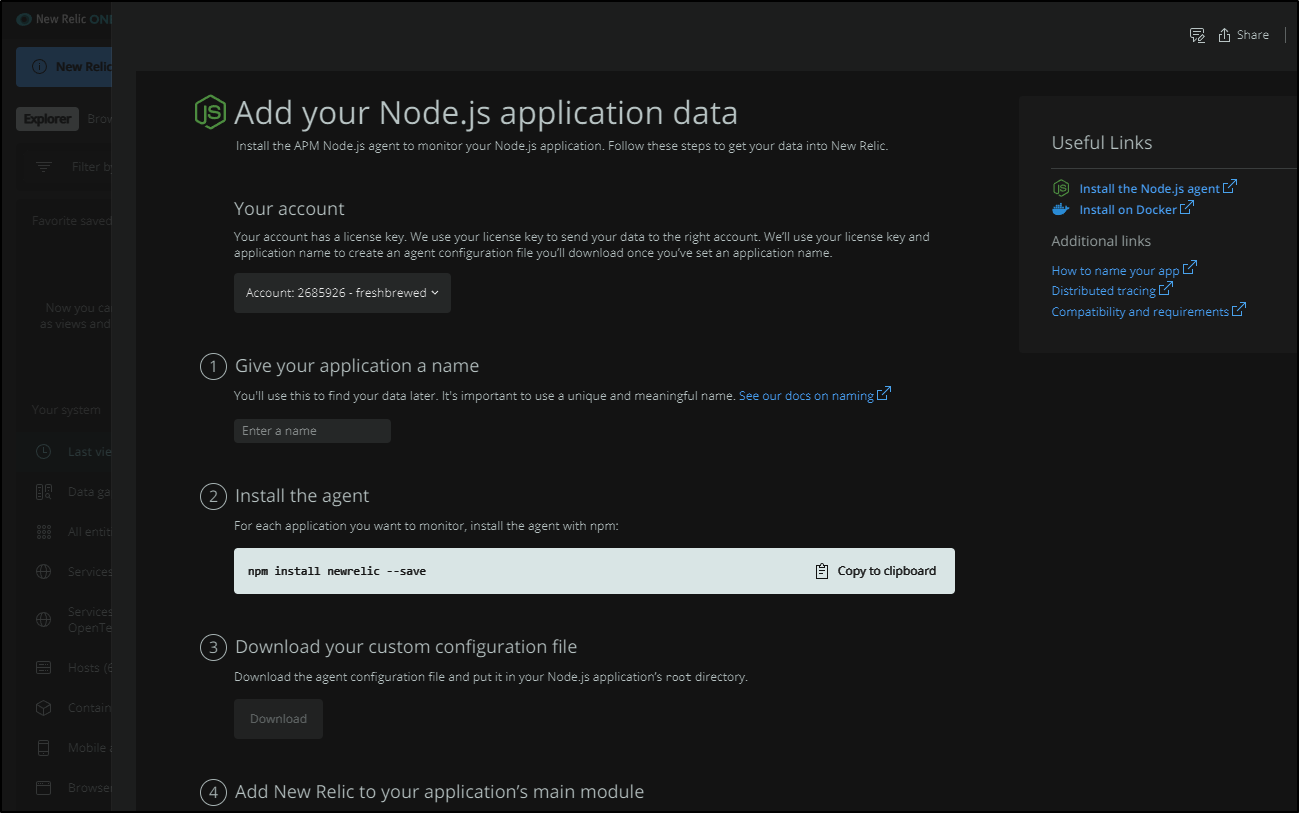
We’ll create a quick NodeJS app:
$ nvm use 14.18.1
Now using node v14.18.1 (npm v6.14.15)
$ npm init
This utility will walk you through creating a package.json file.
It only covers the most common items, and tries to guess sensible defaults.

See `npm help init` for definitive documentation on these fields
and exactly what they do.

Use `npm install <pkg>` afterwards to install a package and
save it as a dependency in the package.json file.

Press ^C at any time to quit.
package name: (testingnewrelic)
version: (1.0.0)
description:
entry point: (index.js)
test command:
git repository:
keywords: newrelic, apm
author: Isaac Johnson
license: (ISC) MIT
About to write to /home/builder/Workspaces/testingNewRelic/package.json:

{
  "name": "testingnewrelic",
  "version": "1.0.0",
  "description": "",
  "main": "index.js",
  "scripts": {
    "test": "echo \"Error: no test specified\" && exit 1"
  },
  "keywords": [
    "newrelic",
    "apm"
  ],
  "author": "Isaac Johnson",
  "license": "MIT"
}
Then add express, request, and the newrelic node package
$ npm install --save express@4.17.1
npm notice created a lockfile as package-lock.json. You should commit this file.
npm WARN testingnewrelic@1.0.0 No description
npm WARN testingnewrelic@1.0.0 No repository field.

+ express@4.17.1
added 50 packages from 37 contributors and audited 50 packages in 2.887s
found 0 vulnerabilities


   ╭───────────────────────────────────────────────────────────────╮
   │                                                               │
   │      New major version of npm available! 6.14.15 → 8.1.4      │
   │   Changelog: https://github.com/npm/cli/releases/tag/v8.1.4   │
   │               Run npm install -g npm to update!               │
   │                                                               │
   ╰───────────────────────────────────────────────────────────────╯


$ npm install newrelic --save

> @newrelic/native-metrics@7.0.2 install /home/builder/Workspaces/testingNewRelic/node_modules/@newrelic/native-metrics
> node ./lib/pre-build.js install native_metrics

============================================================================
Attempting install in native-metrics module. Please note that this is an
OPTIONAL dependency, and any resultant errors in this process will not
affect the general performance of the New Relic agent, but event loop and
garbage collection metrics will not be collected.
============================================================================

> /home/builder/.nvm/versions/node/v14.18.1/bin/node /home/builder/.nvm/versions/node/v14.18.1/lib/node_modules/npm/node_modules/node-gyp/bin/node-gyp.js clean configure
> /home/builder/.nvm/versions/node/v14.18.1/bin/node /home/builder/.nvm/versions/node/v14.18.1/lib/node_modules/npm/node_modules/node-gyp/bin/node-gyp.js build -j 8 native_metrics
make: Entering directory '/home/builder/Workspaces/testingNewRelic/node_modules/@newrelic/native-metrics/build'
  CXX(target) Release/obj.target/native_metrics/src/native_metrics.o
  CXX(target) Release/obj.target/native_metrics/src/GCBinder.o
  CXX(target) Release/obj.target/native_metrics/src/LoopChecker.o
  CXX(target) Release/obj.target/native_metrics/src/RUsageMeter.o
  SOLINK_MODULE(target) Release/obj.target/native_metrics.node
  COPY Release/native_metrics.node
make: Leaving directory '/home/builder/Workspaces/testingNewRelic/node_modules/@newrelic/native-metrics/build'
install successful: _newrelic_native_metrics-7_0_2-native_metrics-83-linux-x64

> protobufjs@6.11.2 postinstall /home/builder/Workspaces/testingNewRelic/node_modules/protobufjs
> node scripts/postinstall

npm WARN testingnewrelic@1.0.0 No description
npm WARN testingnewrelic@1.0.0 No repository field.

+ newrelic@8.6.0
added 57 packages from 101 contributors and audited 107 packages in 7.46s

3 packages are looking for funding
  run `npm fund` for details

found 0 vulnerabilities
$ npm install request --save
npm WARN deprecated request@2.88.2: request has been deprecated, see https://github.com/request/request/issues/3142
npm WARN deprecated har-validator@5.1.5: this library is no longer supported
npm WARN deprecated uuid@3.4.0: Please upgrade  to version 7 or higher.  Older versions may use Math.random() in certain circumstances, which is known to be problematic.  See https://v8.dev/blog/math-random for details.
npm WARN testingnewrelic@1.0.0 No description
npm WARN testingnewrelic@1.0.0 No repository field.

+ request@2.88.2
added 42 packages from 51 contributors and audited 149 packages in 2.77s

4 packages are looking for funding
  run `npm fund` for details

found 1 moderate severity vulnerability
  run `npm audit fix` to fix them, or `npm audit` for details
With the index.js file as such:
$ cat index.js
const express = require('express')
const request = require('request')
const app = express()
const port = 3000

require('newrelic');

app.get('/', (req, res) => {
  res.send('Hello World!')
})

app.get('/weather', (req, res) => {

        let apiKey = 'axxxxxxxxxxxxxxxxxxxxxxxxxxxxxx';
        let city = 'minneapolis';
        let url = `http://api.openweathermap.org/data/2.5/weather?q=${city}&appid=${apiKey}`

        request(url, function (err, response, body) {
          if(err){
            console.log('error:', error);
          } else {
            console.log('body:', body);
          }
        });

          res.send('Hello Minneapolis!')
})

app.listen(port, () => {
  console.log(`Example app listening at http://localhost:${port}`)
})
and package.json with a start command:
$ cat package.json
{
  "name": "testingnewrelic",
  "version": "1.0.0",
  "description": "",
  "main": "index.js",
  "scripts": {
    "start": "node index.js",
    "test": "echo \"Error: no test specified\" && exit 1"
  },
  "keywords": [
    "newrelic",
    "apm"
  ],
  "author": "Isaac Johnson",
  "license": "MIT",
  "dependencies": {
    "express": "^4.17.1",
    "newrelic": "^8.6.0",
    "request": "^2.88.2"
  }
}
We can then run it (and hit http://localhost:3000/ and http://localhost:3000/weather)
$ npm run start

> testingnewrelic@1.0.0 start /home/builder/Workspaces/testingNewRelic
> node index.js

Example app listening at http://localhost:3000
body: {"coord":{"lon":-93.2638,"lat":44.98},"weather":[{"id":804,"main":"Clouds","description":"overcast clouds","icon":"04d"}],"base":"stations","main":{"temp":277.78,"feels_like":274.54,"temp_min":275.46,"temp_max":279.13,"pressure":1017,"humidity":48},"visibility":10000,"wind":{"speed":4.02,"deg":142,"gust":11.18},"clouds":{"all":91},"dt":1637358791,"sys":{"type":2,"id":2008025,"country":"US","sunrise":1637327795,"sunset":1637361647},"timezone":-21600,"id":5037649,"name":"Minneapolis","cod":200}
body: {"coord":{"lon":-93.2638,"lat":44.98},"weather":[{"id":804,"main":"Clouds","description":"overcast clouds","icon":"04d"}],"base":"stations","main":{"temp":277.78,"feels_like":274.54,"temp_min":275.46,"temp_max":279.13,"pressure":1017,"humidity":48},"visibility":10000,"wind":{"speed":4.02,"deg":142,"gust":11.18},"clouds":{"all":91},"dt":1637358791,"sys":{"type":2,"id":2008025,"country":"US","sunrise":1637327795,"sunset":1637361647},"timezone":-21600,"id":5037649,"name":"Minneapolis","cod":200}
We can see the details:
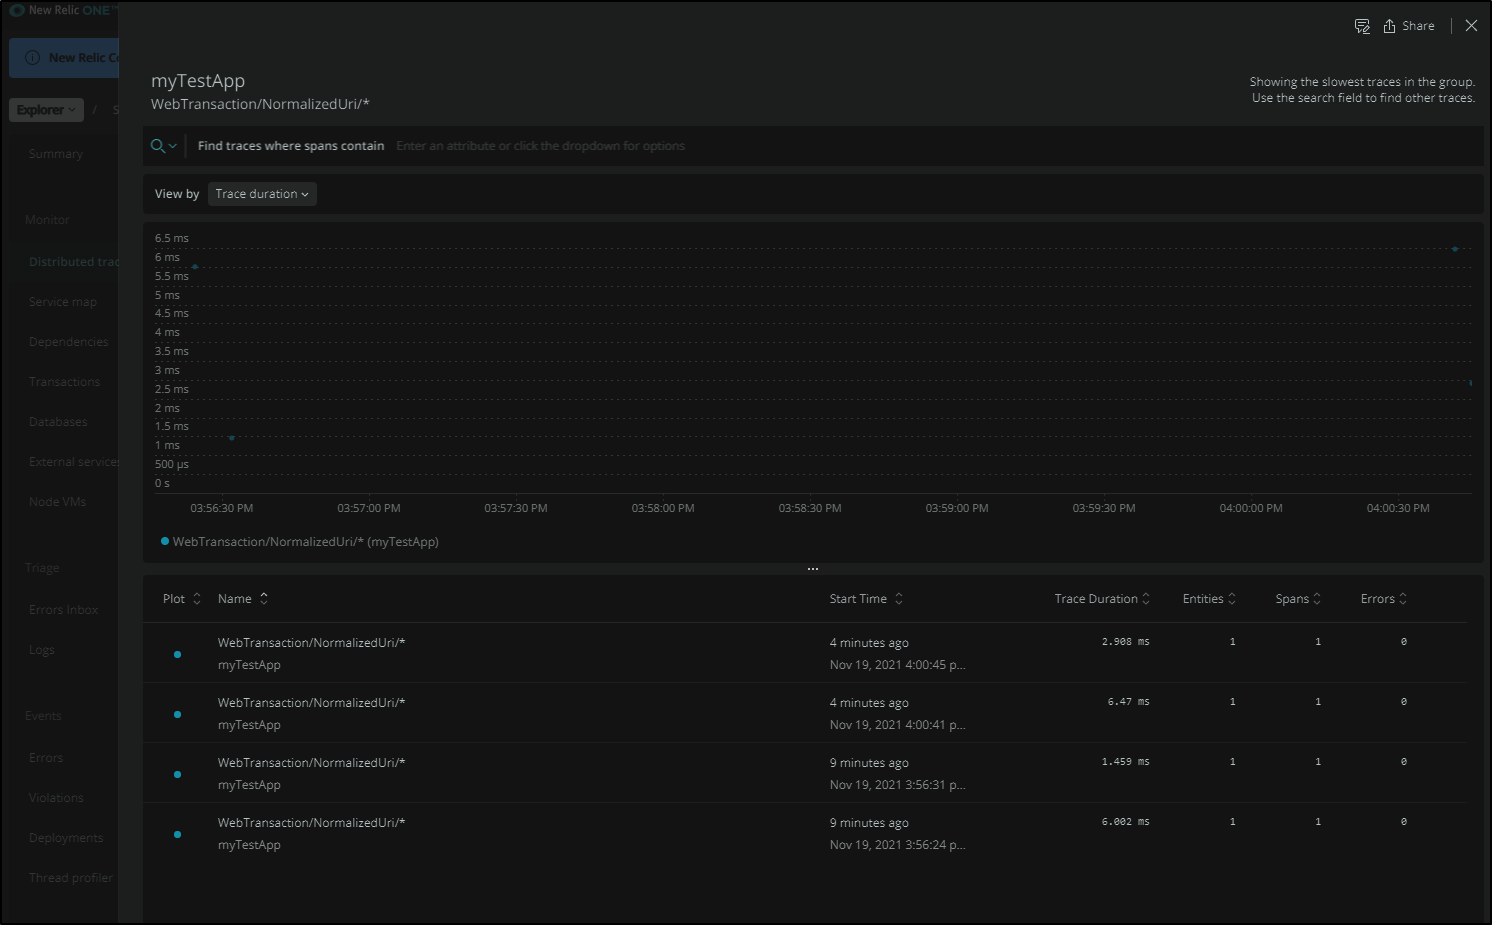
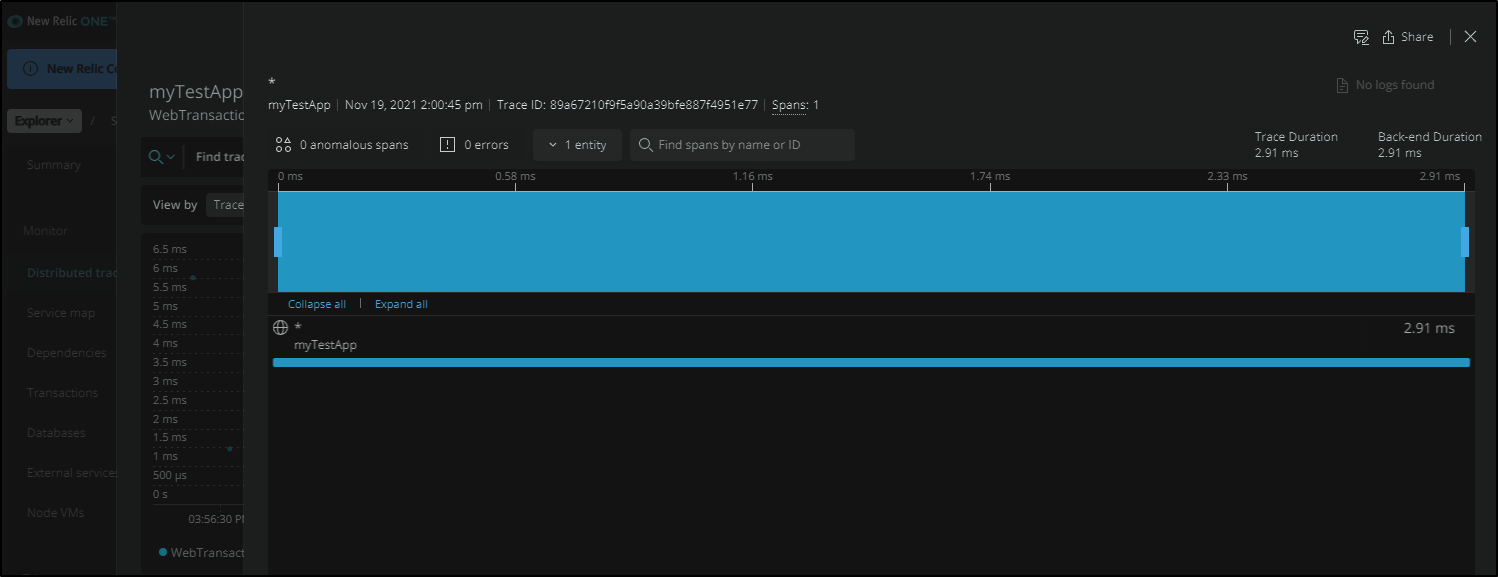
and look at a trace specifically:
If we look at service map at least we can see it’s seen as a service
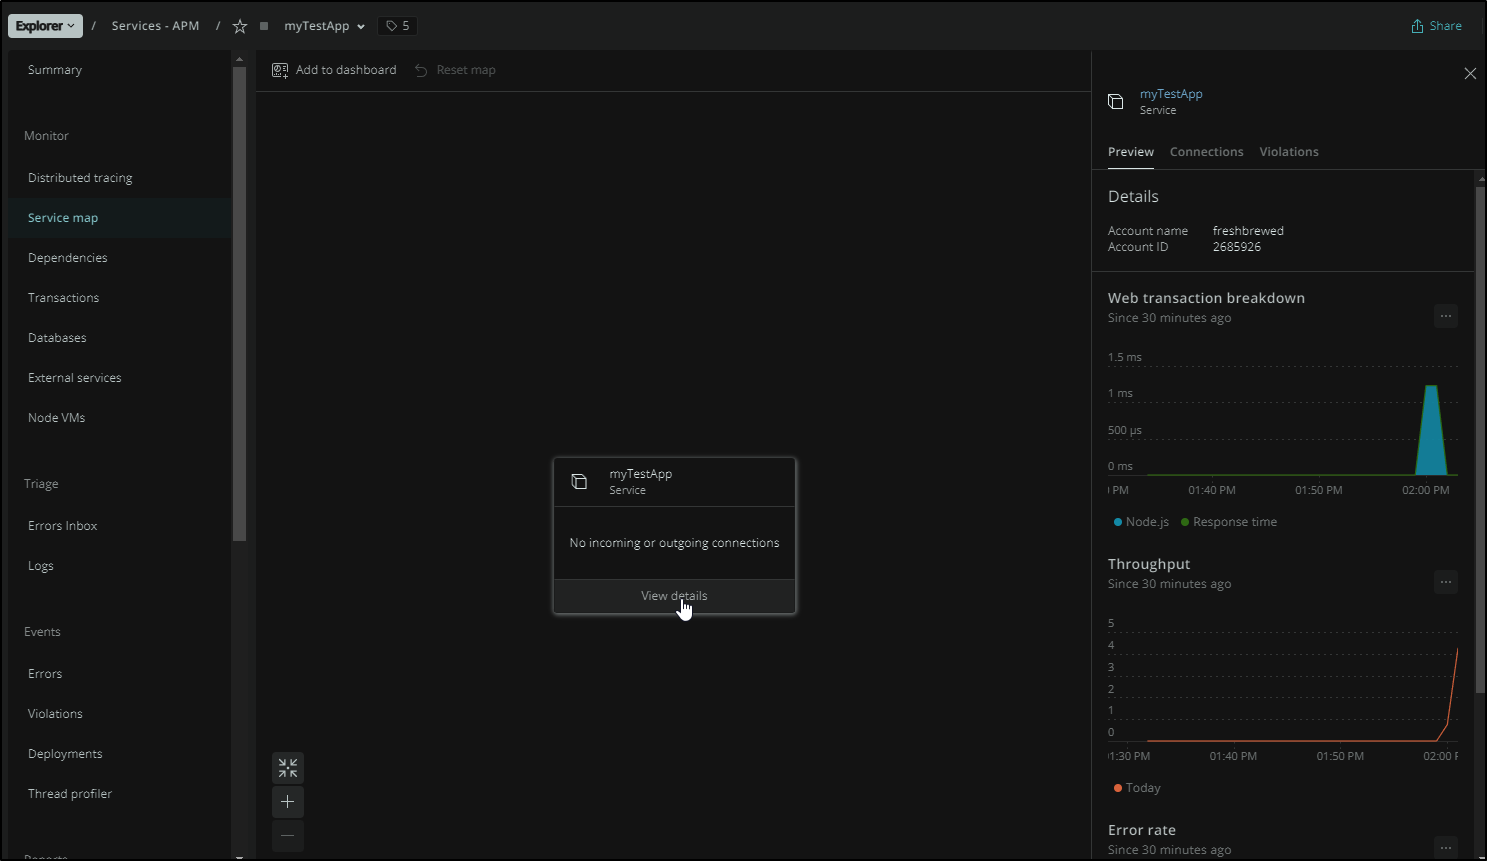
Let’s be clear, this is a fresh NodeJS app running in my local WSL, not in Kubernetes, not with Dapr.
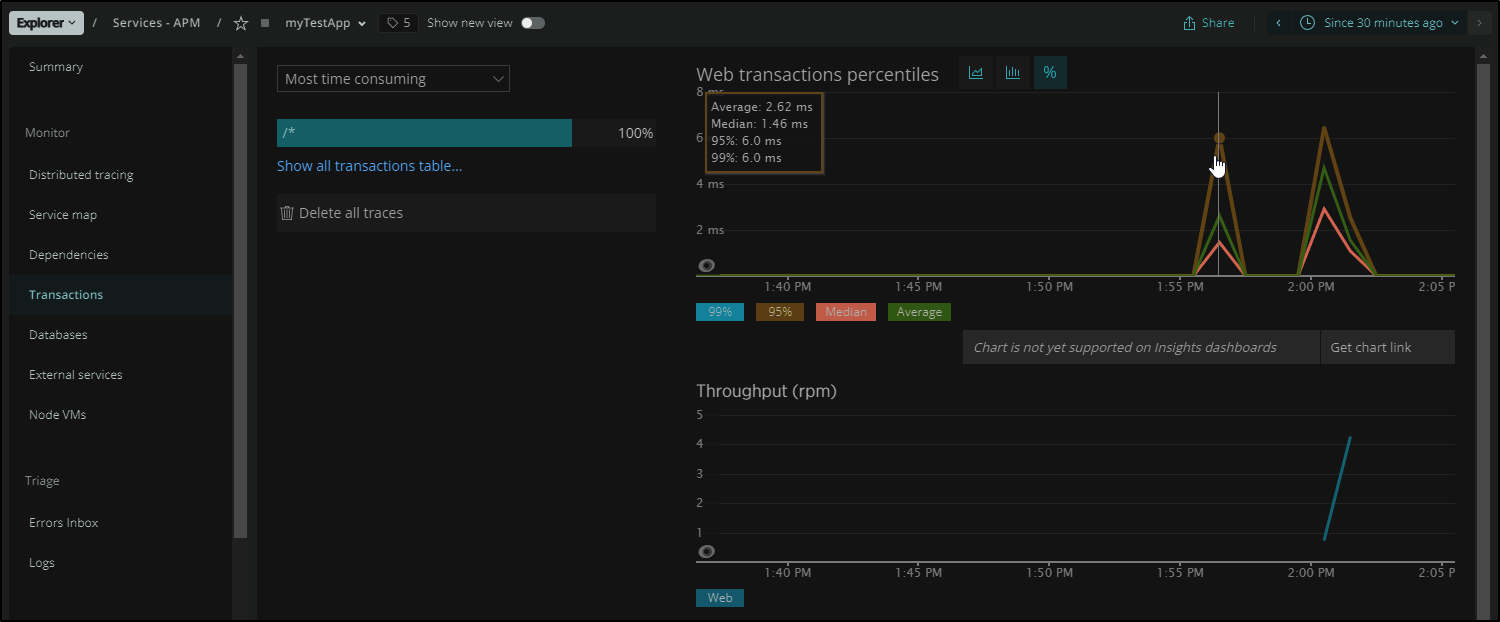
We can use the Transactions pane to see some basic transactional data:
Logging
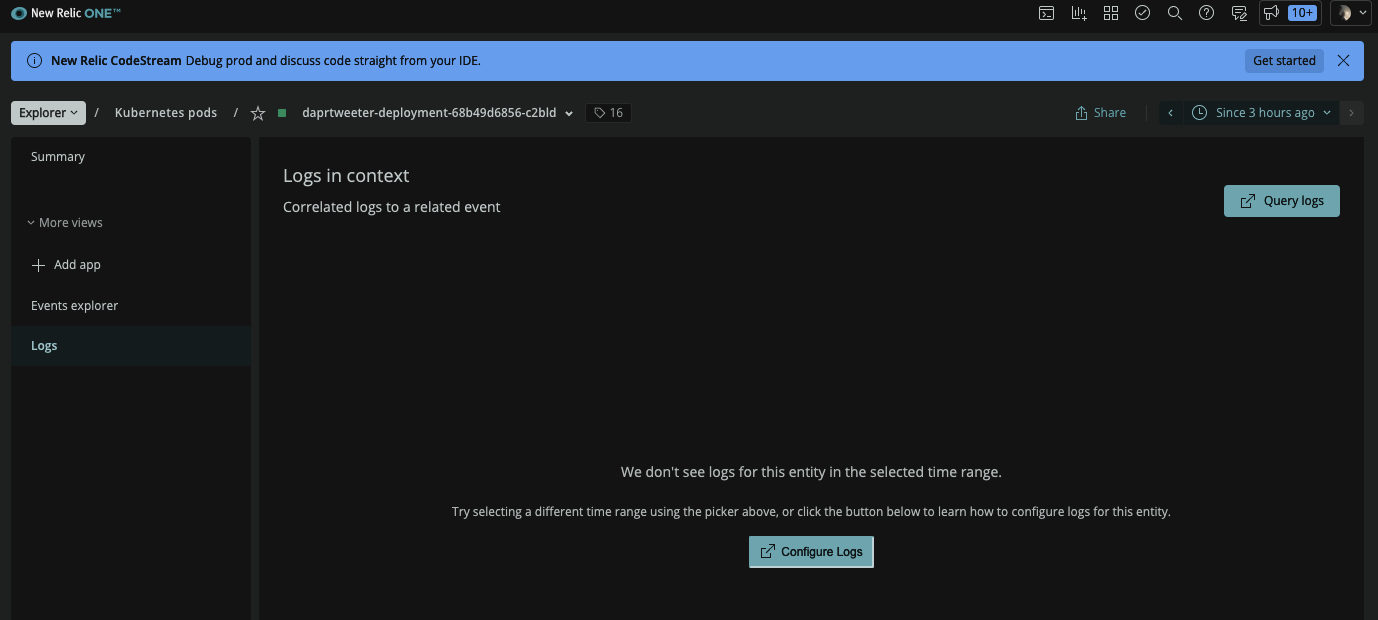
$ kubectl logs daprtweeter-deployment-68b49d6856-vklwx daprtweeter
Example app listening at http://localhost:8080
Newrelic
I could find events around a pod. I could find the pod deployment, for instance
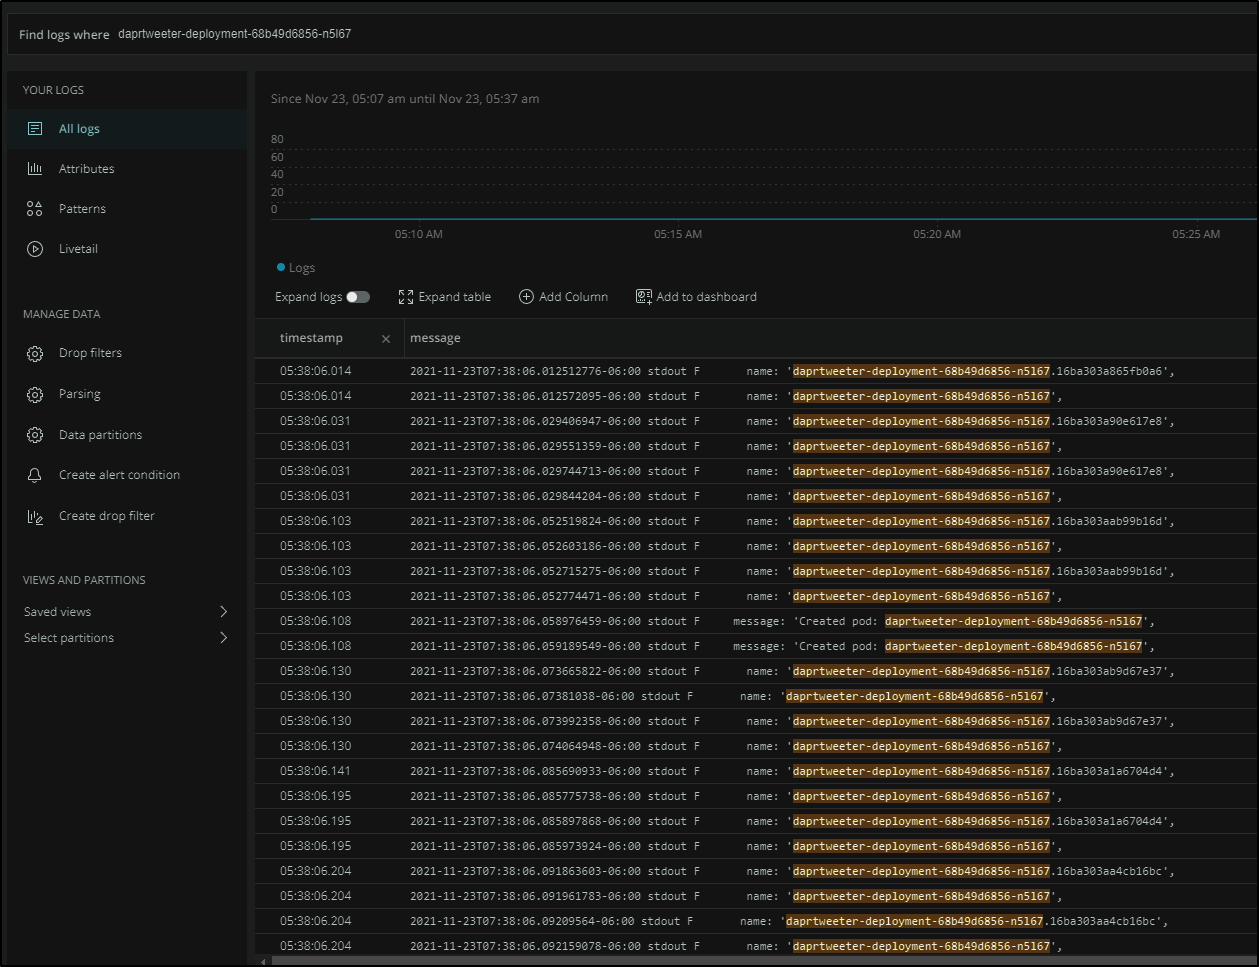
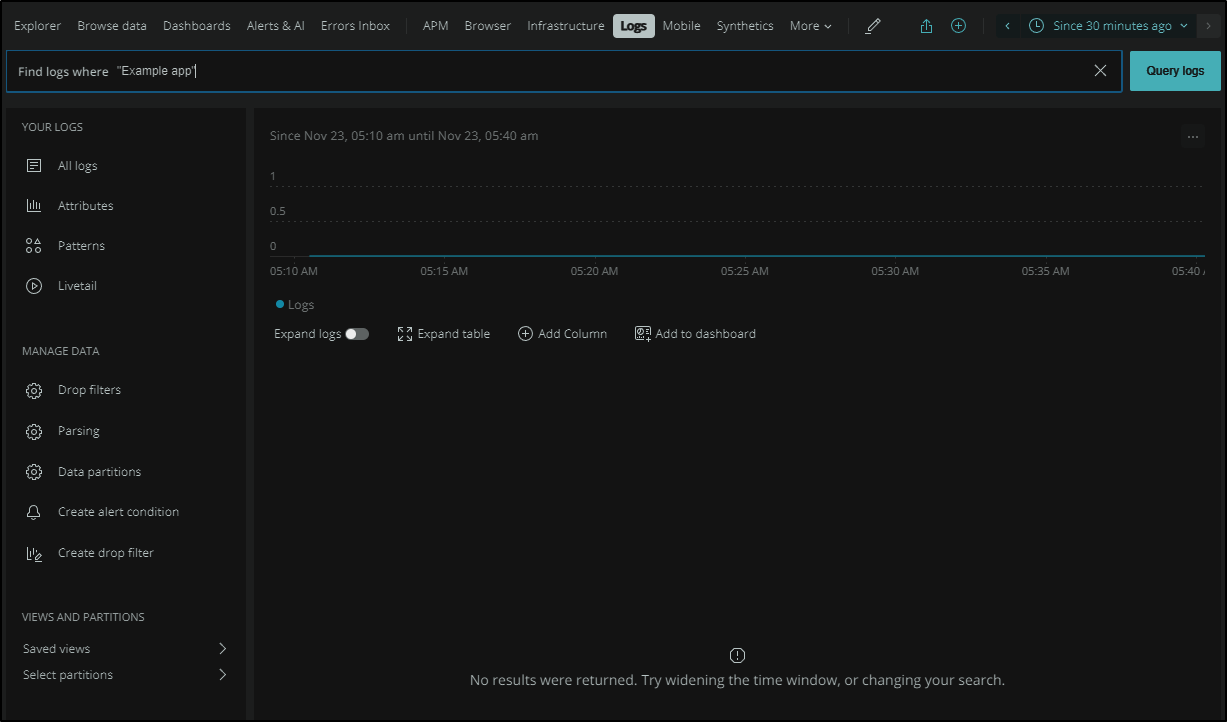
but searching on strings found nothing
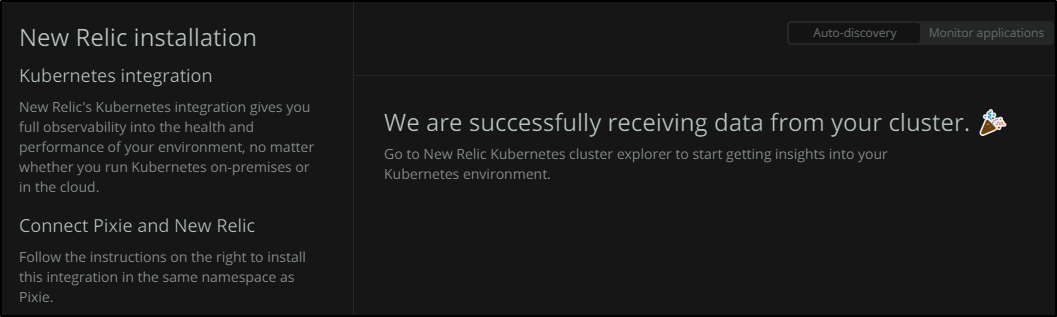
To be doubly sure i had things enabled, i upgraded the chart and verified New Relic was getting data
...
W1123 07:54:22.715250    6148 warnings.go:70] policy/v1beta1 PodSecurityPolicy is deprecated in v1.21+, unavailable in v1.25+
Release "newrelic-bundle" has been upgraded. Happy Helming!
NAME: newrelic-bundle
LAST DEPLOYED: Tue Nov 23 07:54:09 2021
NAMESPACE: newrelic
STATUS: deployed
REVISION: 2
TEST SUITE: None
I also waited a while to see if there was a delay in hydrating…
Again, checking the container by name:
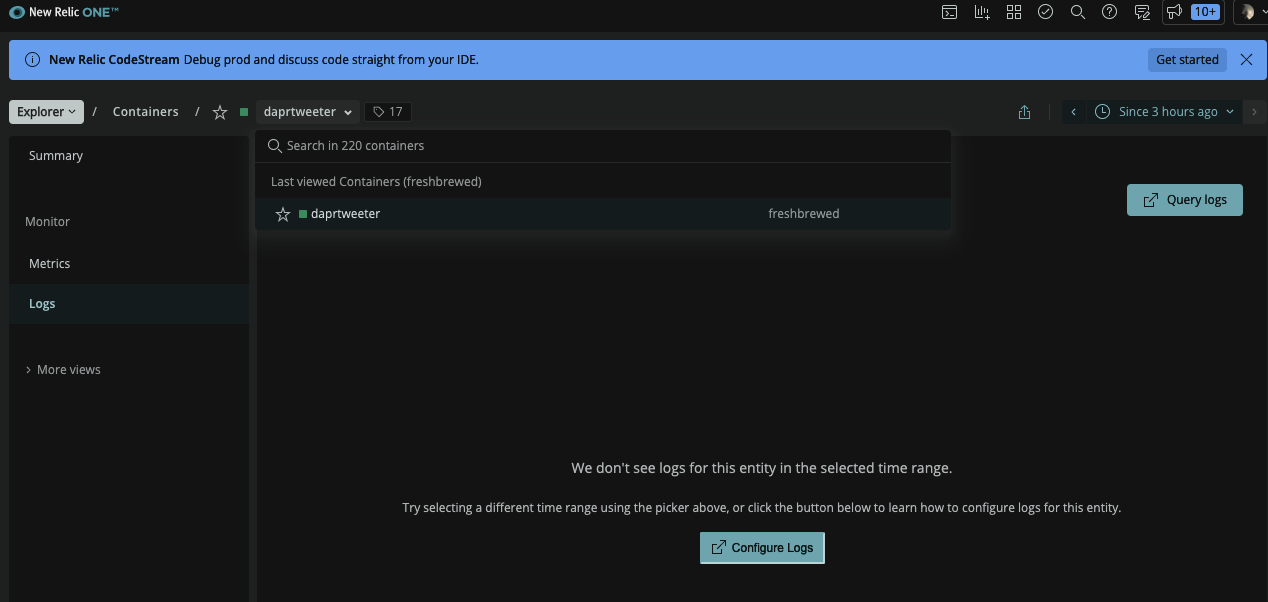
and the specific container as listed in the cluster:
$ kubectl logs daprtweeter-deployment-68b49d6856-c2bld daprtweeter
Example app listening at http://localhost:8080
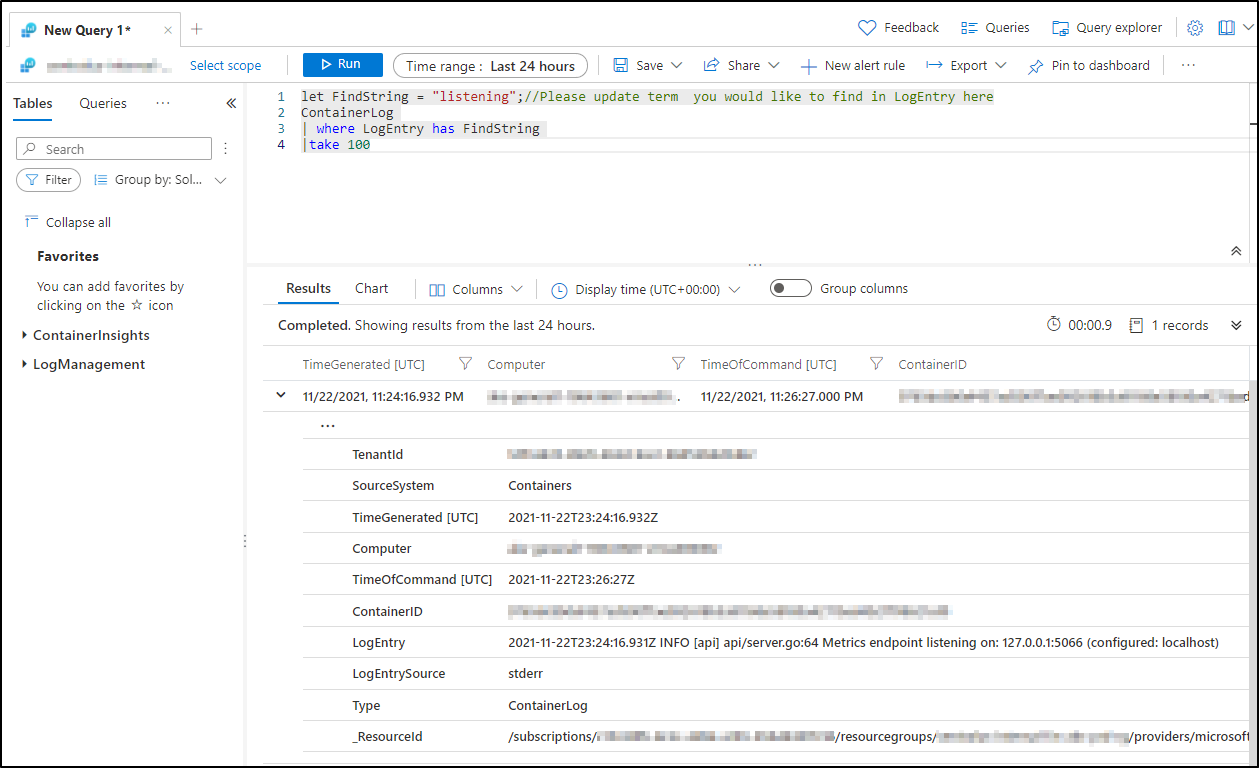
ALM
Azure Log Analytics workspaces, if we have container logging enabled (default for AKS), we can query logs with
let FindString = "listening";//Please update term  you would like to find in LogEntry here
ContainerLog
| where LogEntry has FindString
|take 100
Since we just use our ALM with OpenTelemetry, I had no logs to show. But generally it looks like
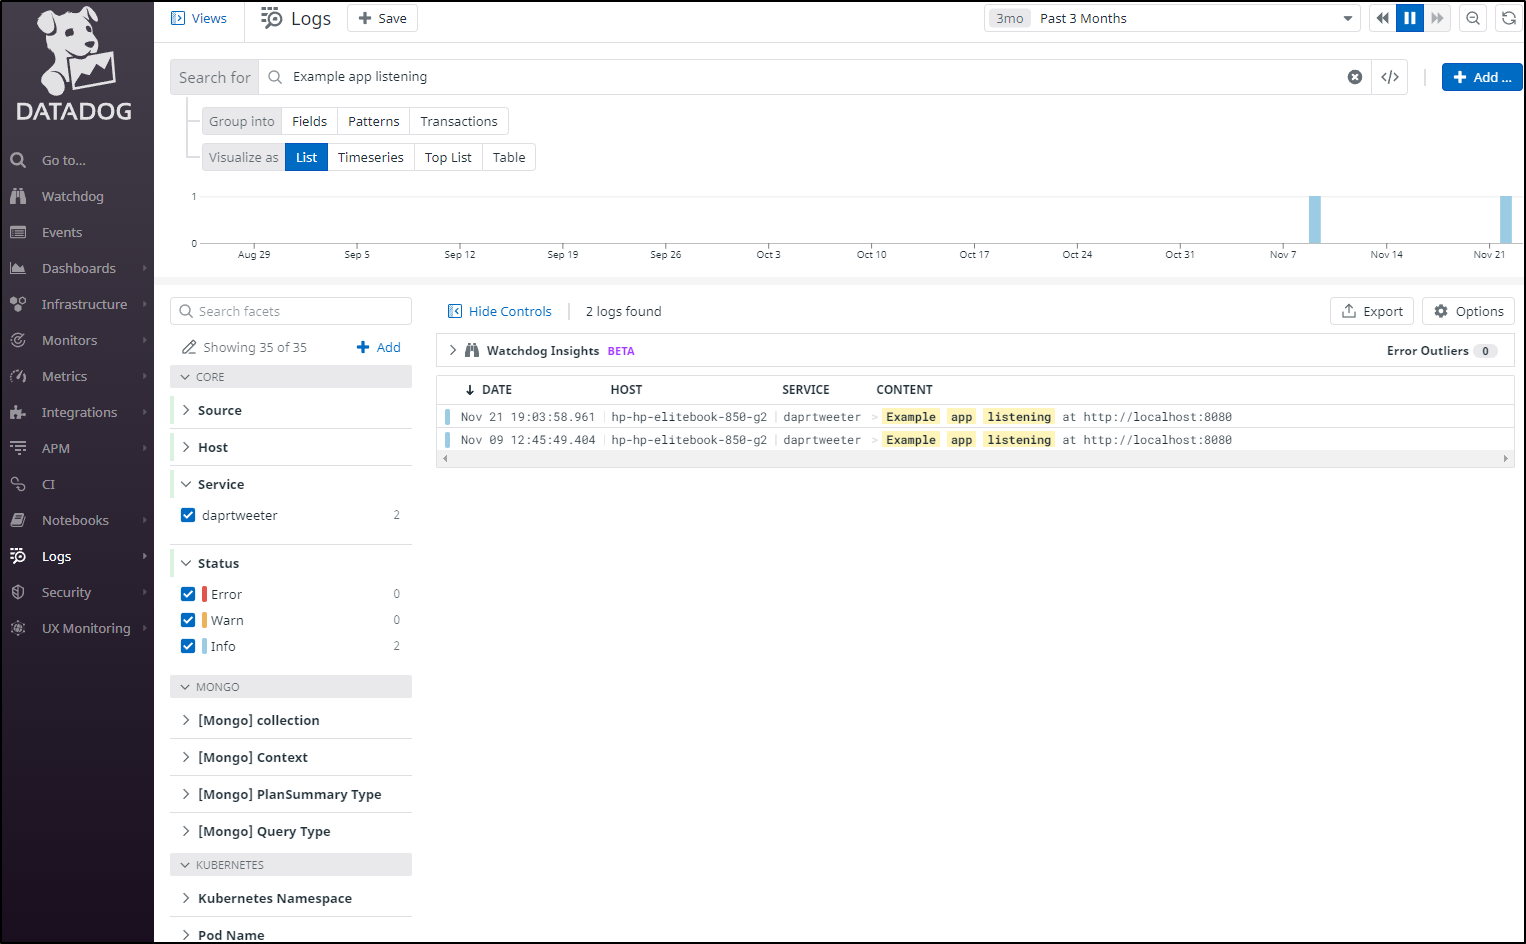
Datadog
Say i have a log I’m looking for like “Example app listening”
It’s easy to just search for that plain text in Datadog Logs
Pricing
All these notices made me want to check on the pricing. So if I “pay” for APM, what does that cost..
The cheapest (non-annual) is $37.50/mo for APM essentials ($75/mo if i choose “APM Pro”)
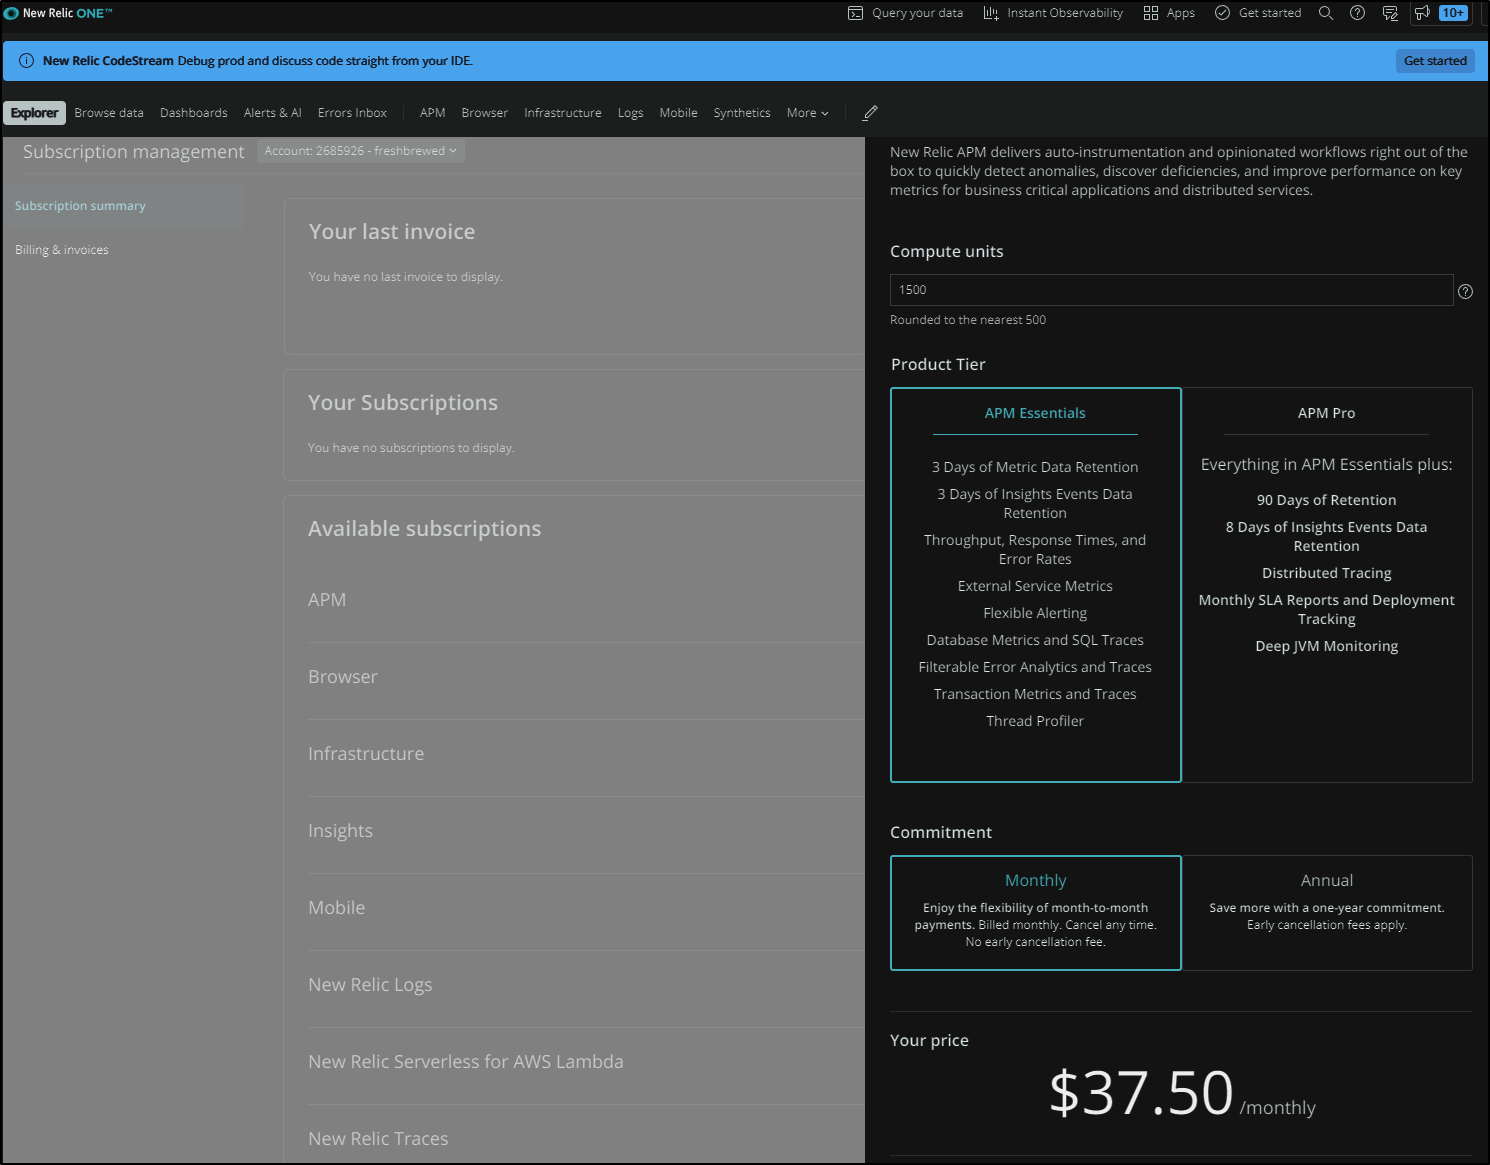
But I can see traces now.. I can see spans.. the slider let’s me select 3 days and i can click the “Anomalous Span”s for more details
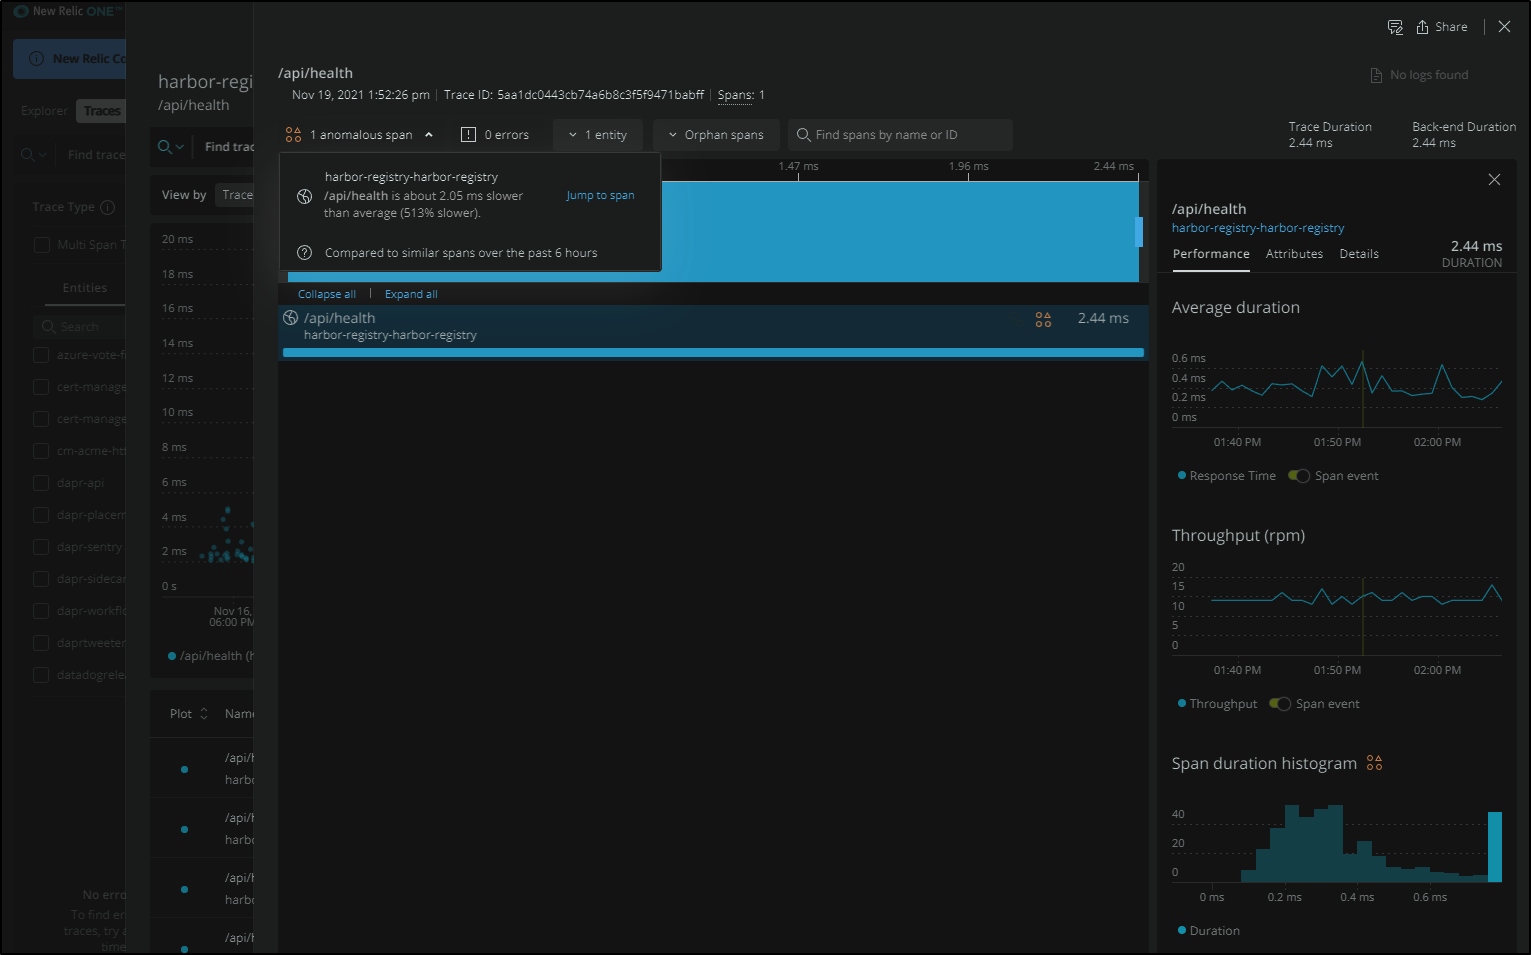
This confuses me as to what I would be buying.
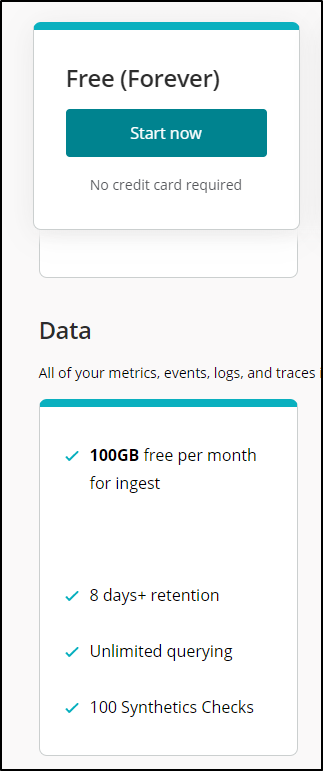
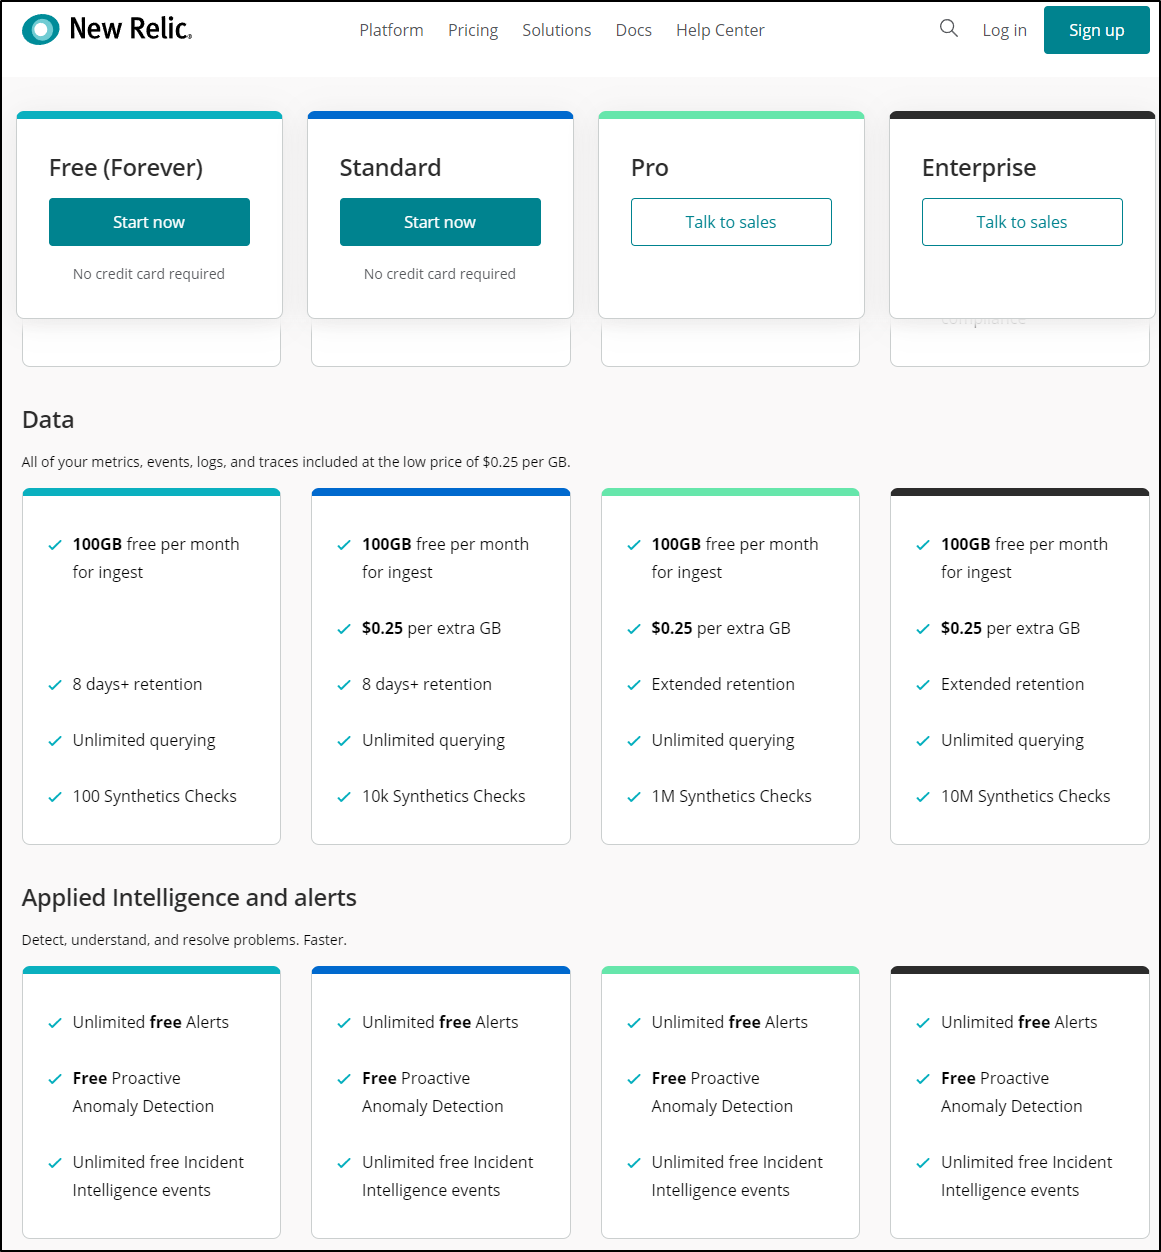
As for Logs, how much are those? I understand my free tier caps me at 100Gb of data per month:
But if i want to add a Logs subscription, the lowest level is 5Gb daily at 8days retention (5*8=40Gb) which would be $330/month.
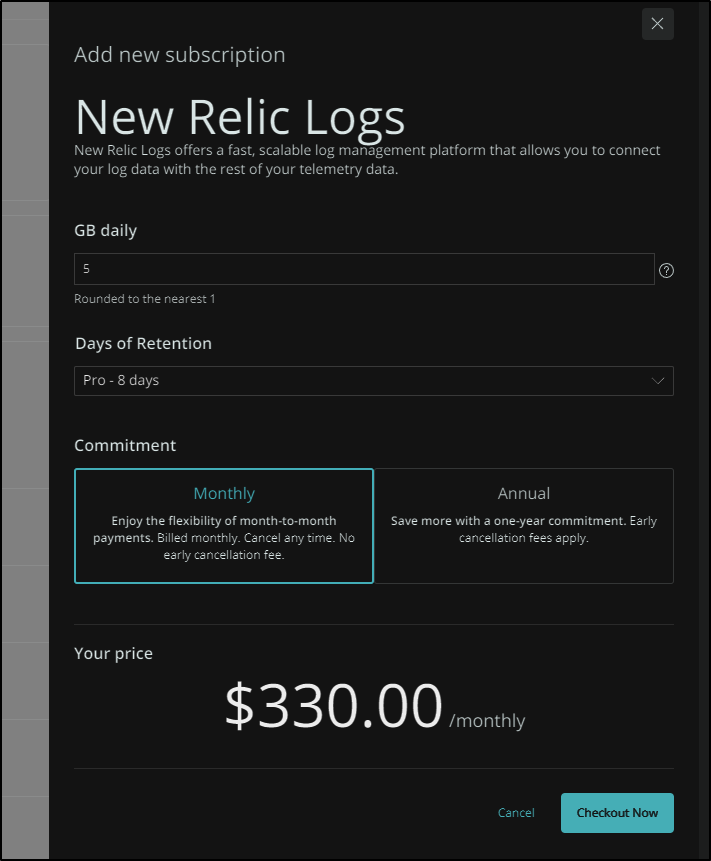
Again, I am tremendously confused. Is this asking if i want to spend $330/mo for an extra 40Gb of rolling log data
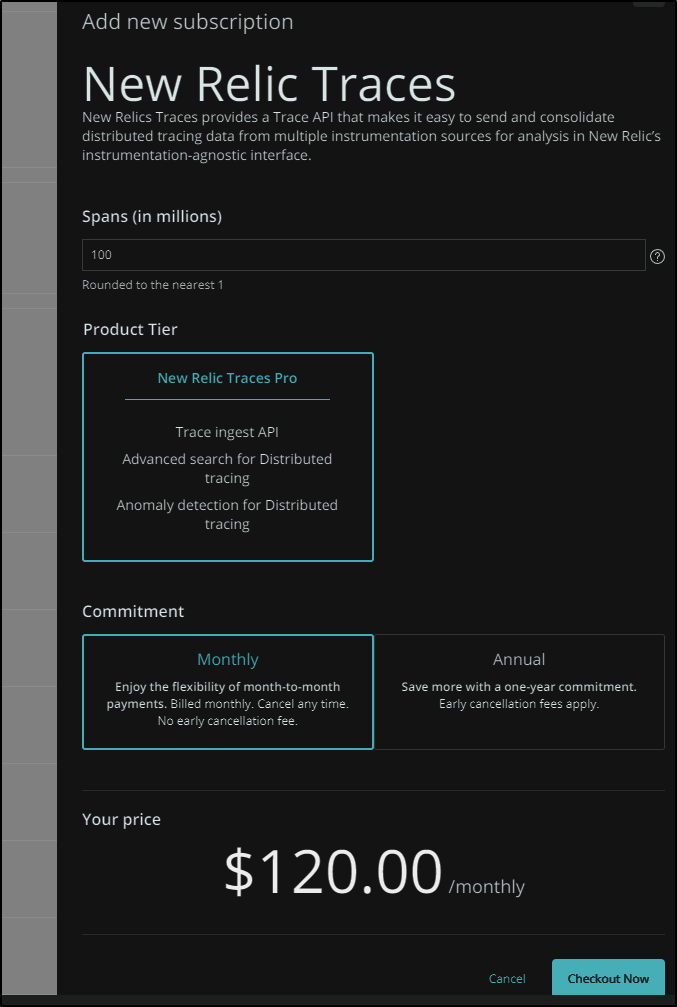
And let’s not forget that even though we saw different levels of trace data listed in the “APM” package there is also a “New Relic Traces” package that is for what, different traces?
Let’s compare to my free tier Datadog
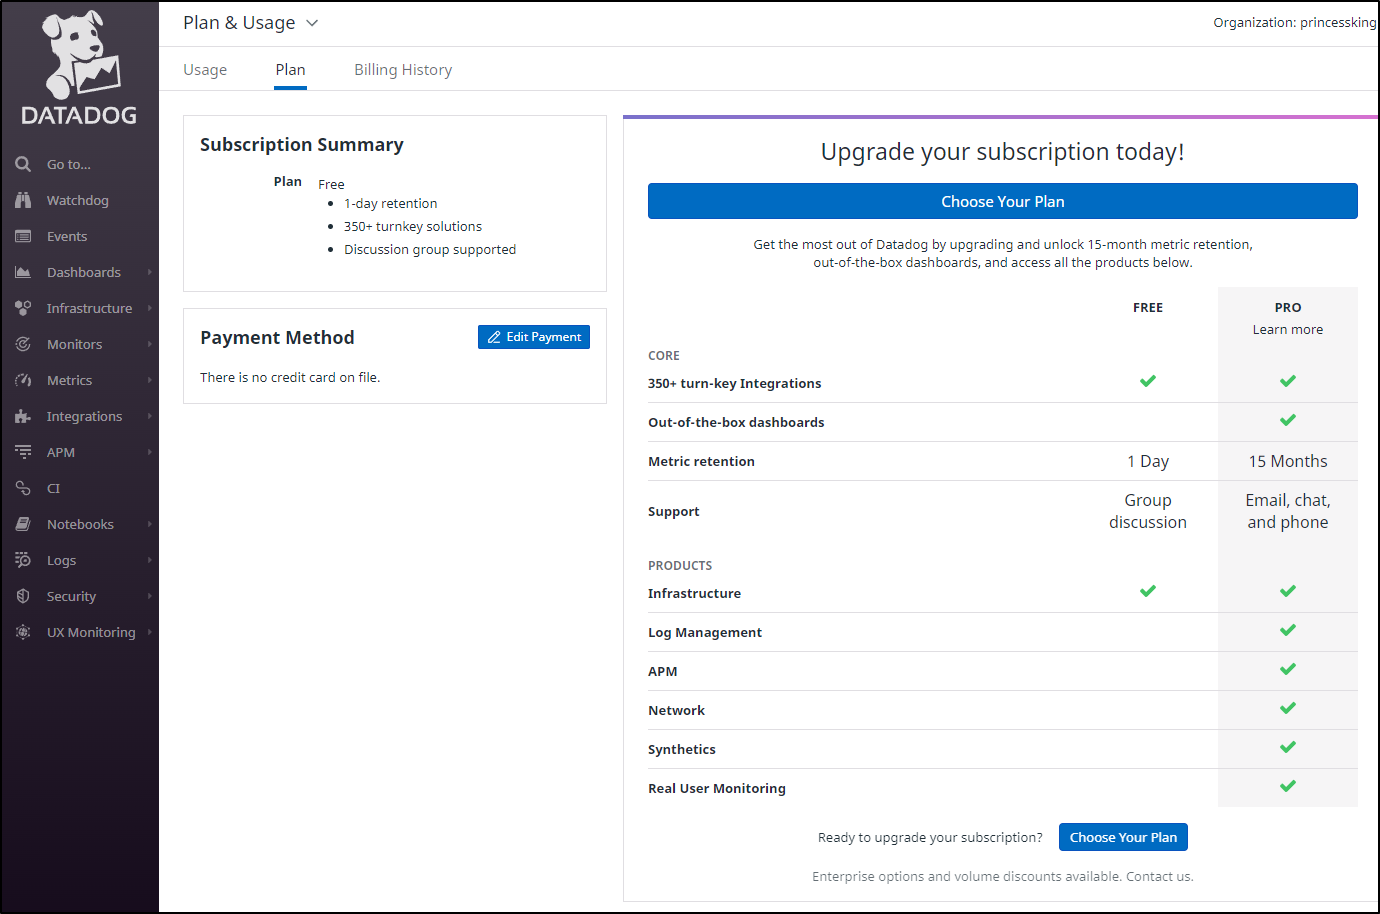
Now i could easily be grandfathered into some yummy goodness. But it seems I’m on the basic free plan.
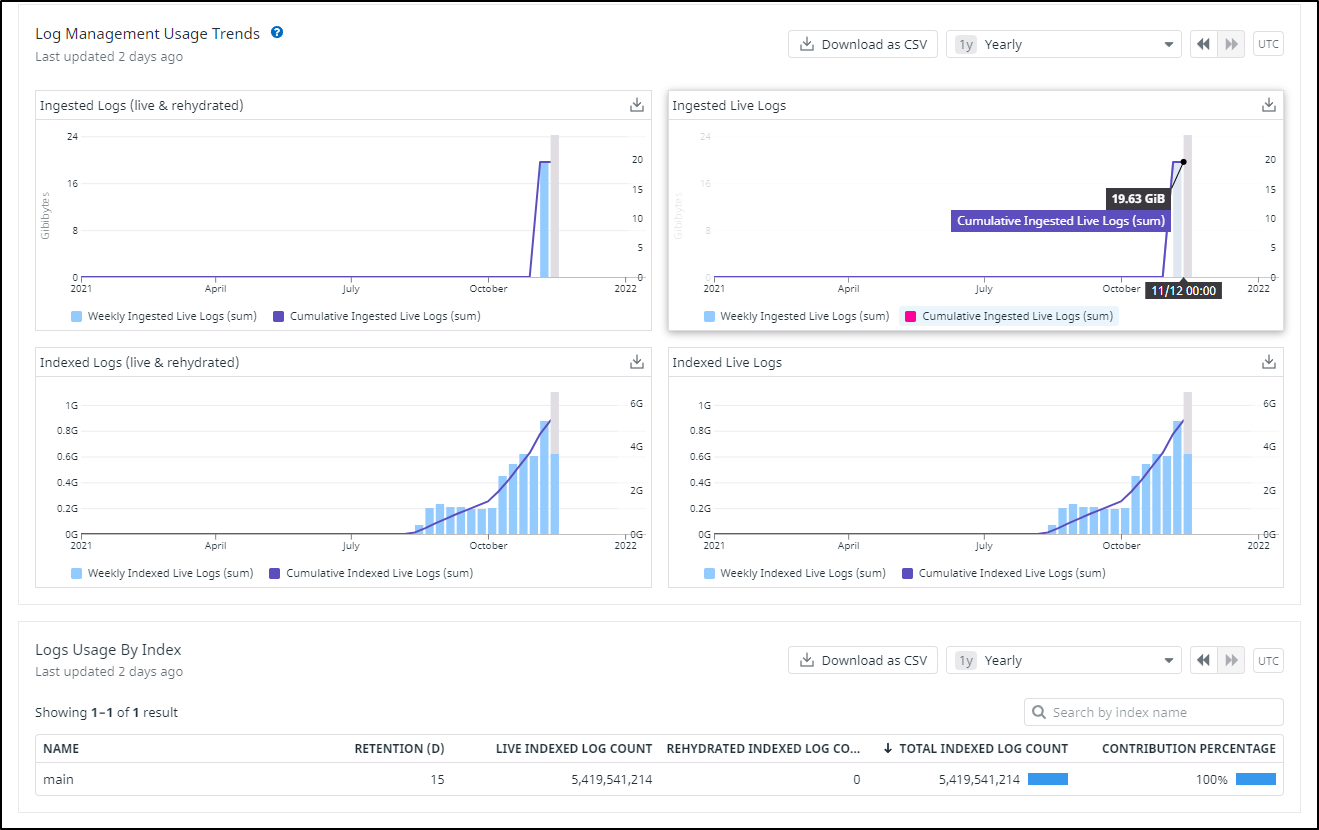
But you can see I’m cranking away at nearly 20Gb of data just for this month with APM and Tracing
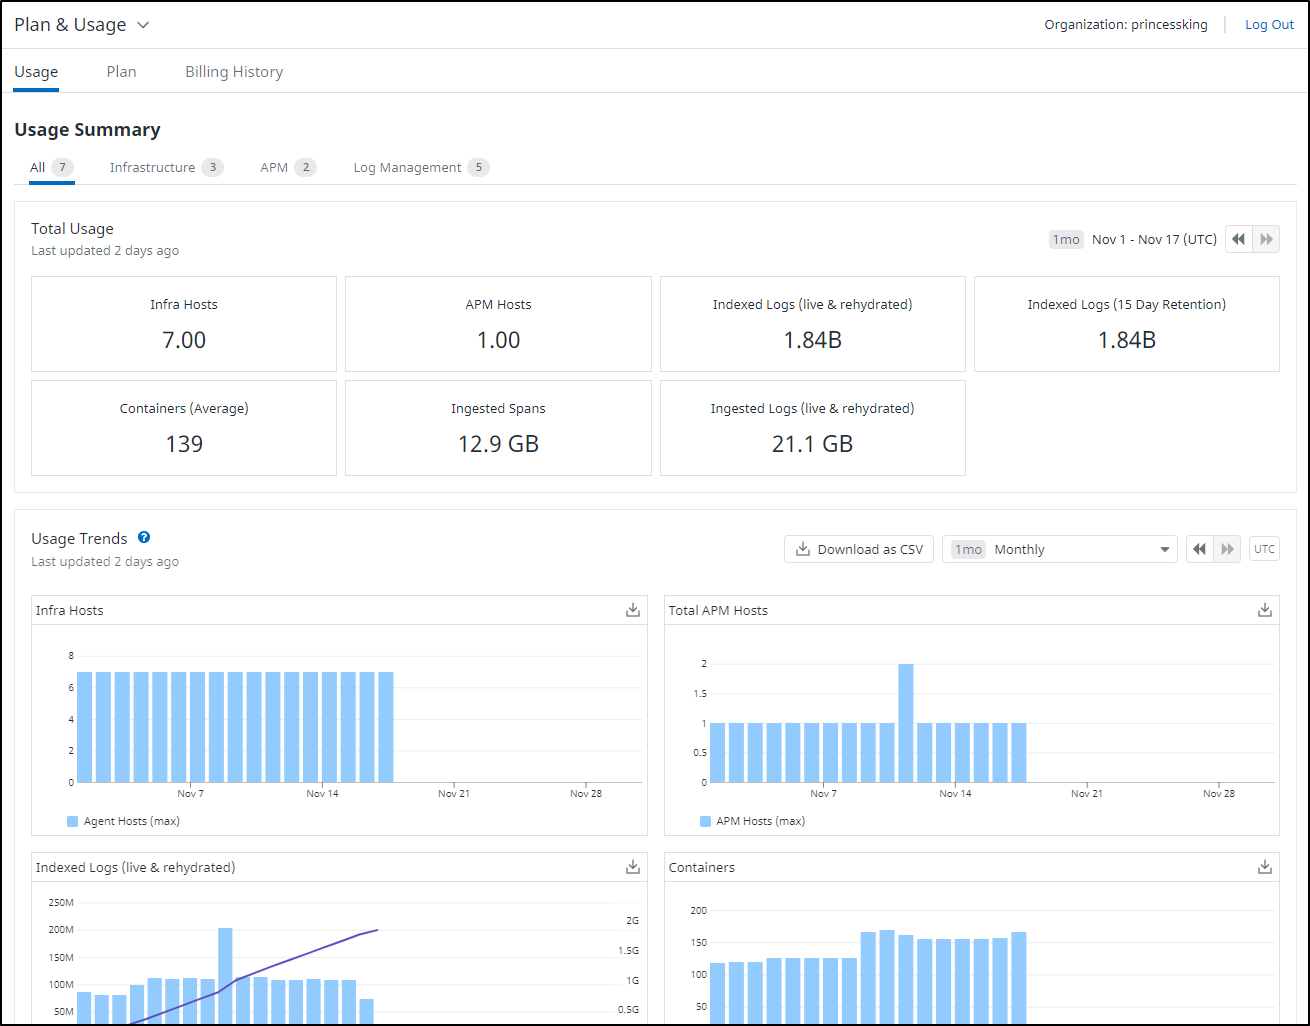
And I certainly push some logs
and we can see the prices for DD on the Pay tier
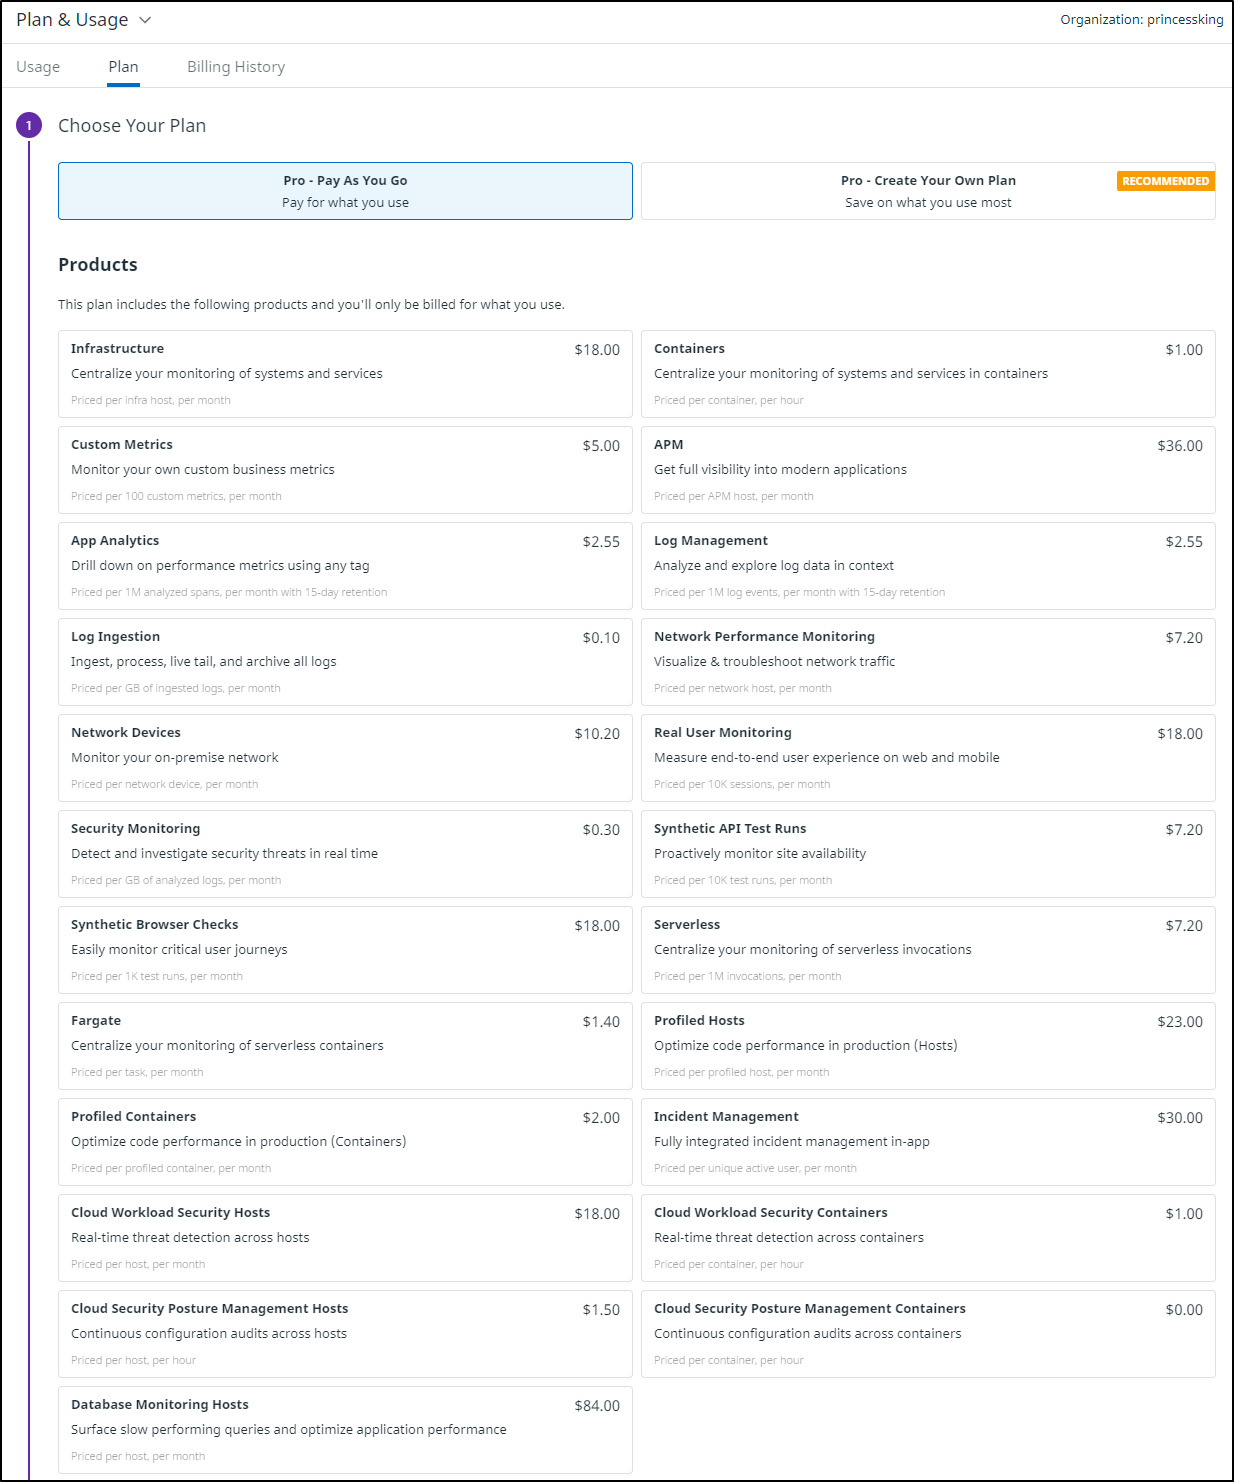
So if New Relic wants $330 for an additional 40Gb (5Gb Daily at 8 Days retention), what is Datadog’s price based on the sheet above? 10c a Gb, or 40*0.10 or $4. and if we assume we ingest 5Gb daily and there is no retention limit. 5 x 30 = 150 * 0.10 or $15/mo.
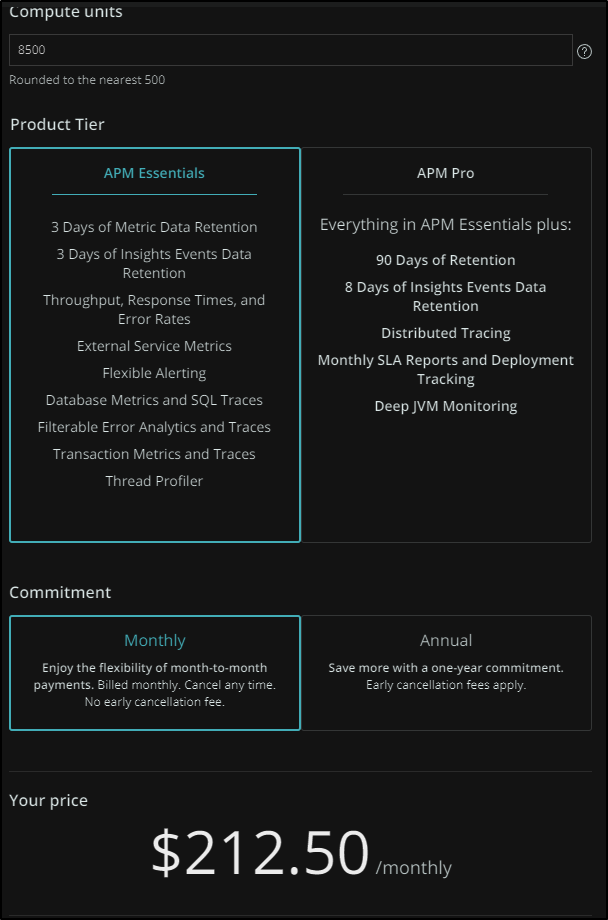
And to compare APM.. New Relic uses “Compute Units”:
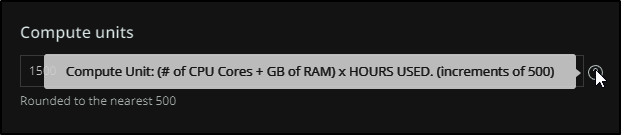
so if we assume a standard 4 core host with 8Gb of ram running all the time, a host like that would be 8640 “Units” a month.
That makes it $212.50/mo by my math per decent sized host:
Compared to DataDog’s $36/mo/host
And we cannot rule out Azure Logs.. How much for 5Gb a day there?
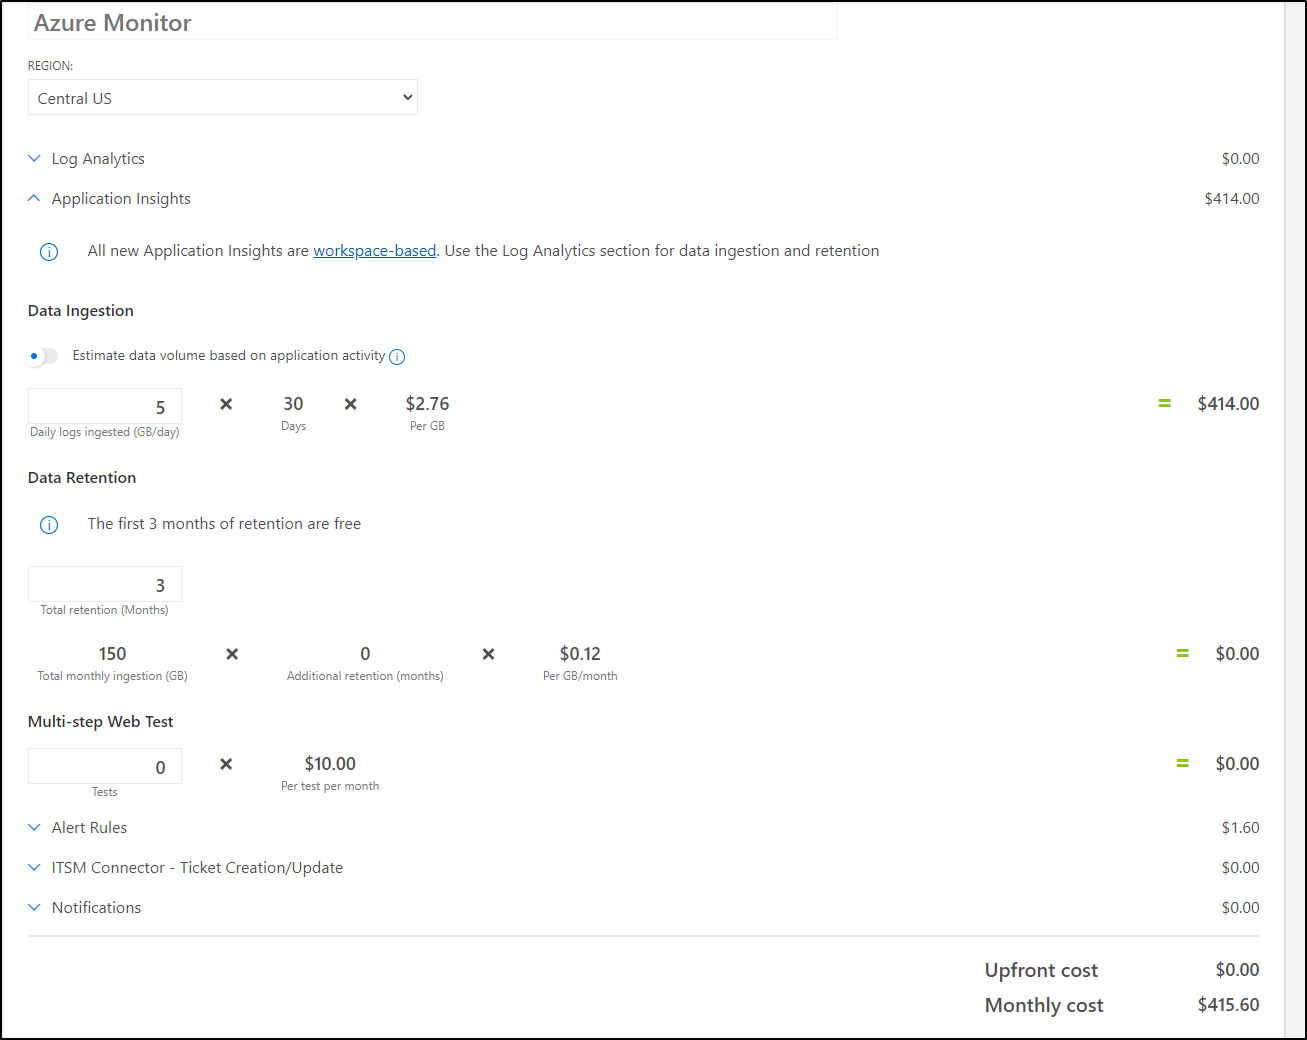
We are at $414/mo just for ingestion.
It seems with Azure there is no separate “traces” or “APM” section - it’s just on data ingestion.
Anecdotally, I can say that I spun the ALM workspace up on a Friday afternoon around 3pm and checking billing the next Monday at 10am showed $8.04 (so that is roughly $8/3d or $80/mo)
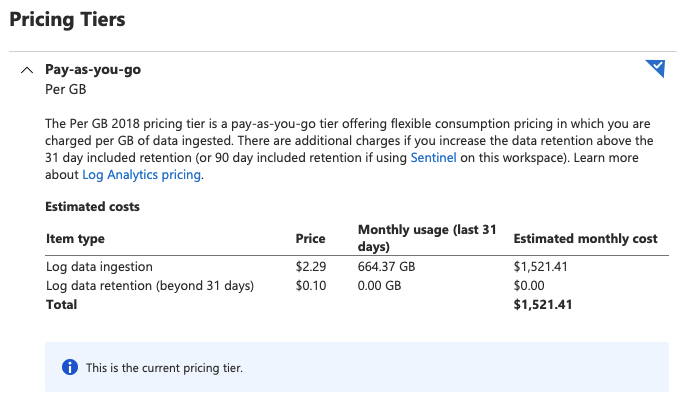
I also looked at a larger cluster and can see that logs are $2.29/Gb.
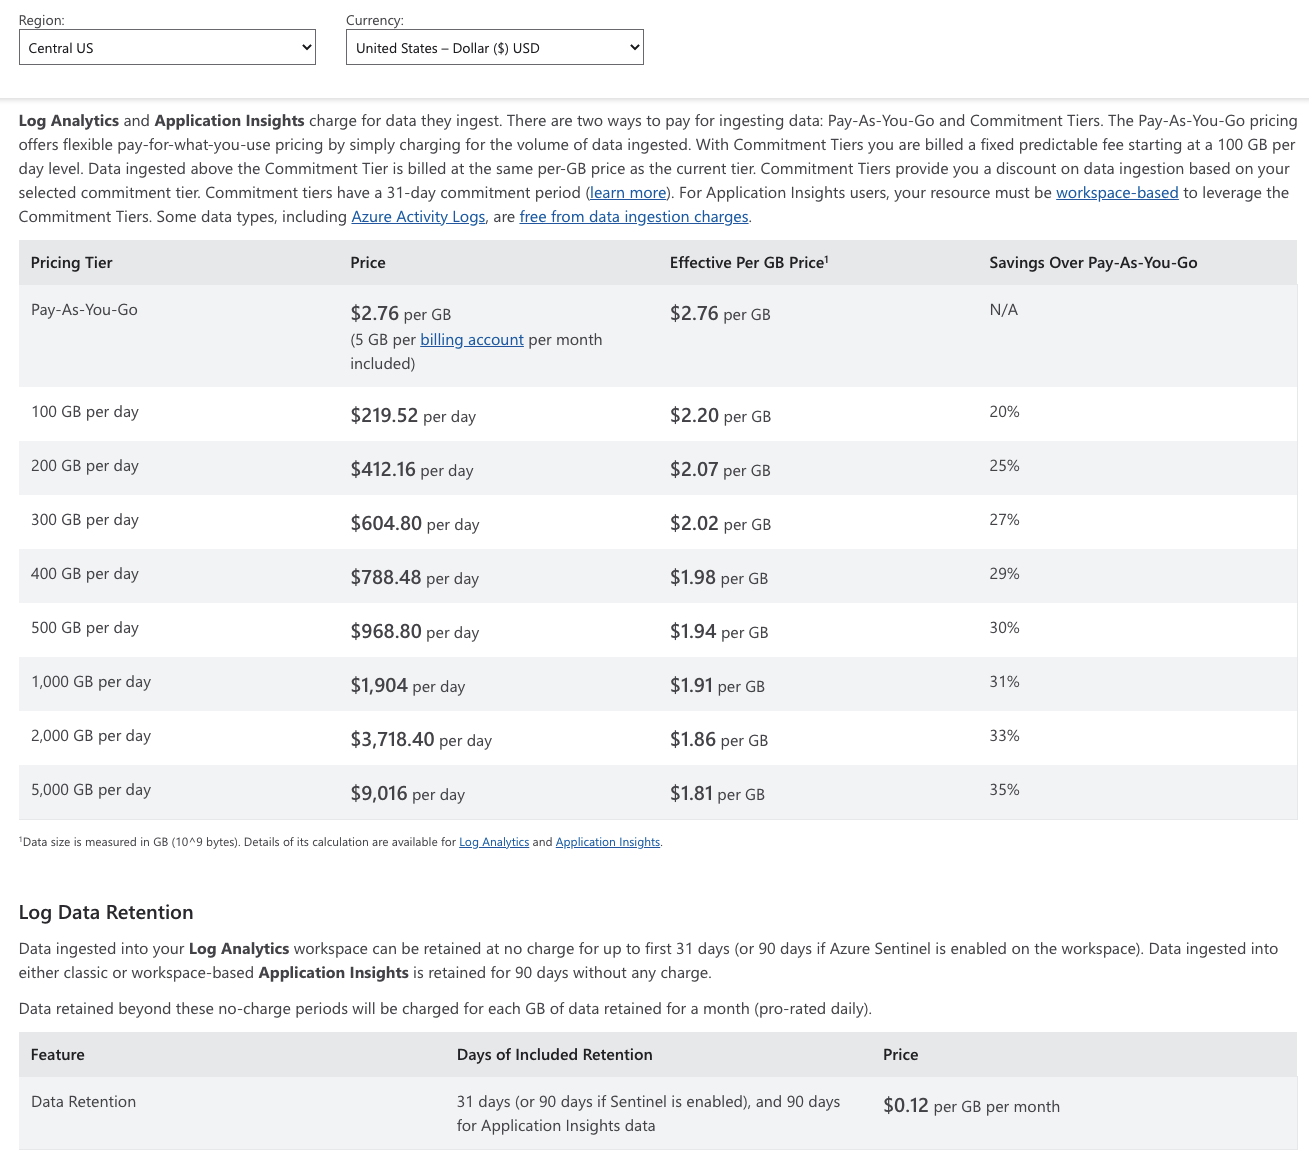
And if we look at Azure Monitor pricing that says current prices are $2.76/Gb in Central US beyond the 5Gb included with discounts at volume:
Pricing Summary
I went over a lot of examples. I think it can be easy to be overloaded with data. Let’s just break down some pricing examples to help clarify costs.
On Logs
| Product | Amount of Logs | Note | Price a Month |
|---|---|---|---|
| New Relic | 100 | could be free (get 100Gb total ingest APM+Logs a month) | $0 |
| 100 | for consumption, 25c a Gb beyond 100 total ingest a mo | $25 | |
| 150 | as “New Relic Logs” subscription - min is 5gb a day | $450 | |
| Datadog | 100 | a few days worth free, but if you want a month, it is 0.10 per gv per month | $10 |
| Azure Monitor | 100 | first 5Gb part of Monitor product, then $2.76/Gb beyond that | $262.2 |
| 100 | “Log anayltics” via pricing calculator is 2.30/Gb with 1mo retention included | $229.77 | |
| Logs.io | 100 | 1Gb/1Day free.. at 30d retention is $1.56/gb | $156 |
| LogDNA | 100 | 30d retention is “OAK”. $3Gb/day | $300 |
On APM
| Product | Amount of Logs | Note | Price a Month |
|---|---|---|---|
| New Relic | 1 Decent Machine (8500 ‘compute units’) | (4 core s+ 8 Gb) * hours (24*30) = 8640 | $212.50 |
| Datadog | 1 Host | $21 host for APM, and $40/host for APM and Cont. Profilier | $30 |
| Azure Monitor | 1 host | hard to say. pricing sheet points out many things in free preview | likely $1-$2 if not free |
| 1 host | Arc lets us add hosts outside of Azure which is priced per host | $6 |
Notes:
- Azure Monitor focuses around ingest data amount, not hosts
- Azure also charges for Alerting rules (10c/mo per metric monitored and 1.50 per log signal, and usually $1/mo per alert defined.. it adds up)
- Datadog Integrations and New Relic integrations just come free - this really makes the alerting and escelation easy (don’t have to pay extra to trigger Slack, Pagerduty, etc)
- Neither charge extra for alerts
Summary
We dug a bit deeper into New Relic. It’s Pixie integration still intrigues me. Clearly the New Relic monitoring system picks up everything on the cluster. However, I was stymied by trying to get a proper service map. It seems the mapping abilities are either buried or temperamental. I could generate a service map one moment then not again.
Another issue, and it’s the clencher for me, is the pricing. It seems there is a real disconnect in what the “Subscriptions” show and what the “Pricing” page shows.
I emailed the support contact I had at New Relic but did not hear back to date.
Additionally, while it’s not a blocker to do work, I find the incessant “you should upgrade your account” orange reminder blocks on pages to be really annoying. I continually was unsure if a page or feature I reached was something I could rely on, or if it was being shown just temporarily.
I understand the need to convert free users. But that is where it is better to have a narrow offering, usually limited by fixed things like users, time, or data. Then those that really use your product necessarily upgrade. That said, I have seen some really bad moves by companies; JIRA from Atlassian had a mobile client that actually ran adverts (they do not now). I’ve also seen companies offer a free tier only to yank it out without warning (all my earliest videos are gone because of that 2008 Brightcove decision ).
The point is that NewRelic has a very compelling offering and clearly they are a big player. It would seem they are only really hampered by finicky service maps and an inconsistent, unclear and a likely high priced subscription model.