Published: Nov 3, 2021 by Isaac Johnson
With all these tracing projects, I thought i might be good to show the free/open-source ways one can use to measure application performance. We will look at Zipkin, Grafana and Prometheus. We will also take a look at Kiali which we last examined in a post back in July.
While Zipkin and Kiali are different; the former a distributed trace monitoring tool and the later related to service mesh observability. Fundamentally, they are trying to solve very similar issues; the performance of service to service calls. Technically traces can be instrumented in the code whearas service mesh performance neccessarily can only see container to container calls. However, our examination as instrumented is looking at container to container transactions so these tools cover very similar ground: how micro-service to micro-service calls are performing.
Setup
This builds from the last article on Lightstep where we spun up an AKS and installed Dapr along with the Caculator quickstart app.
You’ll want to have ready:
- A k8s cluster
- Dapr.io installed
- The calculator app from Dapr quickstarts
Zipkin
We know of zipkin as a format, but Zipkin is also a perfectly fine no-frills app for examining the data.
We’ve used OpenTelemetry to send data out to Datadog and others. In this case, we want to direct the zipkin data Dapr collects to the Zipkin service.
Our first step is to switch from the OpenTelemetry endpoint to the Zipkin instance endpoint we spun up with the calculator app in the app configuration:
$ kubectl get configuration appconfig -o yaml | tail -n3
    samplingRate: "1"
    zipkin:
      endpointAddress: http://otel-collector.default.svc.cluster.local:9411/api/v2/spans
$ kubectl get configuration appconfig -o yaml > appconfig.yaml
$ kubectl get configuration appconfig -o yaml > appconfig.yaml.bak
$ vi appconfig.yaml
$ diff appconfig.yaml appconfig.yaml.bak
41c41
<       endpointAddress: http://zipkin.default.svc.cluster.local:9411/api/v2/spans
---
>       endpointAddress: http://otel-collector.default.svc.cluster.local:9411/api/v2/spans
$ kubectl apply -f appconfig.yaml
configuration.dapr.io/appconfig configured
We need to bounce the pod to get the side car to pull in the new configuration and send telemetry data to the zipkin service:
$ kubectl get pods | grep calculator
calculator-front-end-5bb947dfcf-vv75c   2/2     Running   0          47h
$ kubectl delete pod calculator-front-end-5bb947dfcf-vv75c
pod "calculator-front-end-5bb947dfcf-vv75c" deleted
To verify trace data is now being received, We’ll want to port-forward to the zipkin pod as we do not (yet) have it exposed via an ingress:
$ kubectl port-forward `kubectl get pods -l app=zipkin --output=jsonpath={.items..metadata.name}` 9411 &
[1] 26342
$ Forwarding from 127.0.0.1:9411 -> 9411
Forwarding from [::1]:9411 -> 9411
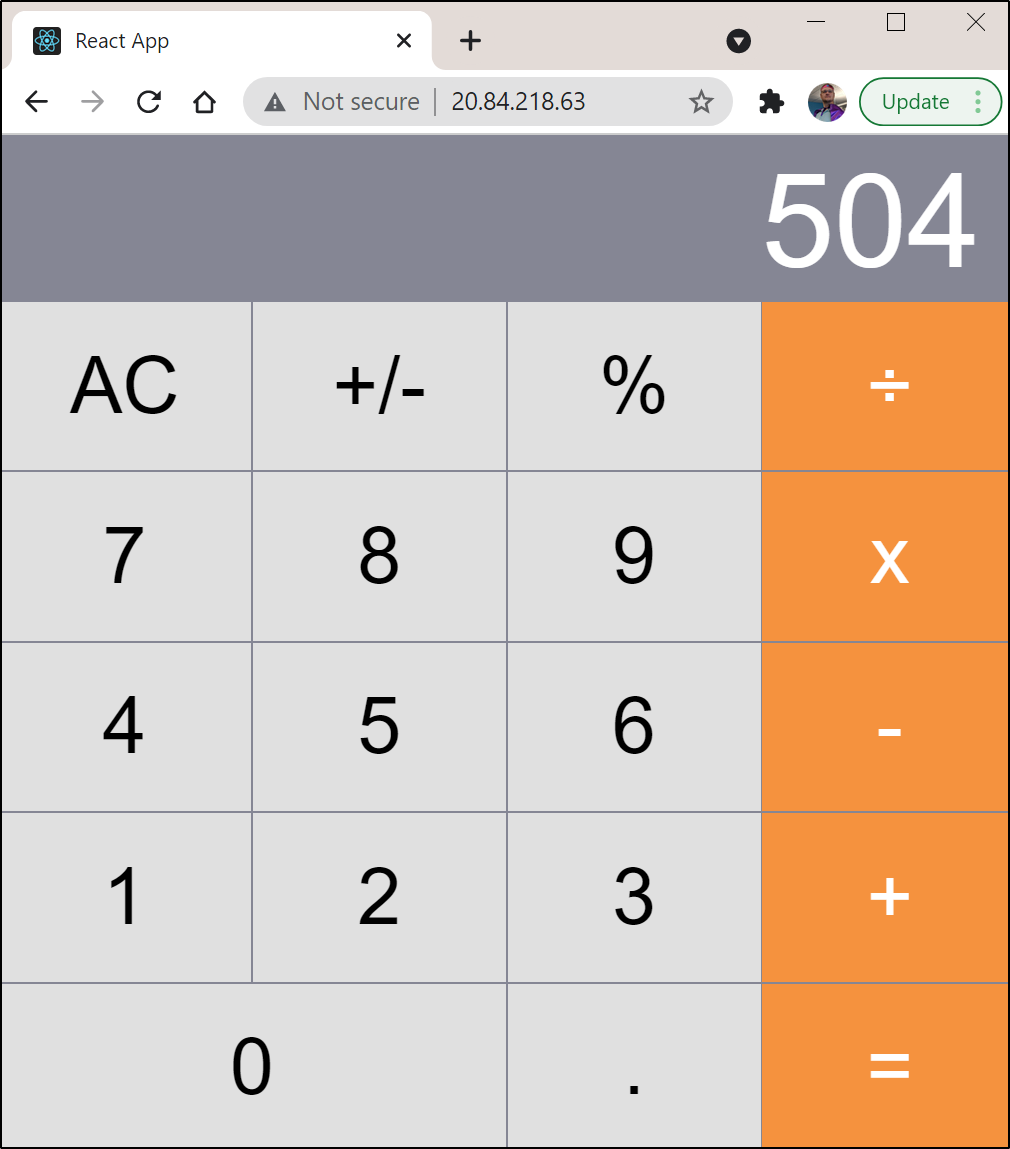
We can now look up our front end URL of the deployed calculator app:
$ kubectl get svc | grep calculator
calculator-front-end          LoadBalancer   10.0.200.190   20.84.218.63   80:31131/TCP                          2d1h
calculator-front-end-dapr     ClusterIP      None           <none>         80/TCP,50001/TCP,50002/TCP,9090/TCP   2d1h
and test out the calculator a few times to get some traces
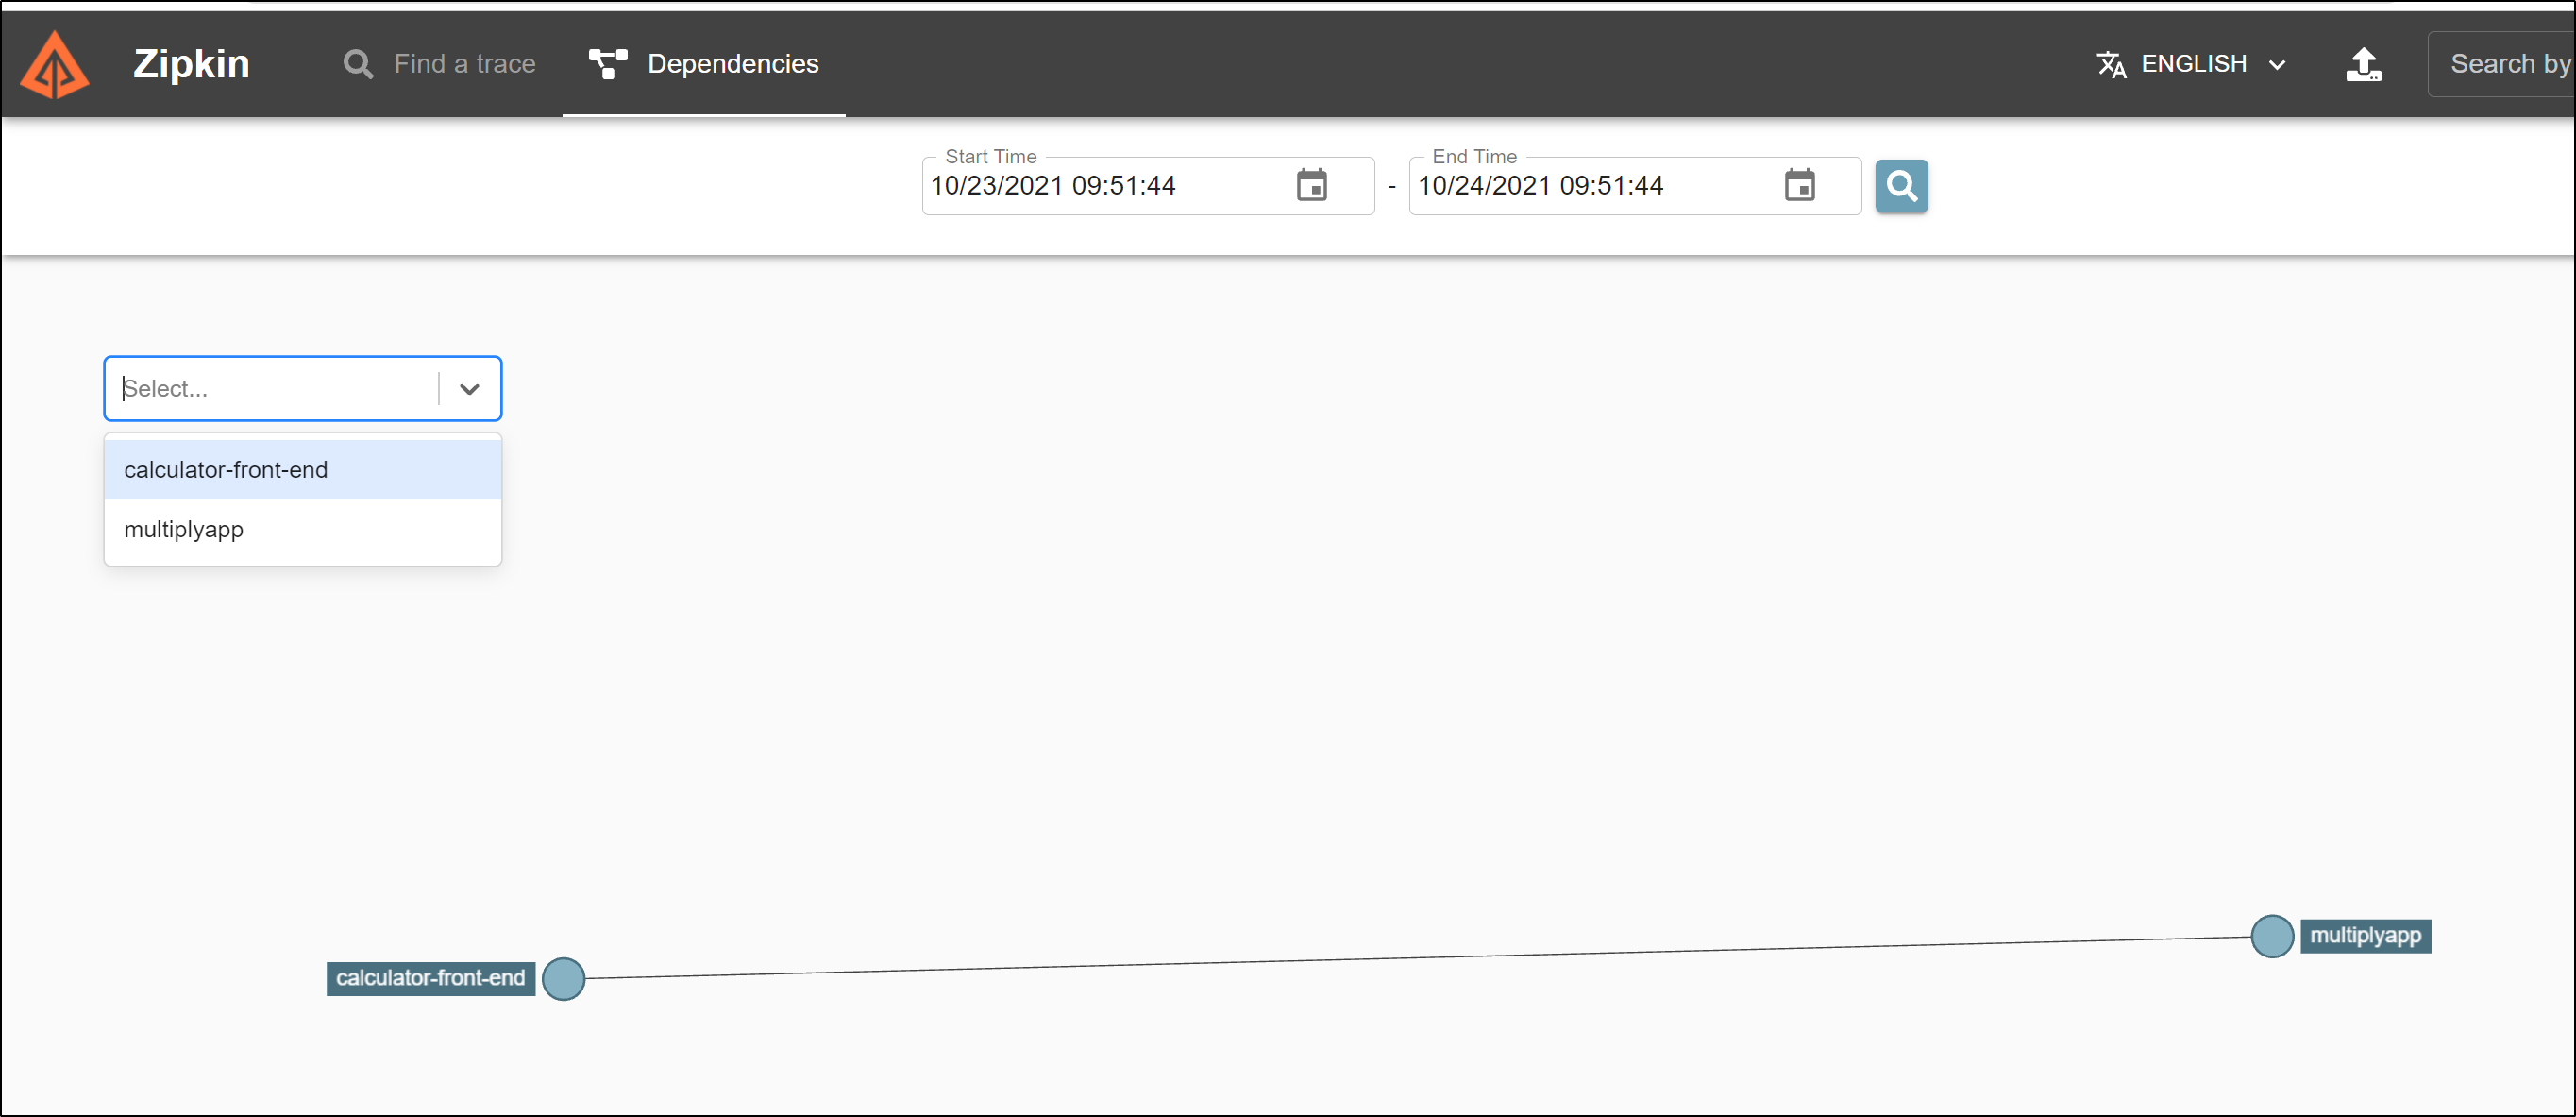
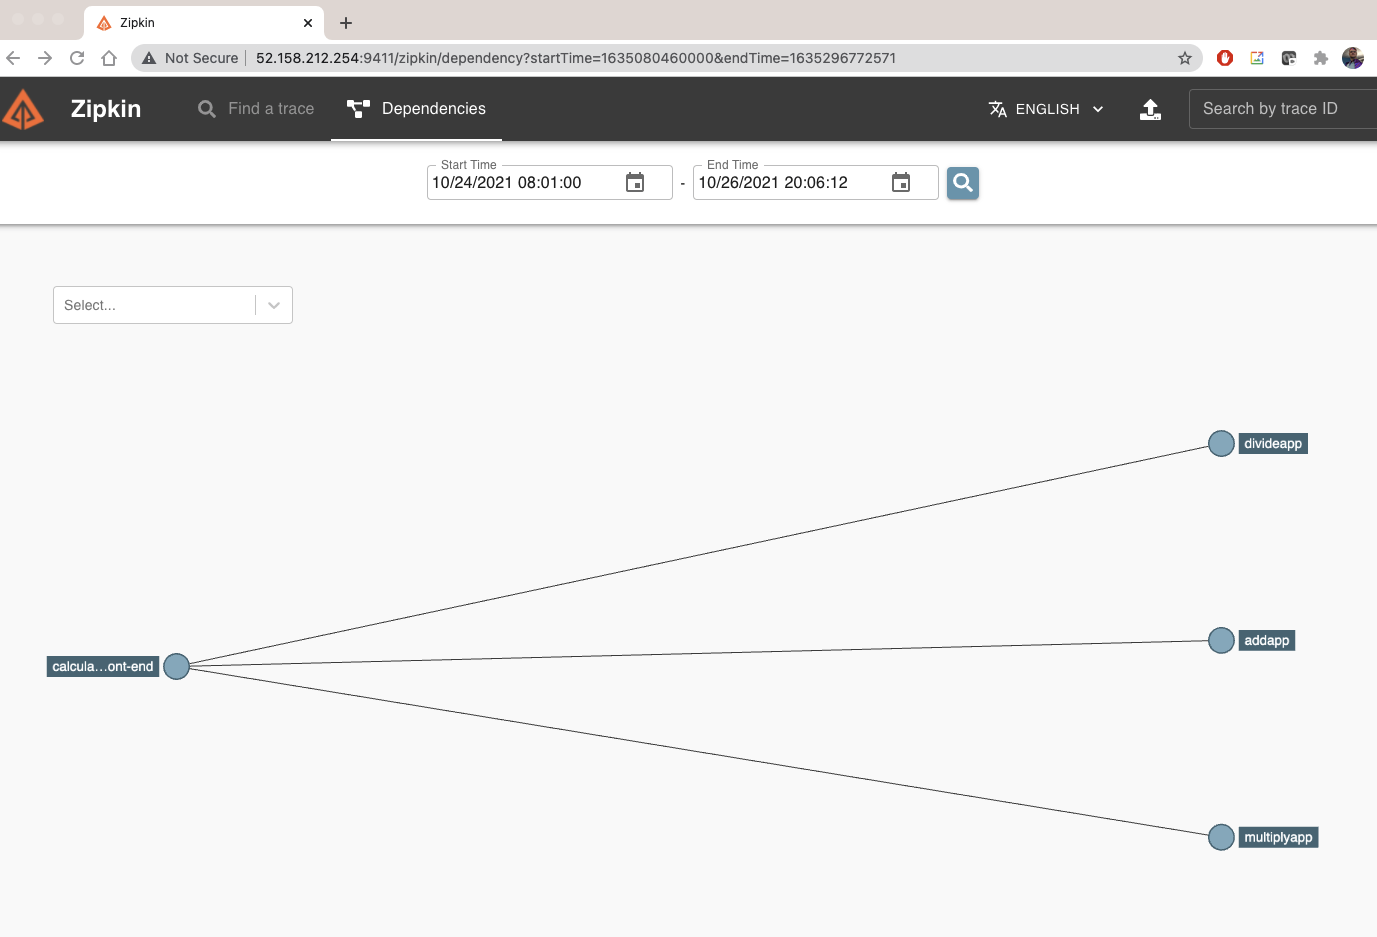
We can now go the zipkin app and see traces and dependencies.
If we go to dependencies, we can see how the front-end connects to the multiplyapp backend.
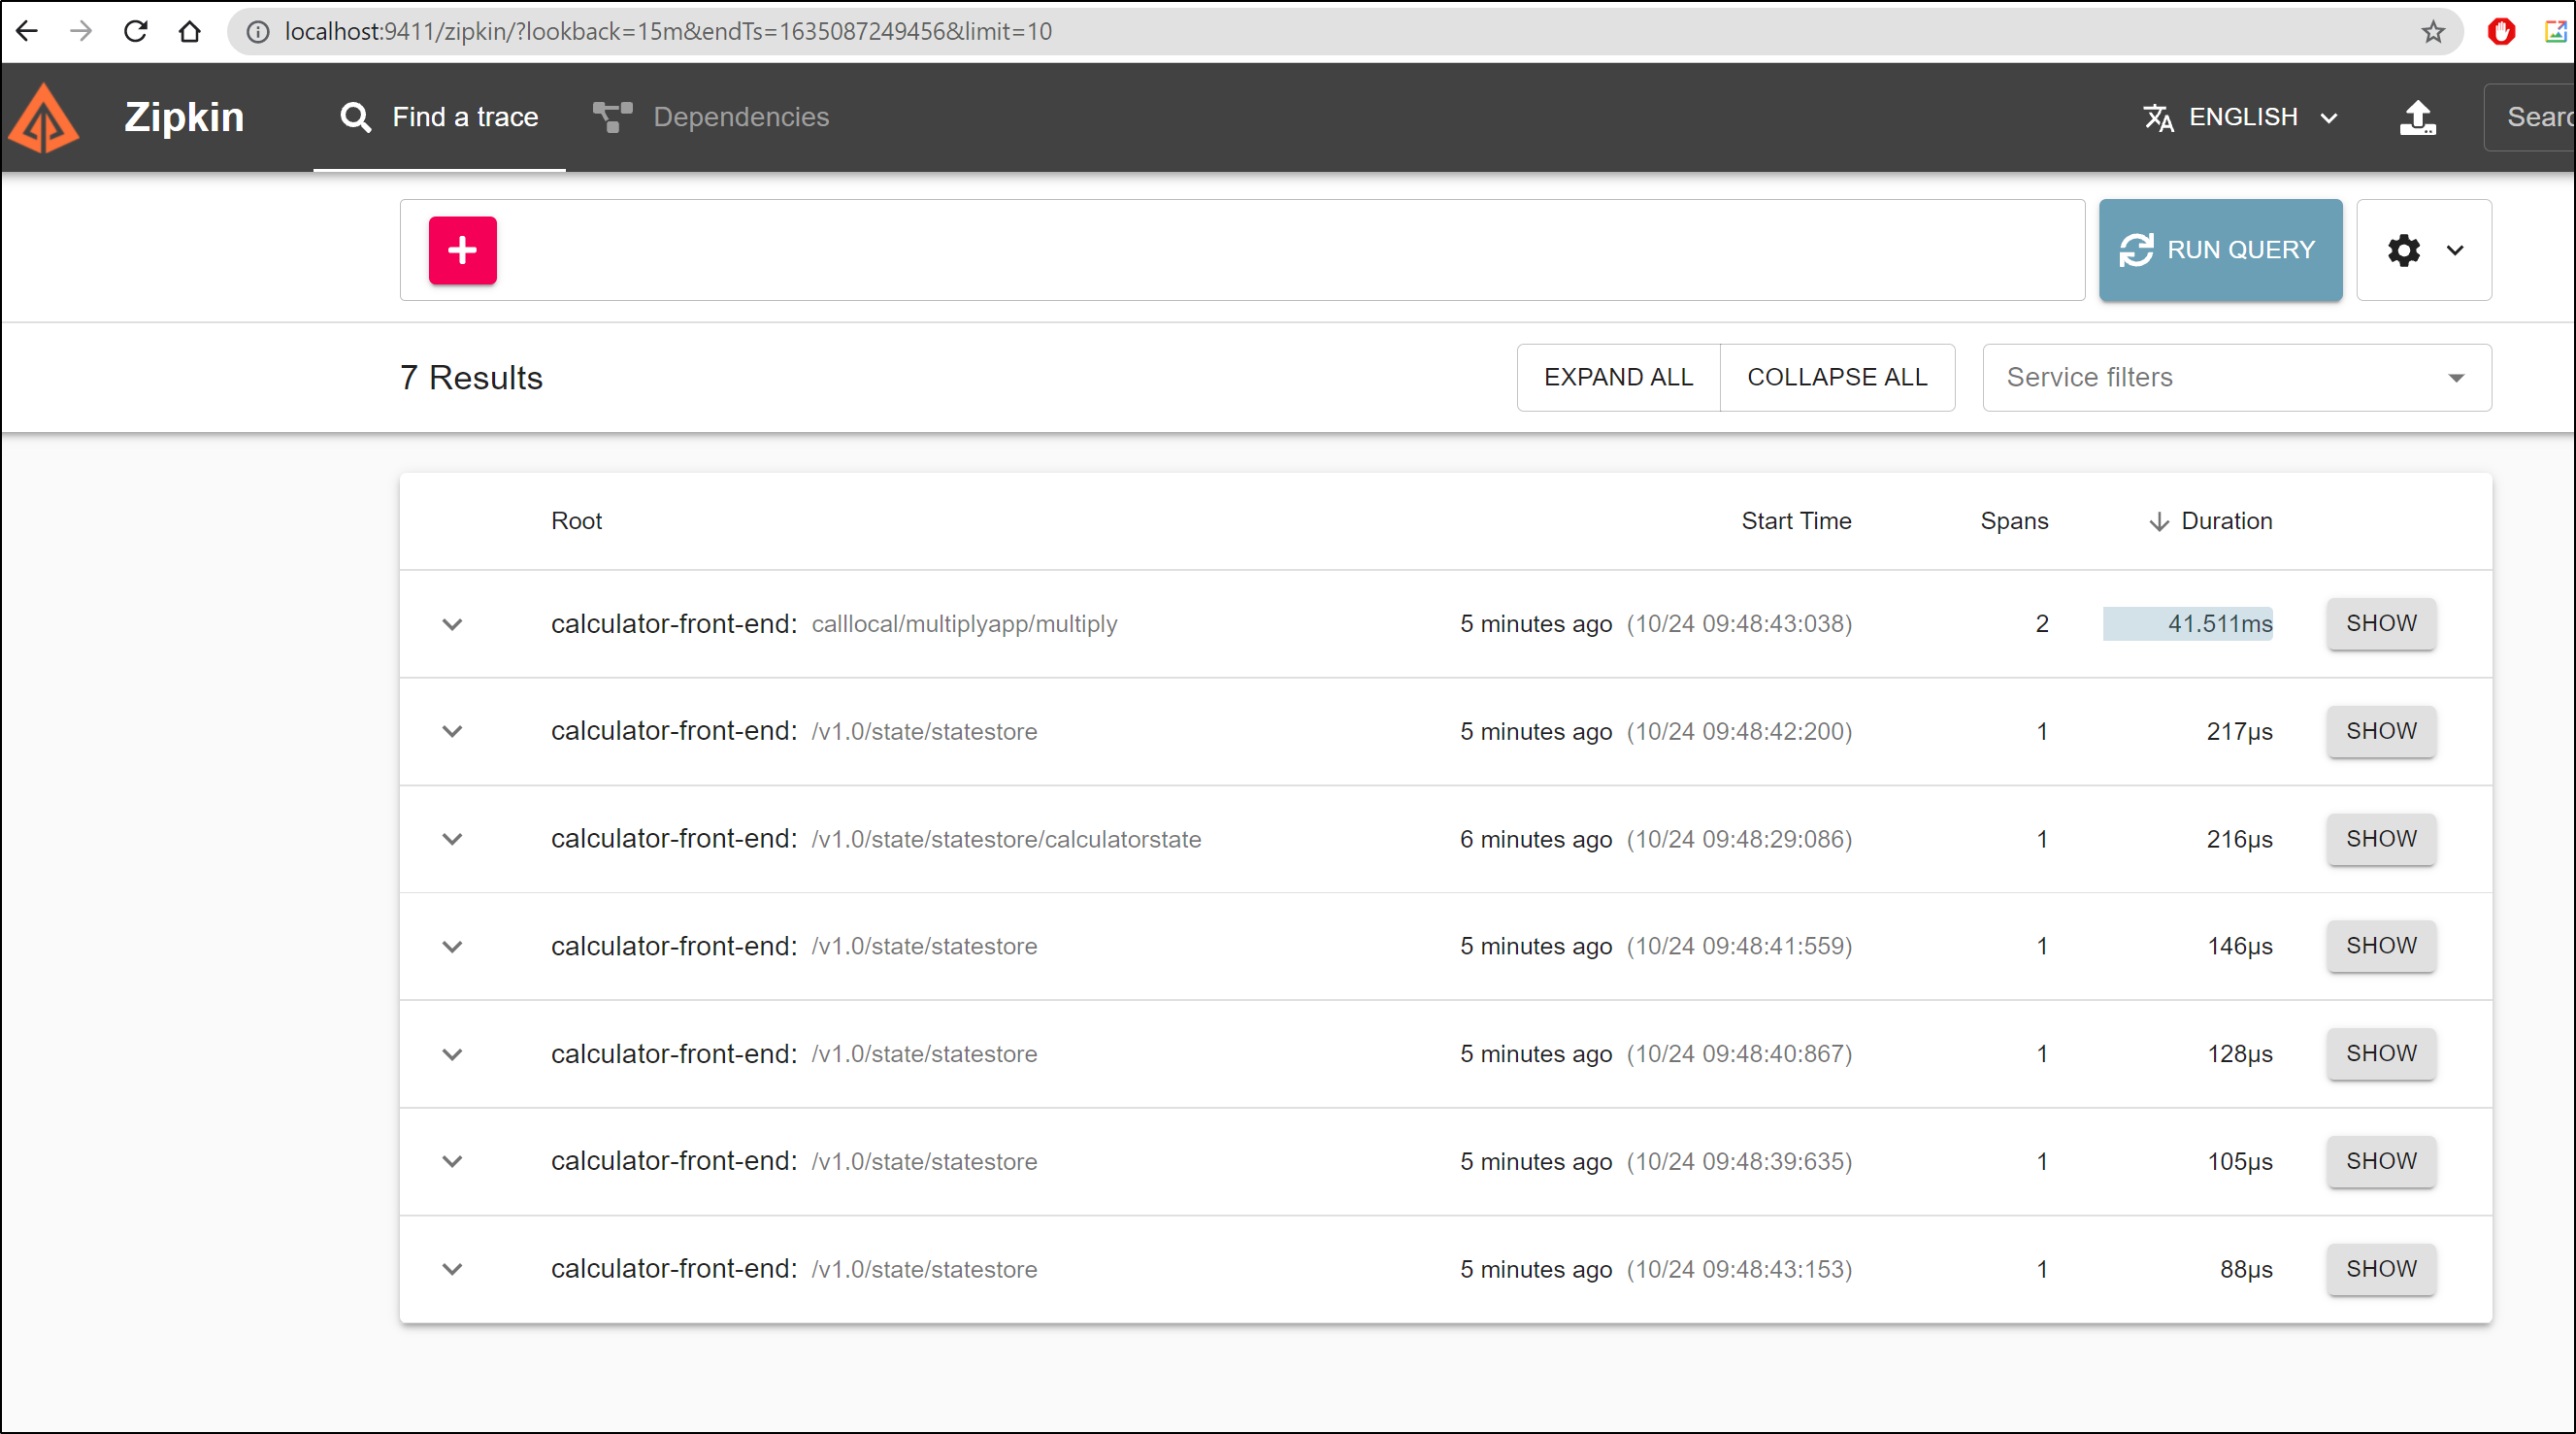
We can run a blank query to see all recent traces
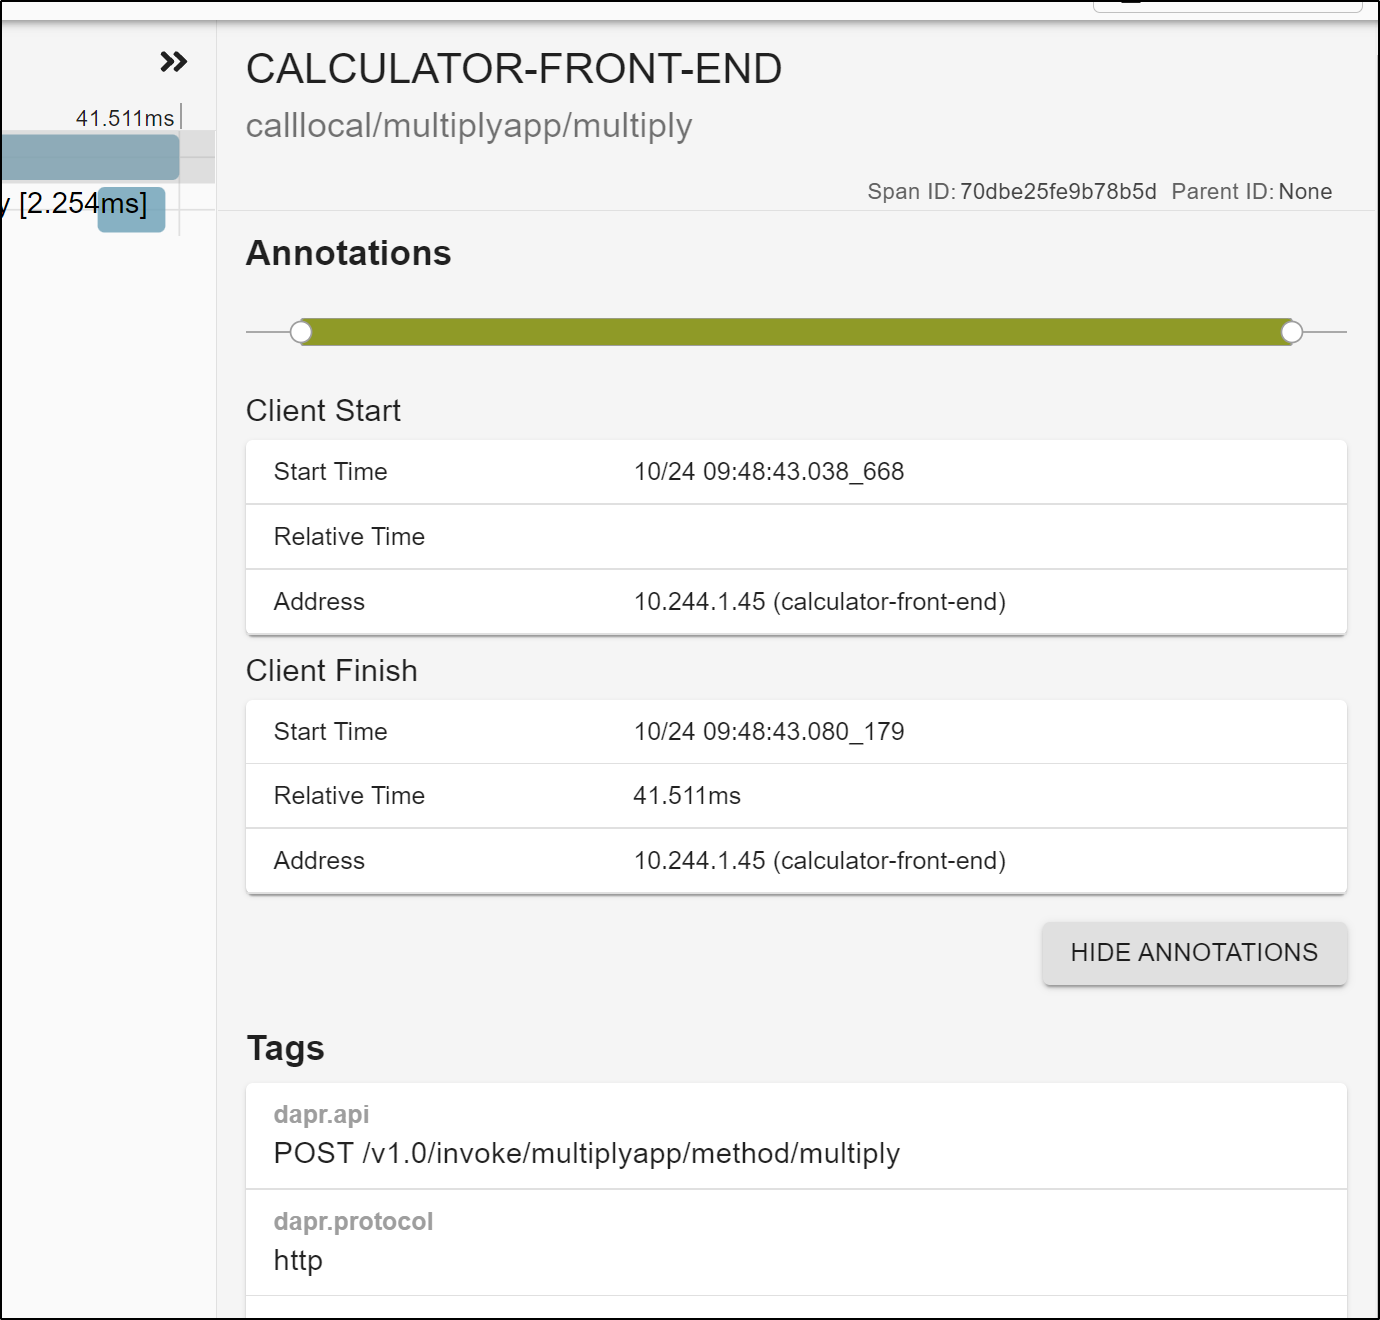
and clicking the details we see how our trace data was provided by Dapr.
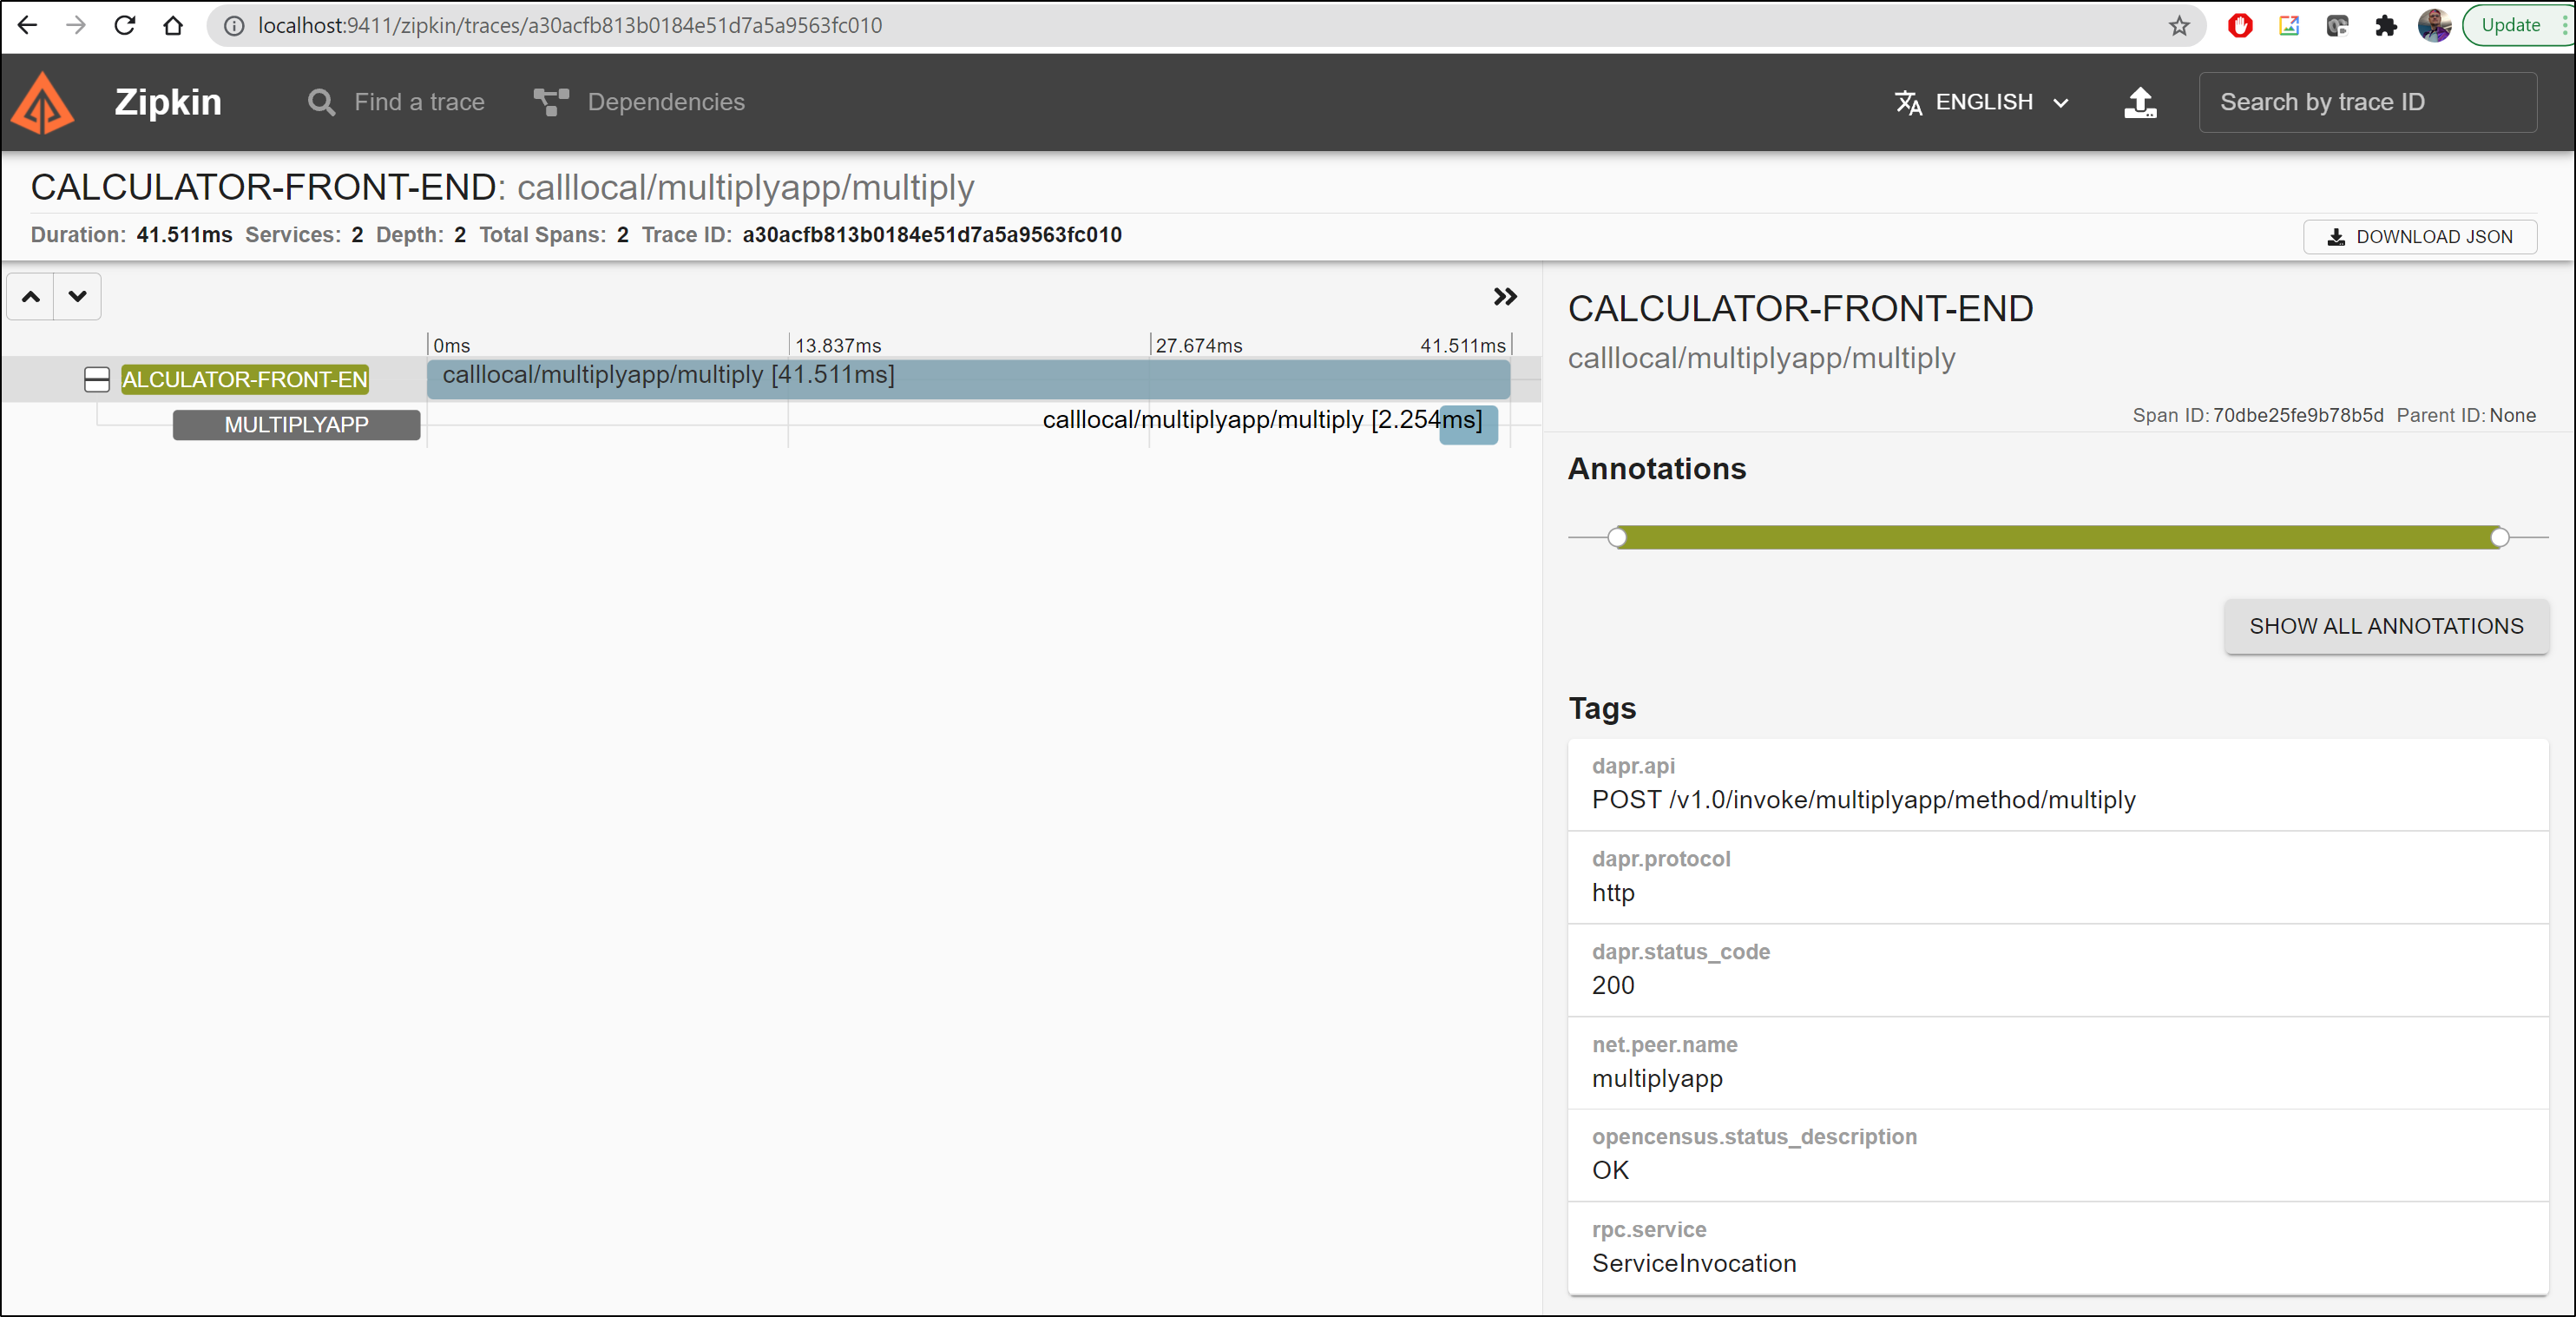
If we click show all annotations we can see a few more details on the trace such as client details
Run a few calculations in the Calculator app then change the time window, we can see the dependency graph update to reflect our operations:
Grafana
Note: if you want, skip down to “Install with Istio” to just have Istio install Grafana and Prometheus
If you haven’t already, install Grafana.
A simple dev instance (albeit without persistence) can be done as such:
$ helm repo add grafana https://grafana.github.io/helm-charts
"grafana" has been added to your repositories
$ helm repo update
Hang tight while we grab the latest from your chart repositories...
...Successfully got an update from the "kedacore" chart repository
...Successfully got an update from the "crossplane-stable" chart repository
...Successfully got an update from the "crossplane-alpha" chart repository
...Successfully got an update from the "jenkins" chart repository
...Successfully got an update from the "grafana" chart repository
...Successfully got an update from the "nginx-stable" chart repository
...Successfully got an update from the "jetstack" chart repository
...Successfully got an update from the "ingress-nginx" chart repository
...Successfully got an update from the "datawire" chart repository
...Successfully got an update from the "bitnami" chart repository
Update Complete. ⎈Happy Helming!⎈
$ helm install grafana grafana/grafana
NAME: grafana
LAST DEPLOYED: Sun Oct 24 10:23:14 2021
NAMESPACE: default
STATUS: deployed
REVISION: 1
NOTES:
1. Get your 'admin' user password by running:

   kubectl get secret --namespace default grafana -o jsonpath="{.data.admin-password}" | base64 --decode ; echo

2. The Grafana server can be accessed via port 80 on the following DNS name from within your cluster:

   grafana.default.svc.cluster.local

   Get the Grafana URL to visit by running these commands in the same shell:

     export POD_NAME=$(kubectl get pods --namespace default -l "app.kubernetes.io/name=grafana,app.kubernetes.io/instance=grafana" -o jsonpath="{.items[0].metadata.name}")
     kubectl --namespace default port-forward $POD_NAME 3000

3. Login with the password from step 1 and the username: admin
#################################################################################
######   WARNING: Persistence is disabled!!! You will lose your data when   #####
######            the Grafana pod is terminated.                            #####
#################################################################################
and then we can get our admin password and start port-forwarding to access:
$ kubectl get secret --namespace default grafana -o jsonpath="{.data.admin-password}" | base64 --decode ; echo
r6ZbZUi9ufjiYfyu79QFaNRF104oJYFNfZID1cq2
$ export POD_NAME=$(kubectl get pods --namespace default -l "app.kubernetes.io/name=grafana,app.kubernetes.io/instance=grafana" -o jsonpath="{.items[0].metadata.name}")
$ kubectl --namespace default port-forward $POD_NAME 3000
Forwarding from 127.0.0.1:3000 -> 3000
Forwarding from [::1]:3000 -> 3000
Handling connection for 3000
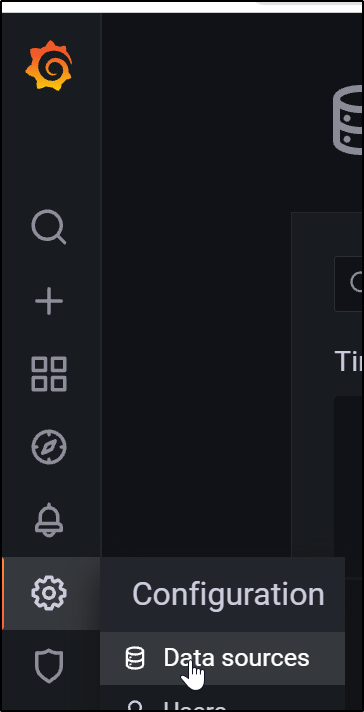
Next we need to add a data source after logging in. We can do this from the Configuration/Data Sources area
and select zipkin
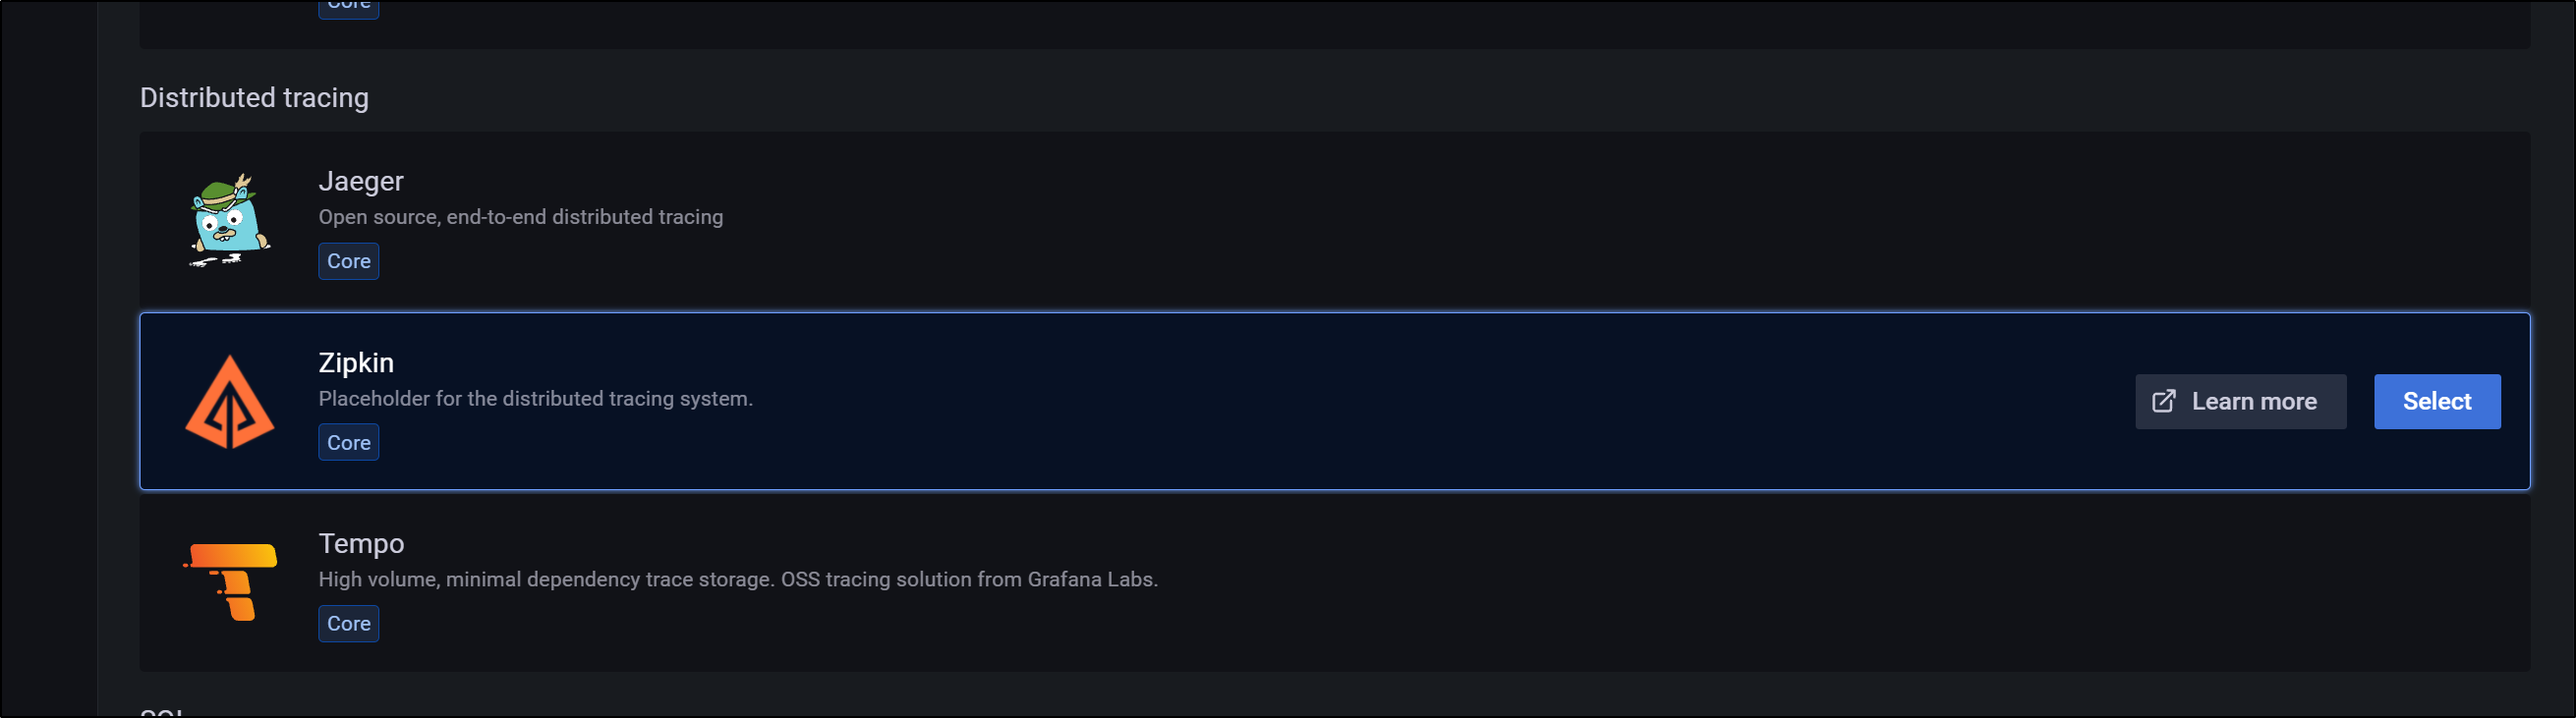
and here we can add our Zipkin endpoint

from there we can explore our metrics and see that indeed we are pulling in trace data
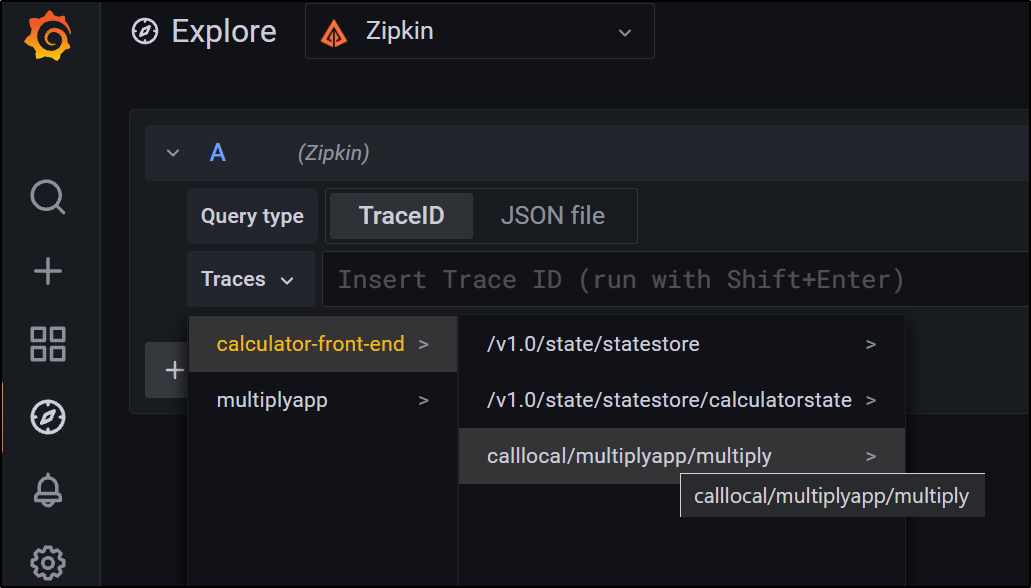
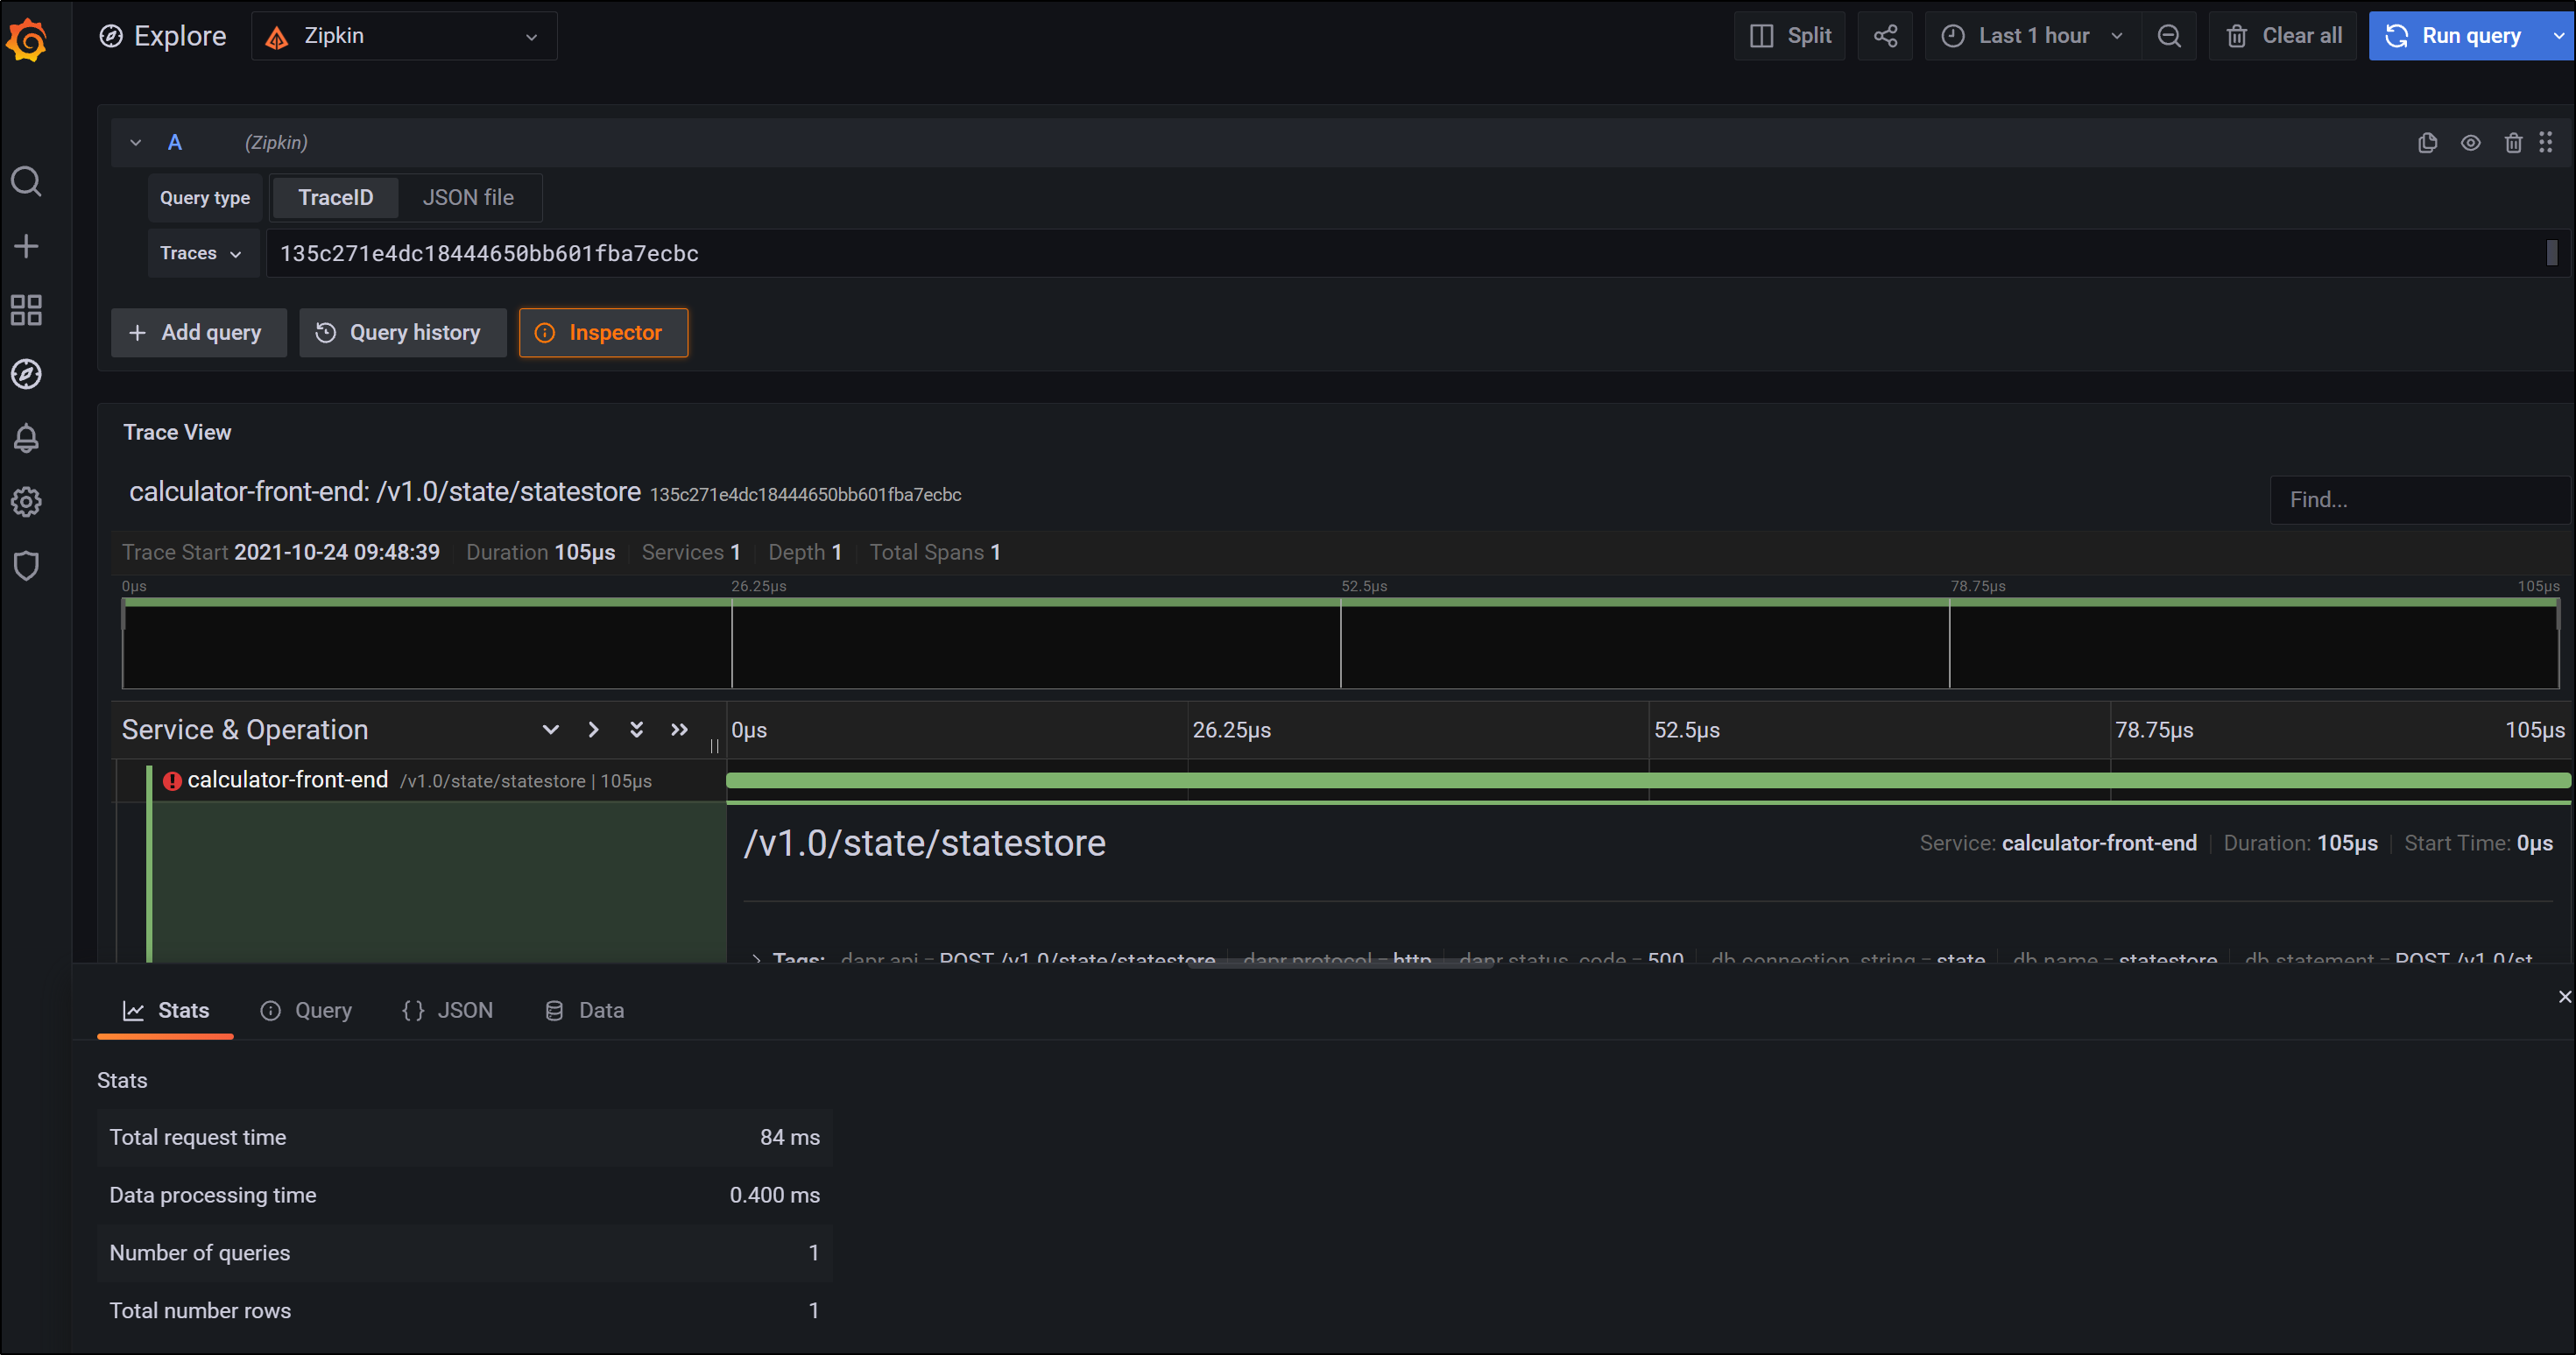
and we can then look at specific traces for details
Prometheus
Note: if you want, skip down to “Install with Istio” to just have Istio install Grafana and Prometheus
We also need Prometheus which seems to have moved around a lot lately. For the latest chart, we will use the community edition:
$ helm repo add prometheus-community https://prometheus-community.github.io/helm-charts
"prometheus-community" has been added to your repositories
$ helm repo add kube-state-metrics https://kubernetes.github.io/kube-state-metrics
"kube-state-metrics" has been added to your repositories
$ helm repo update
Hang tight while we grab the latest from your chart repositories...
...Successfully got an update from the "kube-state-metrics" chart repository
...Successfully got an update from the "kedacore" chart repository
...Successfully got an update from the "nginx-stable" chart repository
...Successfully got an update from the "crossplane-alpha" chart repository
...Successfully got an update from the "crossplane-stable" chart repository
...Successfully got an update from the "ingress-nginx" chart repository
...Successfully got an update from the "jetstack" chart repository
...Successfully got an update from the "datawire" chart repository
...Successfully got an update from the "jenkins" chart repository
...Successfully got an update from the "grafana" chart repository
...Successfully got an update from the "prometheus-community" chart repository
...Successfully got an update from the "stable" chart repository
...Successfully got an update from the "bitnami" chart repository
Update Complete. ⎈Happy Helming!⎈
Now install Prometheus
$ helm install prometheus prometheus-community/prometheus
NAME: prometheus
LAST DEPLOYED: Sun Oct 24 10:55:22 2021
NAMESPACE: default
STATUS: deployed
REVISION: 1
TEST SUITE: None
NOTES:
The Prometheus server can be accessed via port 80 on the following DNS name from within your cluster:
prometheus-server.default.svc.cluster.local


Get the Prometheus server URL by running these commands in the same shell:
  export POD_NAME=$(kubectl get pods --namespace default -l "app=prometheus,component=server" -o jsonpath="{.items[0].metadata.name}")
  kubectl --namespace default port-forward $POD_NAME 9090


The Prometheus alertmanager can be accessed via port 80 on the following DNS name from within your cluster:
prometheus-alertmanager.default.svc.cluster.local


Get the Alertmanager URL by running these commands in the same shell:
  export POD_NAME=$(kubectl get pods --namespace default -l "app=prometheus,component=alertmanager" -o jsonpath="{.items[0].metadata.name}")
  kubectl --namespace default port-forward $POD_NAME 9093
#################################################################################
######   WARNING: Pod Security Policy has been moved to a global property.  #####
######            use .Values.podSecurityPolicy.enabled with pod-based      #####
######            annotations                                               #####
######            (e.g. .Values.nodeExporter.podSecurityPolicy.annotations) #####
#################################################################################


The Prometheus PushGateway can be accessed via port 9091 on the following DNS name from within your cluster:
prometheus-pushgateway.default.svc.cluster.local


Get the PushGateway URL by running these commands in the same shell:
  export POD_NAME=$(kubectl get pods --namespace default -l "app=prometheus,component=pushgateway" -o jsonpath="{.items[0].metadata.name}")
  kubectl --namespace default port-forward $POD_NAME 9091

For more information on running Prometheus, visit:
https://prometheus.io/
Then add it as a data source in Grafana
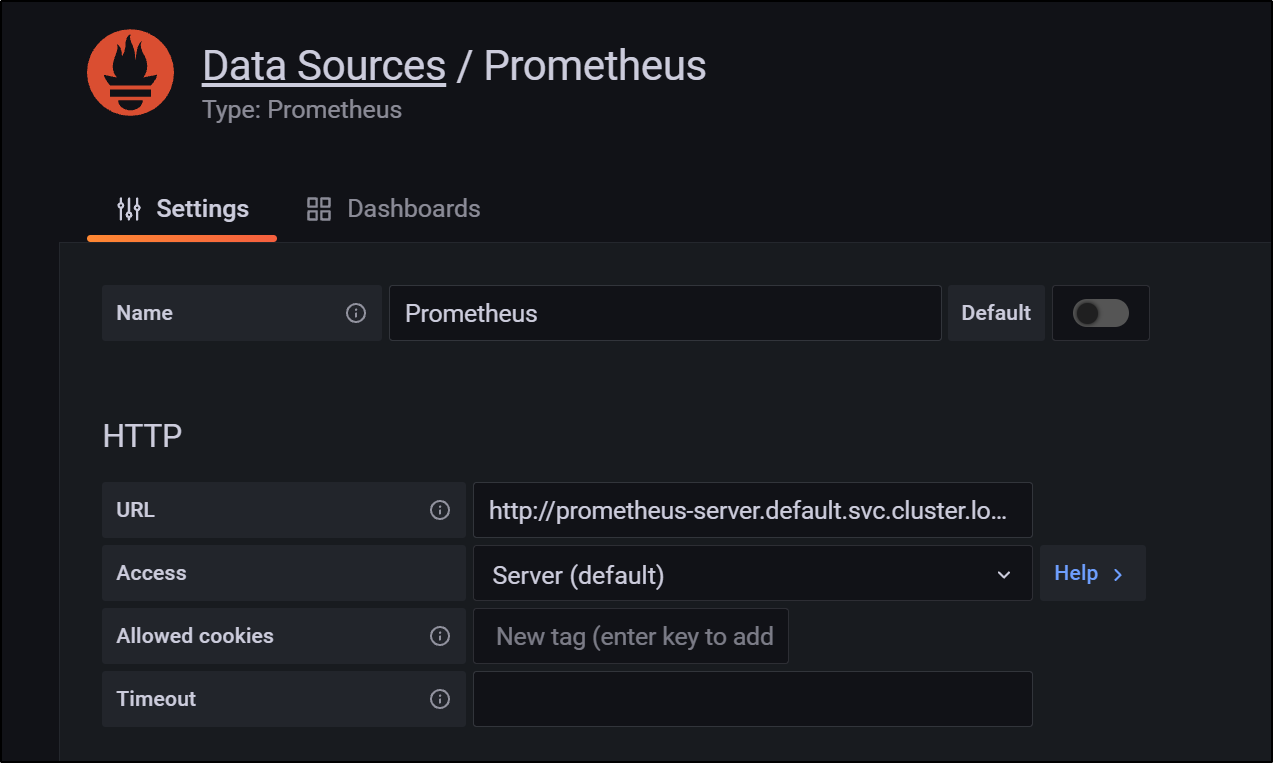
note: for me it was http://prometheus-server.default.svc.cluster.local without the 9090 port
For Prometheus to scrape the pod, we need to add annotations ot the deployment yaml:
$ kubectl get deployments calculator-front-end -o yaml > calc-deployment.yaml
$ kubectl get deployments calculator-front-end -o yaml > calc-deployment.yaml.bak
$ vi calc-deployment.yaml

$ diff -c calc-deployment.yaml calc-deployment.yaml.bak
*** calc-deployment.yaml        2021-10-24 11:08:01.406274000 -0500
--- calc-deployment.yaml.bak    2021-10-24 11:07:24.326274000 -0500
***************
*** 122,130 ****
          dapr.io/app-port: "8080"
          dapr.io/config: appconfig
          dapr.io/enabled: "true"
-         prometheus.io/scrape: "true"
-         prometheus.io/path: /metrics
-         prometheus.io/port: "8080"
        creationTimestamp: null
        labels:
          app: calculator-front-end
--- 122,127 ----


$ kubectl apply -f calc-deployment.yaml
deployment.apps/calculator-front-end configured
Using Istio to install
Let’s do a fresh AKS to start.
The following one-liner creates a demo cluster in a “Visual Studio Enterprise Subscription” sub and then adds Dapr:
$ az account set --subscription "Visual Studio Enterprise Subscription" && az group create -n mydemoaksrg --location centralus && az aks create -n basicclusteridj -g mydemoaksrg && az aks get-credentials -n basicclusteridj -g mydemoaksrg --admin && dapr init -k
...
  "type": "Microsoft.ContainerService/ManagedClusters",
  "windowsProfile": null
}
Merged "basicclusteridj-admin" as current context in /home/builder/.kube/config
⌛  Making the jump to hyperspace...
ℹ️  Note: To install Dapr using Helm, see here: https://docs.dapr.io/getting-started/install-dapr-kubernetes/#install-with-helm-advanced

✅  Deploying the Dapr control plane to your cluster...
✅  Success! Dapr has been installed to namespace dapr-system. To verify, run `dapr status -k' in your terminal. To get started, go here: https://aka.ms/dapr-getting-started
Next we need to install istioctl
$ curl -L https://istio.io/downloadIstio | sh -
  % Total    % Received % Xferd  Average Speed   Time    Time     Time  Current
                                 Dload  Upload   Total   Spent    Left  Speed
100   102  100   102    0     0    148      0 --:--:-- --:--:-- --:--:--   148
100  4549  100  4549    0     0   4622      0 --:--:-- --:--:-- --:--:--  4622

Downloading istio-1.11.4 from https://github.com/istio/istio/releases/download/1.11.4/istio-1.11.4-linux-amd64.tar.gz ...

Istio 1.11.4 Download Complete!

Istio has been successfully downloaded into the istio-1.11.4 folder on your system.

Next Steps:
See https://istio.io/latest/docs/setup/install/ to add Istio to your Kubernetes cluster.

To configure the istioctl client tool for your workstation,
add the /home/builder/Workspaces/jekyll-blog/istio-1.11.4/bin directory to your environment path variable with:
         export PATH="$PATH:/home/builder/Workspaces/jekyll-blog/istio-1.11.4/bin"

Begin the Istio pre-installation check by running:
         istioctl x precheck

Need more information? Visit https://istio.io/latest/docs/setup/install/
Now install Istio using the demo profile
$ istioctl install --set profile=demo -y
✔ Istio core installed
✔ Istiod installed
✔ Egress gateways installed
✔ Ingress gateways installed
✔ Installation complete
Thank you for installing Istio 1.11.  Please take a few minutes to tell us about your install/upgrade experience!  https://forms.gle/kWULBRjUv7hHci7T6
Clone the Istio GH repo and install the sample app
$ git clone https://github.com/istio/istio.git
Cloning into 'istio'...
remote: Enumerating objects: 314728, done.
remote: Counting objects: 100% (1751/1751), done.
remote: Compressing objects: 100% (1107/1107), done.
remote: Total 314728 (delta 898), reused 1206 (delta 604), pack-reused 312977
Receiving objects: 100% (314728/314728), 199.00 MiB | 6.29 MiB/s, done.
Resolving deltas: 100% (204126/204126), done.
$ cd istio/
$ kubectl apply -f samples/bookinfo/platform/kube/bookinfo.yaml
service/details created
serviceaccount/bookinfo-details created
deployment.apps/details-v1 created
service/ratings created
serviceaccount/bookinfo-ratings created
deployment.apps/ratings-v1 created
service/reviews created
serviceaccount/bookinfo-reviews created
deployment.apps/reviews-v1 created
deployment.apps/reviews-v2 created
deployment.apps/reviews-v3 created
service/productpage created
serviceaccount/bookinfo-productpage created
deployment.apps/productpage-v1 created
We can see the services have spun up:
$ kubectl get svc
NAME          TYPE        CLUSTER-IP     EXTERNAL-IP   PORT(S)    AGE
details       ClusterIP   10.0.233.64    <none>        9080/TCP   2m44s
kubernetes    ClusterIP   10.0.0.1       <none>        443/TCP    42m
productpage   ClusterIP   10.0.200.246   <none>        9080/TCP   2m43s
ratings       ClusterIP   10.0.91.155    <none>        9080/TCP   2m43s
reviews       ClusterIP   10.0.252.244   <none>        9080/TCP   2m43s
And verification it is serving pages:
$ kubectl exec "$(kubectl get pod -l app=ratings -o jsonpath='{.items[0].metadata.name}')" -c ratings -- curl -sS productpage:9080/productpage | grep -o "<title>.*</title>"
<title>Simple Bookstore App</title>
Expose the service with Istio
$ kubectl apply -f samples/bookinfo/networking/bookinfo-gateway.yaml
gateway.networking.istio.io/bookinfo-gateway created
virtualservice.networking.istio.io/bookinfo created
Check our ingress in the istio namespace
$ kubectl get svc -n istio-system
NAME                   TYPE           CLUSTER-IP     EXTERNAL-IP     PORT(S)                                                                      AGE
istio-egressgateway    ClusterIP      10.0.1.155     <none>          80/TCP,443/TCP                                                               24m
istio-ingressgateway   LoadBalancer   10.0.216.129   20.84.226.251   15021:31424/TCP,80:32377/TCP,443:31549/TCP,31400:30208/TCP,15443:30855/TCP   24m
istiod                 ClusterIP      10.0.15.153    <none>          15010/TCP,15012/TCP,443/TCP,15014/TCP                                        24m
and we can see the product page via the Ingress now
Now need to install the addons which will bring us Grafana, Prometheus and others
$ kubectl apply -f samples/addons
serviceaccount/grafana created
configmap/grafana created
service/grafana created
deployment.apps/grafana created
configmap/istio-grafana-dashboards created
configmap/istio-services-grafana-dashboards created
deployment.apps/jaeger created
service/tracing created
service/zipkin created
service/jaeger-collector created
serviceaccount/kiali created
configmap/kiali created
clusterrole.rbac.authorization.k8s.io/kiali-viewer created
clusterrole.rbac.authorization.k8s.io/kiali created
clusterrolebinding.rbac.authorization.k8s.io/kiali created
role.rbac.authorization.k8s.io/kiali-controlplane created
rolebinding.rbac.authorization.k8s.io/kiali-controlplane created
service/kiali created
deployment.apps/kiali created
serviceaccount/prometheus created
configmap/prometheus created
clusterrole.rbac.authorization.k8s.io/prometheus created
clusterrolebinding.rbac.authorization.k8s.io/prometheus created
service/prometheus created
deployment.apps/prometheus created
Kiali
Install / Rollout Kiali
$ kubectl rollout status deployment/kiali -n istio-system
deployment "kiali" successfully rolled out
We wont see any data until we label the namespace for istio injection and rotate the pods:
$ kubectl label namespace default istio-injection=enabled
namespace/default labeled
$ kubectl delete pods -n default --all
pod "details-v1-79f774bdb9-fd4s7" deleted
pod "productpage-v1-6b746f74dc-mq4r7" deleted
pod "ratings-v1-b6994bb9-2zwd2" deleted
pod "reviews-v1-545db77b95-7wcns" deleted
pod "reviews-v2-7bf8c9648f-9pshn" deleted
pod "reviews-v3-84779c7bbc-fghb7" deleted
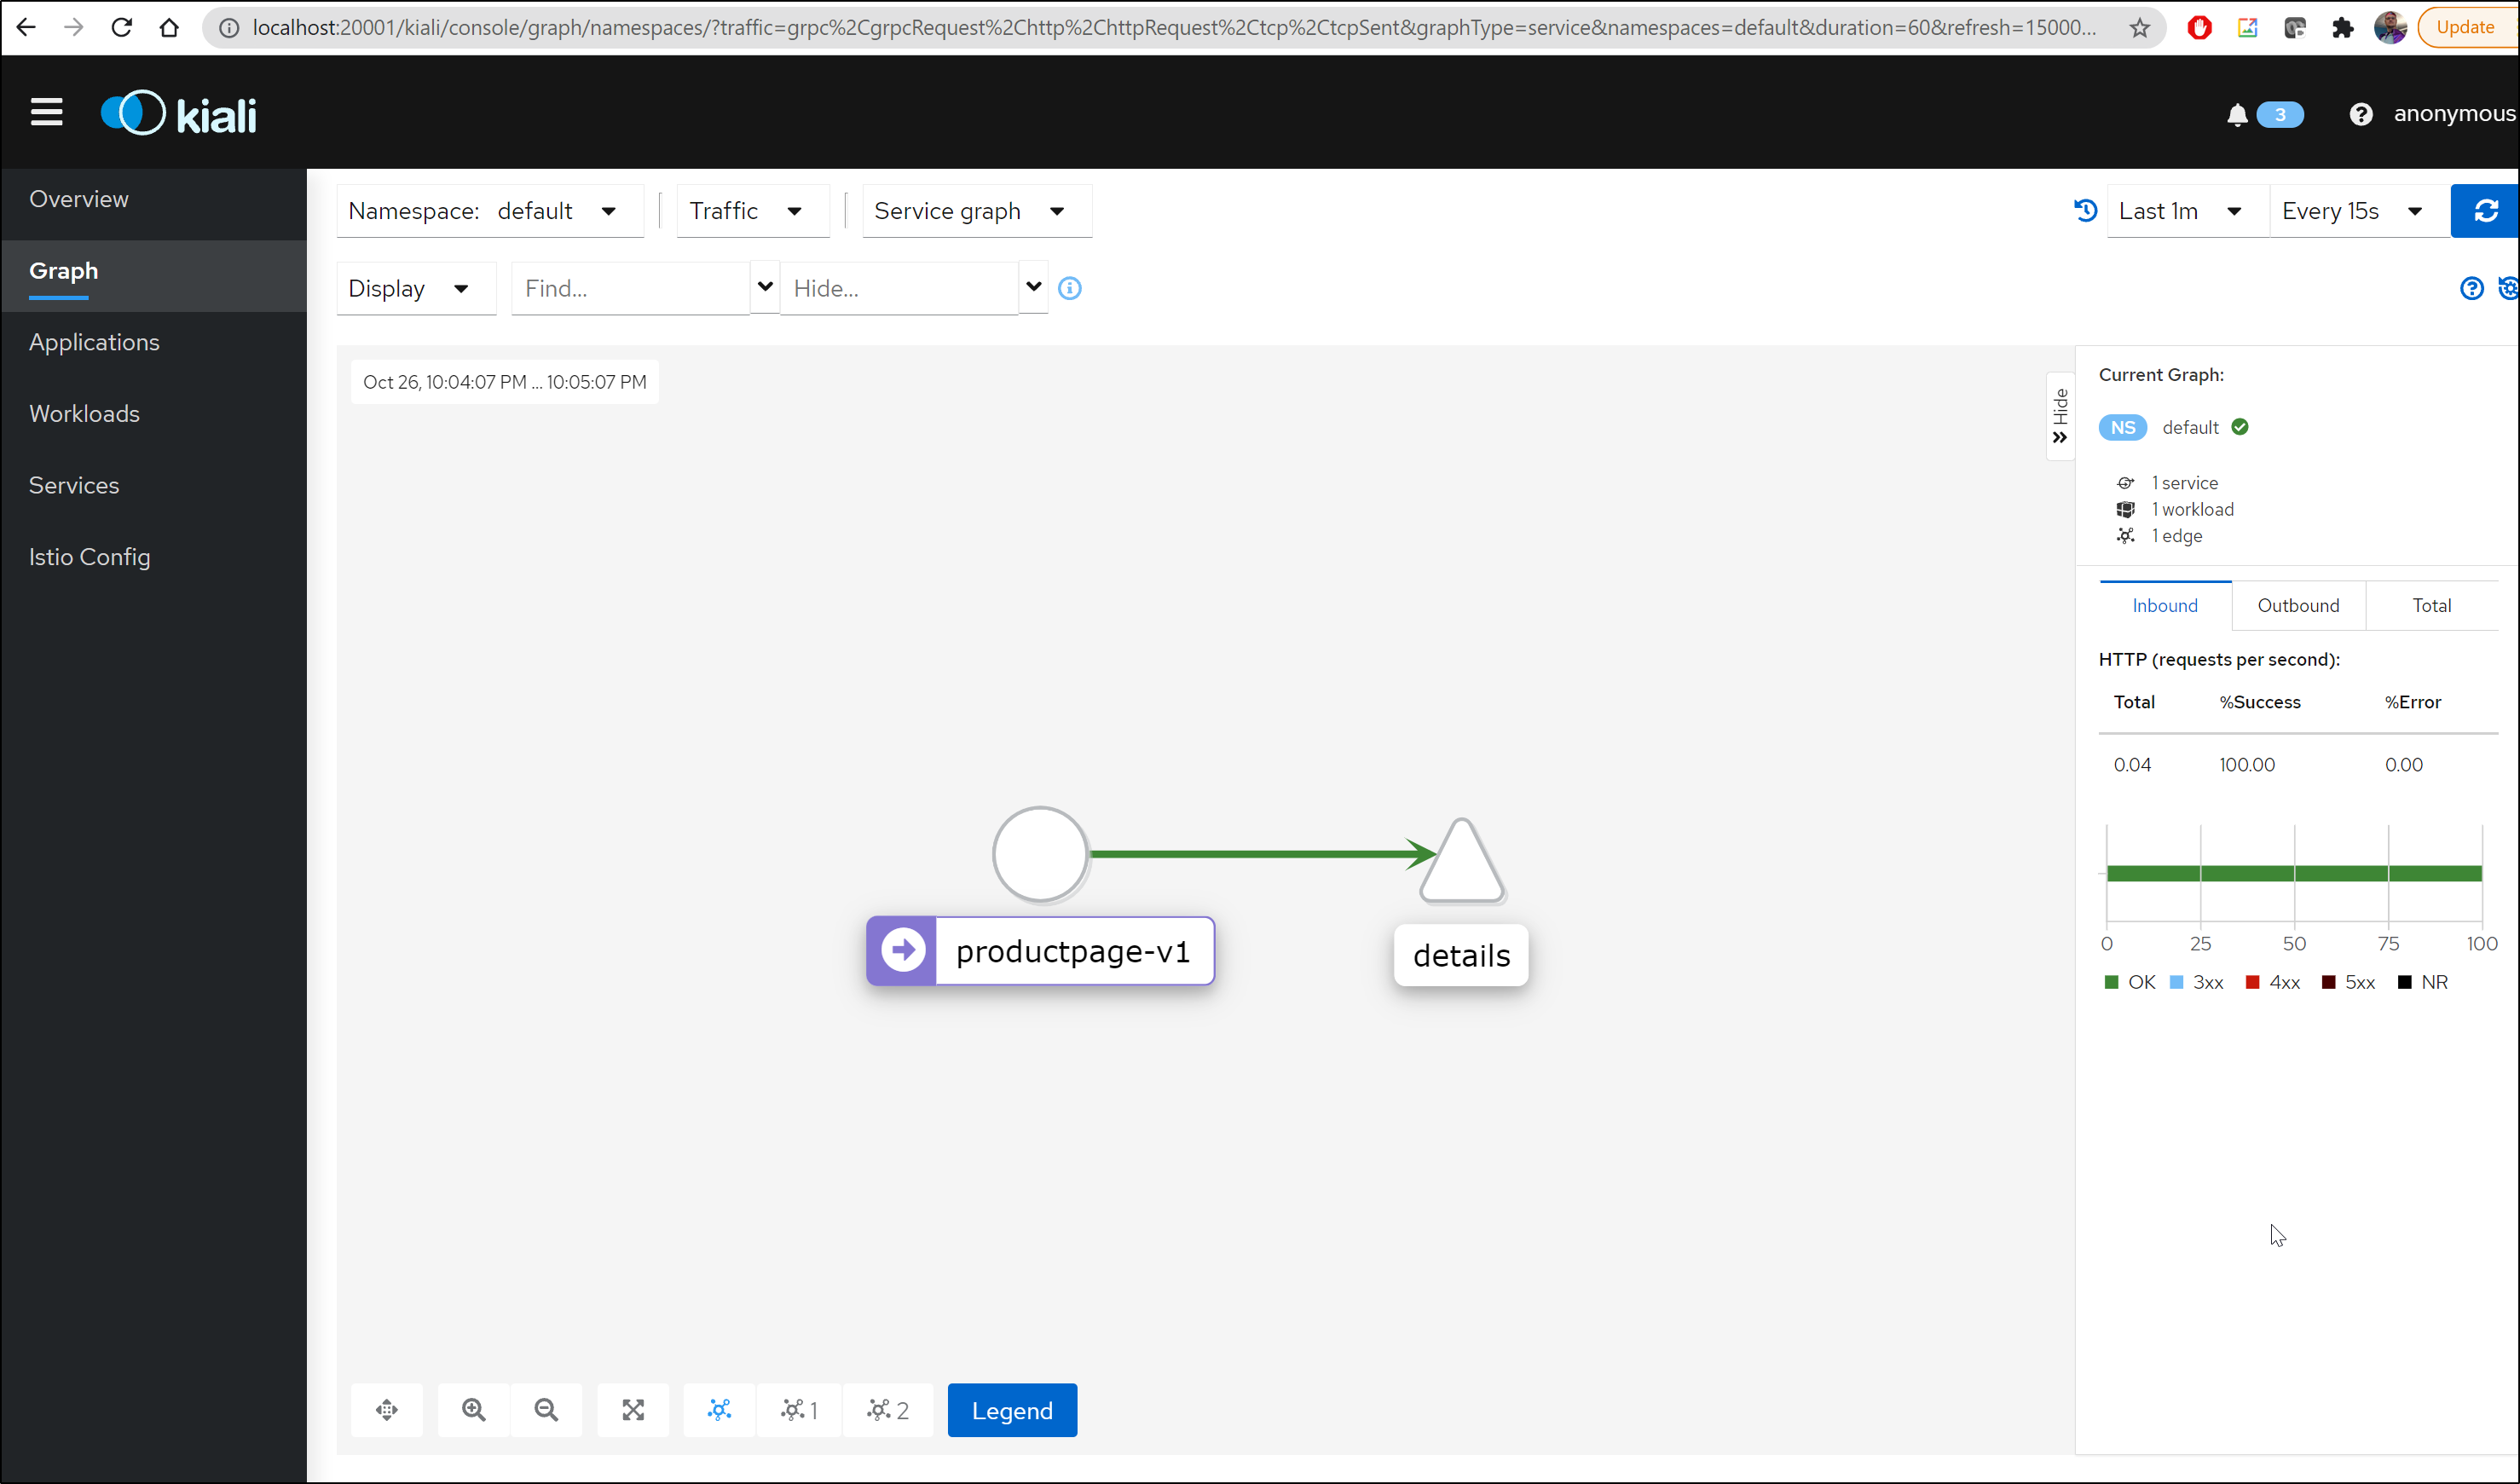
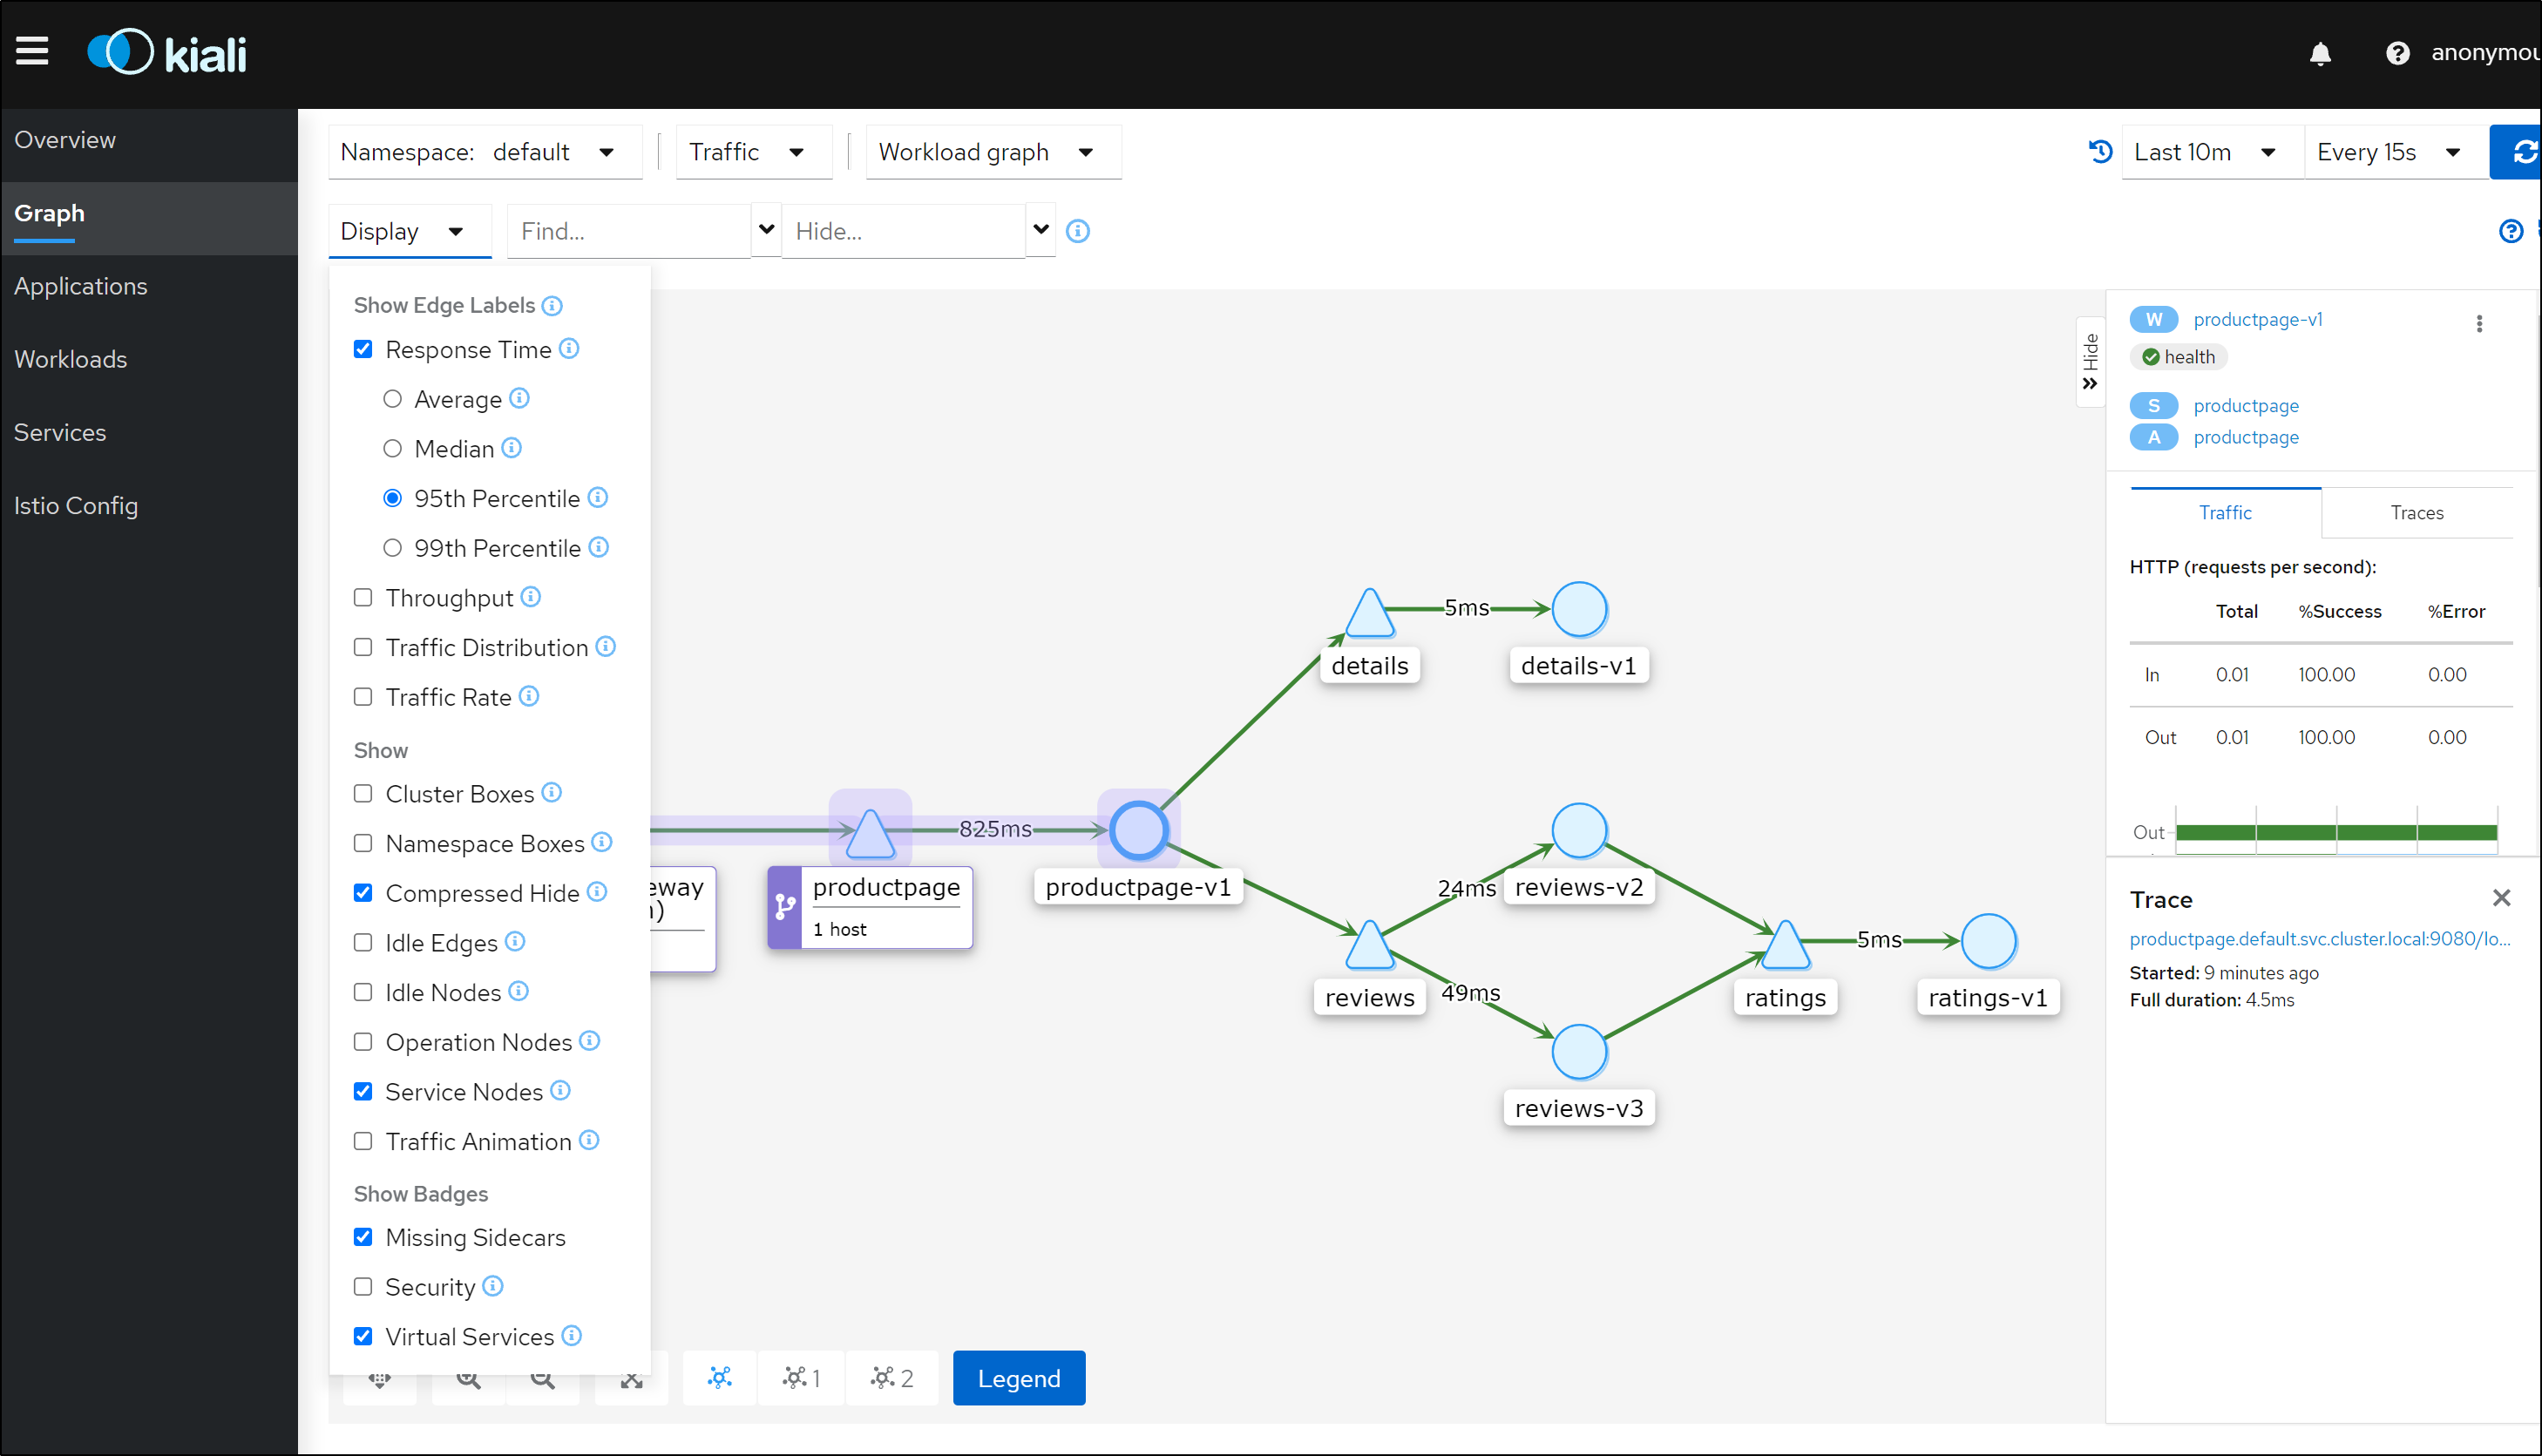
Now if we refresh the product page and launch kiali, we can see the service graph
$ istioctl dashboard kiali
http://localhost:20001/kiali
Failed to open browser; open http://localhost:20001/kiali in your browser.
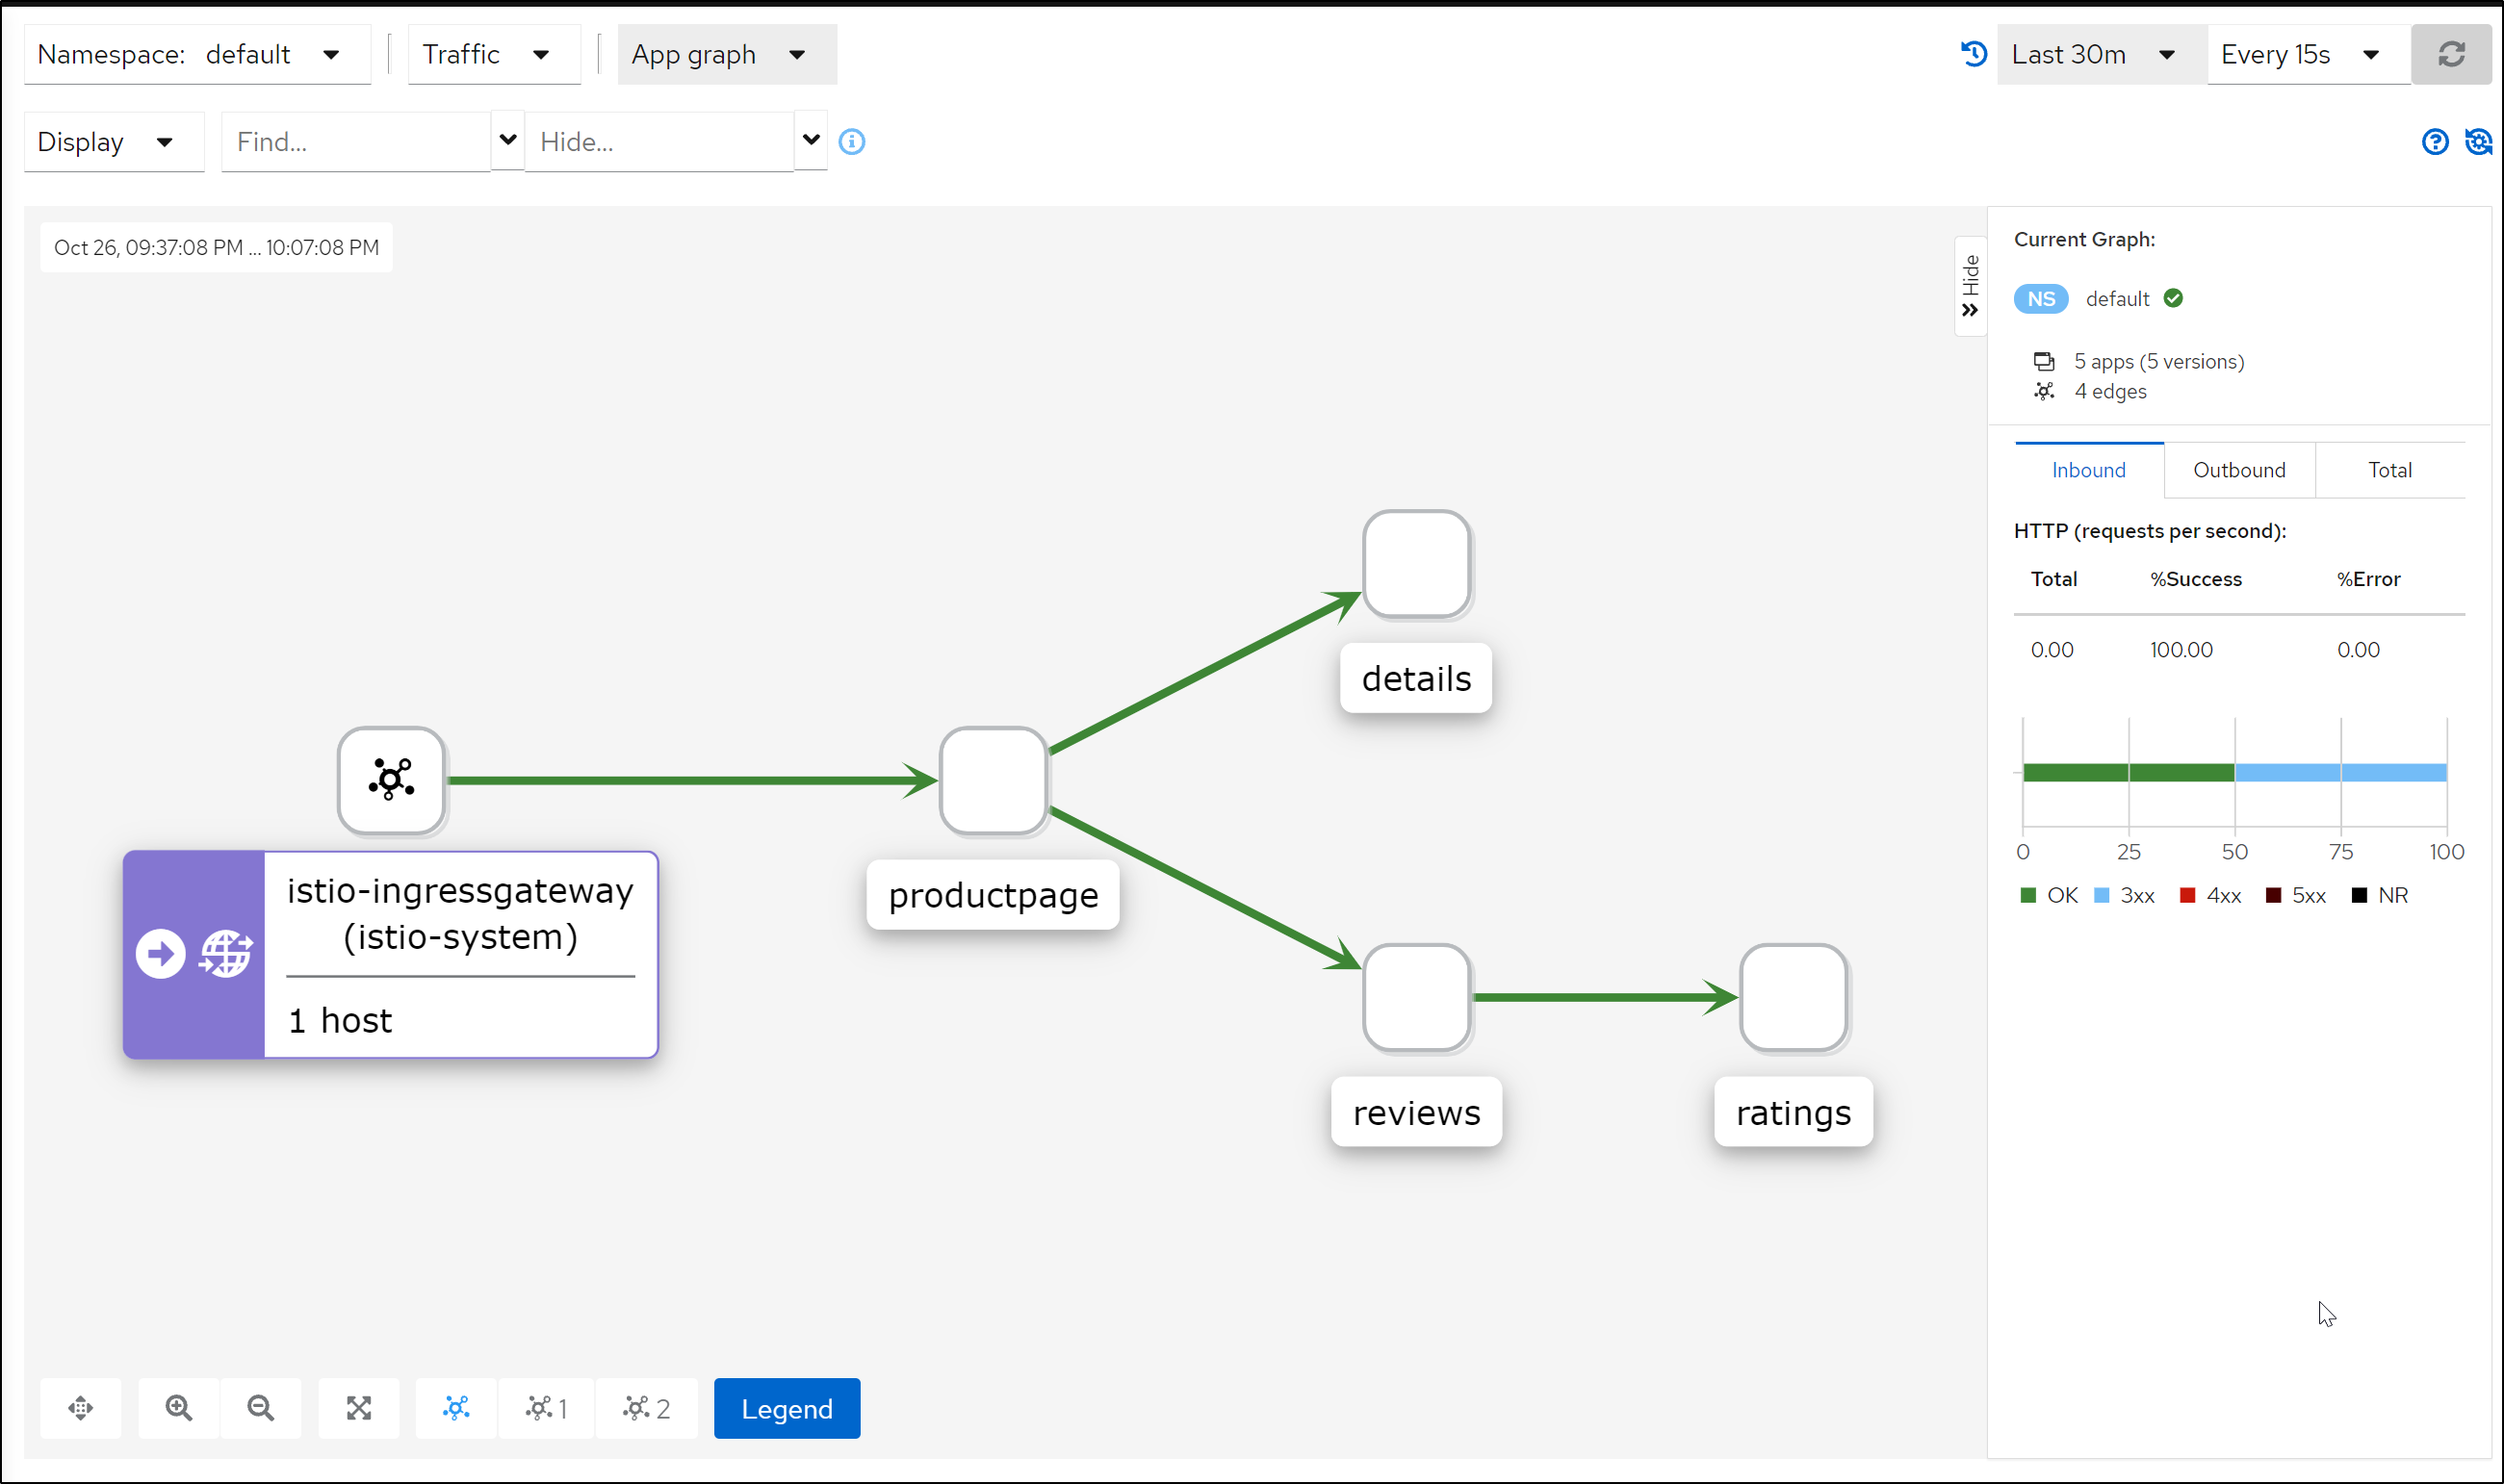
Refreshing a few more times, we can see the app graph
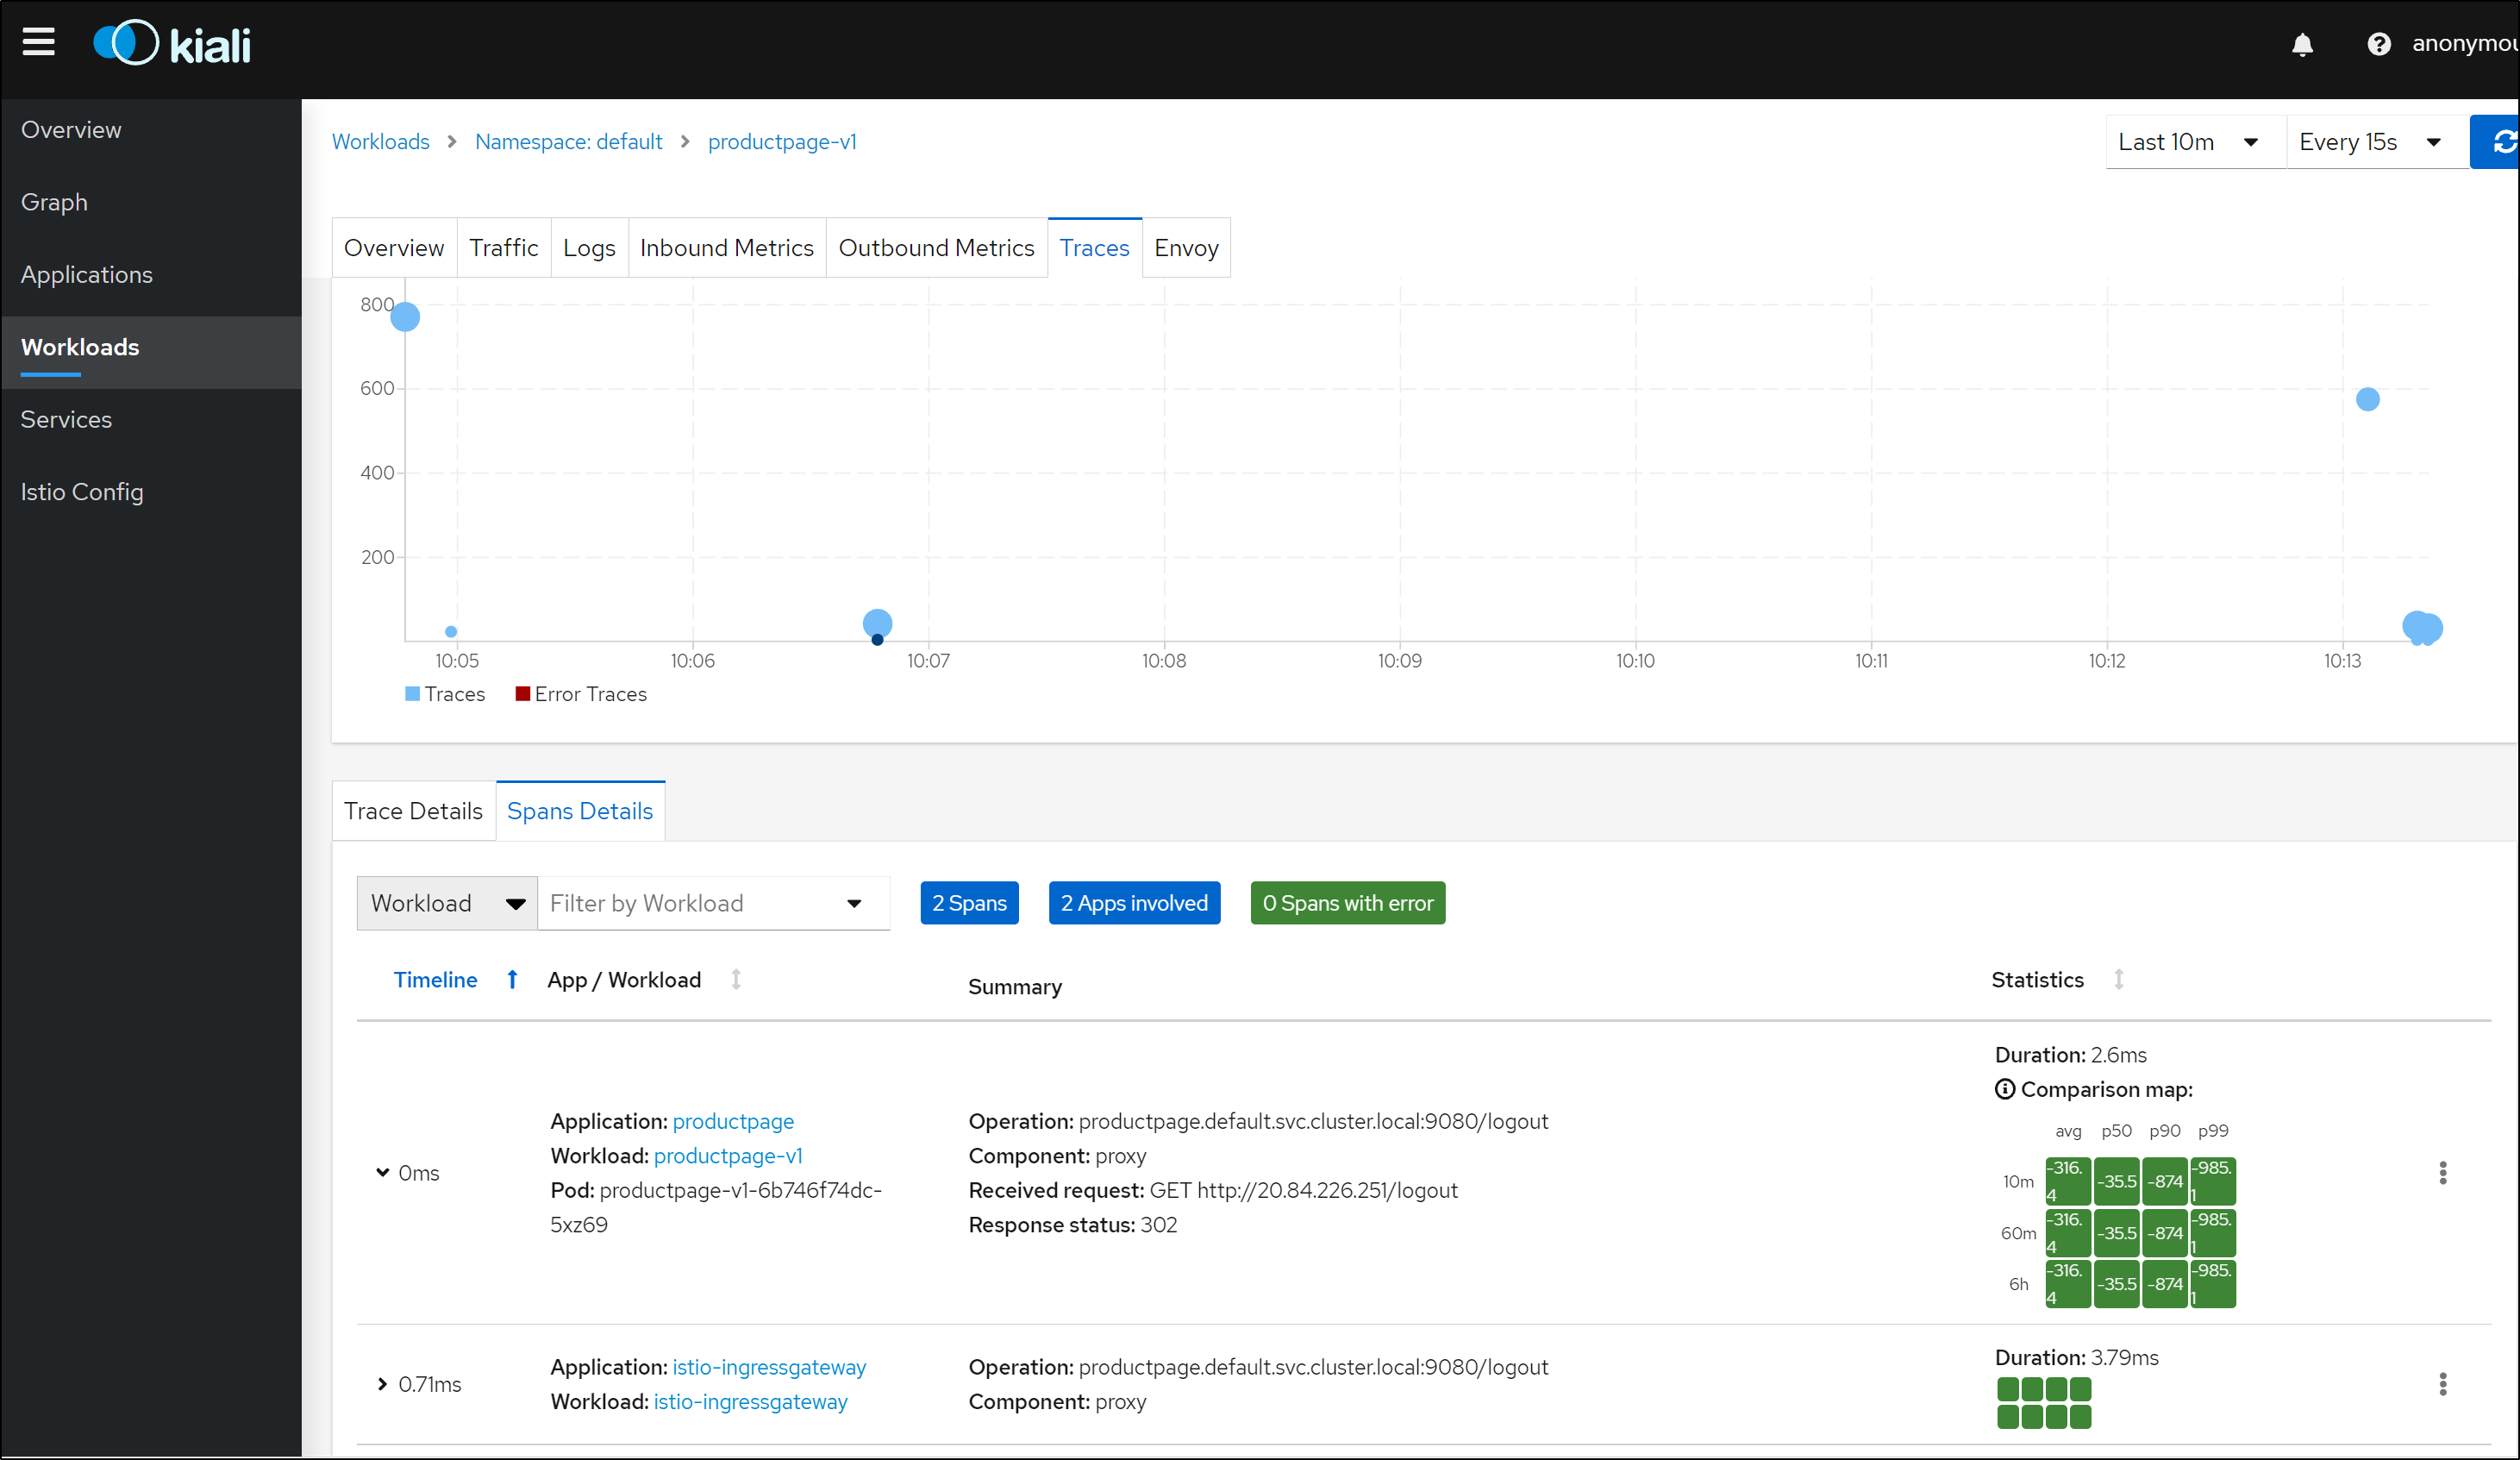
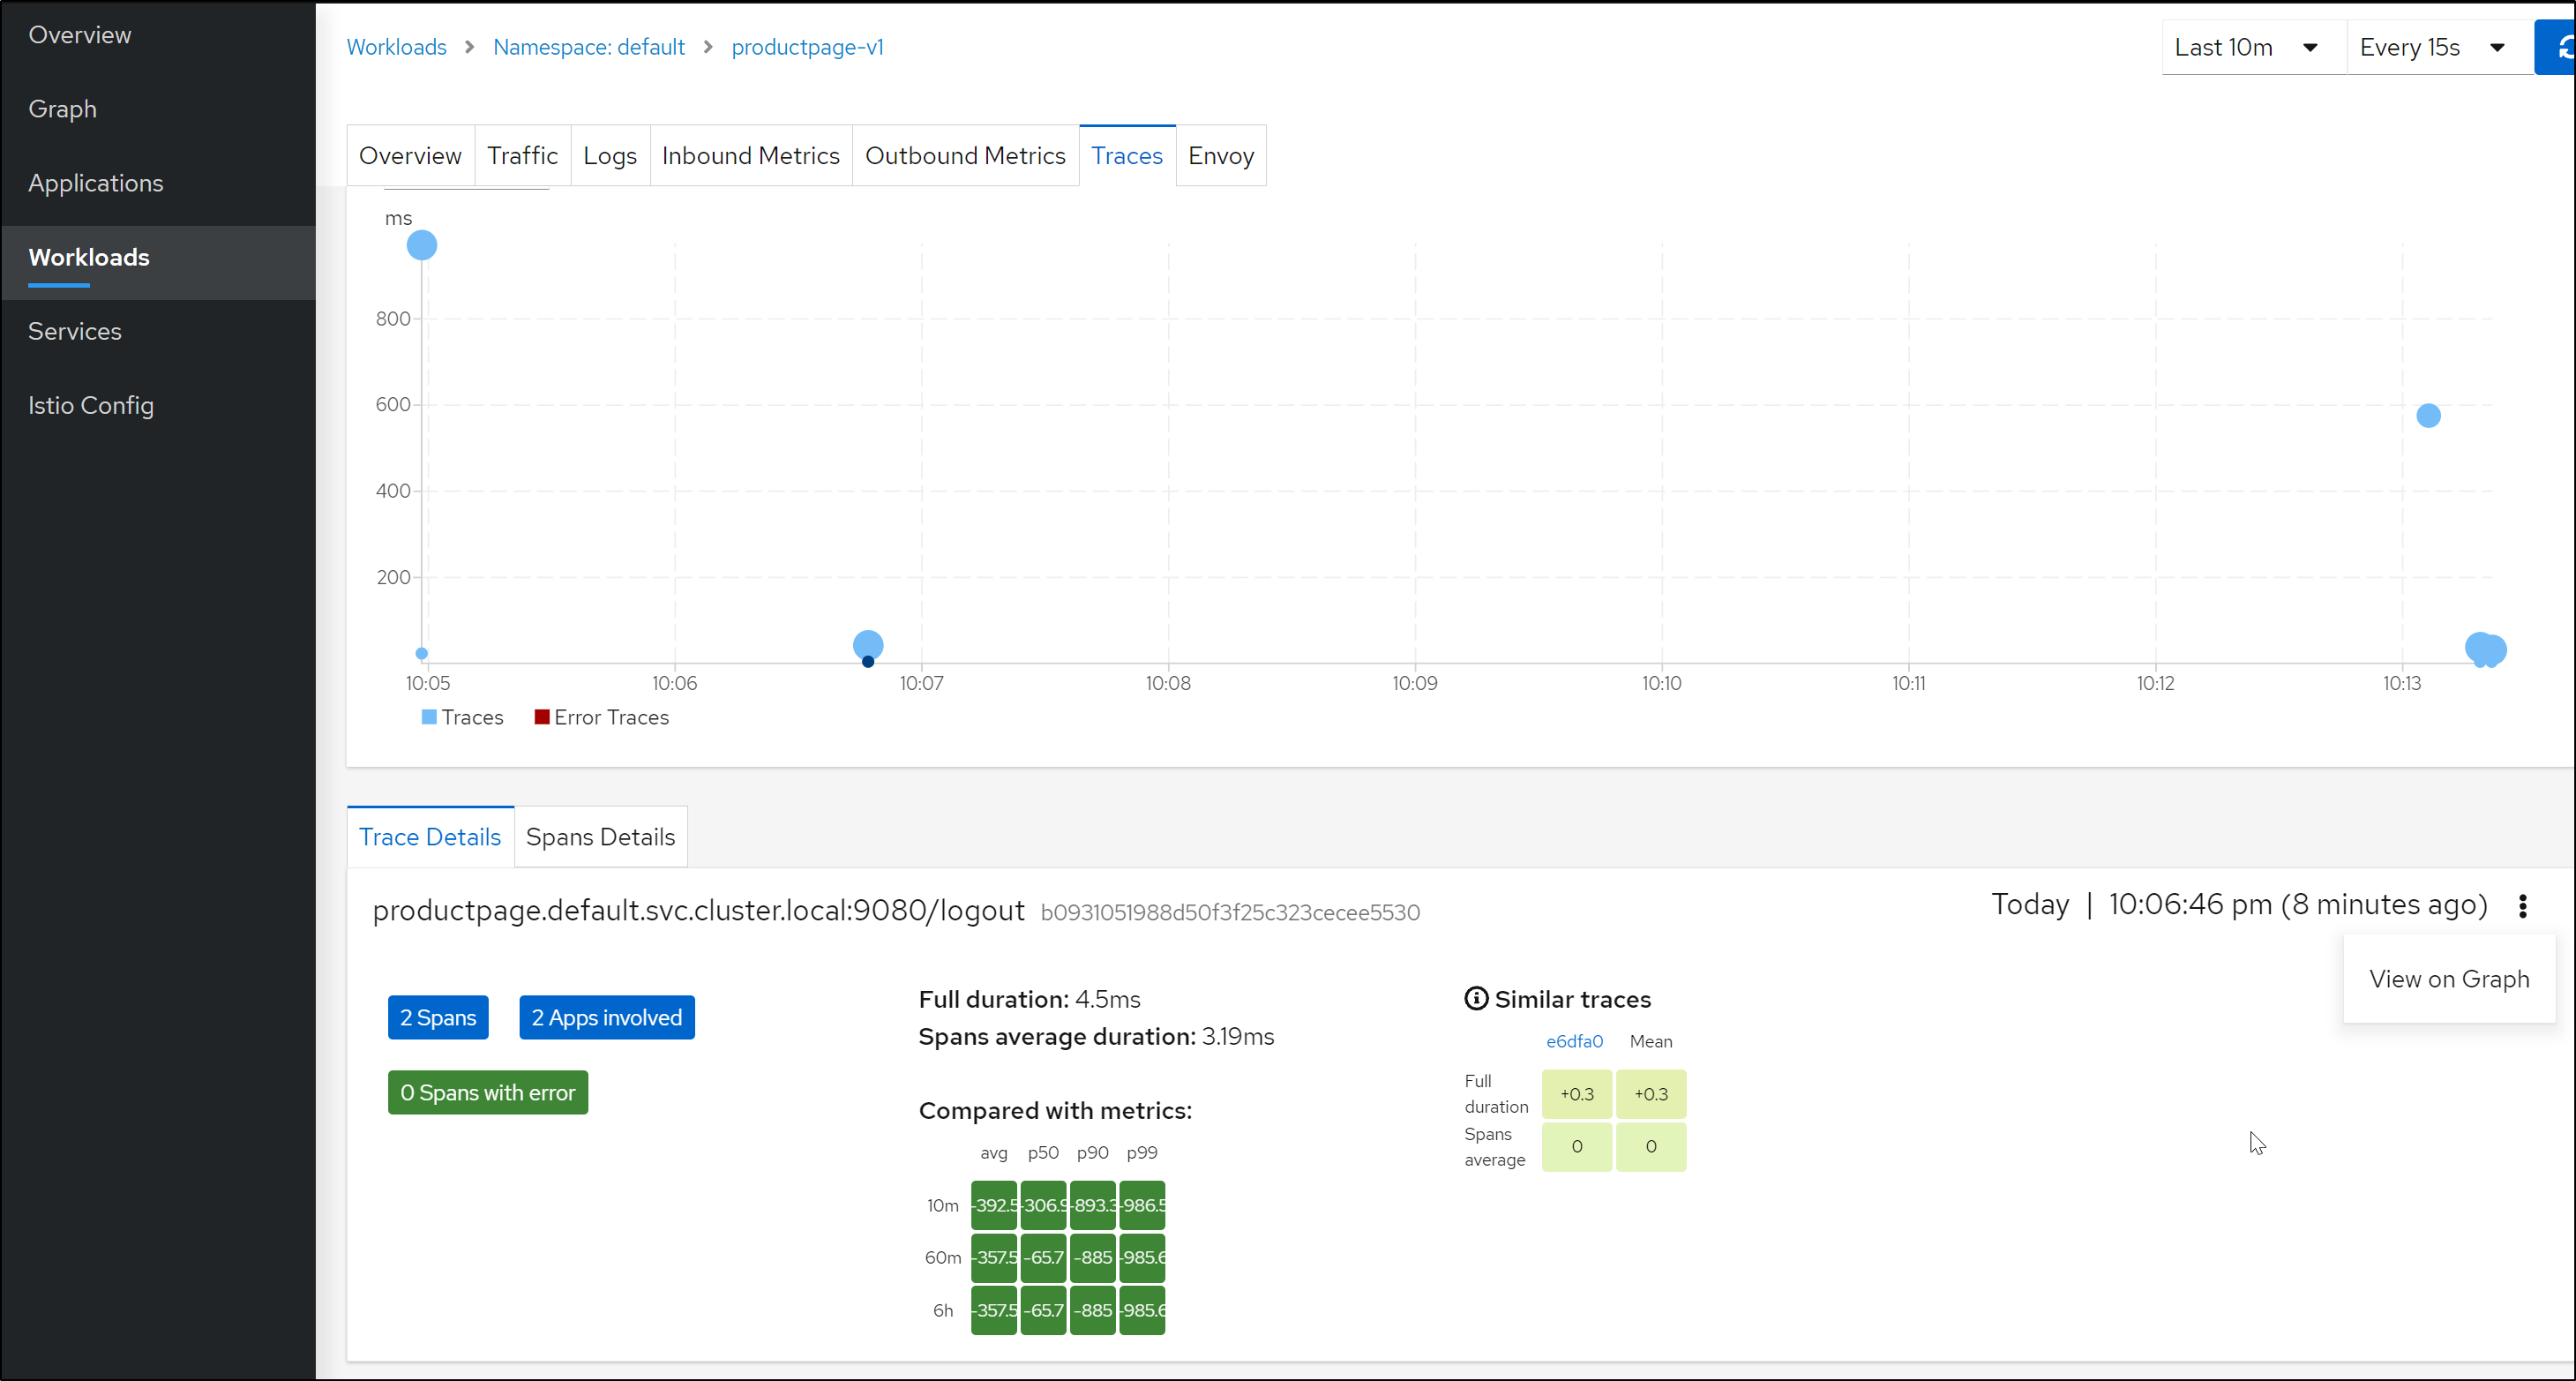
We can see trace and span data in Kiali under Workloads
Be aware that when we go to Graphs, to see response times instead of operations a second or error rates, we need to expand the graph options
Becuase we installed Prometheus at the same time, we can port-forward to that pod and directly access metrics as well:
$ kubectl port-forward prometheus-8945b4d5-d5gts -n istio-system 9090:9090
Forwarding from 127.0.0.1:9090 -> 9090
Forwarding from [::1]:9090 -> 9090

We can also port-forward to Grafana and see its dashboard
$ kubectl port-forward grafana-cf9797cf8-flp24 -n istio-system 3000:3000
Forwarding from 127.0.0.1:3000 -> 3000
Forwarding from [::1]:3000 -> 3000
this includes a pre-loaded Istio dashboard
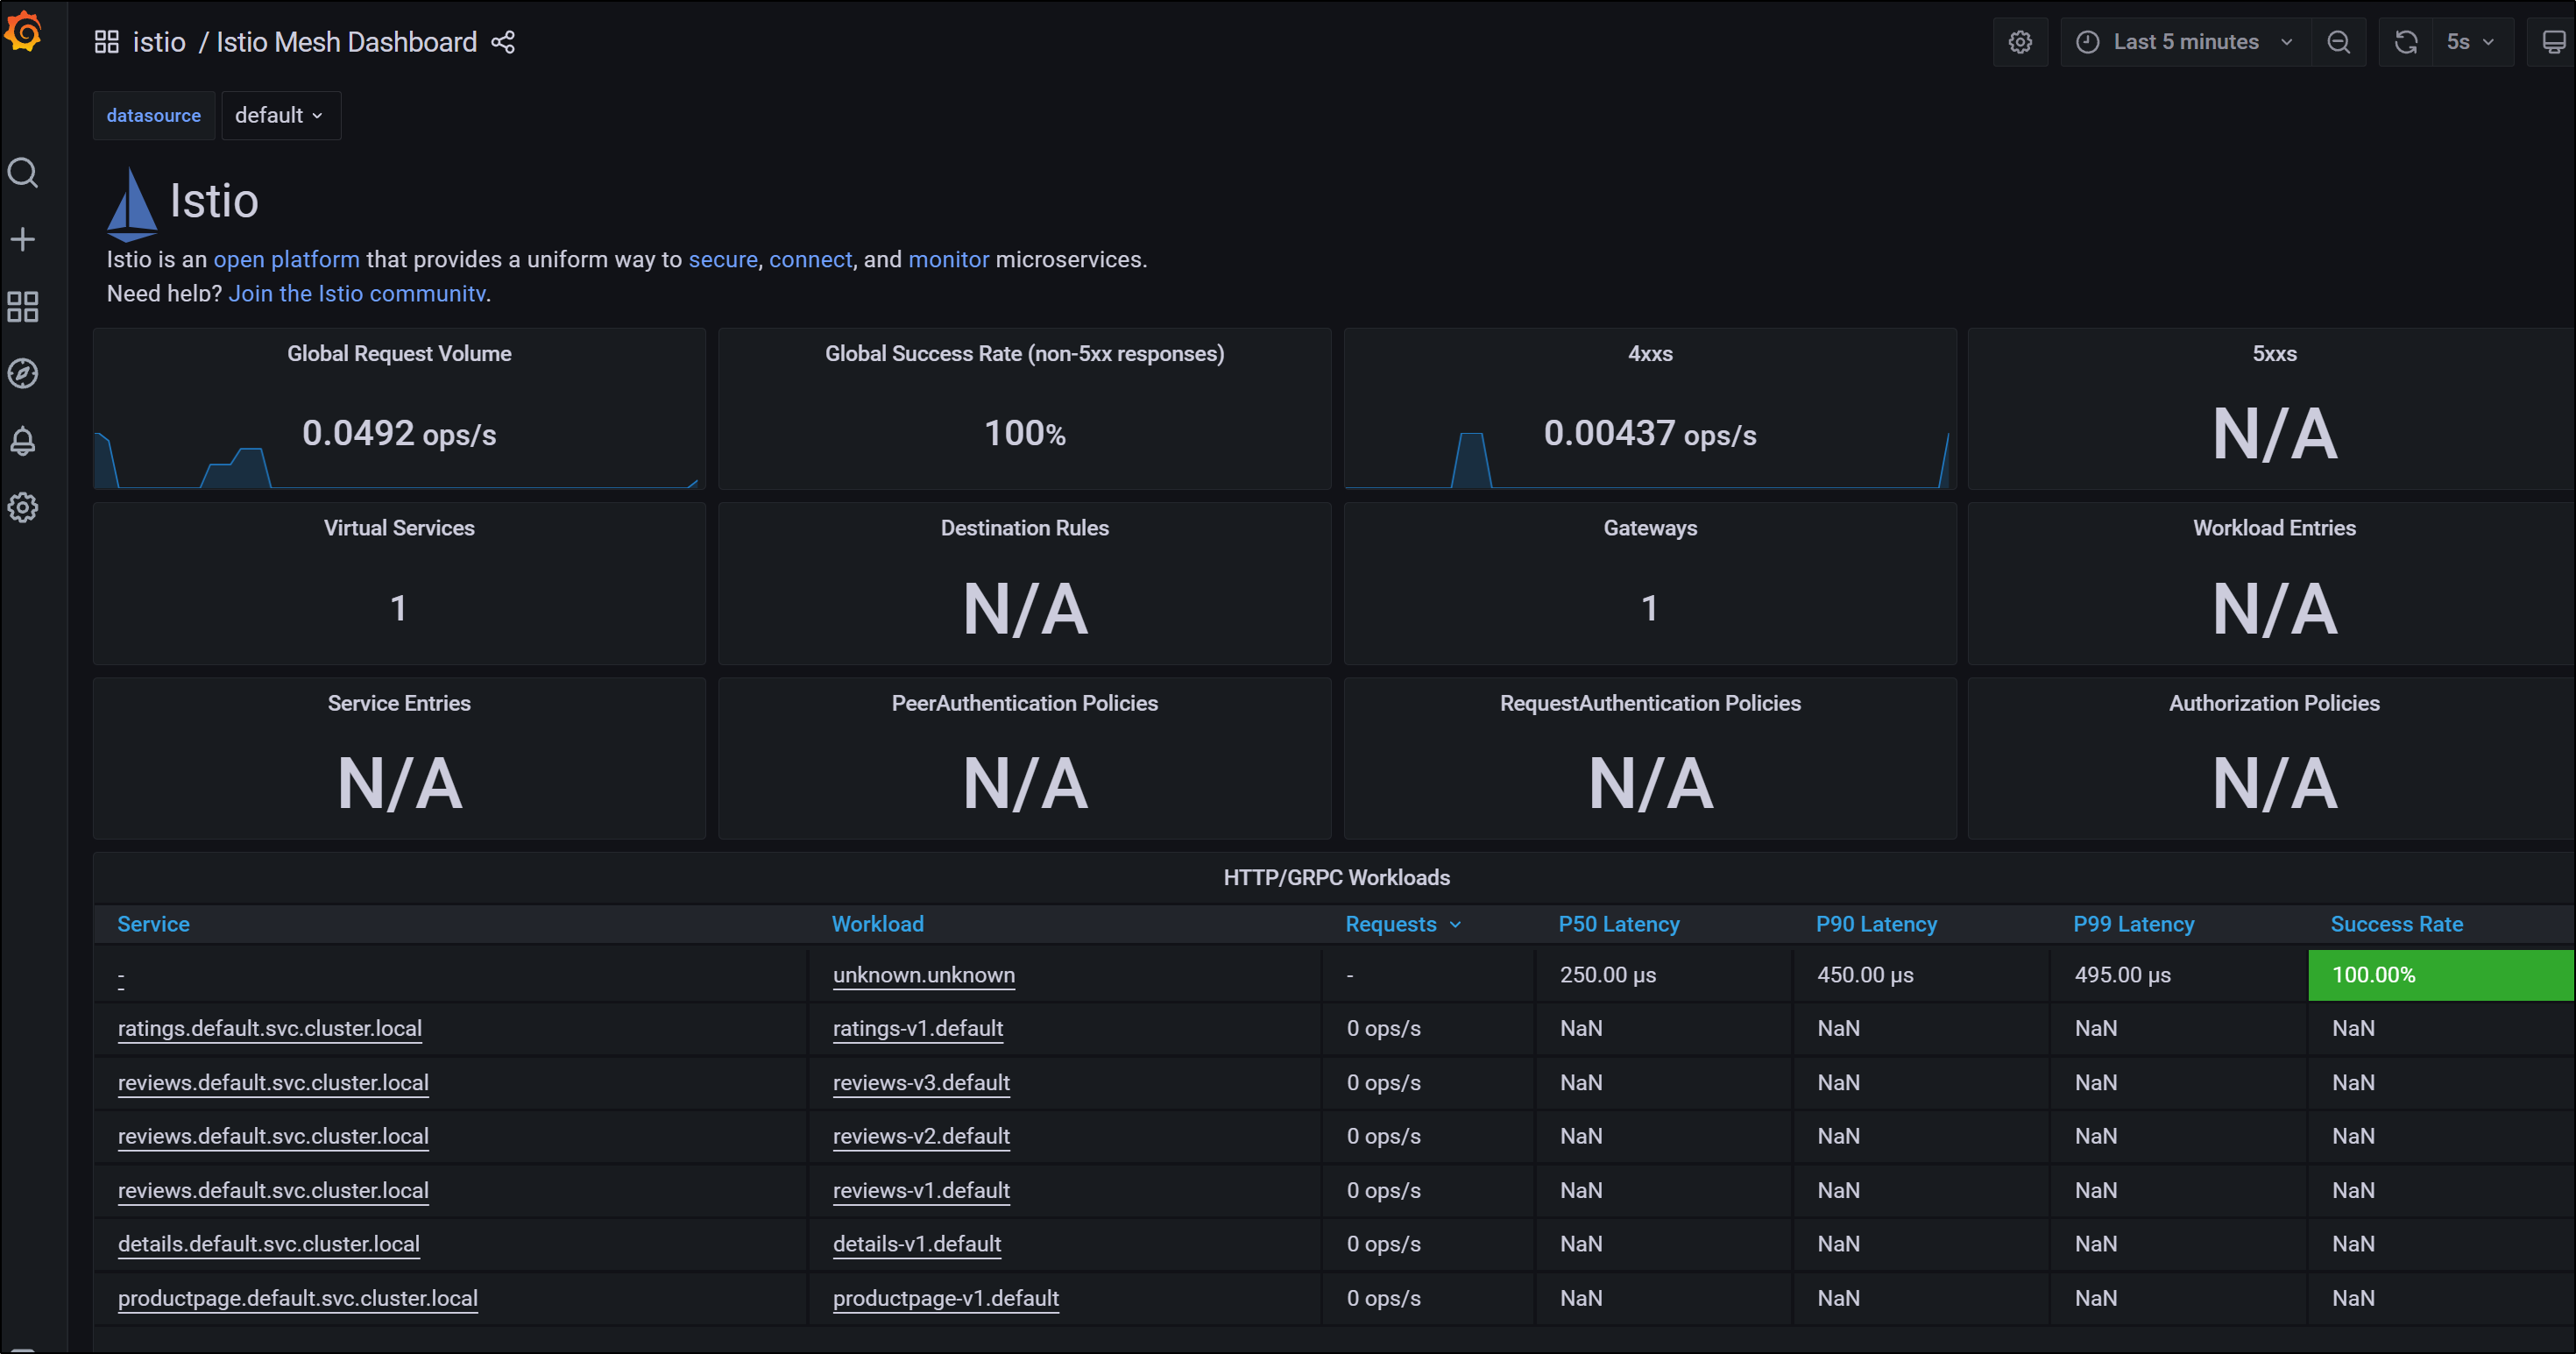
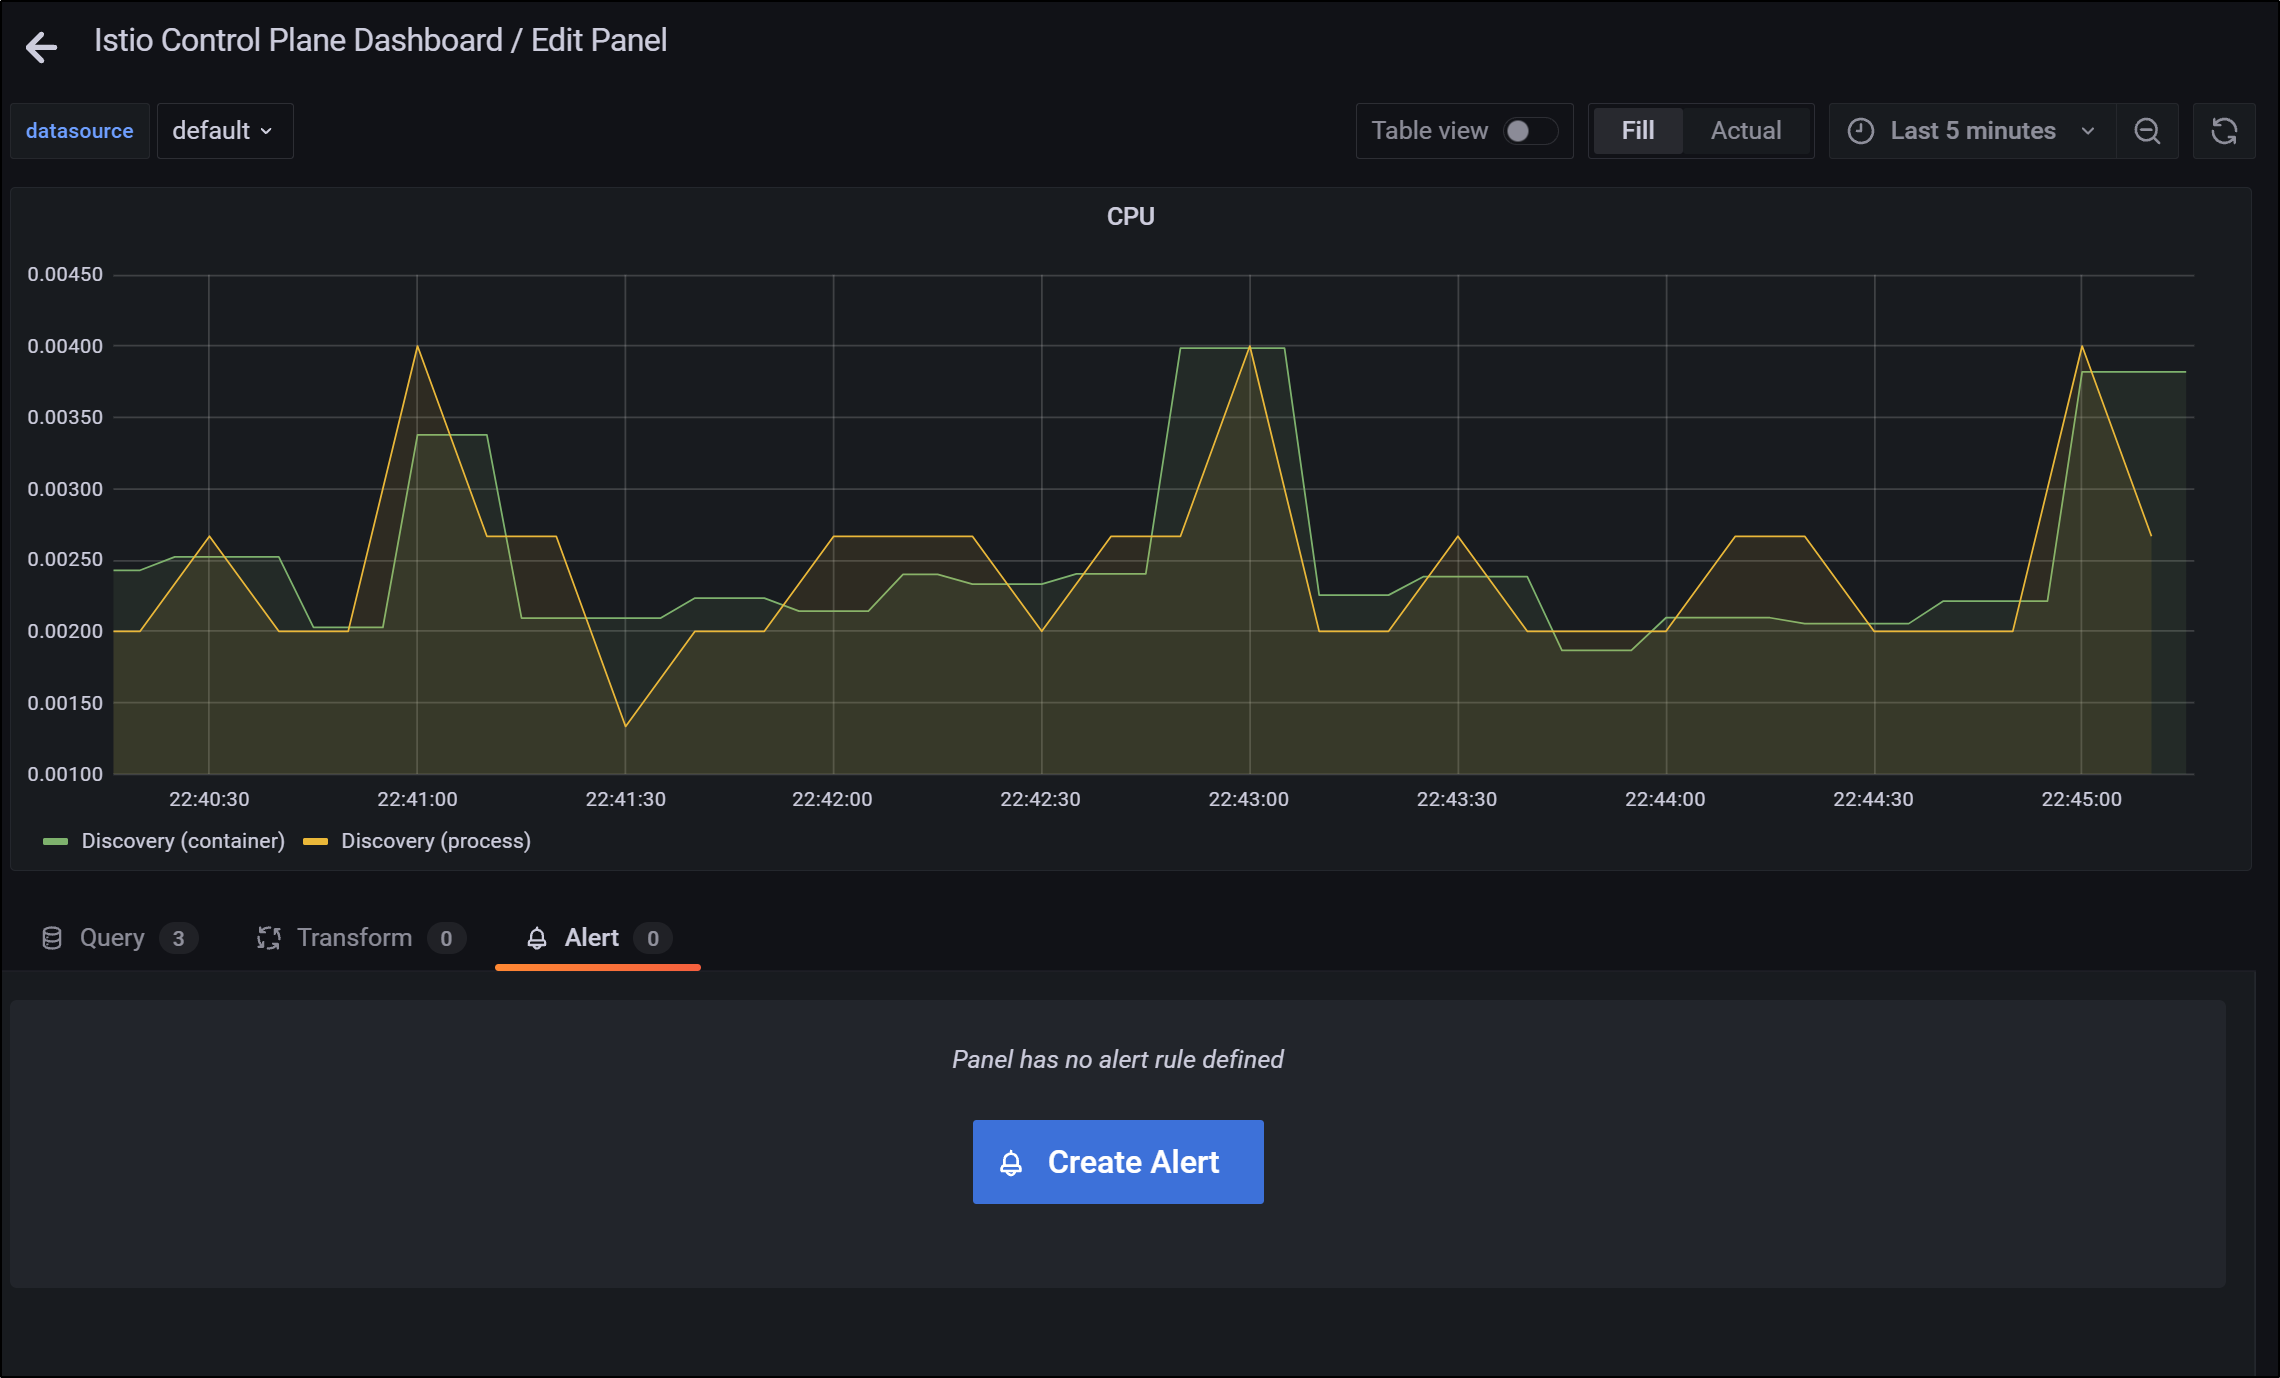
You can see a lot of data in the loaded Istio dashboard

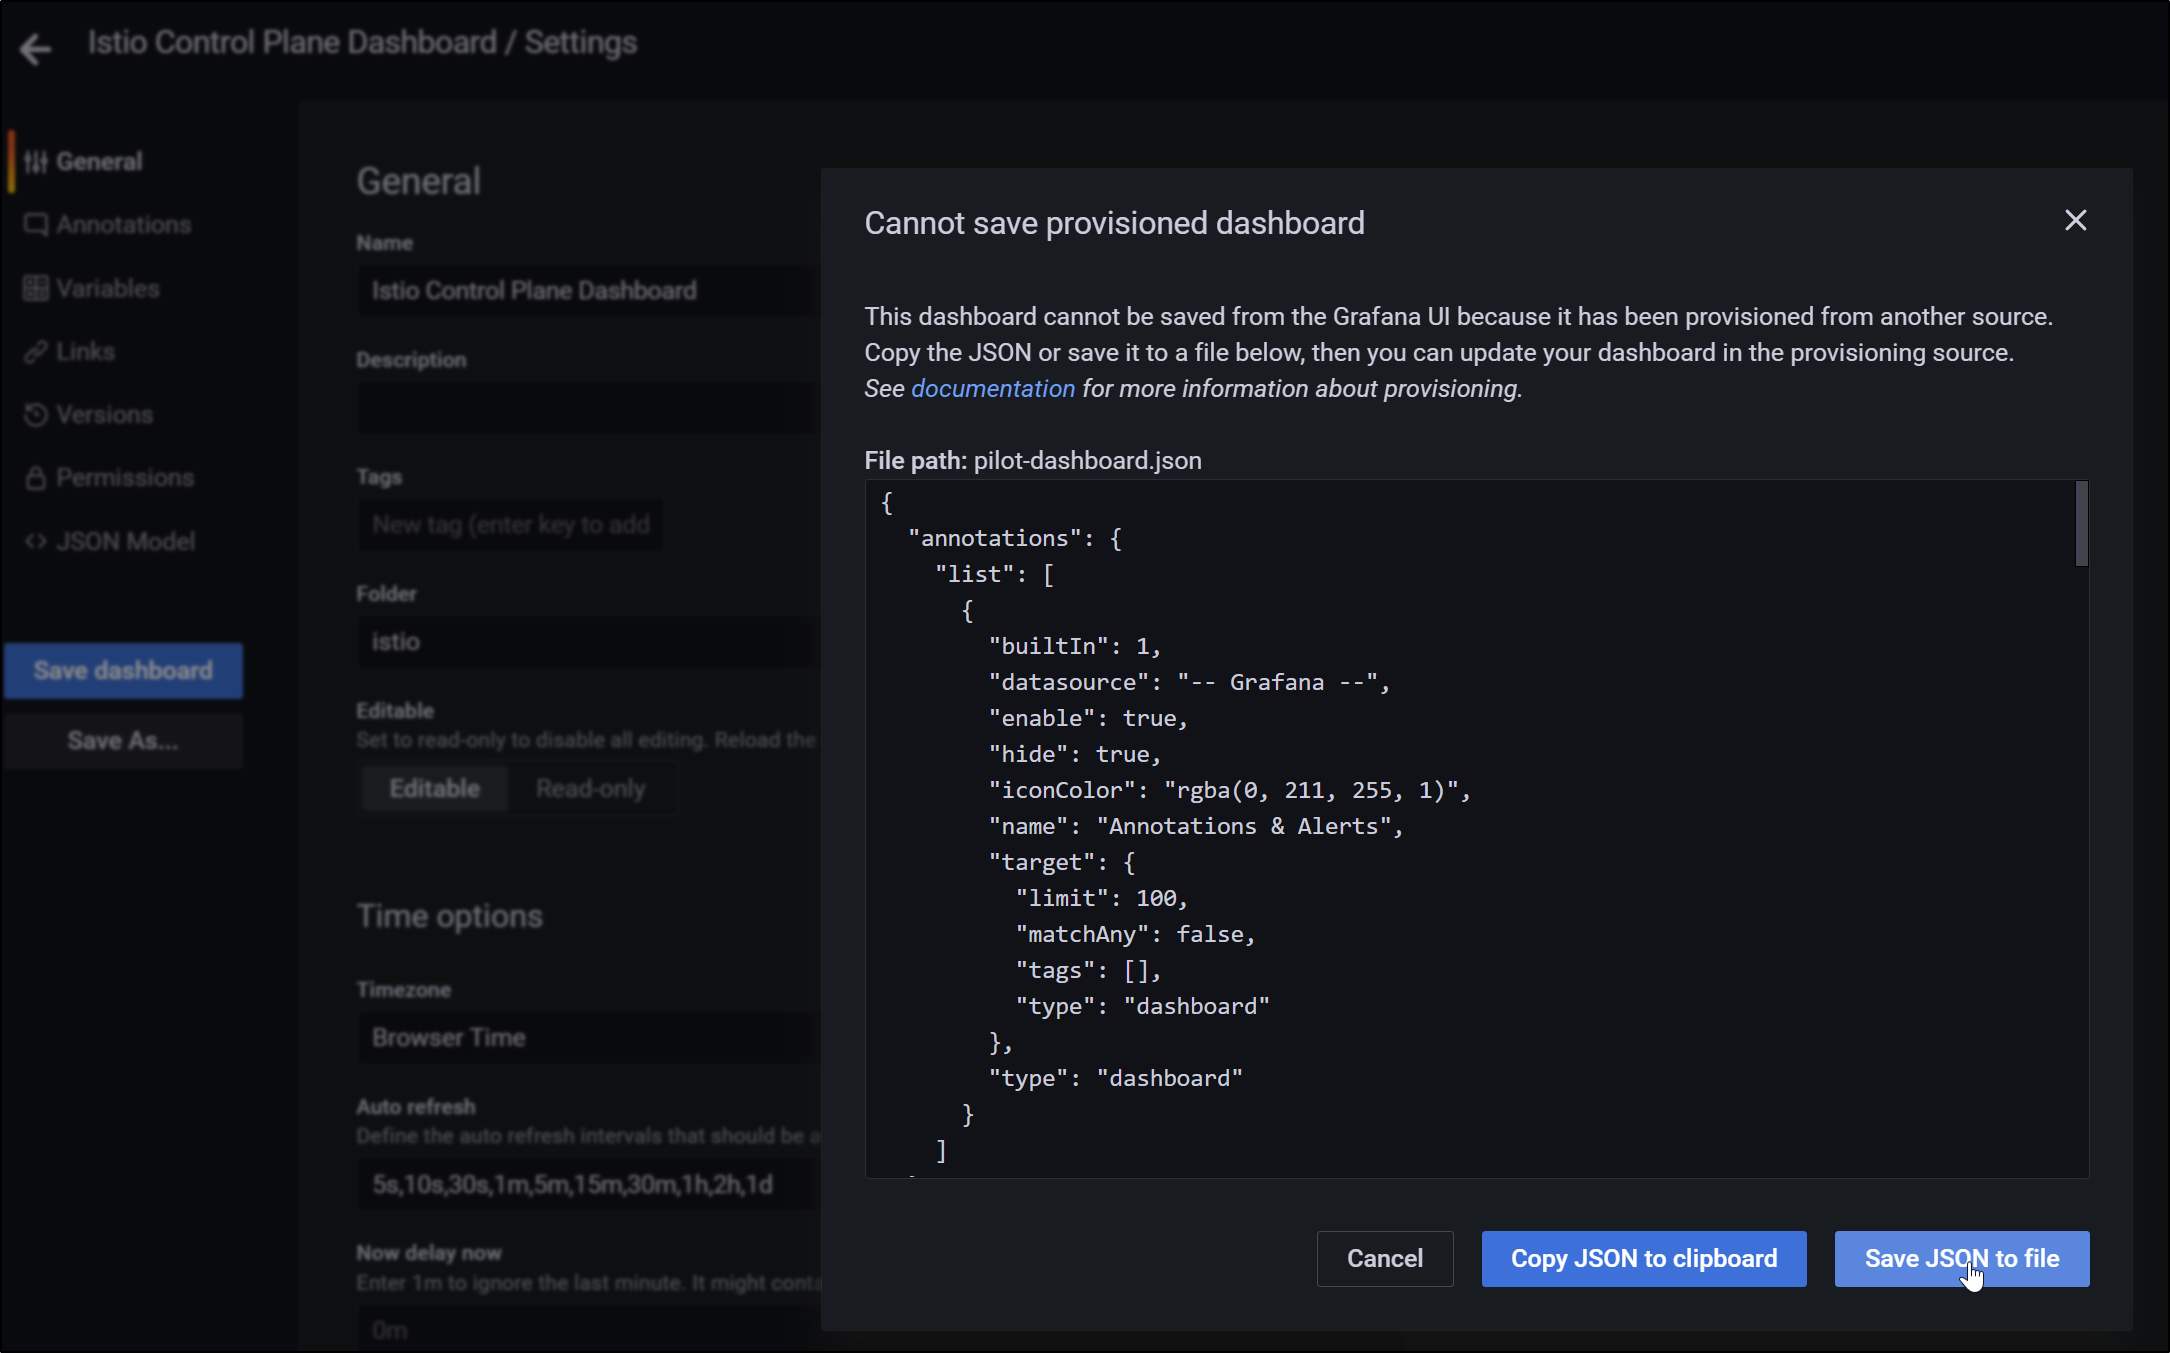
but if you want to create an alert, you’ll need to be able to edit it.
To do that, export the dashboard to JSON
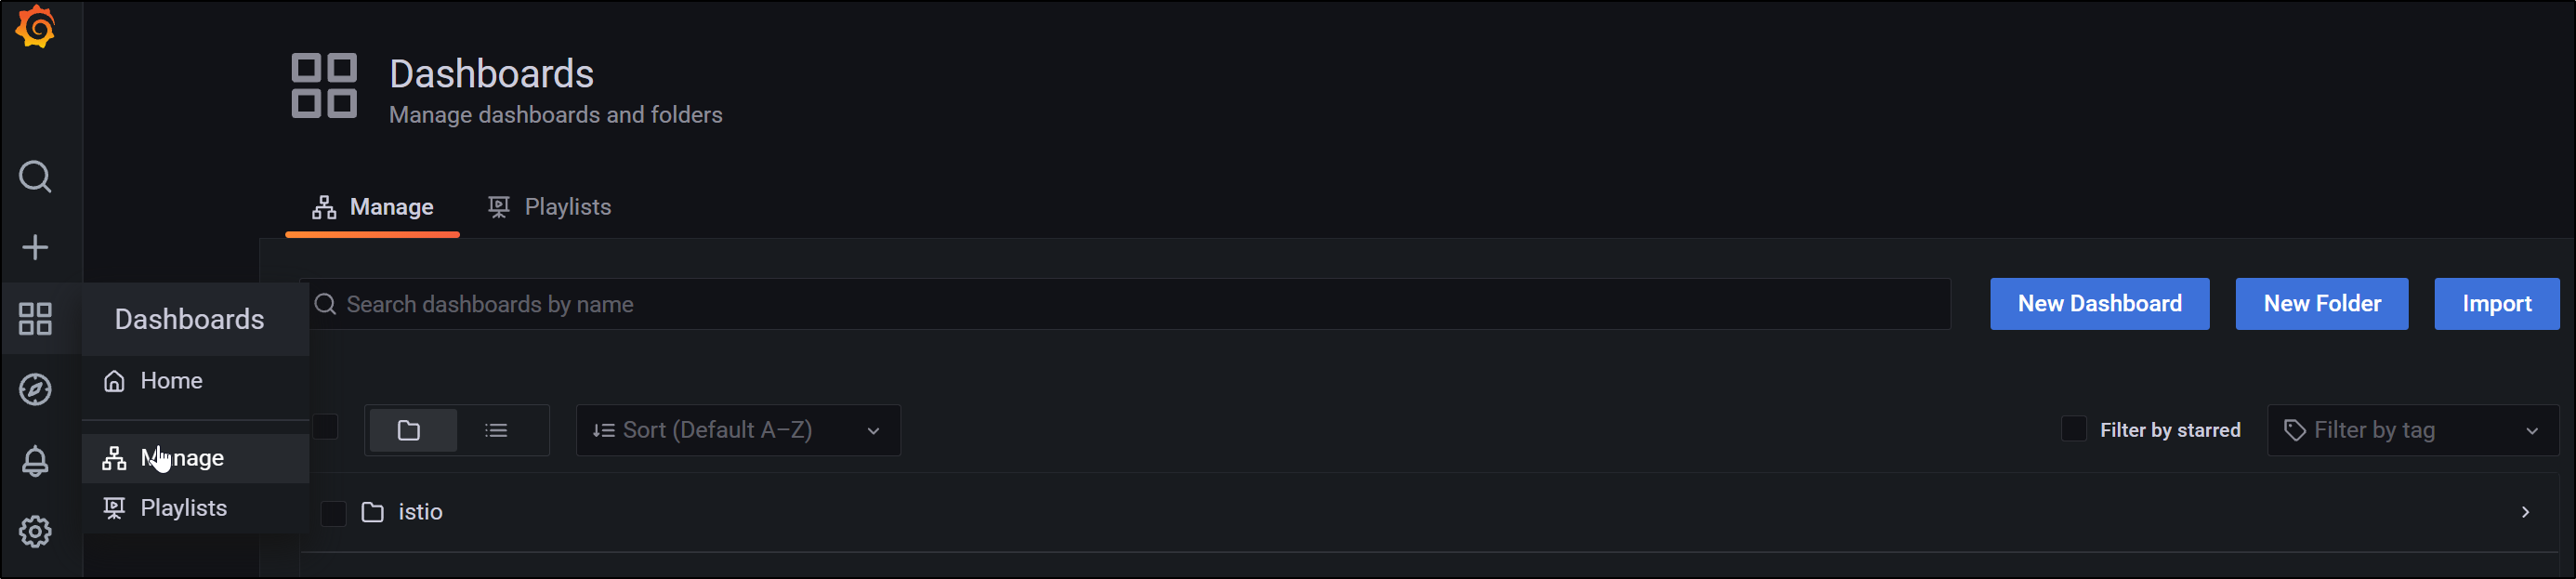
then under manage, you can import the dashboad you saved
Now on graphs, you can create an alert on the edit page
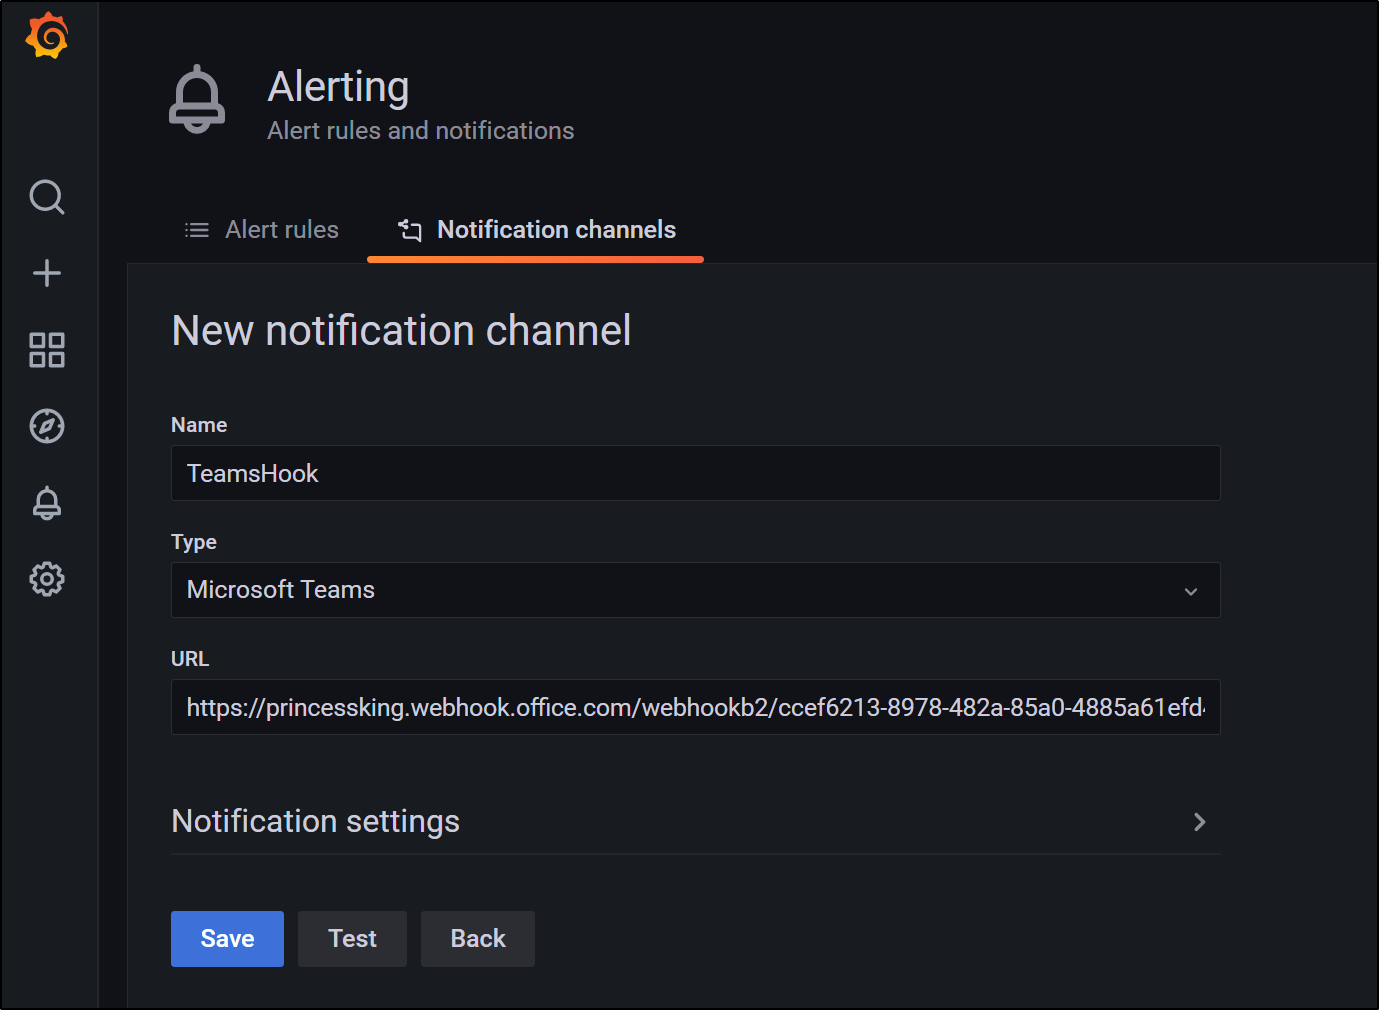
Notifications in Grafana
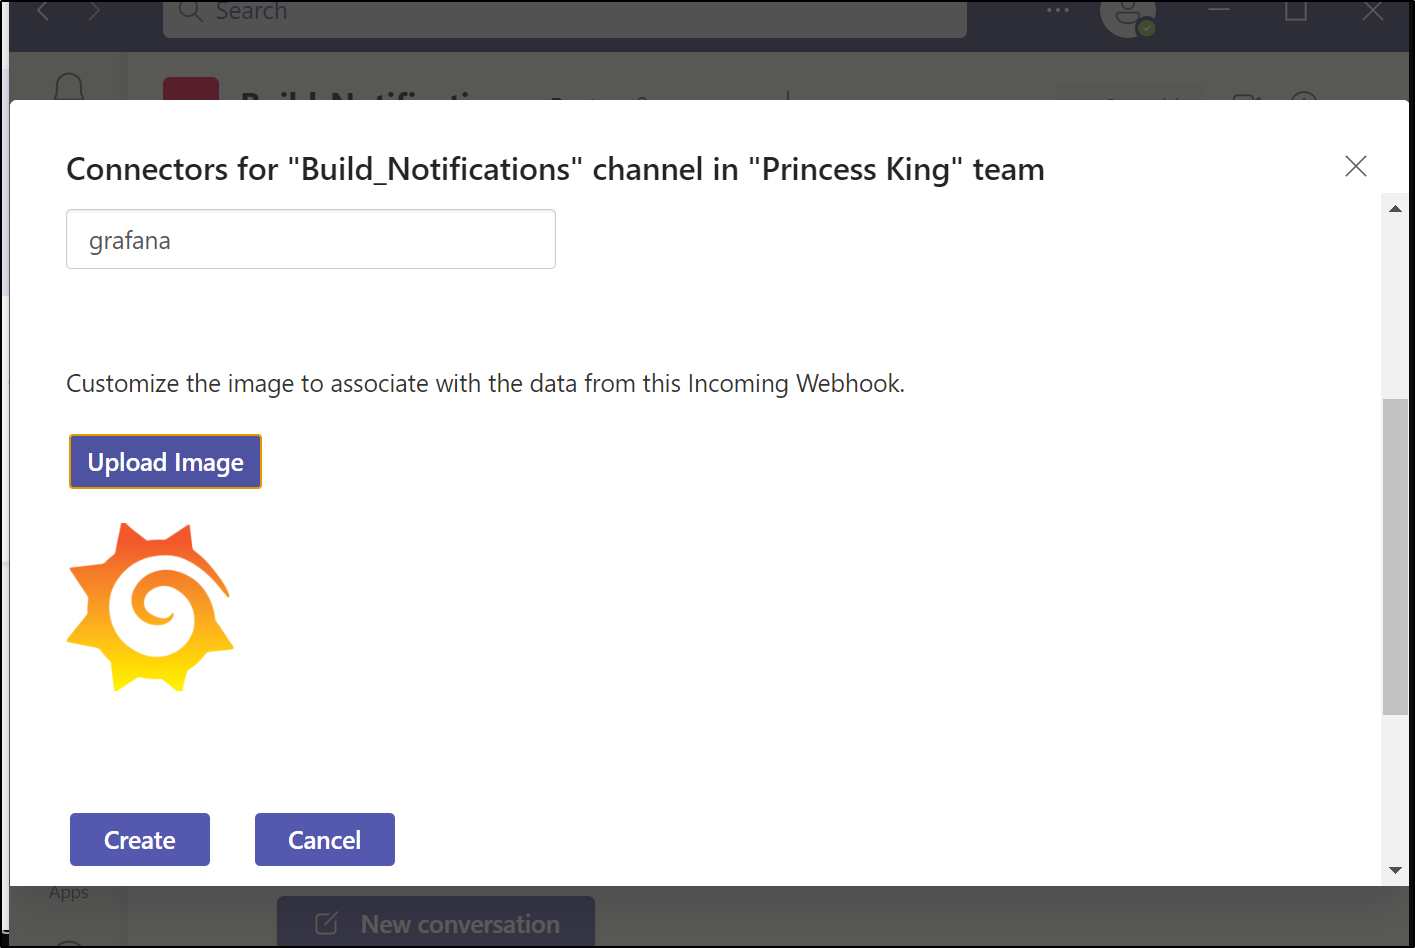
For notifications we can set up a Teams Webhook for Grafana.
This makes a webhook like: https://princessking.webhook.office.com/webhookb2/ccef6213-8978-482a-85a0-asdfsadf@92a2e5a9-a8ab-4d8c-91eb-8af9712c16d5/IncomingWebhook/756f528ff9f14364bdcadaasdfasdf/26a39c32-7dcf-48b5-b24c-asdfasdfasdf
We can use that webhook in a Notification channel
And we can see that alert as an example in Teams
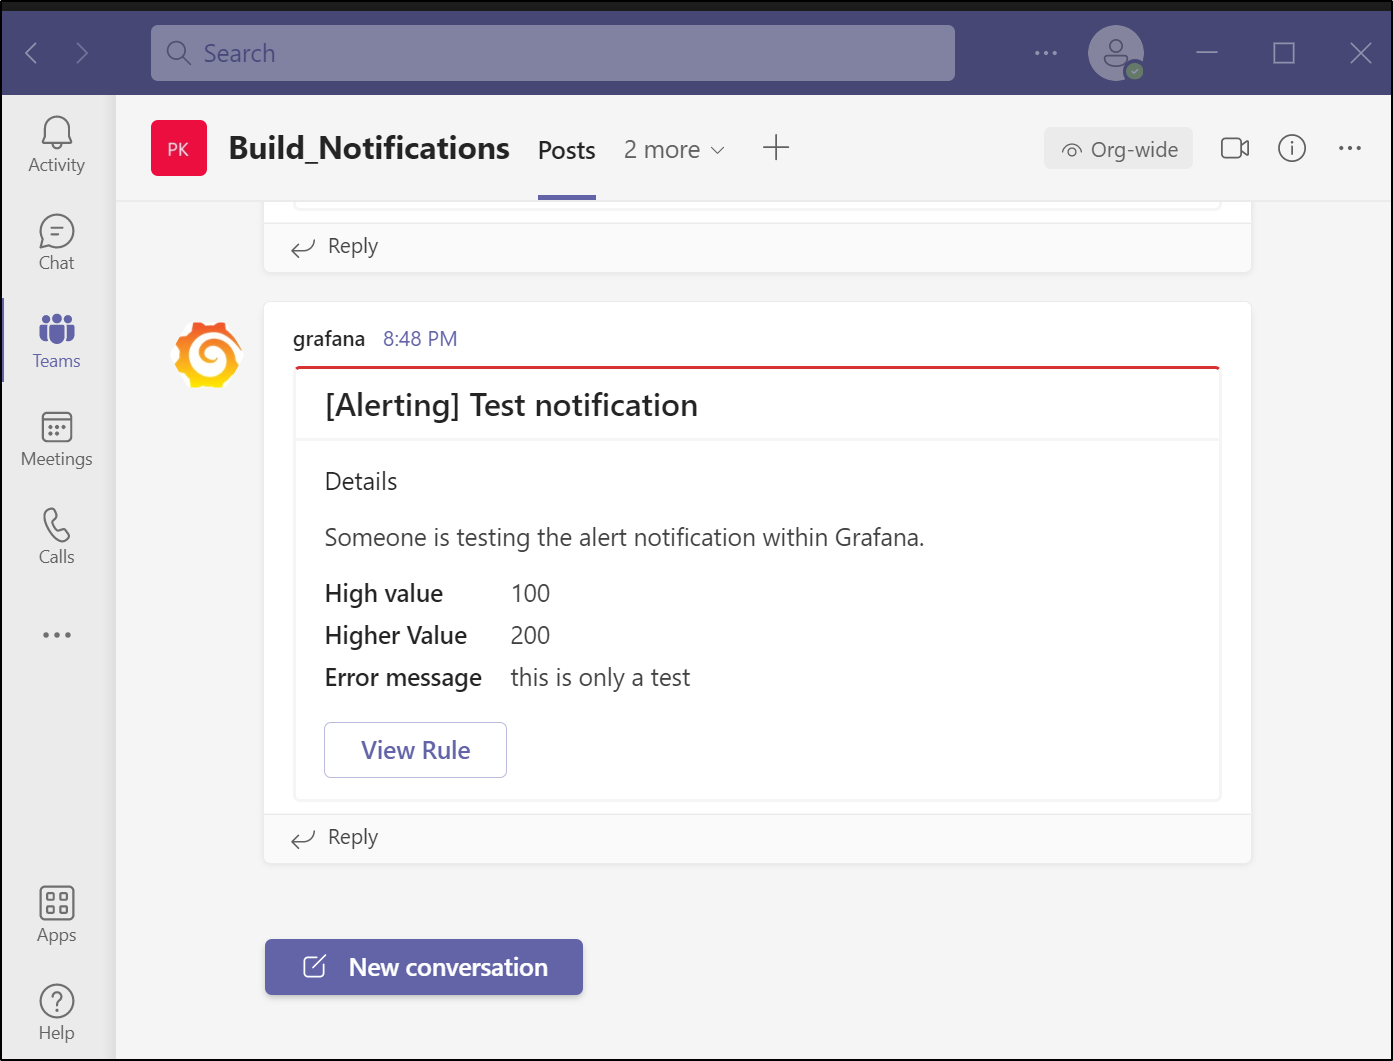
We can then use this in alerts.
Summary
We touched on Zipkin, the containerized basic tracing app and Grafana used for visualization and alerting. These are both solid open-source tools with many plugins. They are not as easy to setup as commercial offerings, in my opinion. The metrics provided by Prometheus are quite varied and I find it a struggle to find the exact metric I am trying to track.
Additionally, i find editing and saving Dashboards in Graphana a slow and arduous task. Sometimes they do not save and many times they do not expose a way for me to set an alert. Since graphs seem the only way to define alerts now, that makes it a challenge.
Moreover, we never bothered to touch on access rules or IdP. These systems assume if you can see it, you can edit it. I’m sure there are ways to secure the pods. It’s easy enough to add, at the very least, basic auth to an ingress.
Kiali continues to impress. Every time I load it up, it seems to be getting better and better.
But the point of these tools is not to show what an Enterprise might want to roll out for a large development organization. These are meant more for the developers at home, or the smaller shops and startups that want to start getting trace data now.
One can make a lot of headway in performance increases without needing to lay down a bunch of cash elsewhere. And commercial tooling like Lightstep and Datadog make it easy to take your instrumented code into a SaaS offering later.