Published: Sep 29, 2021 by Isaac Johnson
I became familiar with Coralogix after I mistakenly barked at a sales guy on the phone. Admittedly, I was a bit of a jerk; he called after a slew of spam calls had hit my phone and i answered ‘what the hell do you want!?”. I am not usually an unkind person on the phone and when we realized the confusion, i offered some of my time as a fair trade for snapping on a professional cold call.
We had some talks and then I dug into a demo to get a real handle on what Coralogix is (and what it is not).
In this post, I’ll be applying log monitoring to Windows and a Kubernetes stack suing their free 14d free trial.
Getting Started
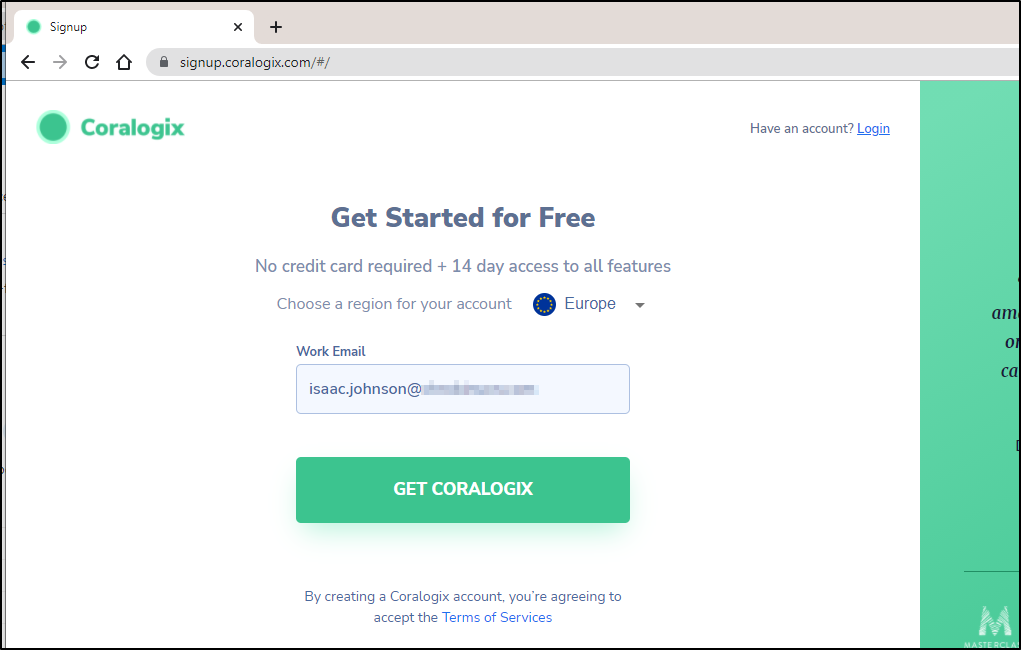
First we need to setup an account.
This sent a confirmation which i had to confirm.
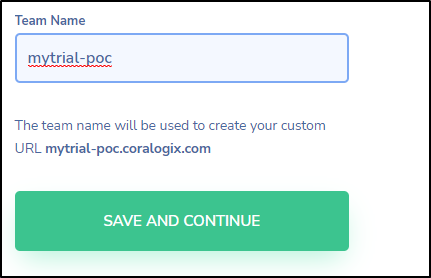
Upon signup I needed to setup a main site.
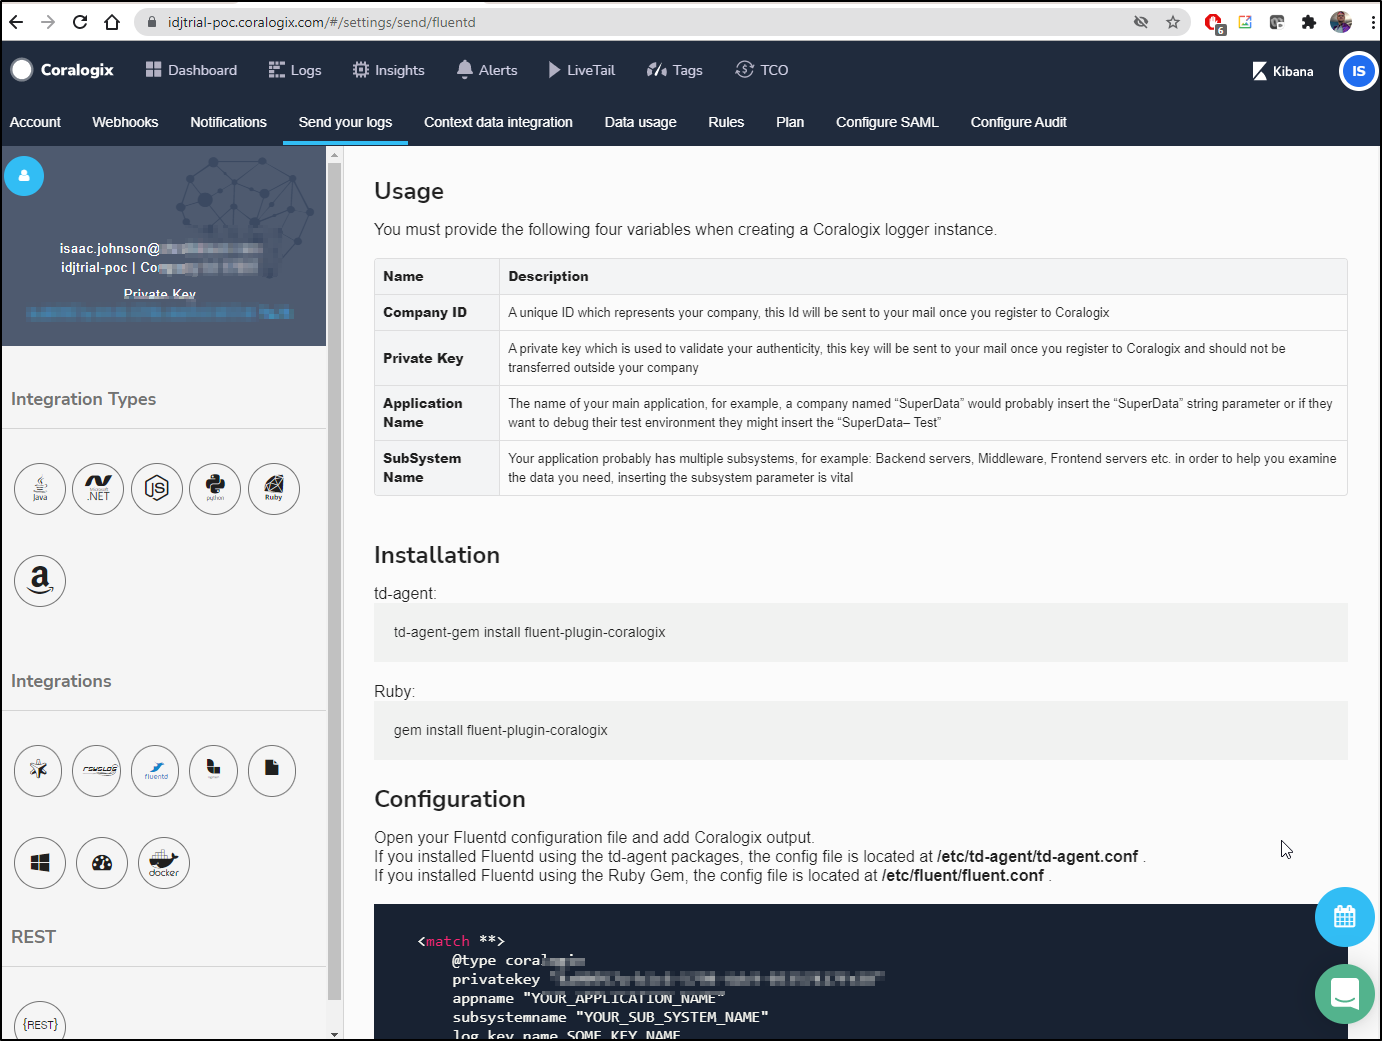
This brings us to a main page which (suprisingly) shows a private key in the upper left and in the code snippet.
Usage
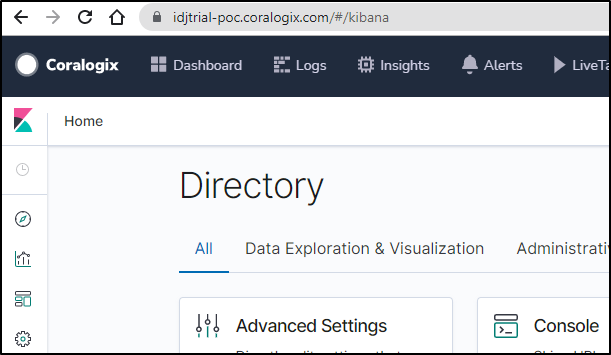
It really appears this is a managed Kibana.
Logging in from another host and choosing my userid shows a Kibana page.
Let’s setup Logstash on a windows host.
From the Elastic Downloads page we can download the windows binary.
Then extract the nearly 17k files/320Mb in the archive and verify you have java installed. Note: i had to pick a root folder because the number of nested files exceeded windows path limits.
PS C:\Users\isaac> Write-Host $env:JAVA_HOME
C:\Program Files\Microsoft\jdk-11.0.12.7-hotspot\
PS C:\Users\isaac> Java -version
openjdk version "11.0.12" 2021-07-20
OpenJDK Runtime Environment Microsoft-25199 (build 11.0.12+7)
OpenJDK 64-Bit Server VM Microsoft-25199 (build 11.0.12+7, mixed mode)
Fluent Bit on Windows
Let’s get Fluent Bit for windows from the downloads page.
This will install about 44Mb.
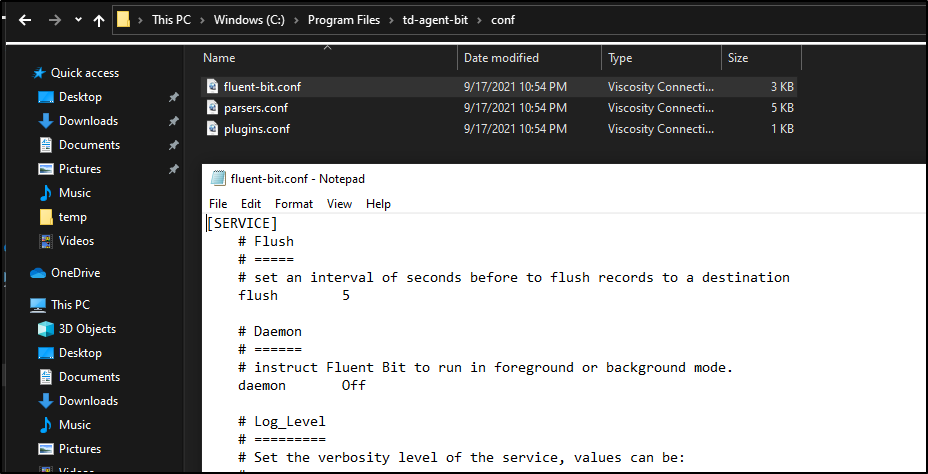
Before we launch, we will want to update the conf which is likely in Program Files if you left defaults.
We will update input and add an output:
[INPUT]
    name mem
    tag memory

    #name cpu
    #tag  cpu.local

    # Read interval (sec) Default: 1
    interval_sec 1


[OUTPUT]
    name  coralogix
    match *
    private_key 9e8f0db4-f5a2-4bf2-ab02-564a93a5a3fa
    company_id  17607
    app_name    idjpswin10app
    sub_name    idjpswin10sub
Next, we need to download the Coralogix shared object from GH to install into FluentBit:
https://github.com/coralogix/integrations-docs/raw/master/integrations/fluent-bit/plugin/out_coralogix.so
And copy that over to the plugins dir:
the conf/plugins.conf also needs updating:
[PLUGINS]
    path out_coralogix.so
We can test in Powershell that FluentB is installed correctly:
PS C:\Program Files\td-agent-bit\bin> .\fluent-bit.exe -i dummy -o stdout
Fluent Bit v1.8.7
* Copyright (C) 2019-2021 The Fluent Bit Authors
* Copyright (C) 2015-2018 Treasure Data
* Fluent Bit is a CNCF sub-project under the umbrella of Fluentd
* https://fluentbit.io

[2021/09/20 10:12:53] [ info] [engine] started (pid=23364)
[2021/09/20 10:12:53] [ info] [storage] version=1.1.1, initializing...
[2021/09/20 10:12:53] [ info] [storage] in-memory
[2021/09/20 10:12:53] [ info] [storage] normal synchronization mode, checksum disabled, max_chunks_up=128
[2021/09/20 10:12:53] [ info] [cmetrics] version=0.2.1
[2021/09/20 10:12:53] [ info] [sp] stream processor started
[0] dummy.0: [1632150774.484032600, {"message"=>"dummy"}]
[1] dummy.0: [1632150775.483960700, {"message"=>"dummy"}]
[2] dummy.0: [1632150776.497585200, {"message"=>"dummy"}]
[3] dummy.0: [1632150777.484153500, {"message"=>"dummy"}]
[0] dummy.0: [1632150778.481511700, {"message"=>"dummy"}]
[1] dummy.0: [1632150779.487567900, {"message"=>"dummy"}]
[2] dummy.0: [1632150780.477996900, {"message"=>"dummy"}]
[3] dummy.0: [1632150781.482103700, {"message"=>"dummy"}]
I tried many times, but it really appears this binary is not a valid windows binary:
PS C:\Program Files\td-agent-bit\bin> .\fluent-bit.exe -e /Progra~1/td-agent-bit/plugins/out_coralogix.so -c \Progra~1\td-agent-bit\conf\fluent-bit.conf
[proxy] error opening plugin /Progra~1/td-agent-bit/plugins/out_coralogix.so: '%1 is not a valid Win32 application.
'
[2021/09/20 10:28:35] [error] [plugin] error loading proxy plugin: /Progra~1/td-agent-bit/plugins/out_coralogix.so
PS C:\Program Files\td-agent-bit\bin> .\fluent-bit.exe -e /Progra~1/td-agent-bit/plugins/out_coralogix.so -c /Progra~1/td-agent-bit/conf/fluent-bit.conf
[proxy] error opening plugin /Progra~1/td-agent-bit/plugins/out_coralogix.so: '%1 is not a valid Win32 application.
'
[2021/09/20 10:29:58] [error] [plugin] error loading proxy plugin: /Progra~1/td-agent-bit/plugins/out_coralogix.so
PS C:\Program Files\td-agent-bit\bin>
Winlogbeat
We can download the binary from the downloads page
i’ll start with the sample winlogbeats.yaml and edit.
First, I added a block about the Easticsearch template section for fields under root:
fields_under_root: true
fields:
  PRIVATE_KEY: "9e8f0db4-f5a2-4bf2-ab02-564a93a5a3fa"
  COMPANY_ID: 17607
  APP_NAME: "idjpswin10app"
  SUB_SYSTEM: "windows_events"

# ====================== Elasticsearch template settings =======================
Then, down in the Logstash area, i put in the settings for Coralogix
# ------------------------------ Logstash Output -------------------------------
output.logstash:
  enabled: true

  # The Logstash hosts
  hosts: ["logstashserver.coralogix.com:5015"]

  # Optional SSL. By default is off.
  # List of root certificates for HTTPS server verifications
  ssl.certificate_authorities: ["C:\\ca.crt"]
  tls.certificate_authorities: ["C:\\ca.crt"]
By default it is setup to use elastic, so comment that output path out:
# ---------------------------- Elasticsearch Output ----------------------------
#output.elasticsearch:
  # Array of hosts to connect to.
  #hosts: ["localhost:9200"]
I downloaded the ca.crt to my root drive (which was found in their winlogbeat instructions).
We can test in a powershell prompt:
PS C:\Program Files\Elastic\Beats\7.14.1\winlogbeat> .\winlogbeat.exe test config -c /ProgramData/Elastic/Beats/winlogbeat/winlogbeat.yml -e
Exiting: error unpacking config data: more than one namespace configured accessing 'output' (source:'\ProgramData\Elastic\Beats\winlogbeat\winlogbeat.yml')
PS C:\Program Files\Elastic\Beats\7.14.1\winlogbeat> .\winlogbeat.exe test config -c /ProgramData/Elastic/Beats/winlogbeat/winlogbeat.yml -e
2021-09-20T10:48:59.696-0500    INFO    instance/beat.go:665    Home path: [C:\Program Files\Elastic\Beats\7.14.1\winlogbeat] Config path: [C:\Program Files\Elastic\Beats\7.14.1\winlogbeat] Data path: [C:\Program Files\Elastic\Beats\7.14.1\winlogbeat\data] Logs path: [C:\Program Files\Elastic\Beats\7.14.1\winlogbeat\logs]
2021-09-20T10:48:59.700-0500    INFO    instance/beat.go:673    Beat ID: 92023f77-64a6-41e5-b9d7-3c46b5b96b61
2021-09-20T10:48:59.728-0500    INFO    [beat]  instance/beat.go:1014   Beat info       {"system_info": {"beat": {"path": {"config": "C:\\Program Files\\Elastic\\Beats\\7.14.1\\winlogbeat", "data": "C:\\Program Files\\Elastic\\Beats\\7.14.1\\winlogbeat\\data", "home": "C:\\Program Files\\Elastic\\Beats\\7.14.1\\winlogbeat", "logs": "C:\\Program Files\\Elastic\\Beats\\7.14.1\\winlogbeat\\logs"}, "type": "winlogbeat", "uuid": "92023f77-64a6-41e5-b9d7-3c46b5b96b61"}}}
2021-09-20T10:48:59.728-0500    INFO    [beat]  instance/beat.go:1023   Build info      {"system_info": {"build": {"commit": "703d589a09cfdbfd7f84c1d990b50b6b7f62ac29", "libbeat": "7.14.1", "time": "2021-08-26T09:33:17.000Z", "version": "7.14.1"}}}
2021-09-20T10:48:59.729-0500    INFO    [beat]  instance/beat.go:1026   Go runtime info {"system_info": {"go": {"os":"windows","arch":"amd64","max_procs":16,"version":"go1.16.6"}}}
2021-09-20T10:48:59.729-0500    INFO    [add_cloud_metadata]    add_cloud_metadata/add_cloud_metadata.go:101    add_cloud_metadata: hosting provider type not detected.
2021-09-20T10:48:59.743-0500    INFO    [beat]  instance/beat.go:1030   Host info       {"system_info": {"host": {"architecture":"x86_64","boot_time":"2021-09-14T20:58:20.3-05:00","name":"DESKTOP-QADGF36","ip":["fe80::1984:d0b8:eb51:5461/64","192.168.1.160/24","fe80::28e4:6262:e7d6:c458/64","169.254.196.88/16","fe80::dcb0:555b:a8fa:d12/64","169.254.13.18/16","fe80::1dca:4819:c9ff:915d/64","169.254.145.93/16","fe80::d9bc:867e:a956:cbaa/64","169.254.203.170/16","::1/128","127.0.0.1/8","fe80::54d1:4283:3ddd:de7b/64","172.21.240.1/20"],"kernel_version":"10.0.19041.1237 (WinBuild.160101.0800)","mac":["a8:a1:59:6b:67:5d","20:4e:f6:66:eb:55","20:4e:f6:66:eb:55","a2:4e:f6:66:eb:55","20:4e:f6:66:eb:54","00:15:5d:bc:fd:d2"],"os":{"type":"windows","family":"windows","platform":"windows","name":"Windows 10 Pro","version":"10.0","major":10,"minor":0,"patch":0,"build":"19043.1237"},"timezone":"CDT","timezone_offset_sec":-18000,"id":"7c44af33-625c-4085-b1d4-cbe0ef1da160"}}}
2021-09-20T10:48:59.744-0500    INFO    [beat]  instance/beat.go:1059   Process info    {"system_info": {"process": {"cwd": "C:\\Program Files\\Elastic\\Beats\\7.14.1\\winlogbeat", "exe": "C:\\Program Files\\Elastic\\Beats\\7.14.1\\winlogbeat\\winlogbeat.exe", "name": "winlogbeat.exe", "pid": 5712, "ppid": 8276, "start_time": "2021-09-20T10:48:59.625-0500"}}}
2021-09-20T10:48:59.744-0500    INFO    instance/beat.go:309    Setup Beat: winlogbeat; Version: 7.14.1
2021-09-20T10:48:59.745-0500    WARN    [cfgwarn]       tlscommon/config.go:100 DEPRECATED: Treating the CommonName field on X.509 certificates as a host name when no Subject Alternative Names are present is going to be removed. Please update your certificates if needed. Will be removed in version: 8.0.0
2021-09-20T10:48:59.746-0500    INFO    [publisher]     pipeline/module.go:113  Beat name: DESKTOP-QADGF36
2021-09-20T10:48:59.747-0500    INFO    [winlogbeat]    beater/winlogbeat.go:66 State will be read from and persisted to C:\Program Files\Elastic\Beats\7.14.1\winlogbeat\data\.winlogbeat.yml
2021-09-20T10:48:59.786-0500    WARN    [cfgwarn]       registered_domain/registered_domain.go:61       BETA: The registered_domain processor is beta.
2021-09-20T10:48:59.817-0500    WARN    [cfgwarn]       registered_domain/registered_domain.go:61       BETA: The registered_domain processor is beta.
Config OK
Then start the service:
PS C:\Program Files\Elastic\Beats\7.14.1\winlogbeat> Start-Service winlogbeat
We can see the service has started:
From the path we can see that invokes:
C:\Program Files\Elastic\Beats\7.14.1\winlogbeat\winlogbeat.exe" --path.home "C:\Program Files\Elastic\Beats\7.14.1\winlogbeat" --path.config "C:\ProgramData\Elastic\Beats\winlogbeat" --path.data "C:\ProgramData\Elastic\Beats\winlogbeat\data" --path.logs "C:\ProgramData\Elastic\Beats\winlogbeat\logs" -E logging.files.redirect_stderr=true
Verification
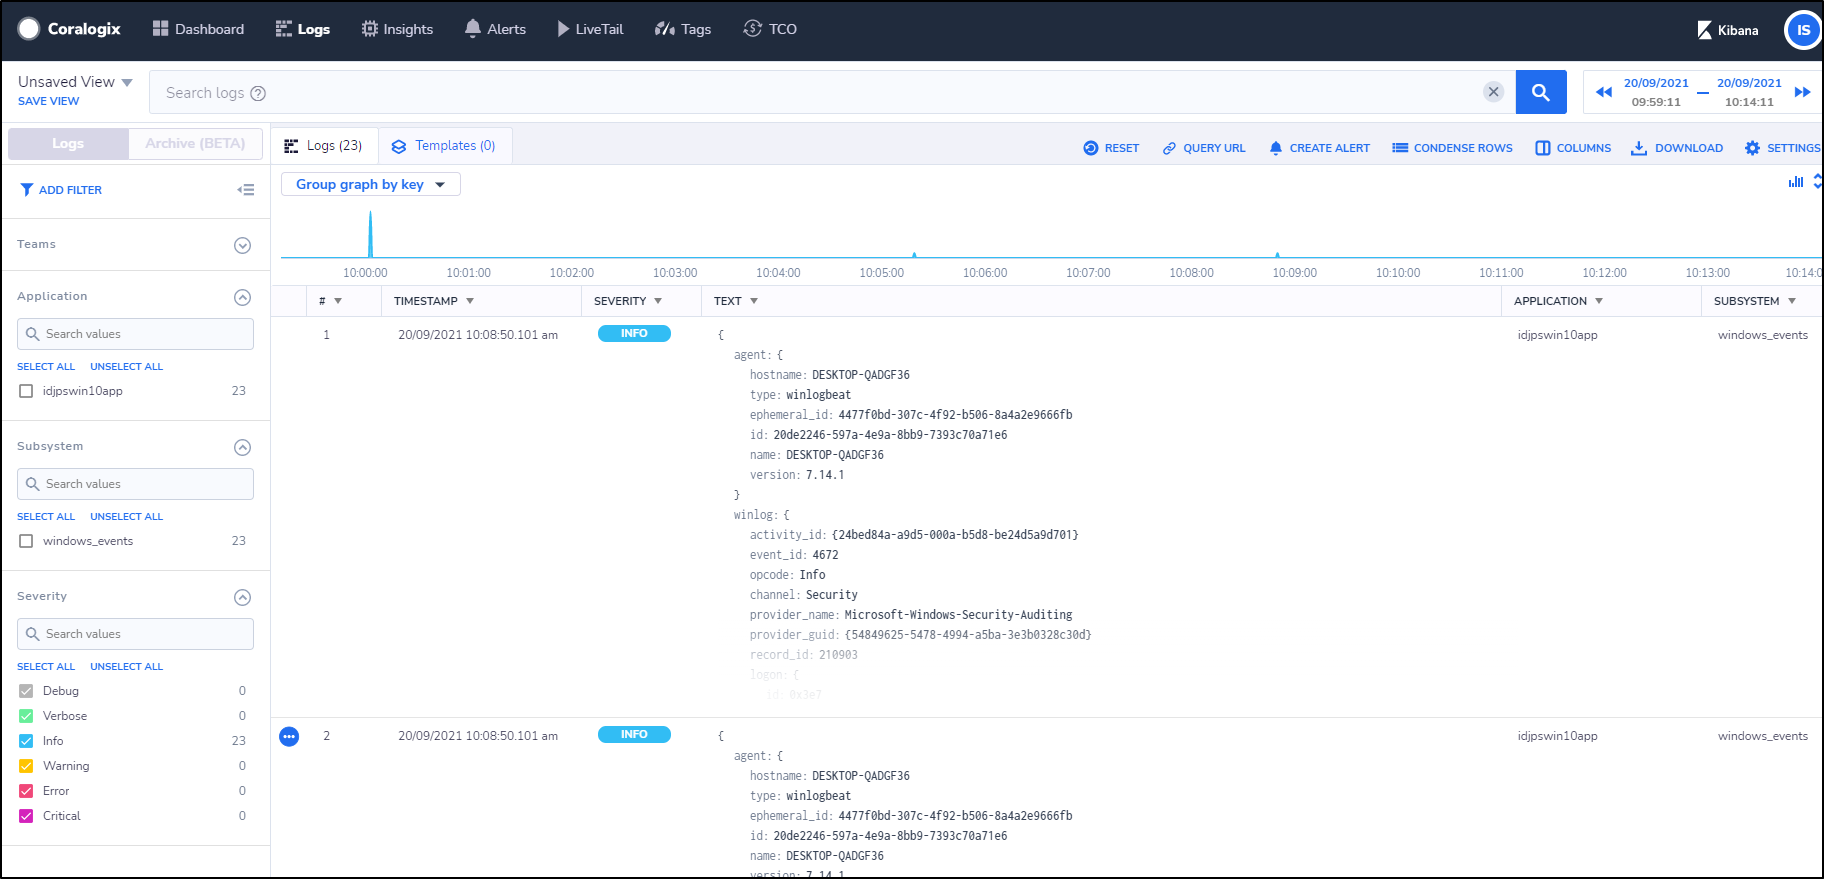
we can see our Kibana now shows logs coming from the Windows Host:
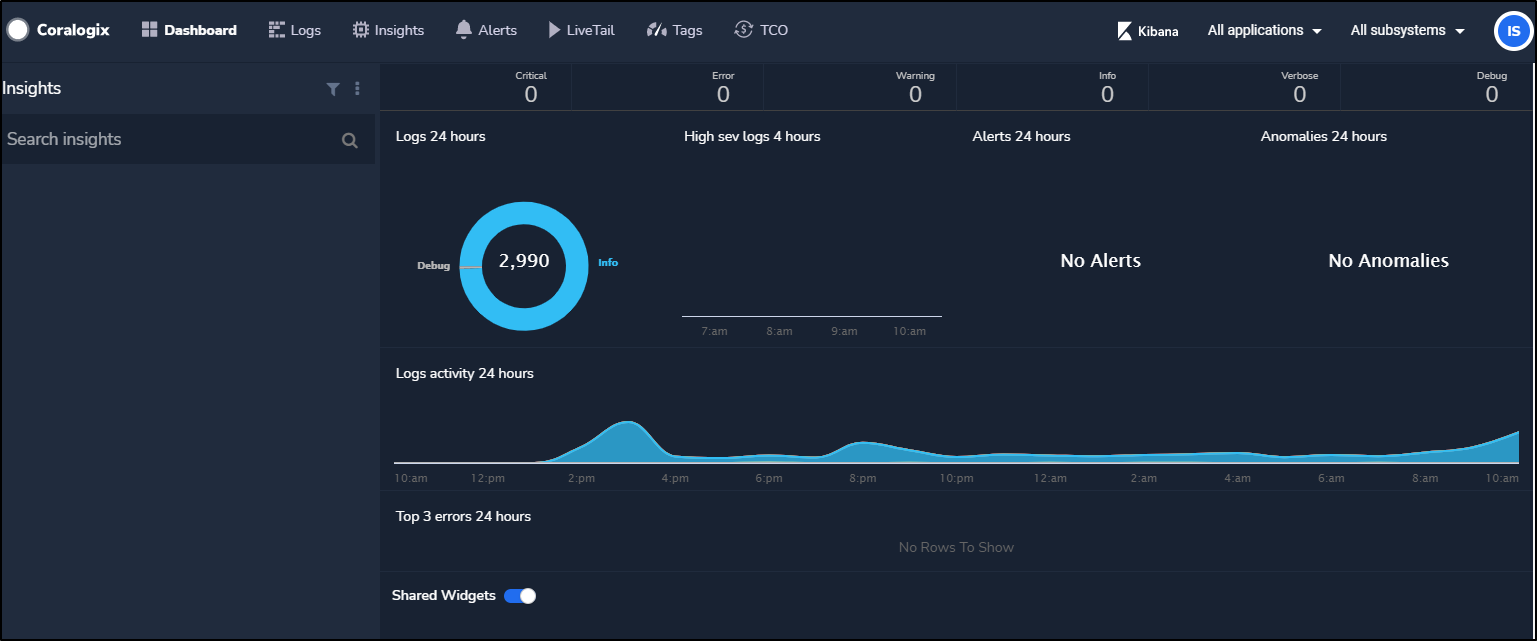
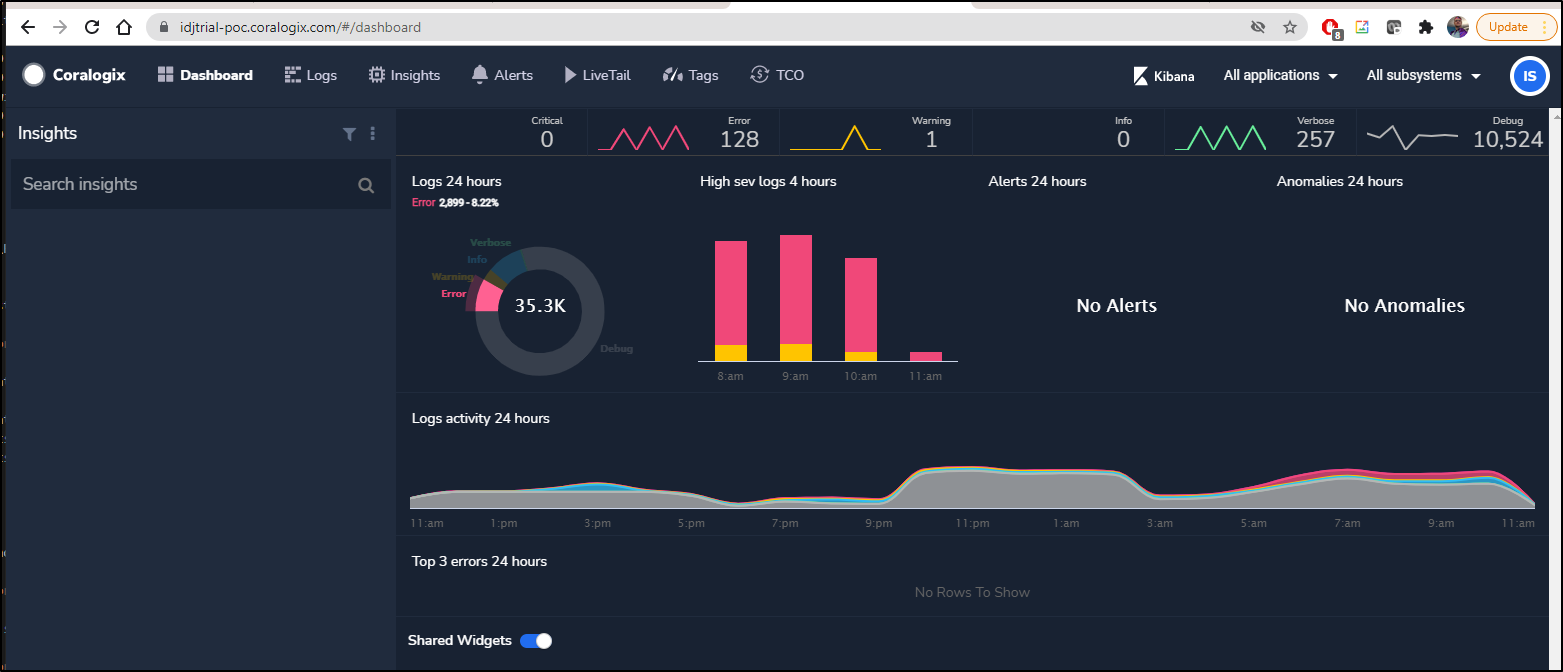
And in the Dashboard we can see that logs are produced:
Kubernetes Logs
We’ll be following their YAML deployment of FluentD from here
Create the secret with our private key
$ kubectl -n kube-system create secret generic fluentd-coralogix-account-secrets --from-literal=PRIVATE_KEY=9e8f0db4-f5a2-4bf2-ab02-564a93a5a3fa --from-literal=APP_NAME=fluentd-coralogix-image --from-literal=SUB_SYSTEM=fluentd
secret/fluentd-coralogix-account-secrets created
Now install the RBAC roles, confligmaps, daemonsets and service:
builder@DESKTOP-QADGF36:~$ kubectl create -f https://raw.githubusercontent.com/coralogix/fluentd-coralogix-image/master/examples/kubernetes/fluentd-coralogix-rbac.yaml
serviceaccount/fluentd-coralogix-service-account created
clusterrole.rbac.authorization.k8s.io/fluentd-coralogix-service-account-role created
clusterrolebinding.rbac.authorization.k8s.io/fluentd-coralogix-service-account created
builder@DESKTOP-QADGF36:~$ kubectl create -f https://raw.githubusercontent.com/coralogix/fluentd-coralogix-image/master/examples/kubernetes/fluentd-coralogix-cm.yaml
configmap/fluentd-coralogix-configs created
builder@DESKTOP-QADGF36:~$ kubectl create -f https://raw.githubusercontent.com/coralogix/fluentd-coralogix-image/master/examples/kubernetes/fluentd-coralogix-ds.yaml
daemonset.apps/fluentd-coralogix-daemonset created
builder@DESKTOP-QADGF36:~$ kubectl create -f https://raw.githubusercontent.com/coralogix/fluentd-coralogix-image/master/examples/kubernetes/fluentd-coralogix-svc.yaml
service/fluentd-coralogix-service created
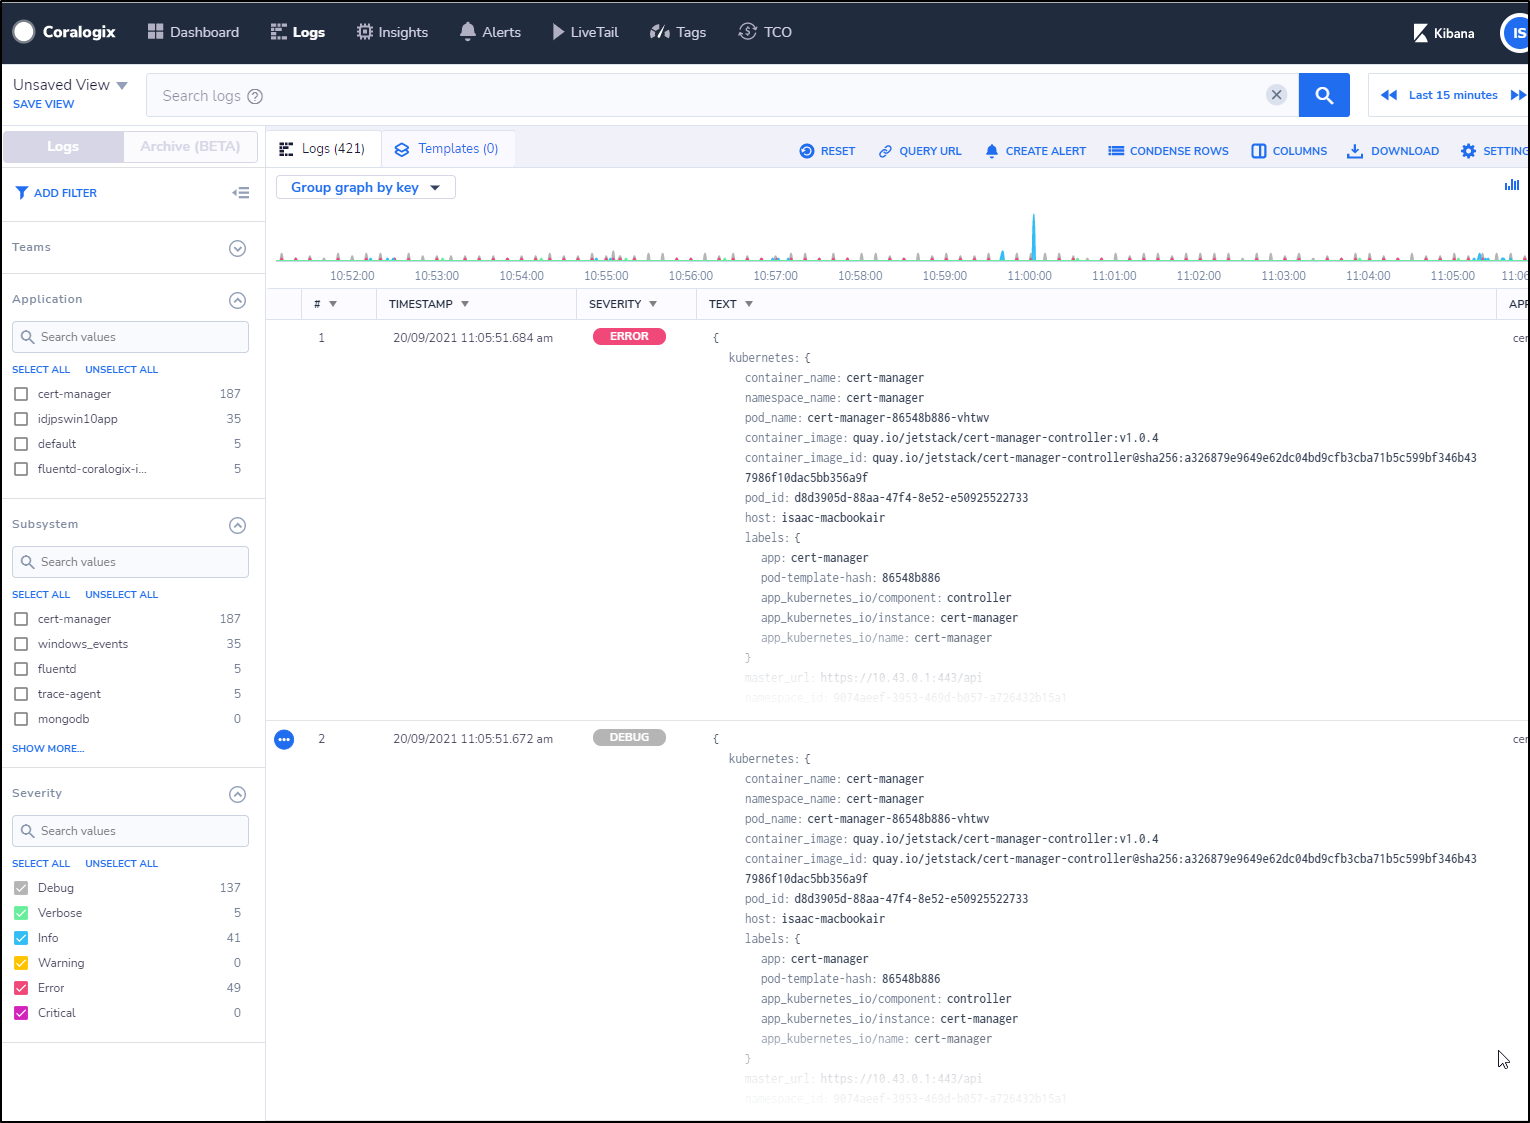
We can now see our logs getting pushed into Coralogix
We can now see a lot of new notifications are showing up in the dashboard:
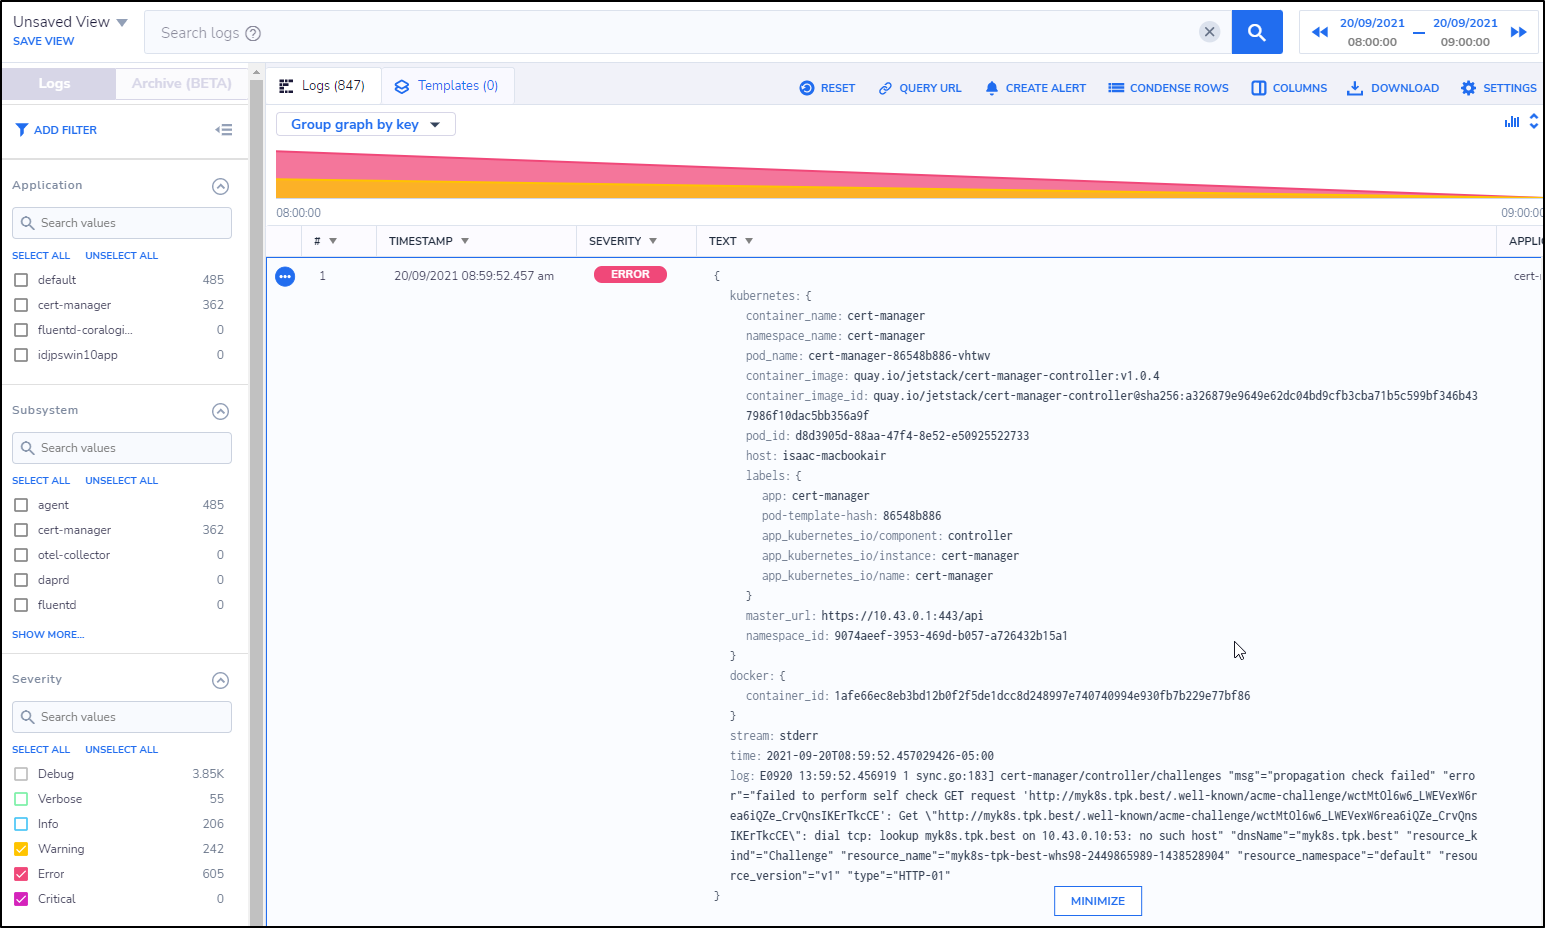
We can click errors and expand the log entry. For instance, the top error i see:
This is clearly because the cert-manager is trying to renew a cert on a domain i let expire.
log:E0920 13:59:52.456919 1 sync.go:183] cert-manager/controller/challenges "msg"="propagation check failed" "error"="failed to perform self check GET request 'http://myk8s.tpk.best/.well-known/acme-challenge/wctMtOl6w6_LWEVexW6rea6iQZe_CrvQnsIKErTkcCE': Get \"http://myk8s.tpk.best/.well-known/acme-challenge/wctMtOl6w6_LWEVexW6rea6iQZe_CrvQnsIKErTkcCE\": dial tcp: lookup myk8s.tpk.best on 10.43.0.10:53: no such host" "dnsName"="myk8s.tpk.best" "resource_kind"="Challenge" "resource_name"="myk8s-tpk-best-whs98-2449865989-1438528904" "resource_namespace"="default" "resource_version"="v1" "type"="HTTP-01"
Alerts
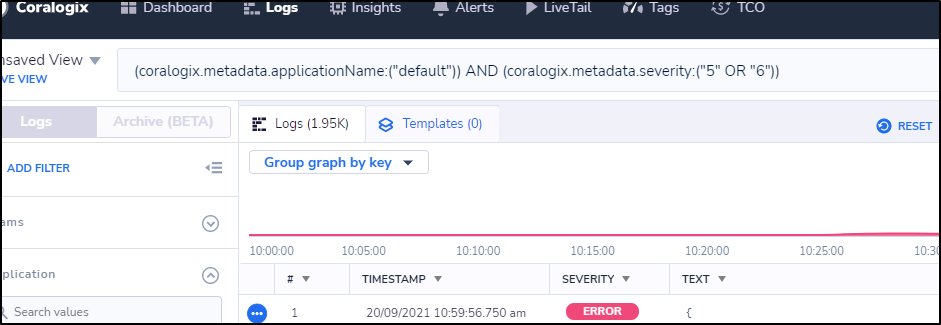
My first thought was to use Alerts in the Kibana window on a query, but that is nulled out.
However, we can copy and paste the query URL to get the Query itself to show up in the window:
e.g.
(coralogix.metadata.applicationName:("default")) AND (coralogix.metadata.severity:("5" OR "6"))
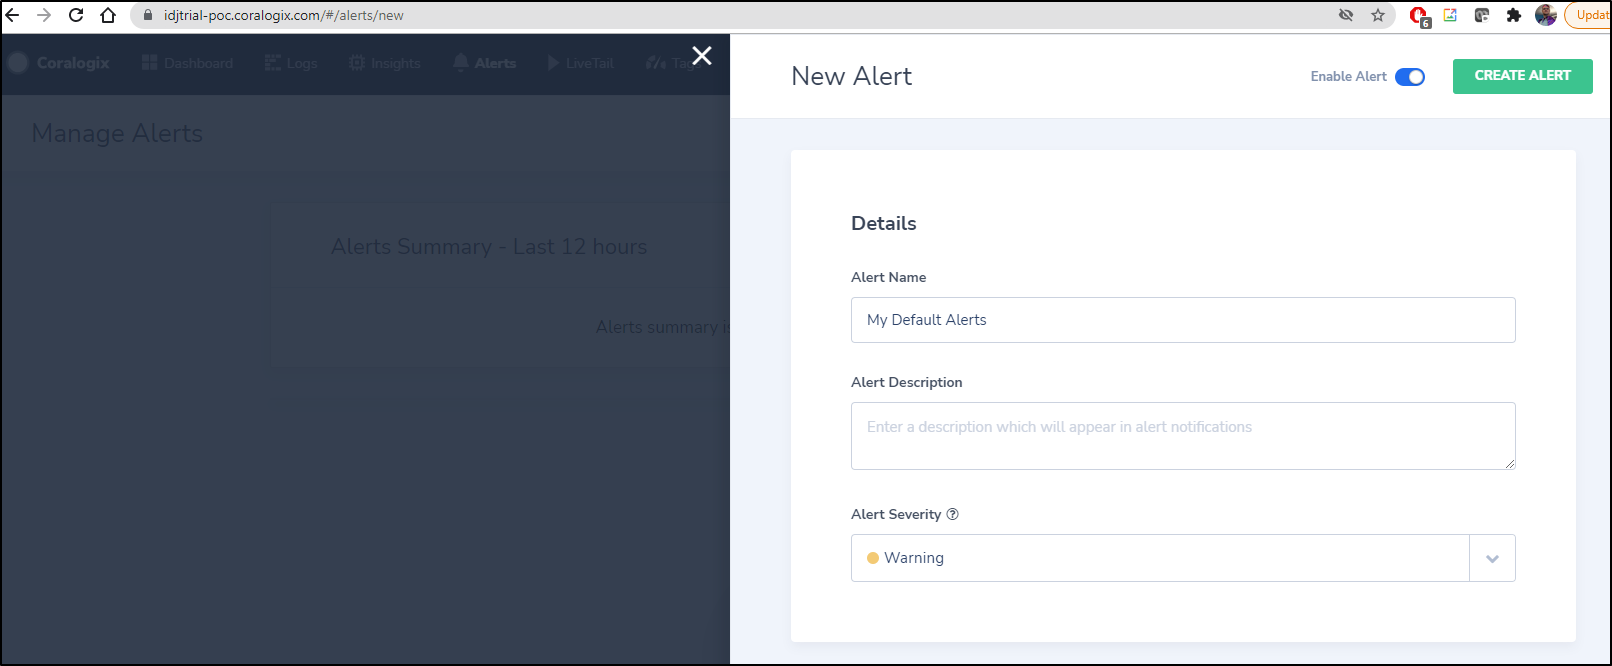
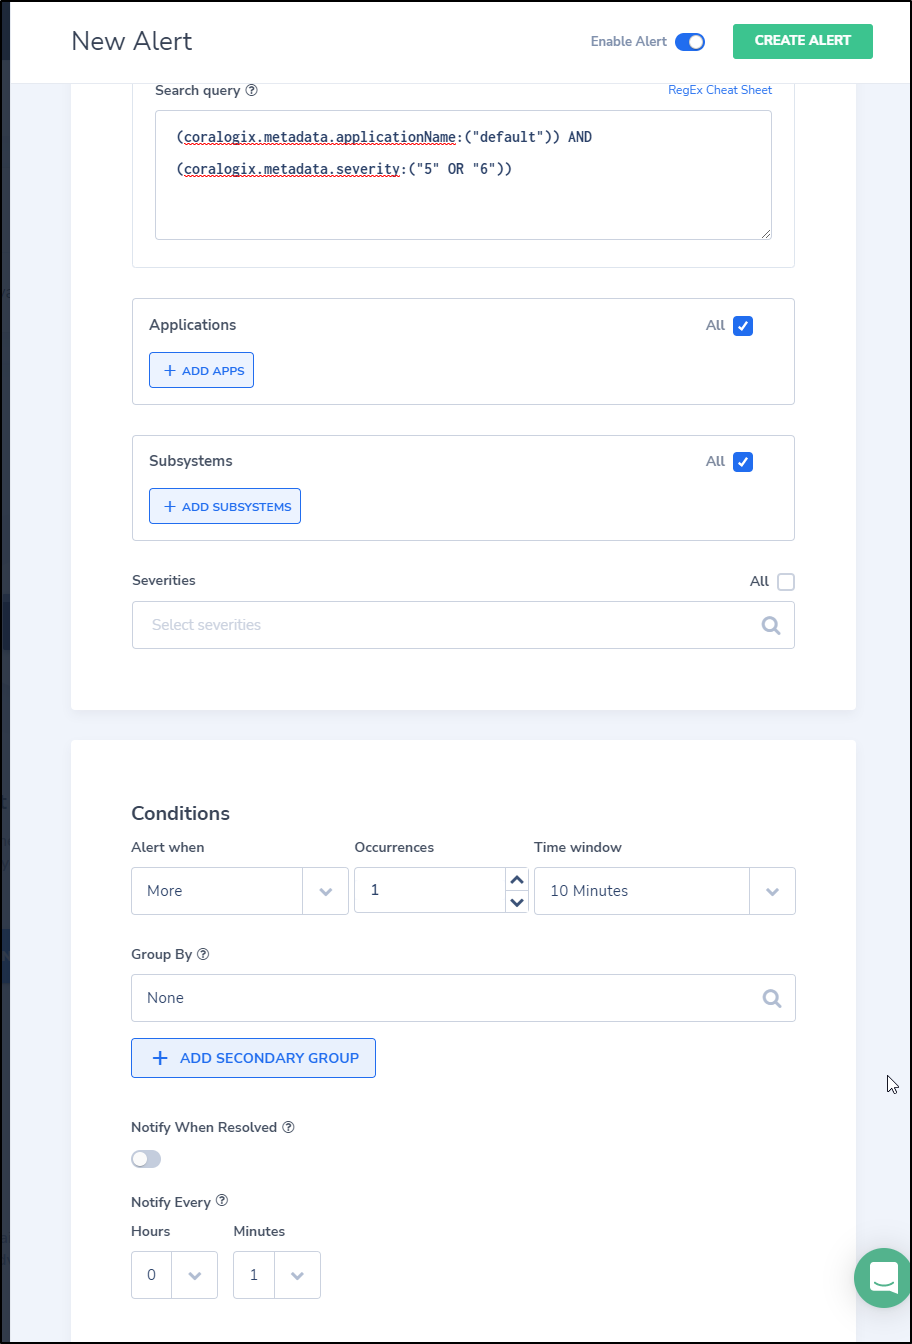
We can now go to the top menu “Alerts” and start the alert create wizard
And we can set the specifics, including using the query we captured above
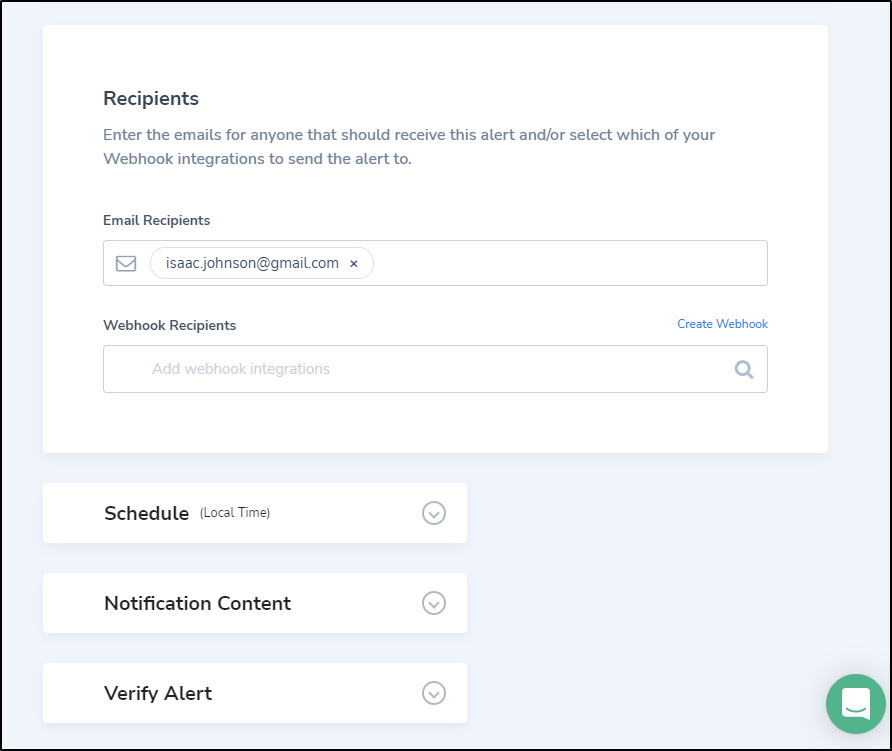
And at the bottom we can set the webhook or email recipients
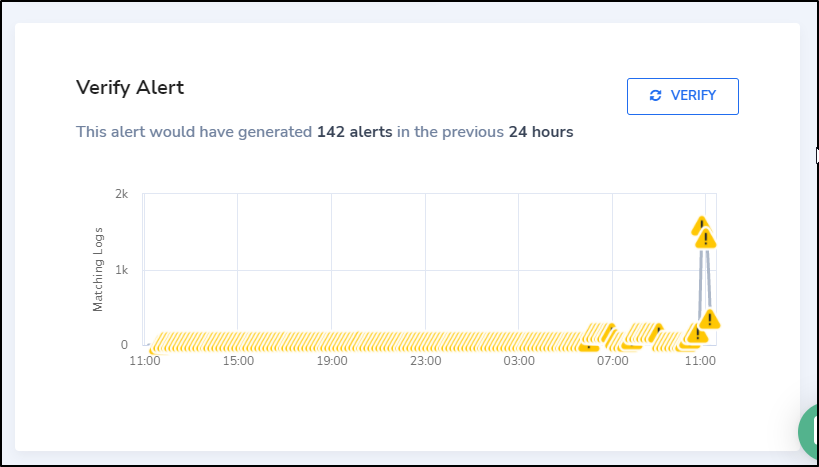
The Verify Alert section at the bottom does a pretty good job giving you a clue how bad the alerts will be on this.
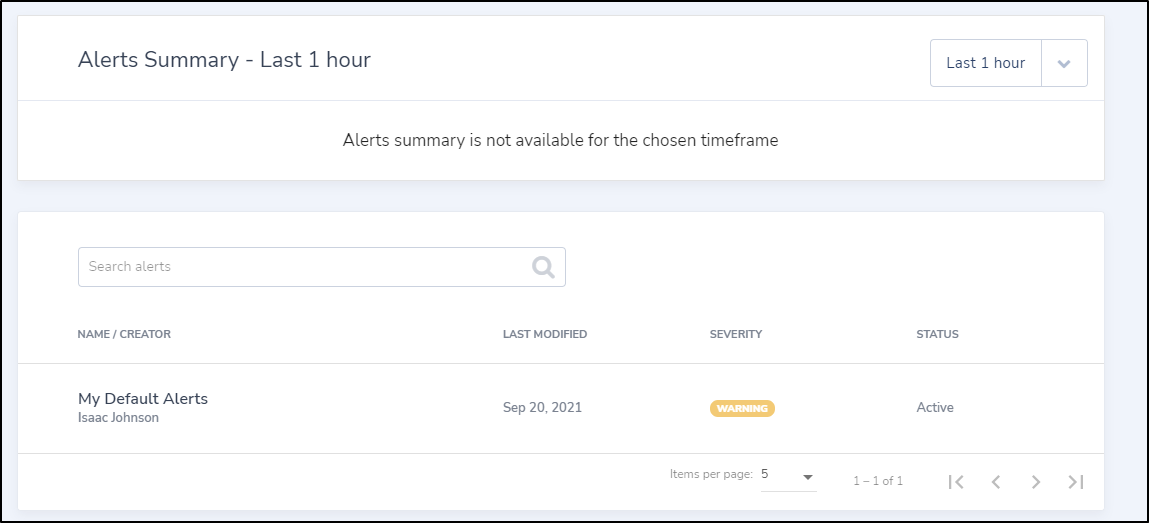
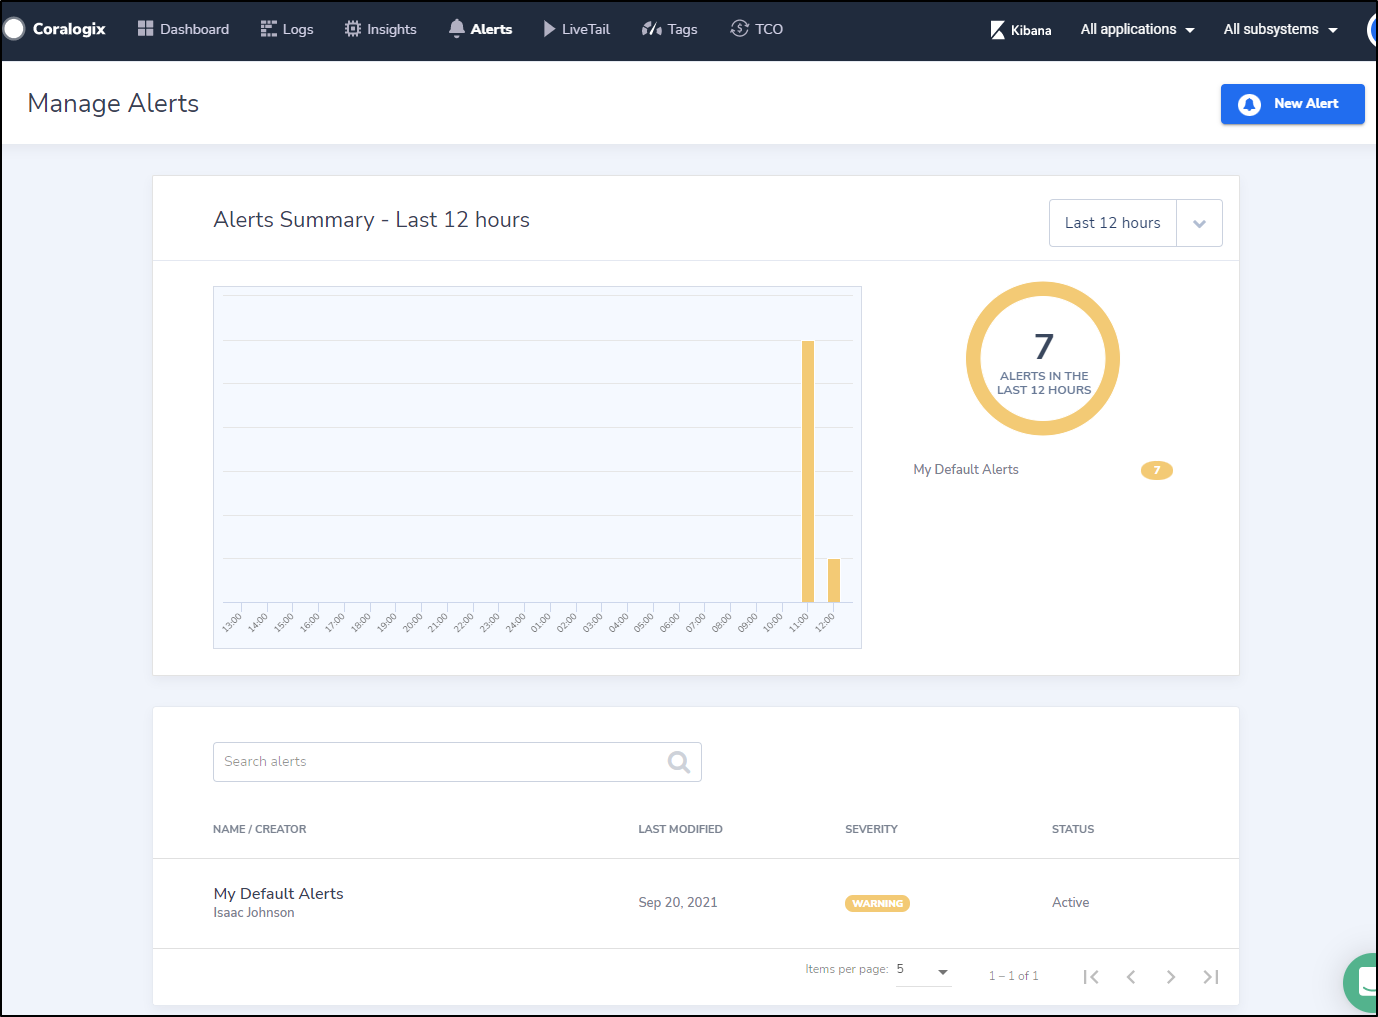
and we can see a list of our alerts:
I was hoping to see a way to trigger an alert in advance. I will have to wait for at least 10 minutes to see an alert. (Coralogix took a note on this during a meeting so this might be something they address later)
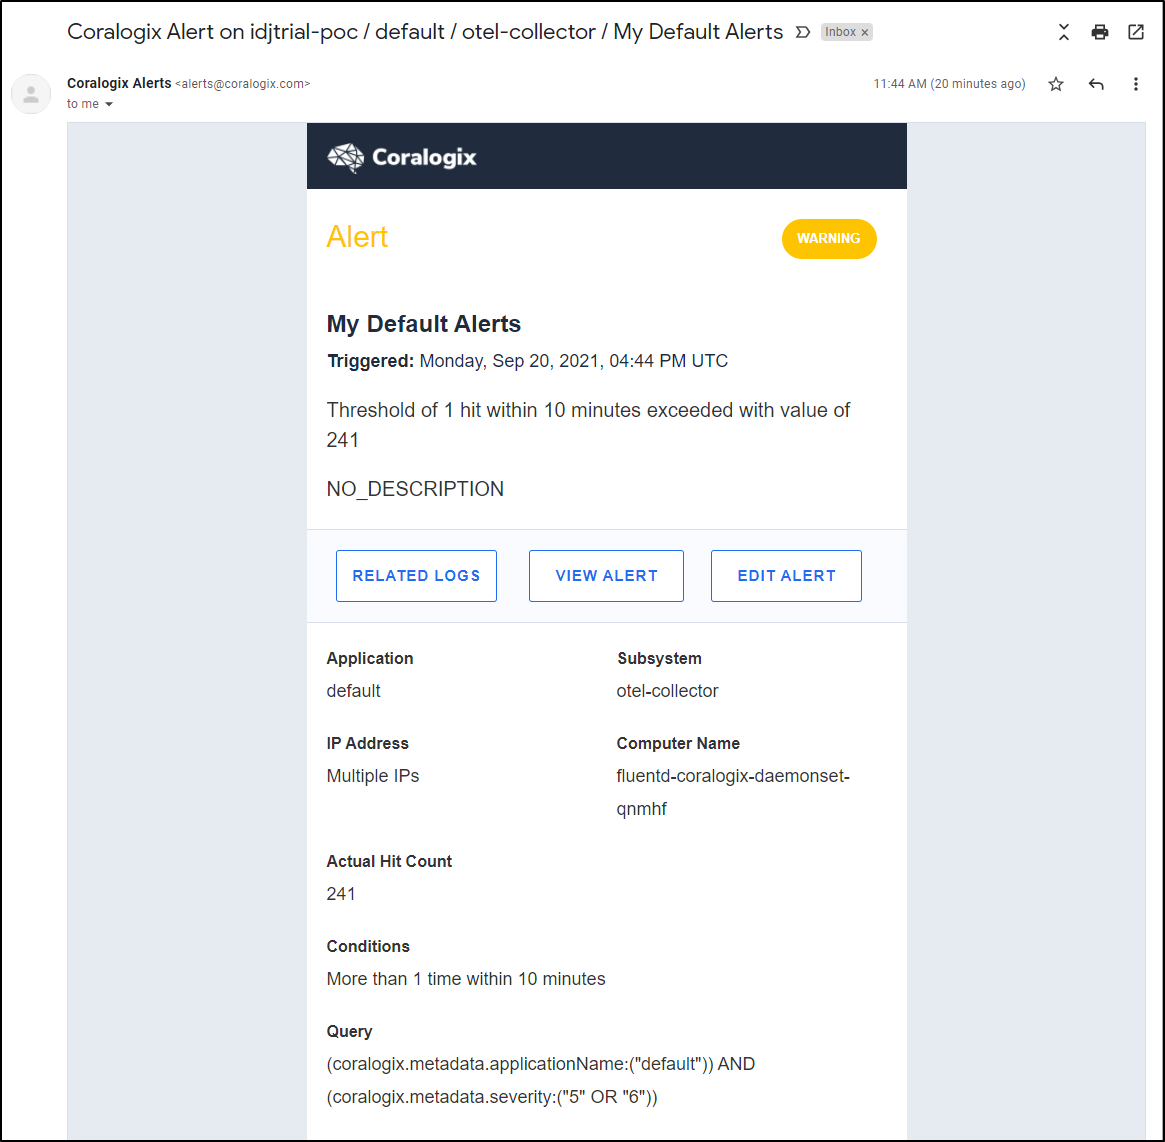
After a while i started getting regular alerts:
From the alerts window we can see all the alerts we’ve been getting
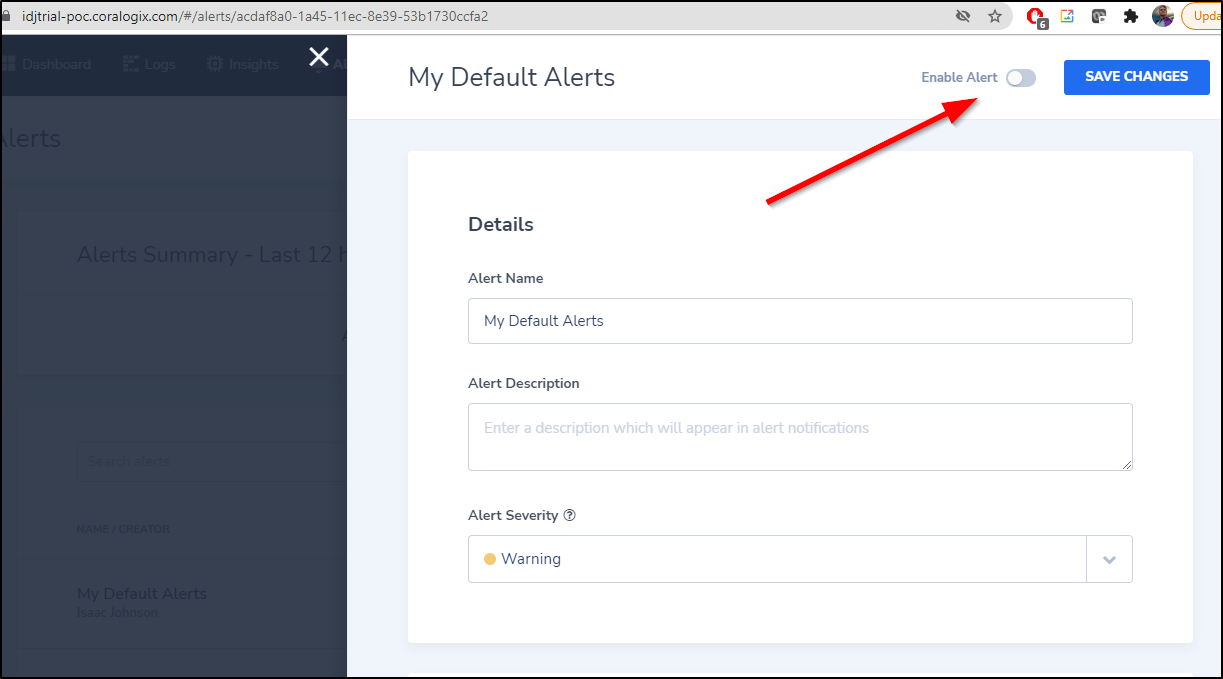
If it gets too much but you just wish to disable, you can disable via the toggle in the alerts window
LiveTail
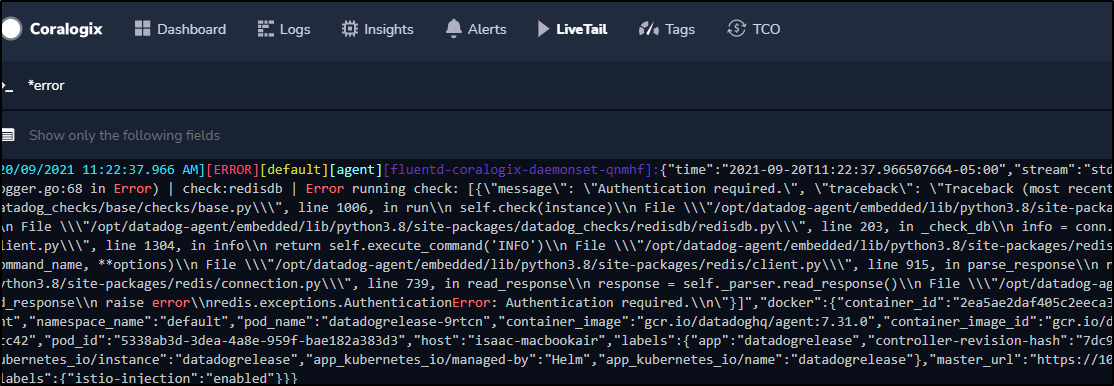
we can live tail logs with regexp. It does seem to search over all logs at the same time.
Tags
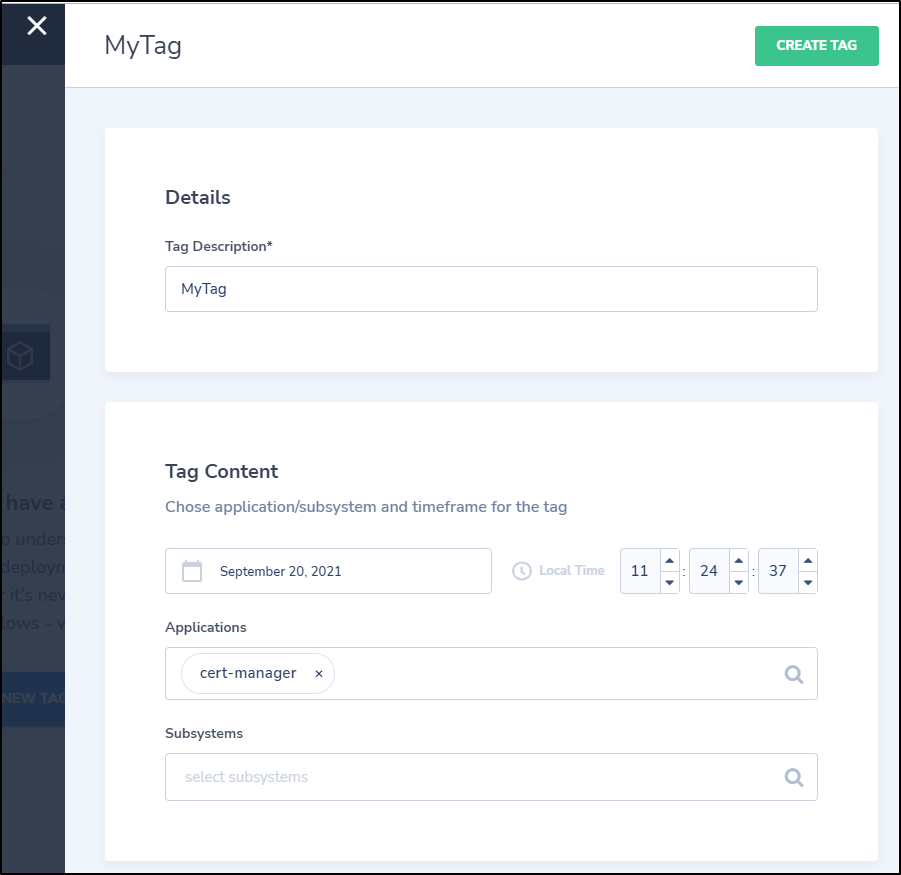
We can tag some basic data
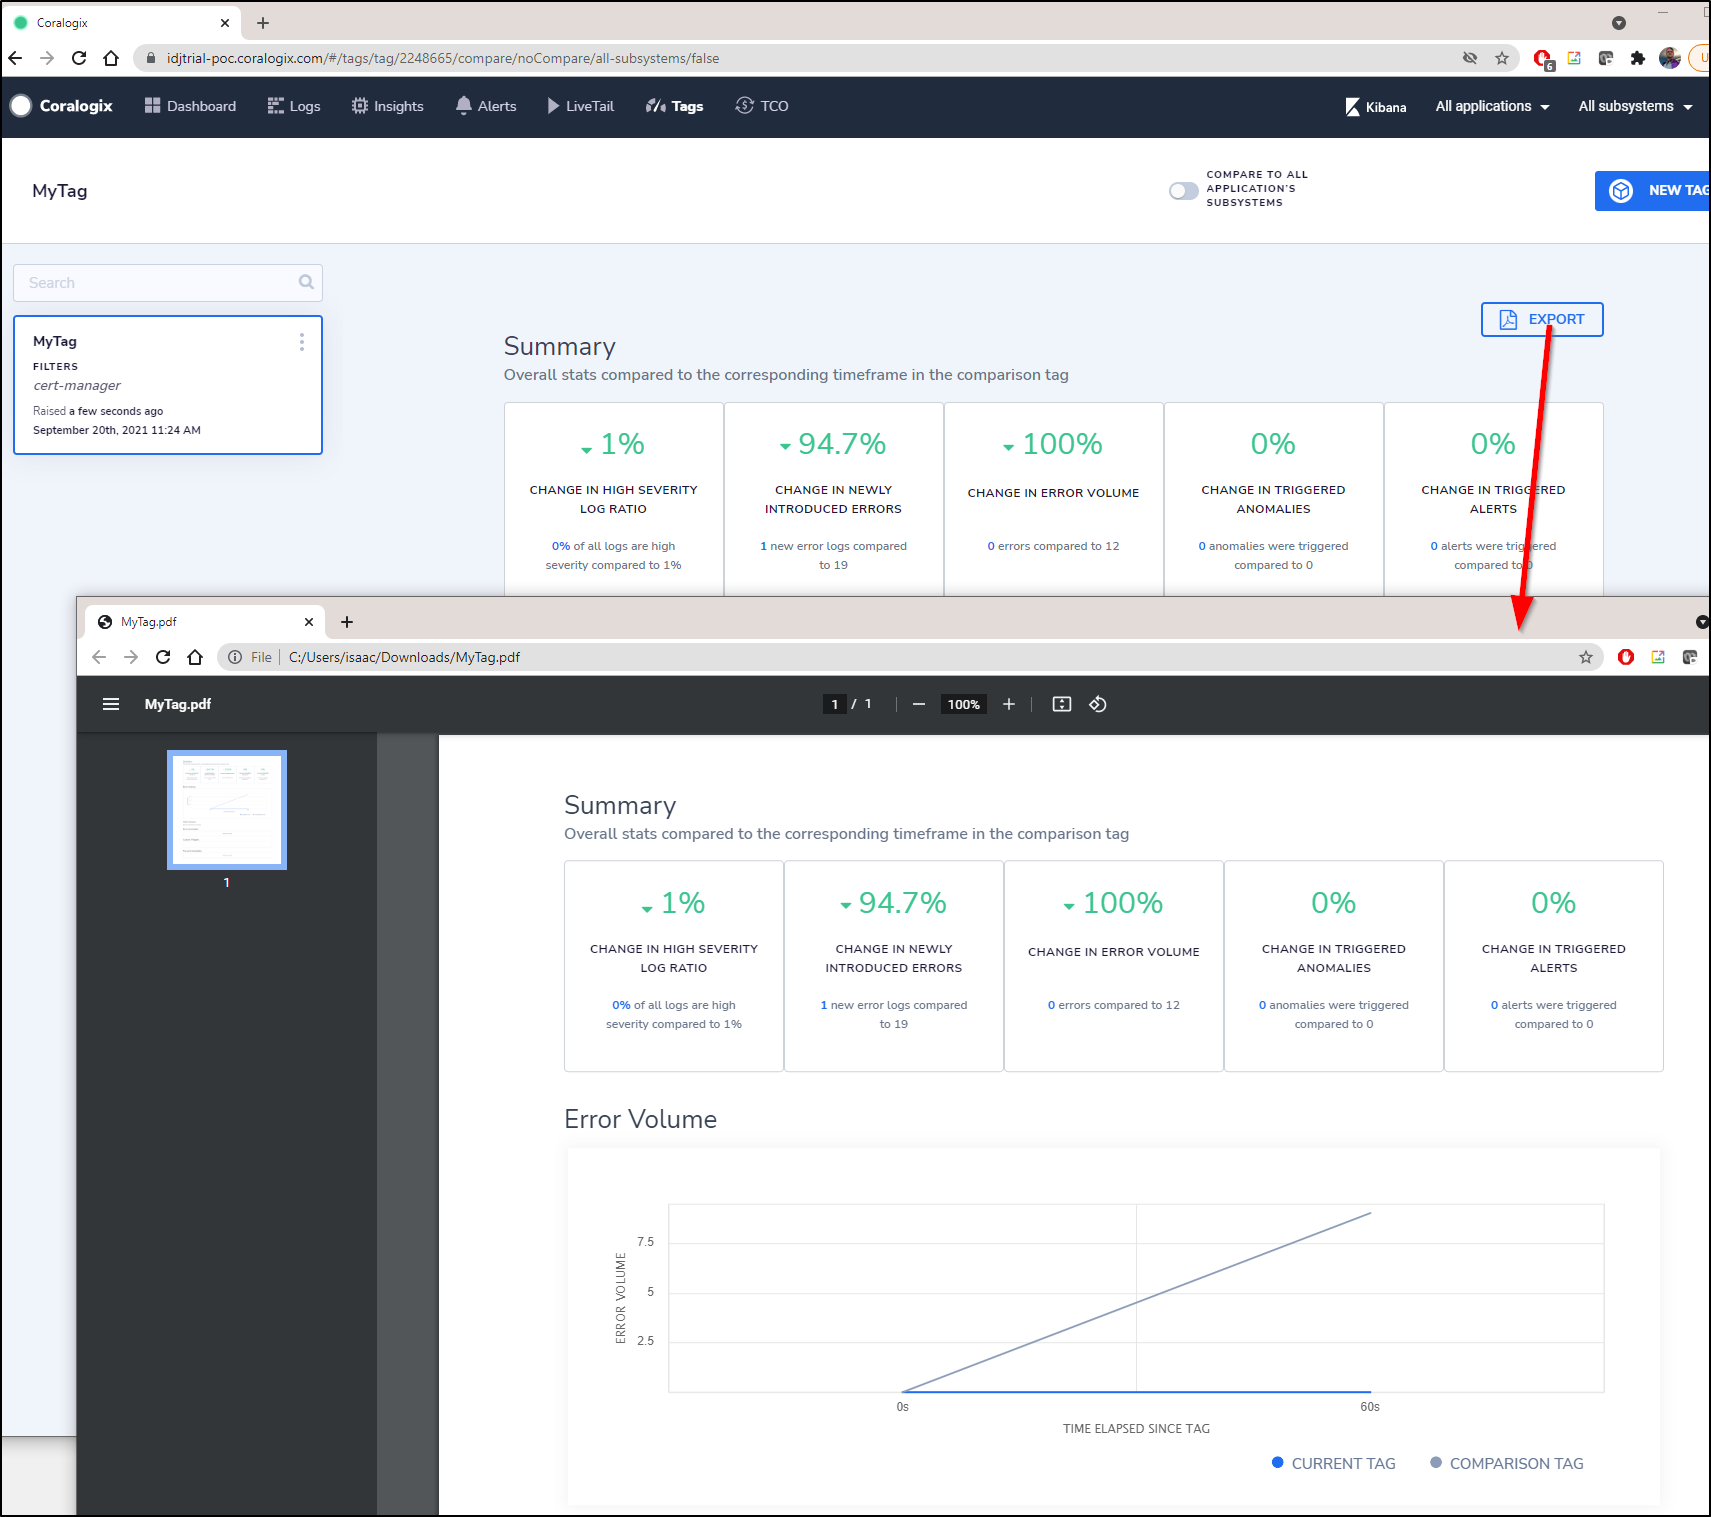
This immediately creates a dashboard page that has a handy export to PDF option
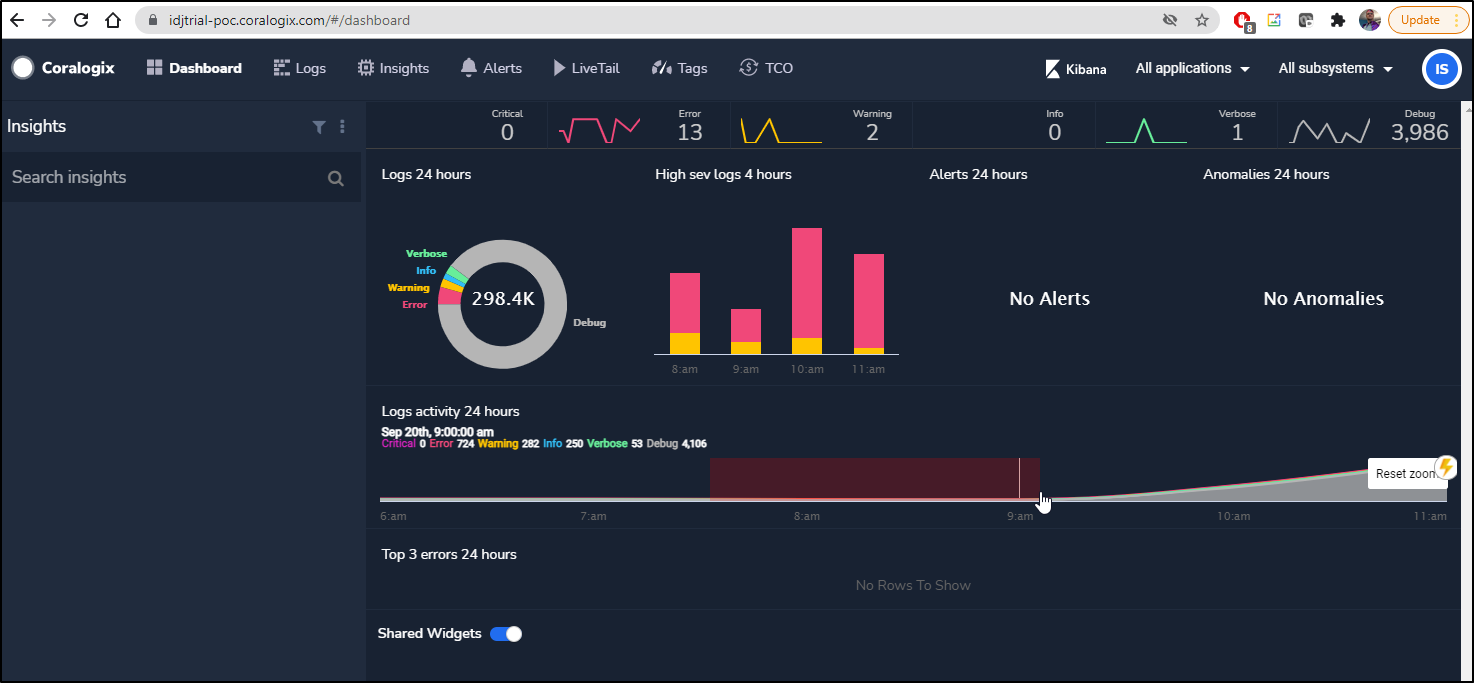
I’ve noticed that we can view a running Dashboard with 24h of data, but there is no option to change the window of time.
You can interactively zoom in by selecting a section of the graph. There is also the option to narrow to Application and Subsystems, but not Time ranges or custom tags.
Adding others
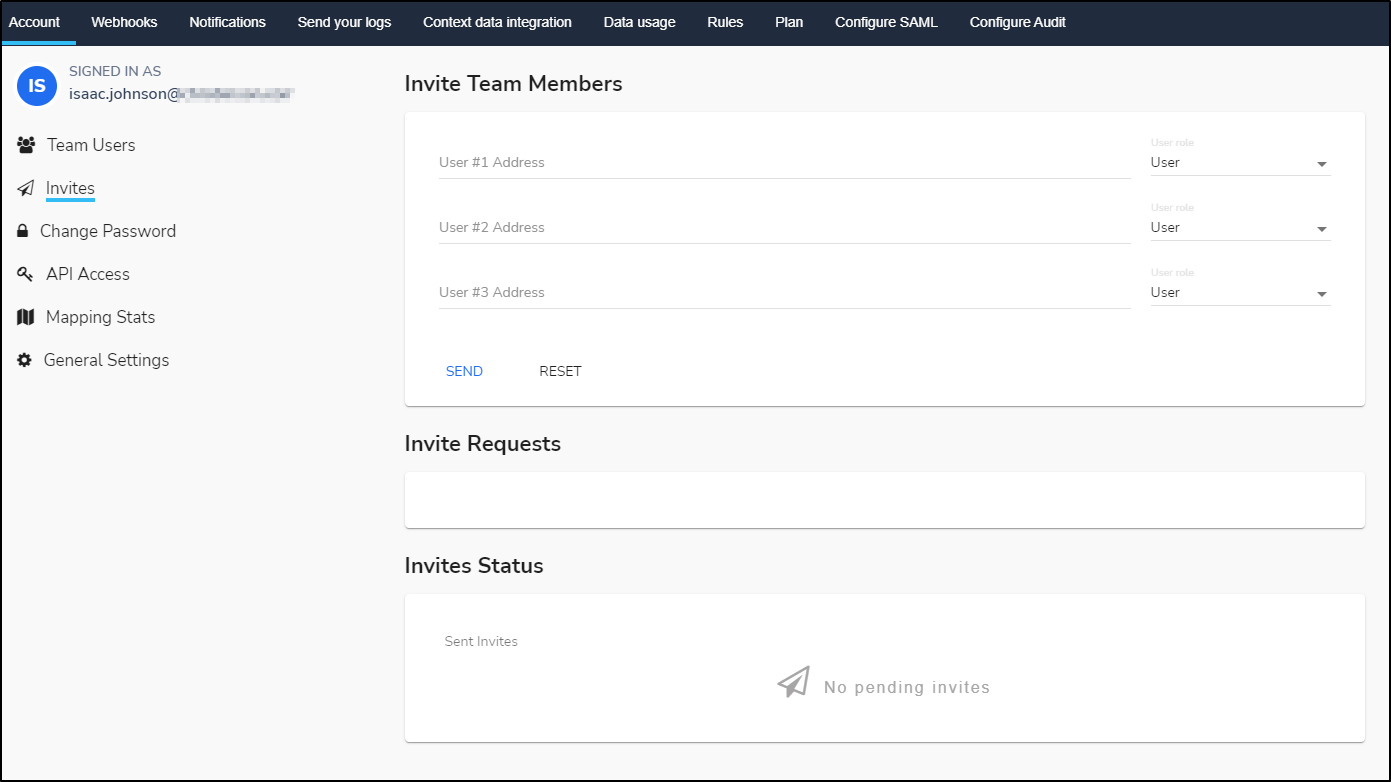
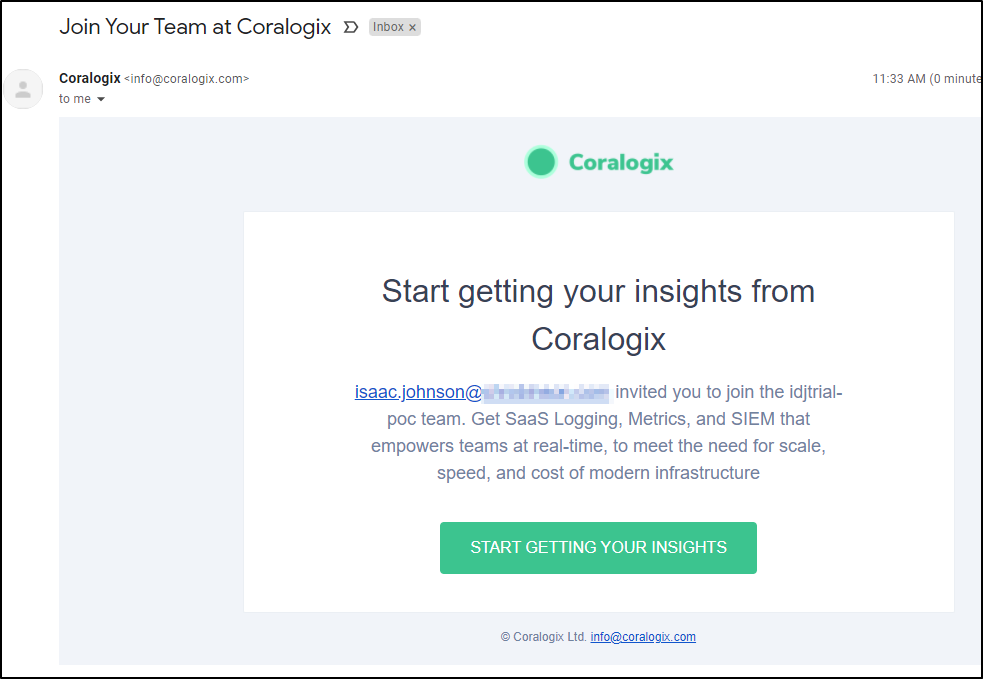
For a simple starter system, you can just invite users by email
which sends an invite as such:
Oddly i could invite the admin user already signed up, so it seems a simple add wizard.
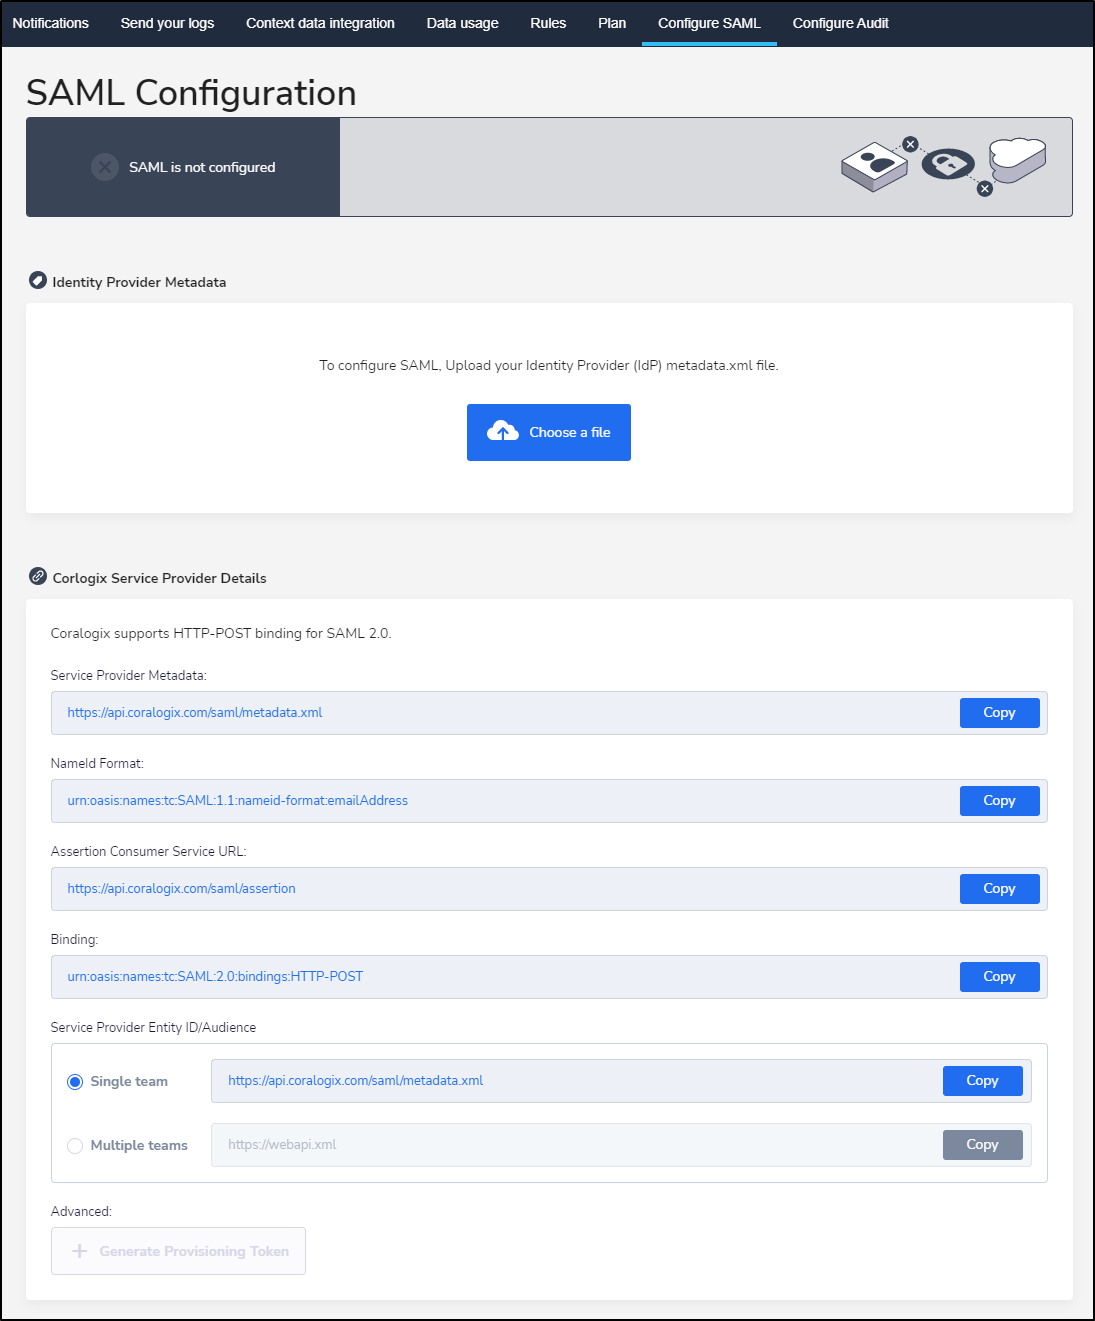
More advanced deployments will want SAML integration:
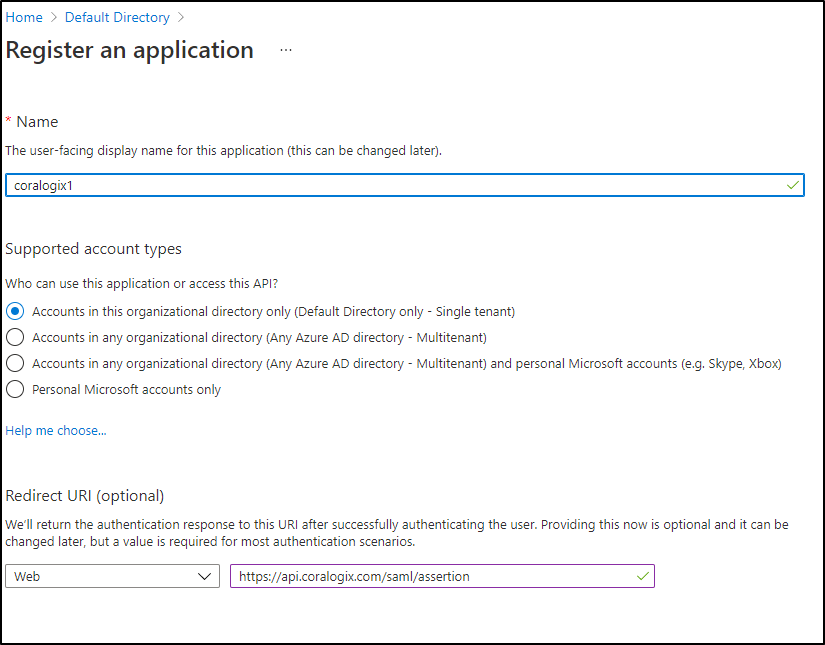
Setting up AAD
We can create a new App Registration
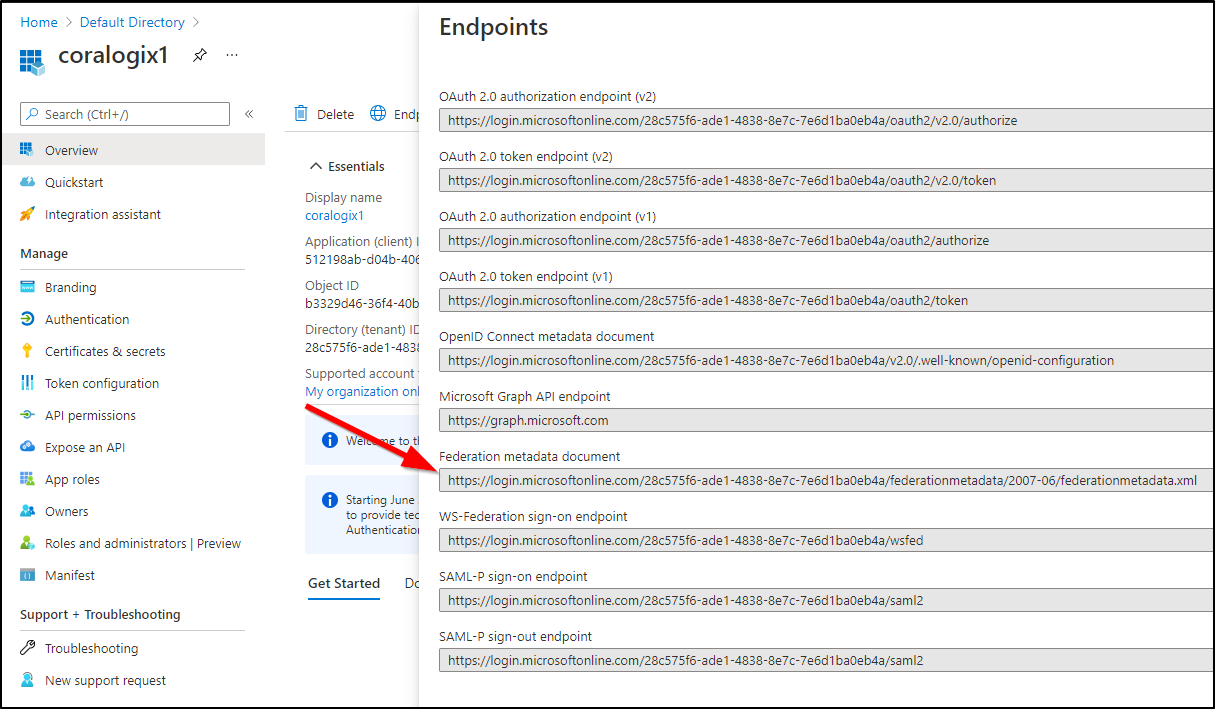
From the the Endpoints URL, get the Federation Metadata.xml and copy it.
I opened in the browser and saved the file
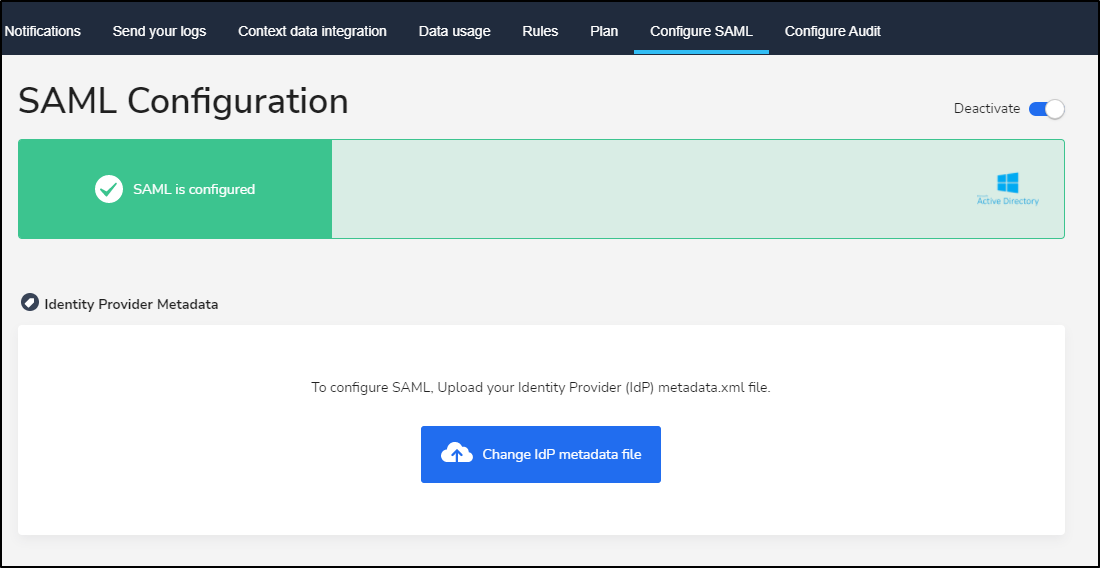
we can now upload to Coralogix to use
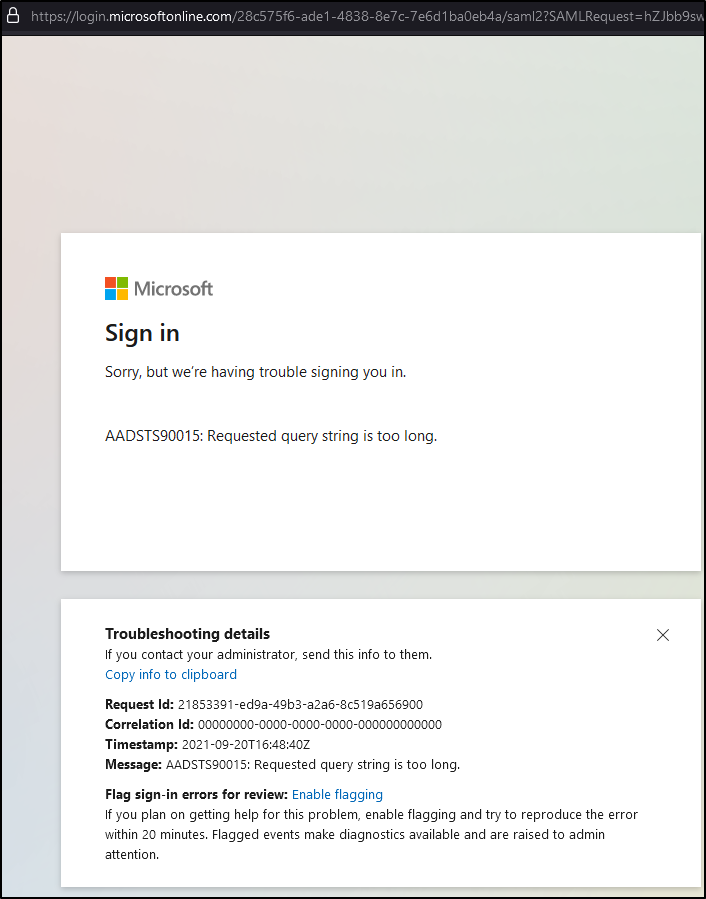
and launching an icognito browser/fresh browser we can see it is setup
There is clearly more to it since the GET URL is too long
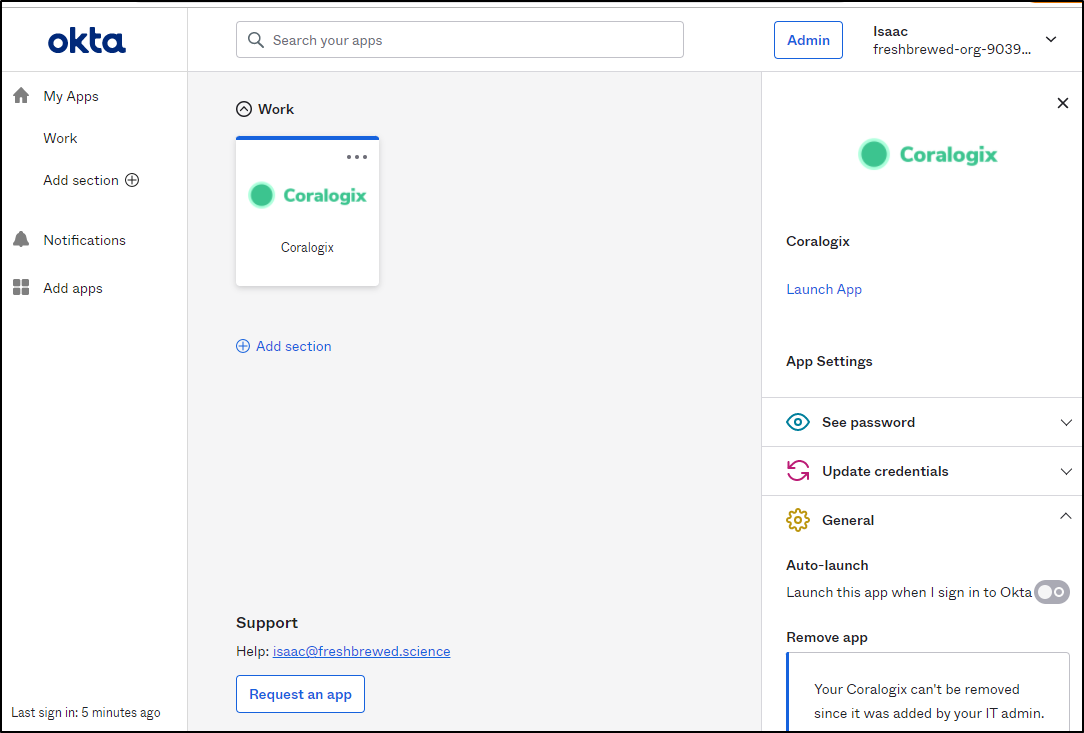
I also tried adding the app in Okta:
This worked, but i still had to login with MFA so i’m not sure if the app in Okta really worked.
Impressions
I chatted with the Coralogix team at length. They seem a swell bunch of guys with a lot of positive energy. We covered some advanced features I wouldn’t see, neccessarily, in the trial version:
- Teams (groups) - in a full instance, ways to aggregate users into groups
- “Templates” which are derived via AI from log patterns over time. These are where they see the real value add applied, but it does take some time to propegate.
Cluster impact
Let’s face some facts, there are some solutions that are really expensive from a montoring perspective. One of my biggest reasons to avoid logstash, for instance, is the large footprint a java collector causes.
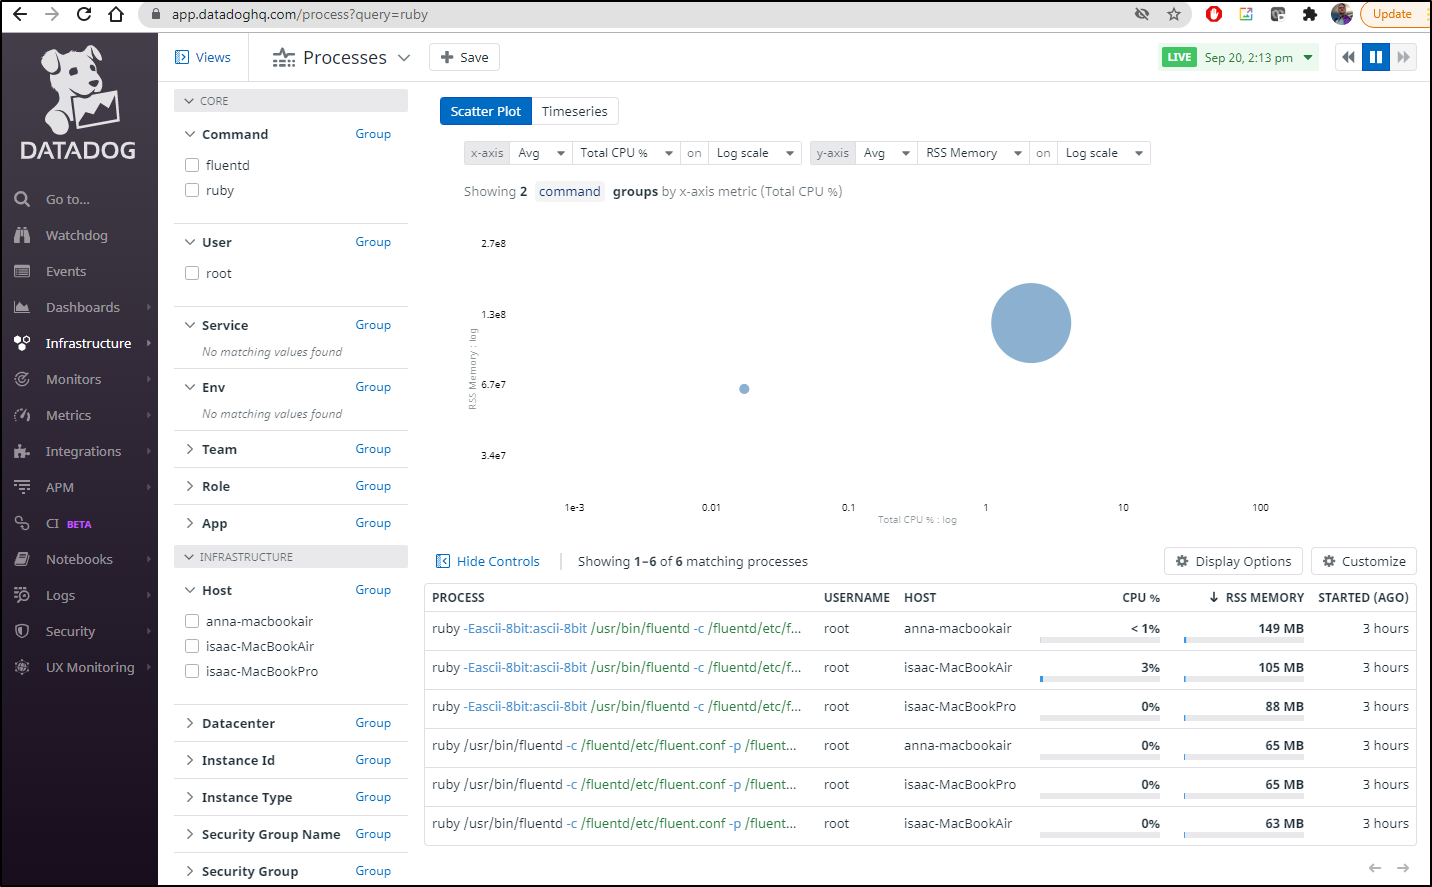
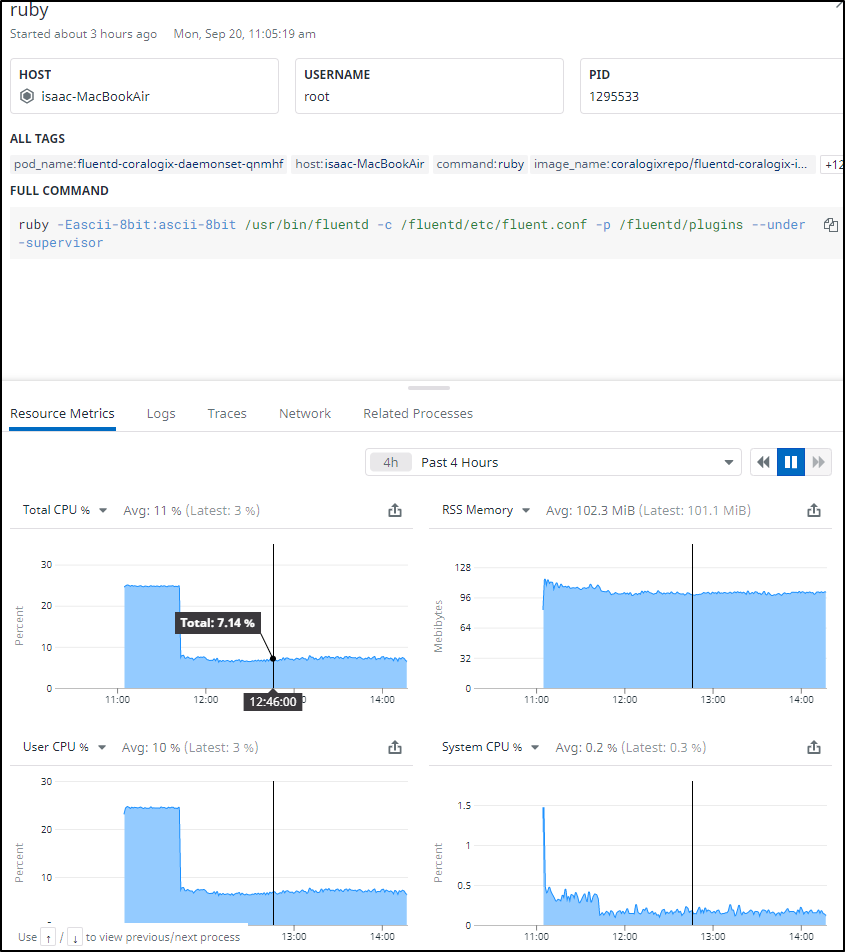
I used (sorry Coralogix guys, I know it will grind your gears), but i used Datadog to view the process impact on my cluster
We can see an initial spike, but on my most hungry host, we see it averages about 7 percent CPU and 0.2% of system CPU for the Daemonset running on the main Macbook air. It consumes about 100Mb memory on that host but on the remainder i see as low as 65Mb.
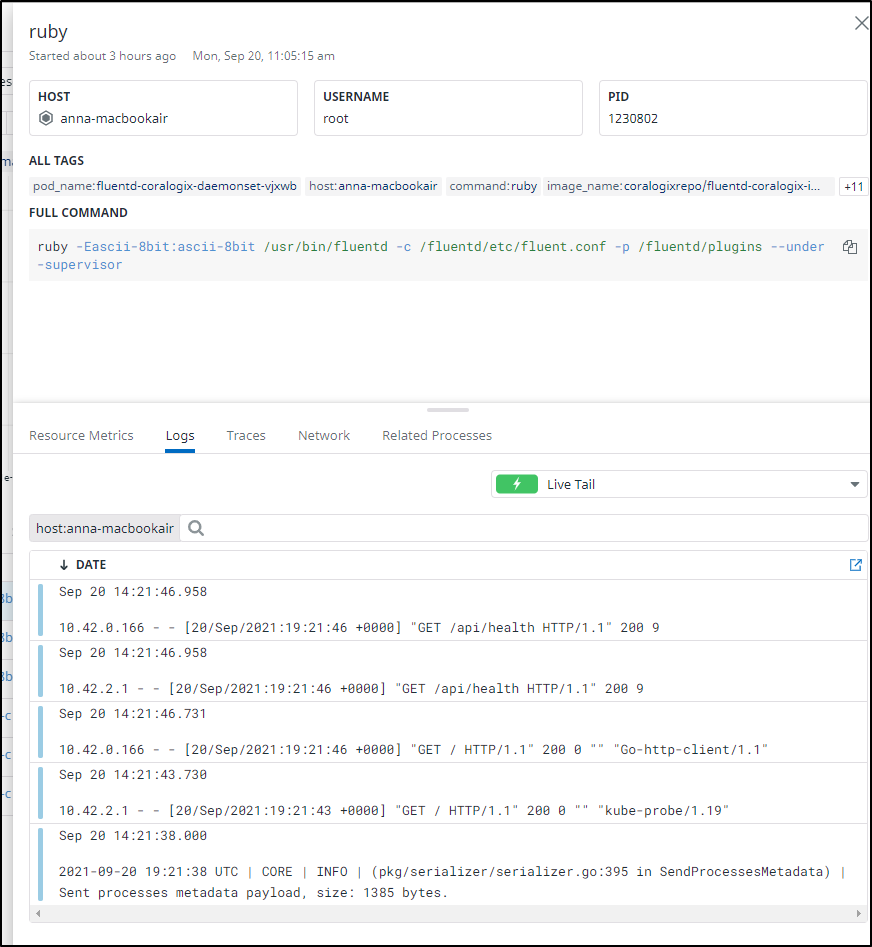
I can livetail the log on a daemonset to see the data its sending which seems to just be basic HTTP status.
Summary
I see Coralogix as a pretty good start to a managed Elastic/Kibana in the ELK/EFK stack. It has some AI value-add, similar, at least in my mind, to LogDNA. While I felt the install guides assumed a bit of prior knowledge, the YAML deployments into K3s were rather straightforward and quick.
I saw a demo showing Teams and their access scoped to Application and/or Subsystem, so i know group rules exist.
While we never discussed price, they are very upfront on costs: cost sheet, which today is:
I think they have some wiggle room on that so consider these ‘sticker’ prices, or the most you can expect to pay. The idea is that as you scale, if you have a need to reduce costs, you can trade search performance for price.
That is, by moving an Application into just Compliance, you might have to tolerate up to a 30s time on a search result, but for a much lower storage cost.
Also, for good and bad, since you have to manage the log collection agent, frankly, you have full power to trim what is sent by just trimming it in Logstash/Winlogbeats/etc
e.g. Maybe I wanted WinLogBeats to only forward System and Security events as well as any old events (should the host restart). I would limit my event_logs as such:
winlogbeat.event_logs:
  - name: Application
    ignore_older: 24h

  - name: System

  - name: Security
or if I wanted Fluentd to trim to just nginx access logs
 <source>
      @type tail
      format nginx
      tag nginx.access
      path /var/log/nginx/access.log
  </source>
However, there is a narrow band that would want to pay for a commerical Kibana/Elastic+ offering but still manage their own Kafka and Logstash/Fluent/etc stack. I would imagine most companies who are comfortable setting up the playbooks, recipes, etc for log forwarders are also comfortable setting up their own on-prem elastic and/or Cloud hosted (such as Elastic on Azure, AWS or GCP).
I think Coralogix is one to watch and if a company is keen on a managed Kibana with some AI value add and is cost-focused, worth considering.


