Published: Sep 22, 2021 by Isaac Johnson
I make no bones about being a Datadog fan. I use it personally. Recently I had some health issues with my cluster and leveraged Datadog to help debug and solve them. Since I think this is a pretty common use case for Ops and DevOps admins, I wanted to detail how we use Datadog, not as a developer in this case, but as an Infra admin.
How can we pinpoint the choke points and root out the problems that can degrade a cluster or worse, risk putting a cluster into a fail state?
We’ll look into reports, solve some of the issues, then verify our solution. Lastly, we’ll show how to update the DD agent in the cluster to enable new features and setup Anomoly alerts to solve going forward.
Danger Will Robinson, Danger.
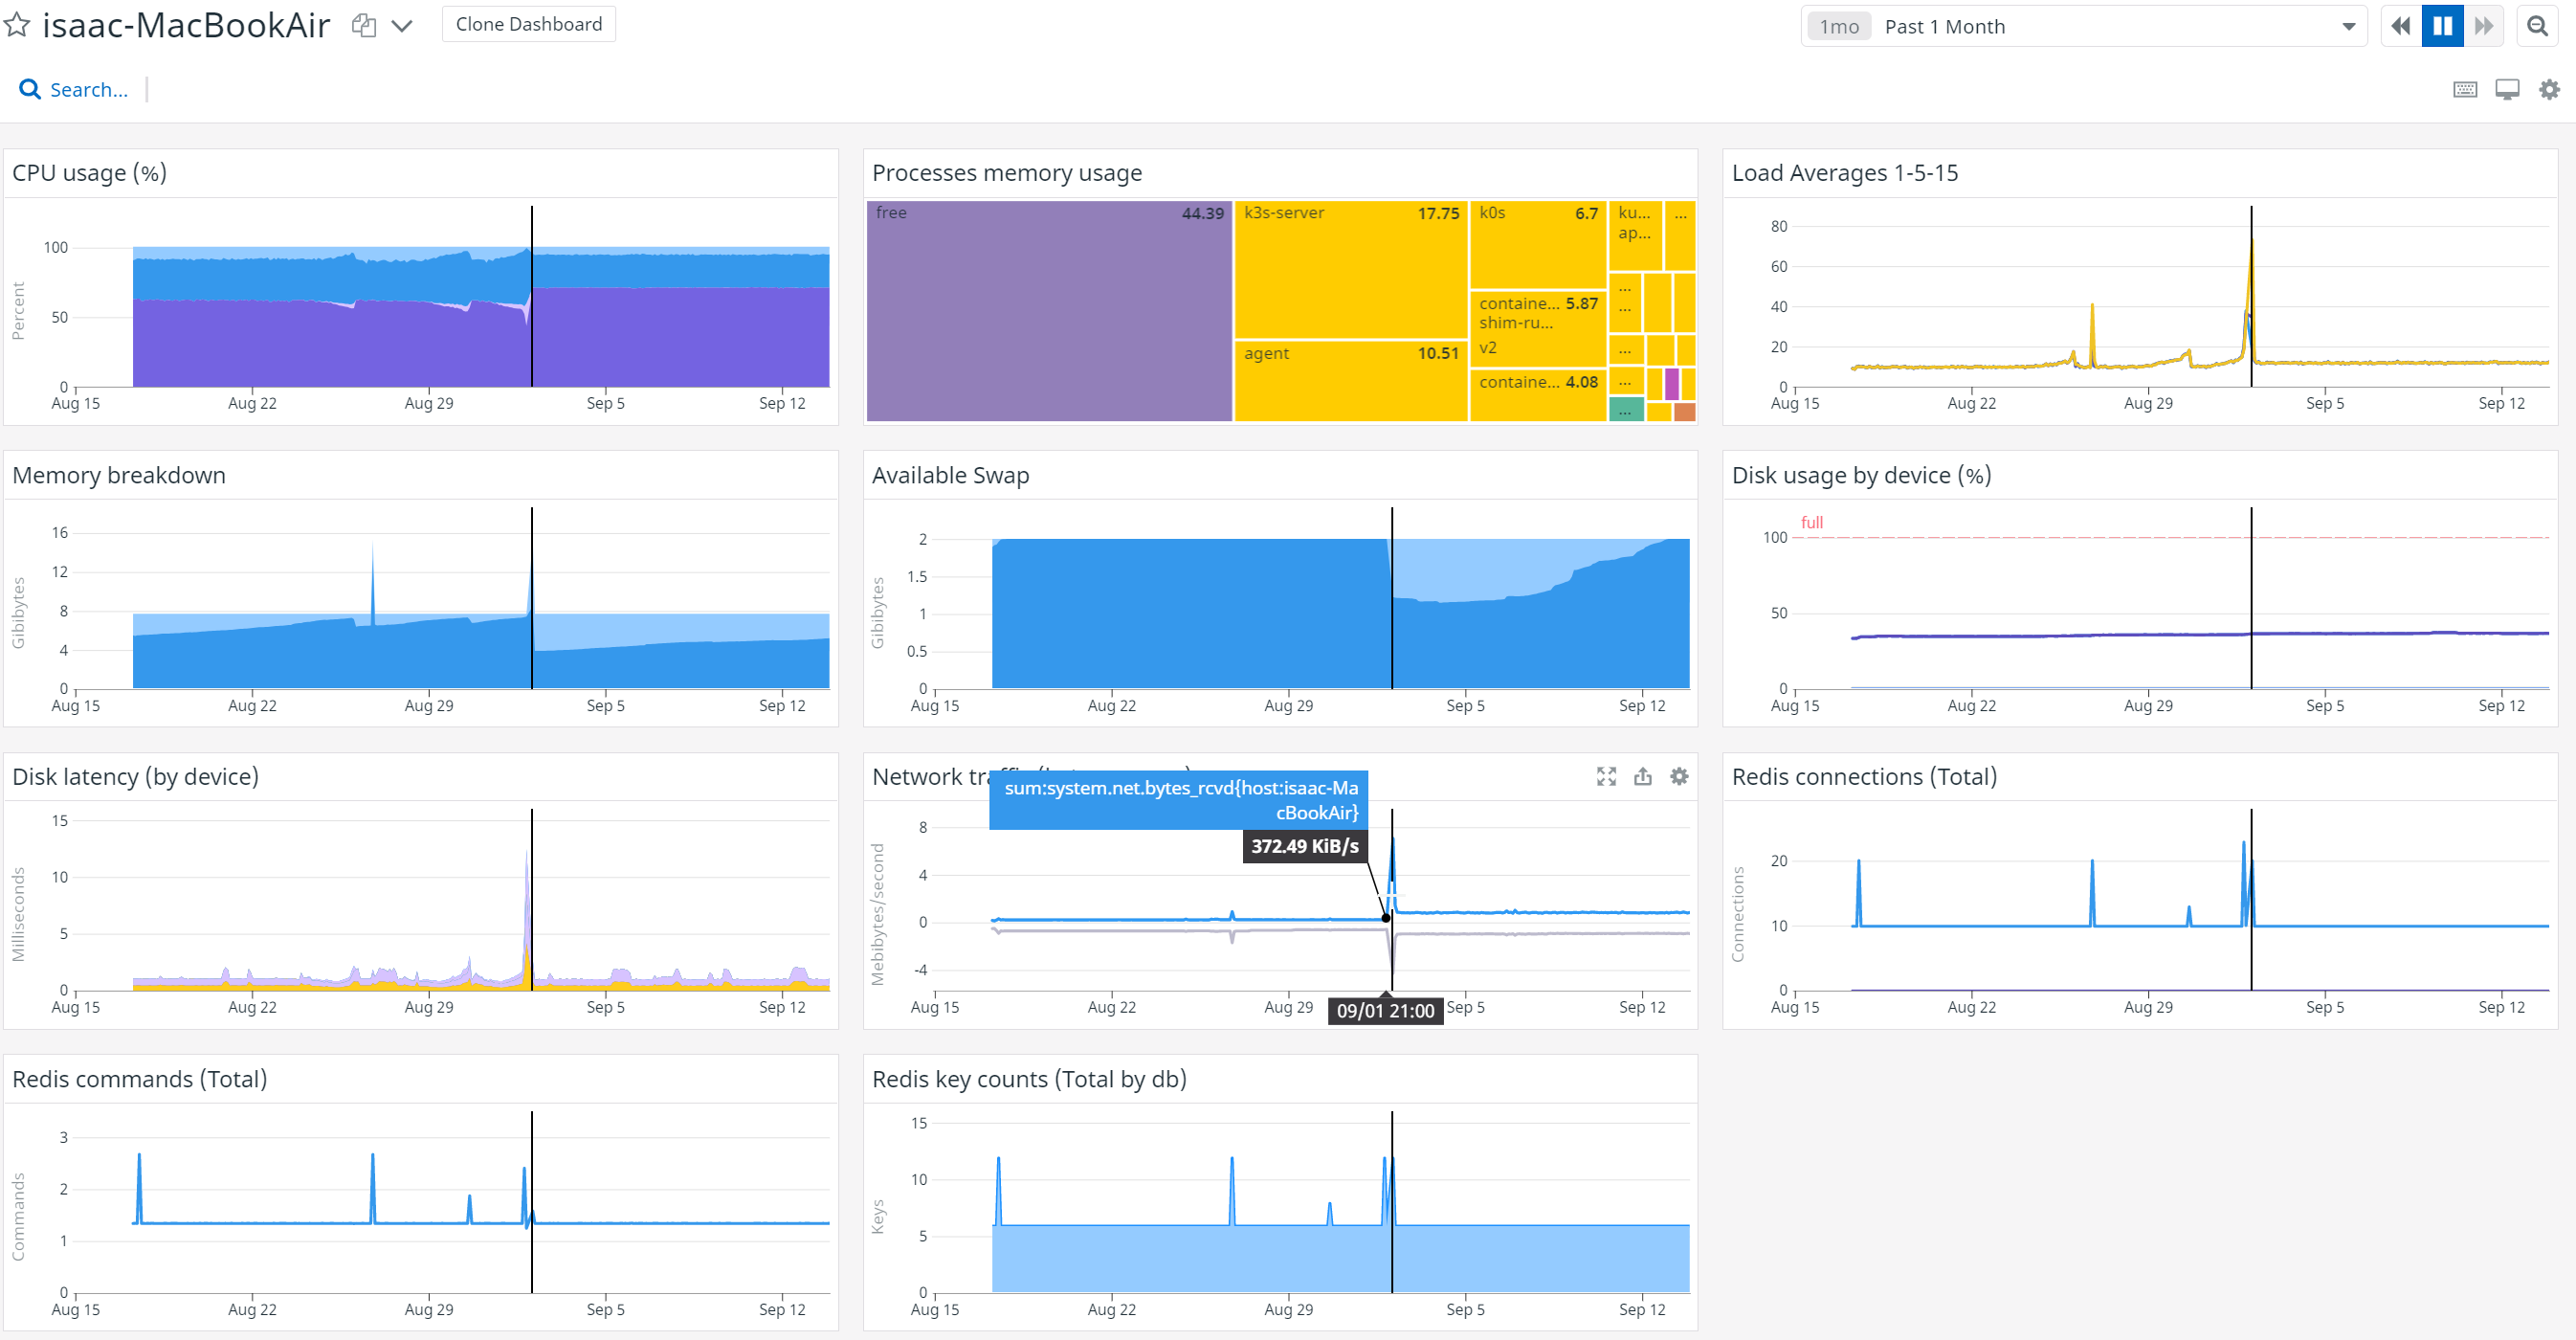
The first thing I noticed in my dashboard was the red indicator on my main node. Actually, to be honest, the first thing I noticed was the loud fan cranking away on the macbook as I went to my home office. After a few days, I thought, “golly, that doesn’t sound too good” and fired up my DD Dashboard to investigate.
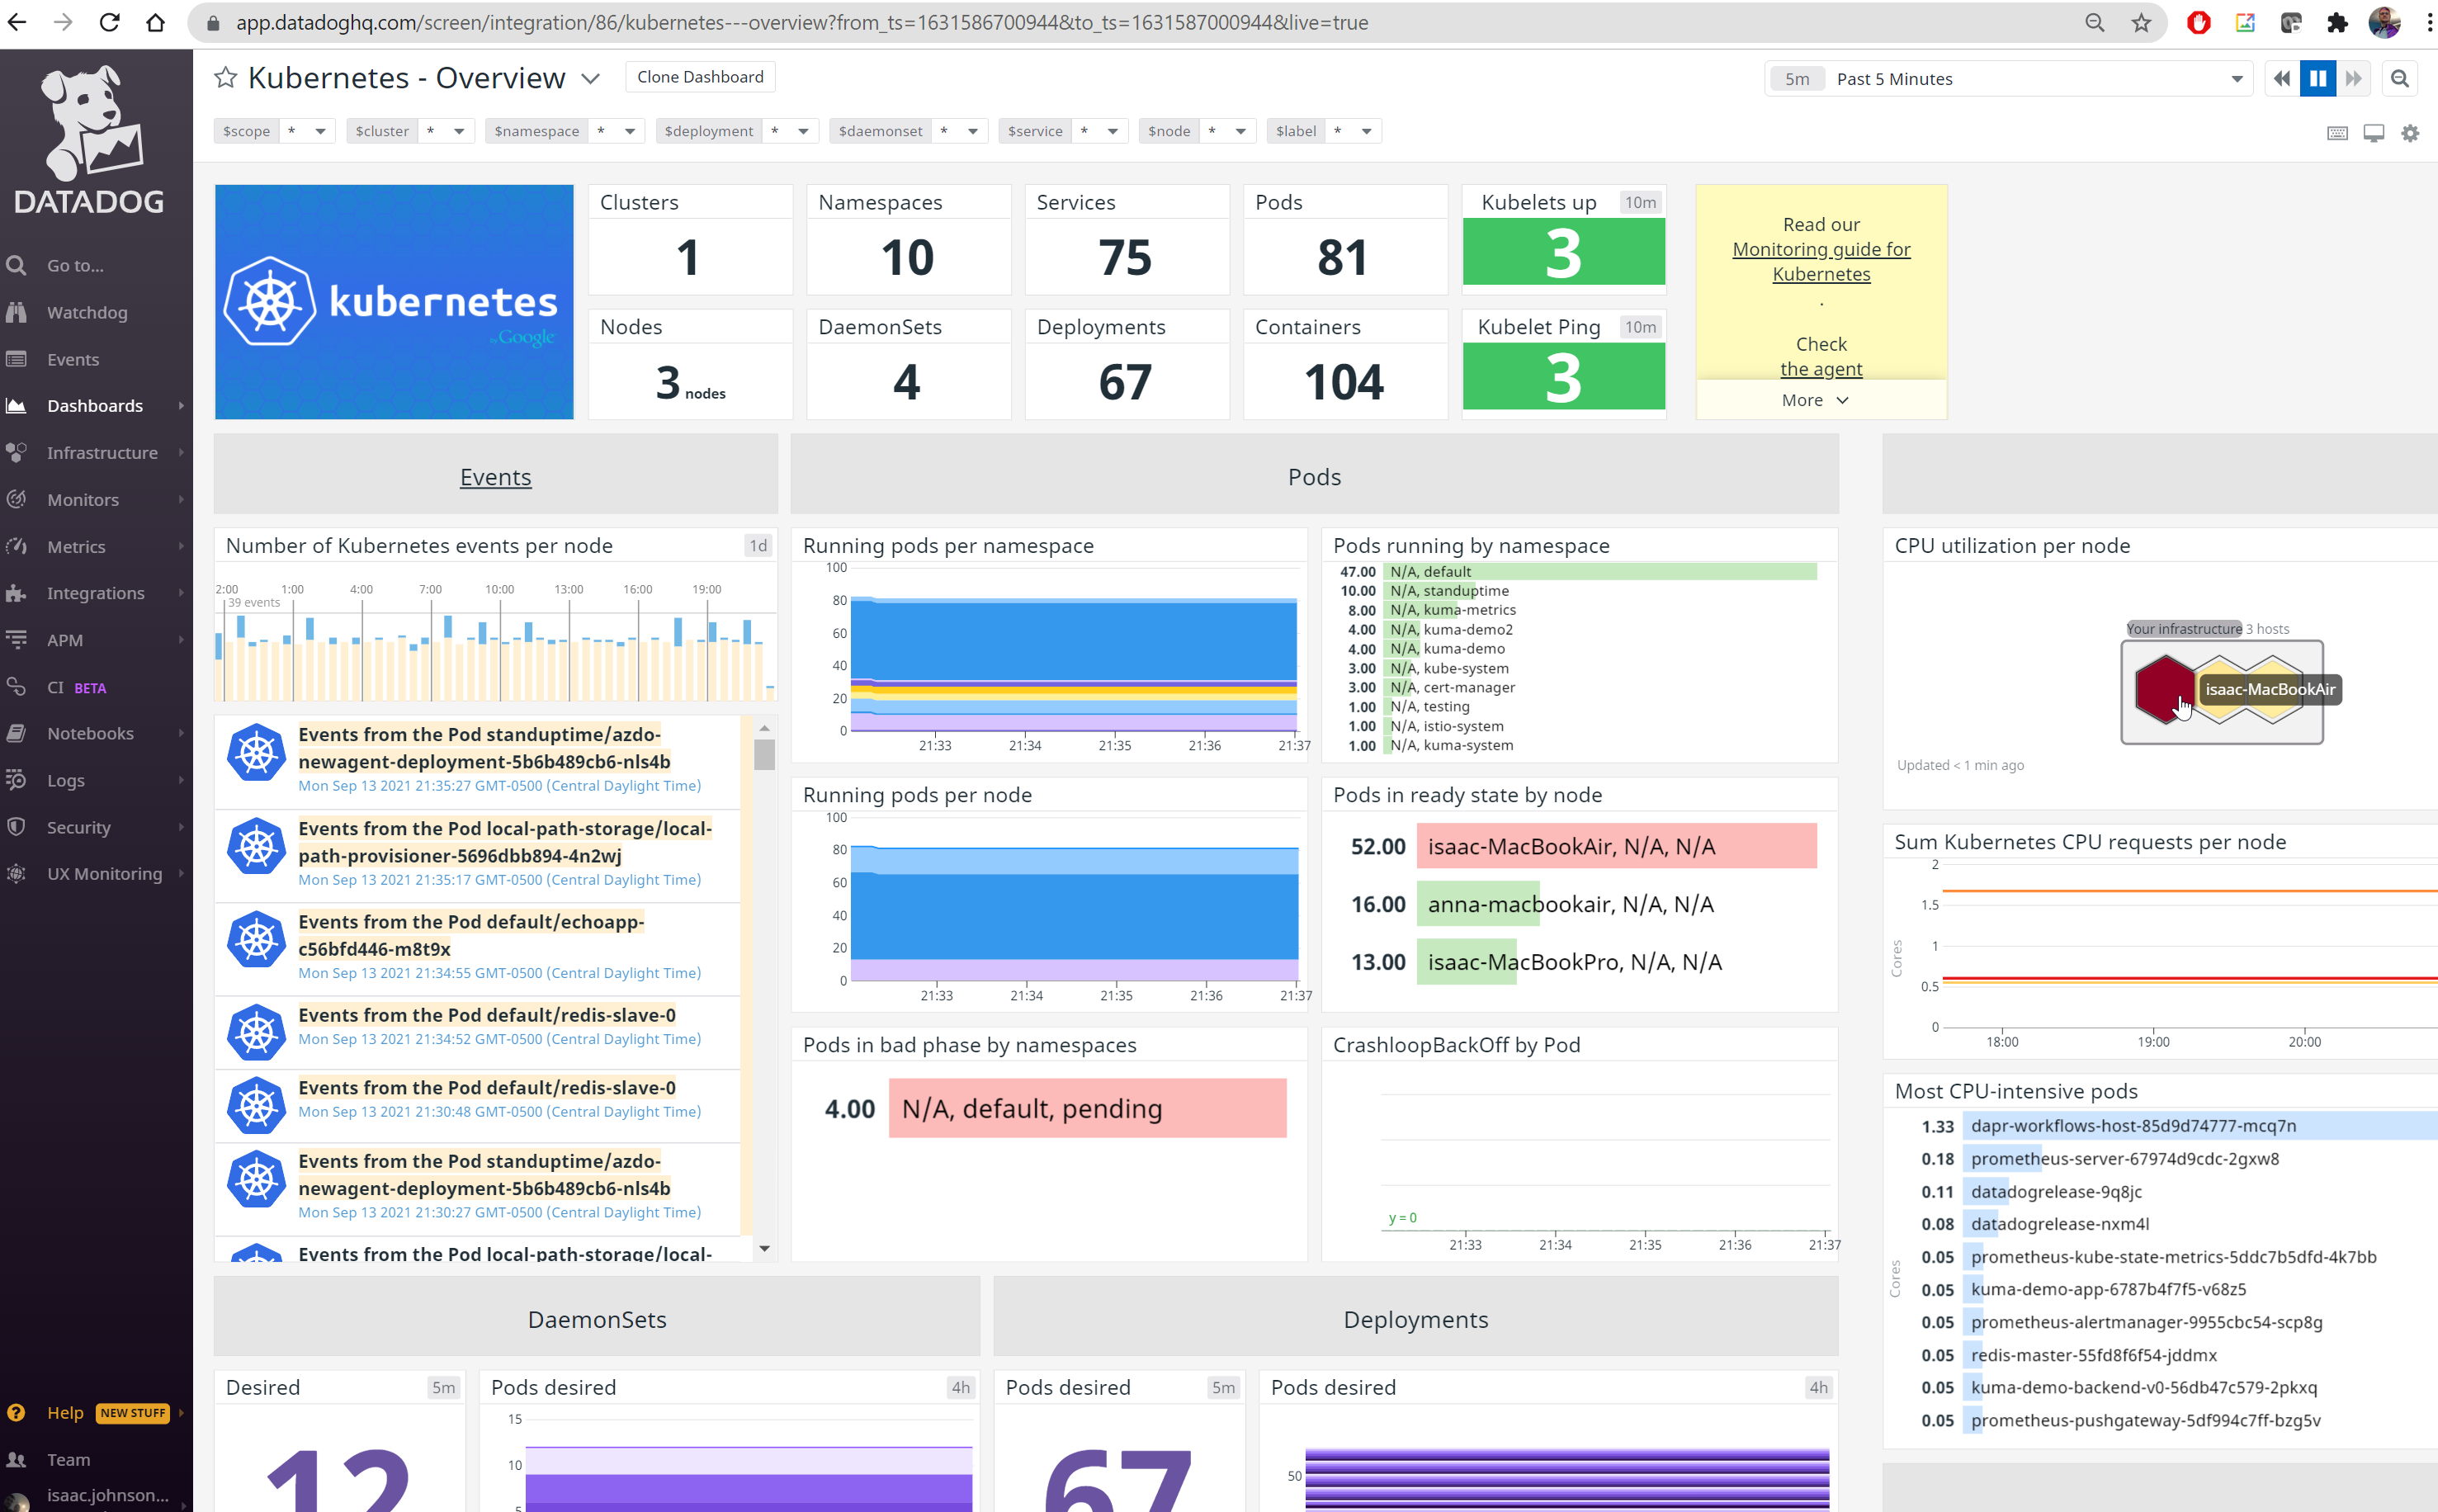
We can hop into details of the problematic node and see that it’s rather high on CPU usage. It seems to have really taken off around the start of the month.
If we were managing a production system, we might want to check events or deployments around that time to see if we have a scaling our deployment issue.
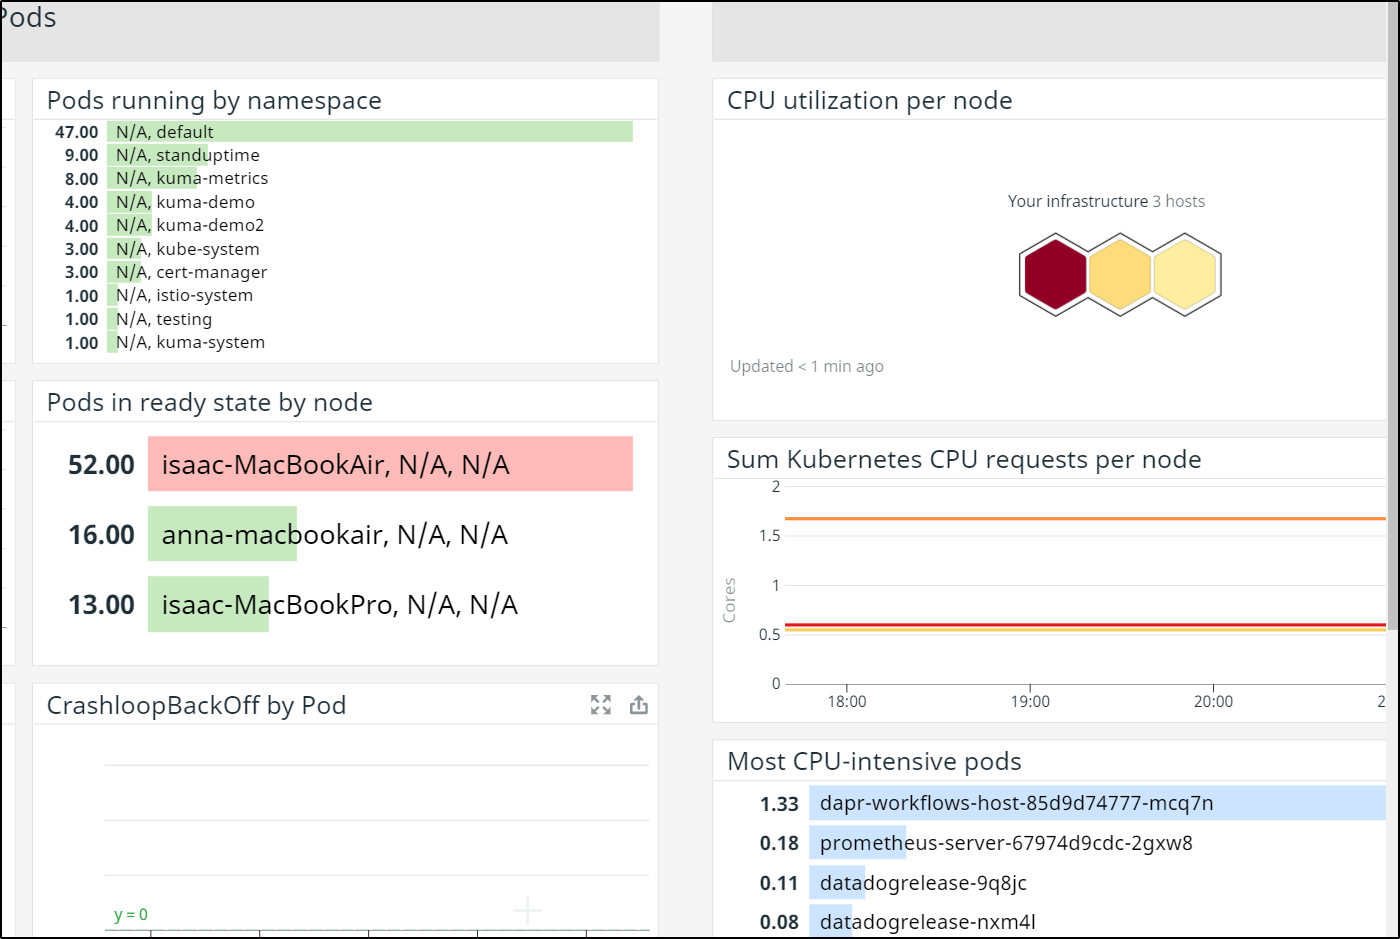
My next path for debugging was to check the pods by namespace and the most CPU intensive ones.
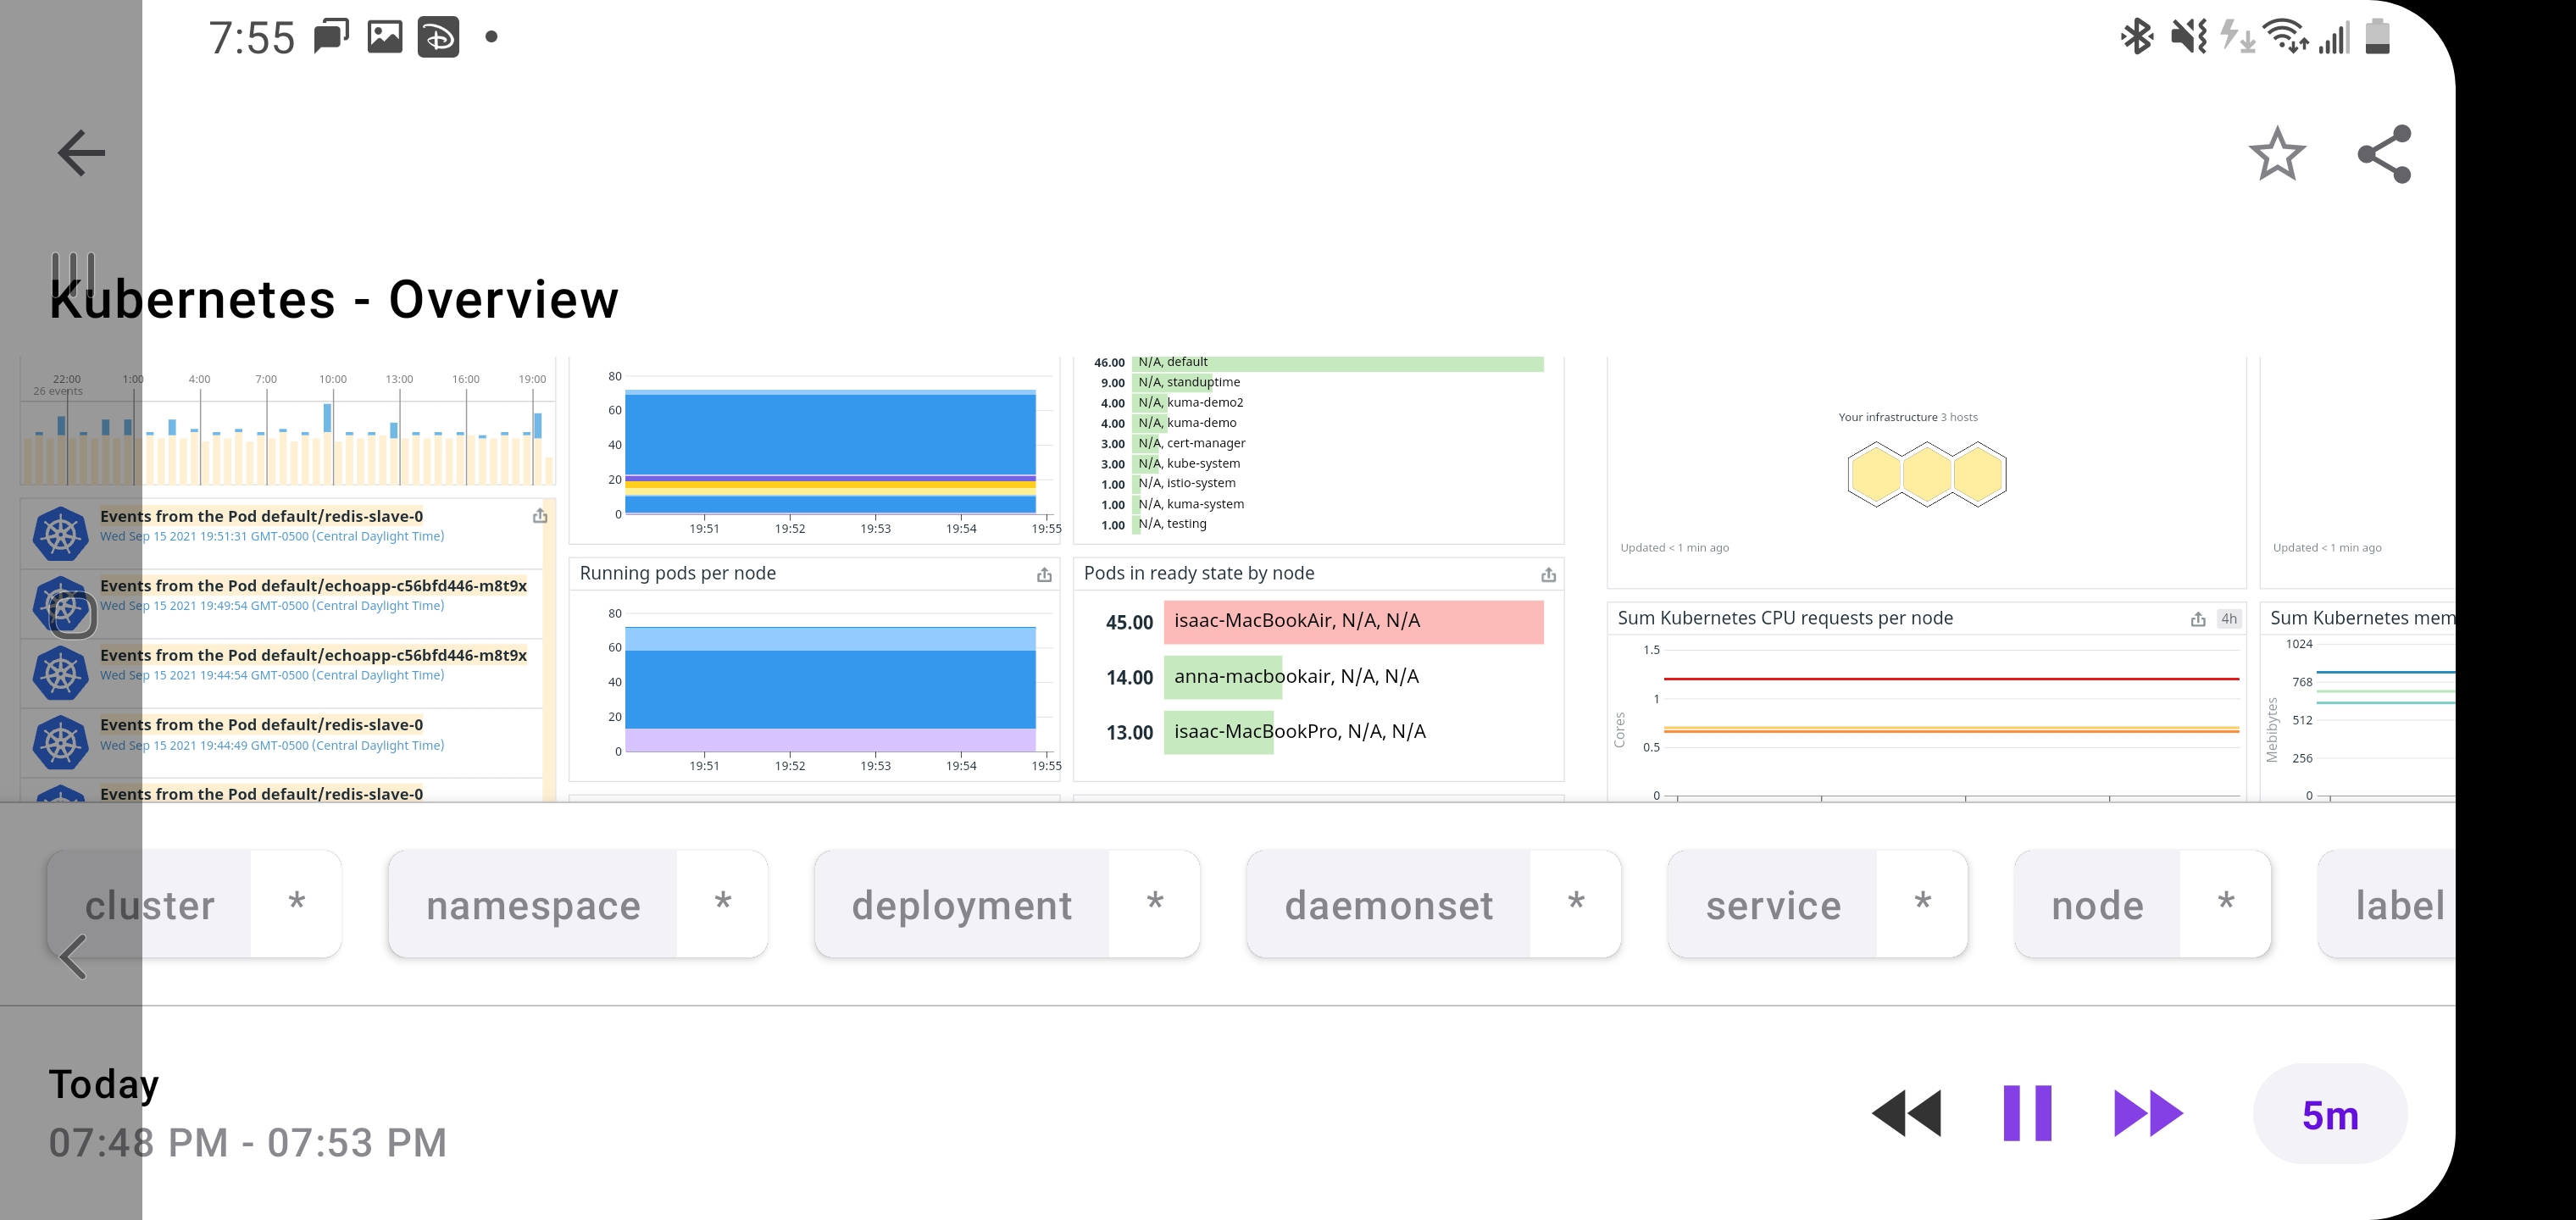
Pro-Tip: We can also bring up these dashboards on our phones with the App when on the go:
I wanted to check the error logs. Sometimes a noisy bugger is throwing errors:
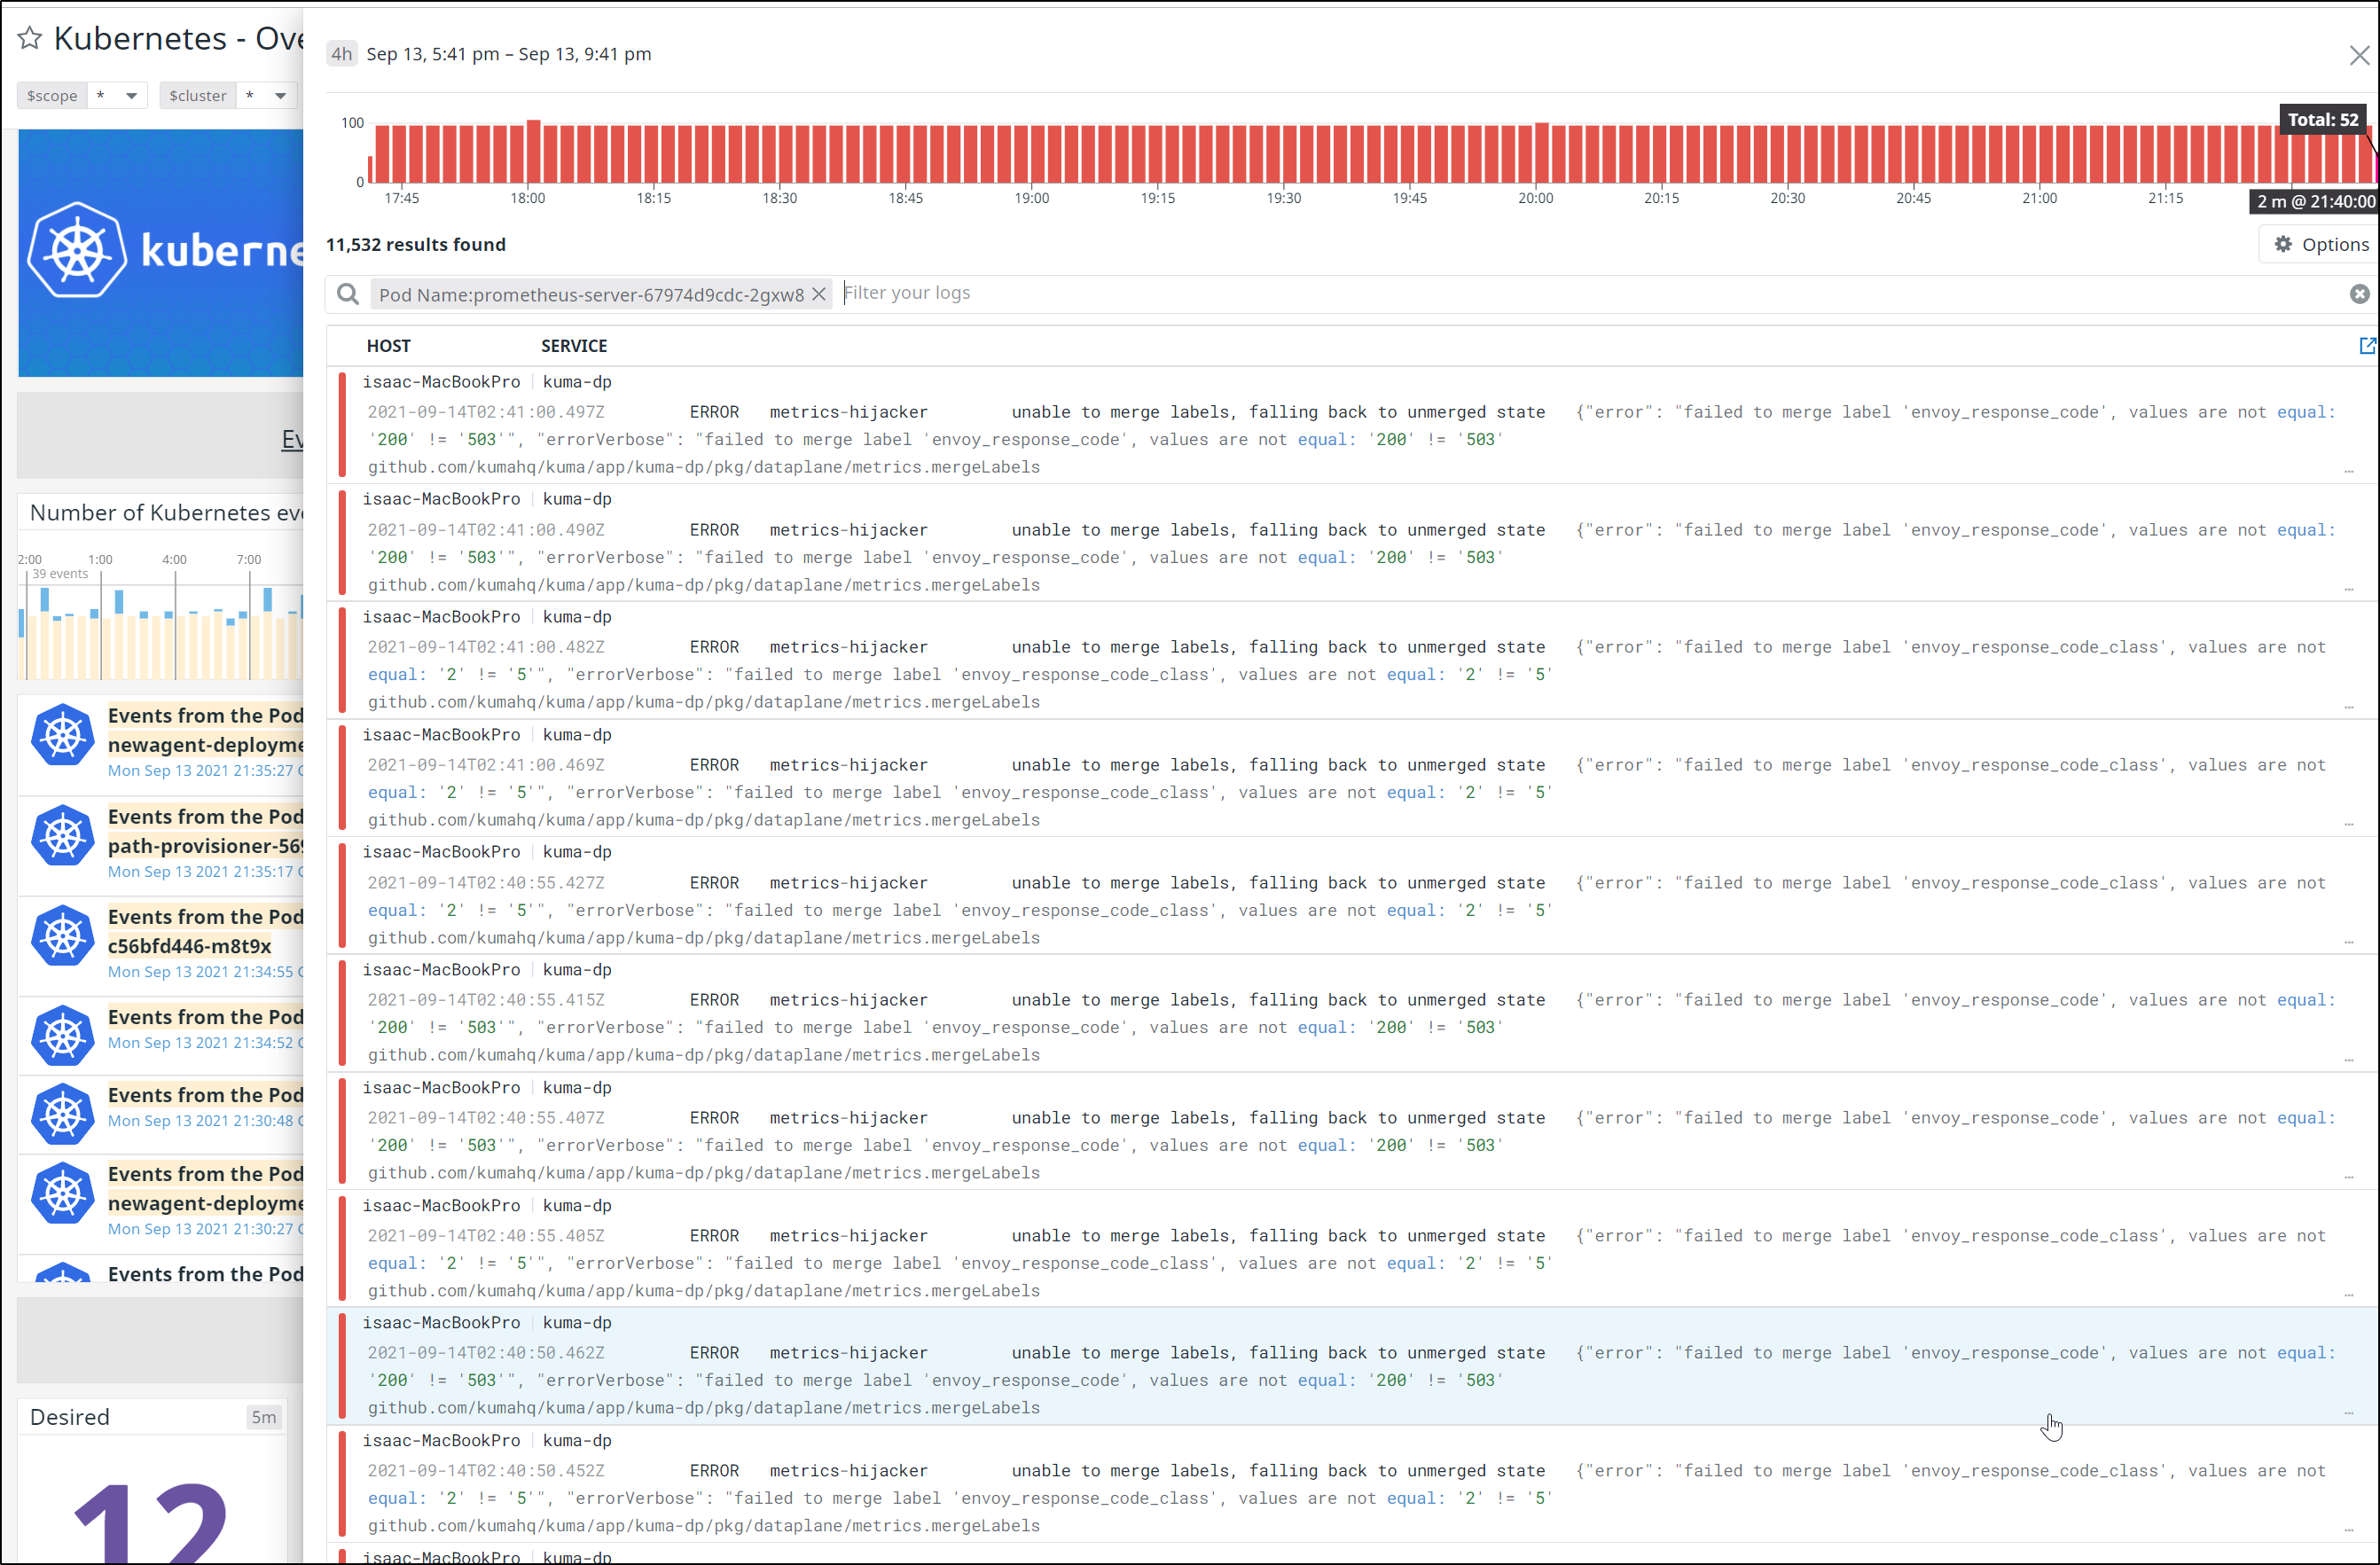
unmerged state	{"error": "failed to merge label 'envoy_response_code', values are not equal: '200' != '503'", "errorVerbose": "failed to merge label 'envoy_response_code', values are not equal: '200' != '503'
github.com/kumahq/kuma/app/kuma-dp/pkg/dataplane/metrics.mergeLabels
\t/home/circleci/project/app/kuma-dp/pkg/dataplane/metrics/merge.go:103
github.com/kumahq/kuma/app/kuma-dp/pkg/dataplane/metrics.merge
\t/home/circleci/project/app/kuma-dp/pkg/dataplane/metrics/merge.go:63
github.com/kumahq/kuma/app/kuma-dp/pkg/dataplane/metrics.MergeClusters
\t/home/circleci/project/app/kuma-dp/pkg/dataplane/metrics/merge.go:39
github.com/kumahq/kuma/app/kuma-dp/pkg/dataplane/metrics.(*Hijacker).ServeHTTP
\t/home/circleci/project/app/kuma-dp/pkg/dataplane/metrics/server.go:109
net/http.serverHandler.ServeHTTP
\t/home/circleci/go/src/net/http/server.go:2887
net/http.(*conn).serve
\t/home/circleci/go/src/net/http/server.go:1952
runtime.goexit
\t/home/circleci/go/src/runtime/asm_amd64.s:1371"}
The more I dug, the more I saw a large chunk of noise came from Prometheus, which we deployed with Kumamesh. Since I’m not actively using the service mesh and don’t plan to, it was then decided the best option would be to remove it.
Removing Kumamesh
First I needed to redownload the binary.
Downloading kuma-1.2.3 to match our deployment (see blog):
builder@DESKTOP-72D2D9T:~$ mv /mnt/c/Users/isaac/Downloads/kuma-1.2.3-ubuntu-amd64.tar.gz ./
builder@DESKTOP-72D2D9T:~$ tar -xzvf kuma-1.2.3-ubuntu-amd64.tar.gz
./
./kuma-1.2.3/
./kuma-1.2.3/README
./kuma-1.2.3/NOTICE
./kuma-1.2.3/install_missing_crds.sh
./kuma-1.2.3/NOTICE-kumactl
./kuma-1.2.3/LICENSE
./kuma-1.2.3/conf/
./kuma-1.2.3/conf/kuma-cp.conf.yml
./kuma-1.2.3/bin/
./kuma-1.2.3/bin/kuma-dp
./kuma-1.2.3/bin/kuma-prometheus-sd
./kuma-1.2.3/bin/kuma-cp
./kuma-1.2.3/bin/envoy
./kuma-1.2.3/bin/kumactl
./kuma-1.2.3/bin/coredns
Now as you recall, we installed the metrics portion of kuma mesh with an apply:
$ ./kuma-1.2.3/bin/kumactl install metrics | kubectl apply -f -
namespace/kuma-metrics created
podsecuritypolicy.policy/grafana created
serviceaccount/prometheus-alertmanager created
serviceaccount/prometheus-kube-state-metrics created
serviceaccount/prometheus-node-exporter created
serviceaccount/prometheus-pushgateway created
serviceaccount/prometheus-server created
serviceaccount/grafana created
configmap/grafana created
configmap/prometheus-alertmanager created
configmap/provisioning-datasource created
configmap/provisioning-dashboards created
configmap/prometheus-server created
configmap/provisioning-dashboards-0 created
configmap/provisioning-dashboards-1 created
configmap/provisioning-dashboards-2 created
configmap/provisioning-dashboards-3 created
configmap/provisioning-dashboards-4 created
persistentvolumeclaim/prometheus-alertmanager created
persistentvolumeclaim/prometheus-server created
clusterrole.rbac.authorization.k8s.io/grafana-clusterrole created
Warning: rbac.authorization.k8s.io/v1beta1 ClusterRole is deprecated in v1.17+, unavailable in v1.22+; use rbac.authorization.k8s.io/v1 ClusterRole
clusterrole.rbac.authorization.k8s.io/prometheus-alertmanager created
clusterrole.rbac.authorization.k8s.io/prometheus-kube-state-metrics created
clusterrole.rbac.authorization.k8s.io/prometheus-pushgateway created
clusterrole.rbac.authorization.k8s.io/prometheus-server created
clusterrolebinding.rbac.authorization.k8s.io/grafana-clusterrolebinding created
Warning: rbac.authorization.k8s.io/v1beta1 ClusterRoleBinding is deprecated in v1.17+, unavailable in v1.22+; use rbac.authorization.k8s.io/v1 ClusterRoleBinding
clusterrolebinding.rbac.authorization.k8s.io/prometheus-alertmanager created
clusterrolebinding.rbac.authorization.k8s.io/prometheus-kube-state-metrics created
clusterrolebinding.rbac.authorization.k8s.io/prometheus-pushgateway created
clusterrolebinding.rbac.authorization.k8s.io/prometheus-server created
Warning: rbac.authorization.k8s.io/v1beta1 Role is deprecated in v1.17+, unavailable in v1.22+; use rbac.authorization.k8s.io/v1 Role
role.rbac.authorization.k8s.io/grafana created
Warning: rbac.authorization.k8s.io/v1beta1 RoleBinding is deprecated in v1.17+, unavailable in v1.22+; use rbac.authorization.k8s.io/v1 RoleBinding
rolebinding.rbac.authorization.k8s.io/grafana created
service/grafana created
service/prometheus-alertmanager created
service/prometheus-kube-state-metrics created
service/prometheus-node-exporter created
service/prometheus-pushgateway created
service/prometheus-server created
daemonset.apps/prometheus-node-exporter created
deployment.apps/grafana created
deployment.apps/prometheus-alertmanager created
deployment.apps/prometheus-kube-state-metrics created
deployment.apps/prometheus-pushgateway created
deployment.apps/prometheus-server created
Let’s do the reverse;
$   ./kuma-1.2.3/bin/kumactl install metrics | kubectl delete -f -
WARNING: Unable to confirm the server supports this kumactl version
namespace "kuma-metrics" deleted
podsecuritypolicy.policy "grafana" deleted
serviceaccount "prometheus-alertmanager" deleted
serviceaccount "prometheus-kube-state-metrics" deleted
serviceaccount "prometheus-node-exporter" deleted
serviceaccount "prometheus-pushgateway" deleted
serviceaccount "prometheus-server" deleted
serviceaccount "grafana" deleted
configmap "grafana" deleted
configmap "prometheus-alertmanager" deleted
configmap "provisioning-datasource" deleted
configmap "provisioning-dashboards" deleted
configmap "prometheus-server" deleted
configmap "provisioning-dashboards-0" deleted
configmap "provisioning-dashboards-1" deleted
configmap "provisioning-dashboards-2" deleted
configmap "provisioning-dashboards-3" deleted
configmap "provisioning-dashboards-4" deleted
persistentvolumeclaim "prometheus-alertmanager" deleted
persistentvolumeclaim "prometheus-server" deleted
clusterrole.rbac.authorization.k8s.io "grafana-clusterrole" deleted
Warning: rbac.authorization.k8s.io/v1beta1 ClusterRole is deprecated in v1.17+, unavailable in v1.22+; use rbac.authorization.k8s.io/v1 ClusterRole
clusterrole.rbac.authorization.k8s.io "prometheus-alertmanager" deleted
clusterrole.rbac.authorization.k8s.io "prometheus-kube-state-metrics" deleted
clusterrole.rbac.authorization.k8s.io "prometheus-pushgateway" deleted
clusterrole.rbac.authorization.k8s.io "prometheus-server" deleted
clusterrolebinding.rbac.authorization.k8s.io "grafana-clusterrolebinding" deleted
Warning: rbac.authorization.k8s.io/v1beta1 ClusterRoleBinding is deprecated in v1.17+, unavailable in v1.22+; use rbac.authorization.k8s.io/v1 ClusterRoleBinding
clusterrolebinding.rbac.authorization.k8s.io "prometheus-alertmanager" deleted
clusterrolebinding.rbac.authorization.k8s.io "prometheus-kube-state-metrics" deleted
clusterrolebinding.rbac.authorization.k8s.io "prometheus-pushgateway" deleted
clusterrolebinding.rbac.authorization.k8s.io "prometheus-server" deleted
Warning: rbac.authorization.k8s.io/v1beta1 Role is deprecated in v1.17+, unavailable in v1.22+; use rbac.authorization.k8s.io/v1 Role
role.rbac.authorization.k8s.io "grafana" deleted
Warning: rbac.authorization.k8s.io/v1beta1 RoleBinding is deprecated in v1.17+, unavailable in v1.22+; use rbac.authorization.k8s.io/v1 RoleBinding
rolebinding.rbac.authorization.k8s.io "grafana" deleted
service "grafana" deleted
service "prometheus-alertmanager" deleted
service "prometheus-kube-state-metrics" deleted
service "prometheus-node-exporter" deleted
service "prometheus-pushgateway" deleted
service "prometheus-server" deleted
daemonset.apps "prometheus-node-exporter" deleted
deployment.apps "grafana" deleted
deployment.apps "prometheus-alertmanager" deleted
deployment.apps "prometheus-kube-state-metrics" deleted
deployment.apps "prometheus-pushgateway" deleted
deployment.apps "prometheus-server" deleted
We can see the results on the left graphs right away. A decrease in pods per namespace and node:

I checked the main node right after:
$ kubectl describe node isaac-macbookair
Name:               isaac-macbookair
Roles:              master
Labels:             beta.kubernetes.io/arch=amd64
                    beta.kubernetes.io/instance-type=k3s
                    beta.kubernetes.io/os=linux
                    k3s.io/hostname=isaac-macbookair
                    k3s.io/internal-ip=192.168.1.77
                    kubernetes.io/arch=amd64
                    kubernetes.io/hostname=isaac-macbookair
                    kubernetes.io/os=linux
                    node-role.kubernetes.io/master=true
                    node.kubernetes.io/instance-type=k3s
Annotations:        flannel.alpha.coreos.com/backend-data: {"VtepMAC":"22:ee:7b:23:07:17"}
                    flannel.alpha.coreos.com/backend-type: vxlan
                    flannel.alpha.coreos.com/kube-subnet-manager: true
                    flannel.alpha.coreos.com/public-ip: 192.168.1.77
                    k3s.io/node-args: ["server","--disable","traefik"]
                    k3s.io/node-config-hash: OHODIJ63LAVZLSEKQXPLUWENVVYMVG7OEAXDSRLXOHSZVZ5RV3DQ====
                    k3s.io/node-env:
                      {"K3S_DATA_DIR":"/var/lib/rancher/k3s/data/b9574be94e4edbdbb93a39a2cb1f4e4df3ba699171a8b86863d1e8c421c91f63","K3S_TOKEN":"********"}
                    node.alpha.kubernetes.io/ttl: 0
                    volumes.kubernetes.io/controller-managed-attach-detach: true
CreationTimestamp:  Sat, 26 Dec 2020 08:55:04 -0600
Taints:             <none>
Unschedulable:      false
Lease:
  HolderIdentity:  isaac-macbookair
  AcquireTime:     <unset>
  RenewTime:       Mon, 13 Sep 2021 22:00:06 -0500
Conditions:
  Type                 Status  LastHeartbeatTime                 LastTransitionTime                Reason                       Message
  ----                 ------  -----------------                 ------------------                ------                       -------
  NetworkUnavailable   False   Fri, 14 May 2021 17:51:08 -0500   Fri, 14 May 2021 17:51:08 -0500   FlannelIsUp                  Flannel is running on this node
  MemoryPressure       False   Mon, 13 Sep 2021 21:59:19 -0500   Wed, 01 Sep 2021 21:01:26 -0500   KubeletHasSufficientMemory   kubelet has sufficient memory available
  DiskPressure         False   Mon, 13 Sep 2021 21:59:19 -0500   Wed, 01 Sep 2021 21:01:26 -0500   KubeletHasNoDiskPressure     kubelet has no disk pressure
  PIDPressure          False   Mon, 13 Sep 2021 21:59:19 -0500   Wed, 01 Sep 2021 21:01:26 -0500   KubeletHasSufficientPID      kubelet has sufficient PID available
  Ready                True    Mon, 13 Sep 2021 21:59:19 -0500   Thu, 02 Sep 2021 03:54:21 -0500   KubeletReady                 kubelet is posting ready status. AppArmor enabled
Addresses:
  InternalIP:  192.168.1.77
  Hostname:    isaac-macbookair
Capacity:
  cpu:                4
  ephemeral-storage:  115587104Ki
  hugepages-2Mi:      0
  memory:             8057256Ki
  pods:               110
Allocatable:
  cpu:                4
  ephemeral-storage:  112443134684
  hugepages-2Mi:      0
  memory:             8057256Ki
  pods:               110
System Info:
  Machine ID:                 6c625fc1db184a97b858c78a095cef50
  System UUID:                4a9a013c-6cfe-6857-95bf-2be65a68f669
  Boot ID:                    29fdb914-29ea-4b5e-a9ae-cf3bd37ff5af
  Kernel Version:             5.4.0-58-generic
  OS Image:                   Ubuntu 20.04.1 LTS
  Operating System:           linux
  Architecture:               amd64
  Container Runtime Version:  containerd://1.4.3-k3s1
  Kubelet Version:            v1.19.5+k3s2
  Kube-Proxy Version:         v1.19.5+k3s2
PodCIDR:                      10.42.0.0/24
PodCIDRs:                     10.42.0.0/24
ProviderID:                   k3s://isaac-macbookair
Non-terminated Pods:          (53 in total)
  Namespace                   Name                                                     CPU Requests  CPU Limits  Memory Requests  Memory Limits  AGE
  ---------                   ----                                                     ------------  ----------  ---------------  -------------  ---
  default                     svclb-react-form-dpklg                                   0 (0%)        0 (0%)      0 (0%)           0 (0%)         158d
  default                     perl-debugger-5967f99ff6-c28zr                           0 (0%)        0 (0%)      0 (0%)           0 (0%)         43d
  default                     nodesqswatcher-deployment-67b65f645f-c8vd6               0 (0%)        0 (0%)      0 (0%)           0 (0%)         43d
  default                     mongo-x86-release-mongodb-7cb86d48f8-lcvb2               0 (0%)        0 (0%)      0 (0%)           0 (0%)         49d
  standuptime                 vote-back-myrelease1346-5b56967cd4-d6gkt                 0 (0%)        0 (0%)      0 (0%)           0 (0%)         43d
  default                     dapr-dashboard-6ff6f44778-qrdnd                          0 (0%)        0 (0%)      0 (0%)           0 (0%)         43d
  standuptime                 vote-front-myrelease1344-5f74d8468d-4rv29                250m (6%)     500m (12%)  0 (0%)           0 (0%)         112d
  default                     cm-acme-http-solver-6smb9                                10m (0%)      100m (2%)   64Mi (0%)        64Mi (0%)      98d
  testing                     azdo-nomad-deployment-5478fd77c5-r58tc                   0 (0%)        0 (0%)      0 (0%)           0 (0%)         43d
  default                     vote-back-azure-vote-1608995981-5df9f78fd8-fxpsp         0 (0%)        0 (0%)      0 (0%)           0 (0%)         49d
  standuptime                 azdo-chefdemo-deployment-568fb9f75f-np5sz                0 (0%)        0 (0%)      0 (0%)           0 (0%)         49d
  default                     harbor-registry-harbor-notary-server-779c6bddd5-rcdwz    0 (0%)        0 (0%)      0 (0%)           0 (0%)         49d
  default                     node-subscriber-5c75bfc99d-h5cg4                         0 (0%)        0 (0%)      0 (0%)           0 (0%)         43d
  default                     daprtweeter-deployment-68b49d6856-mg7bq                  0 (0%)        0 (0%)      0 (0%)           0 (0%)         43d
  default                     perl-subscriber-57778545dc-bhlrg                         0 (0%)        0 (0%)      0 (0%)           0 (0%)         43d
  default                     python-subscriber-7d7694f594-9b8zm                       0 (0%)        0 (0%)      0 (0%)           0 (0%)         43d
  default                     kubewatch-5d466cffc8-wlkng                               0 (0%)        0 (0%)      0 (0%)           0 (0%)         89d
  standuptime                 vote-front-myrelease1346-7d5b47c944-c8v8v                250m (6%)     500m (12%)  0 (0%)           0 (0%)         112d
  default                     busybox-6c446876c6-qvpfv                                 0 (0%)        0 (0%)      0 (0%)           0 (0%)         112d
  standuptime                 vote-front-mybluerelease-5c86c7bcd8-7qc5l                250m (6%)     500m (12%)  0 (0%)           0 (0%)         49d
  default                     vote-front-azure-vote-1608995981-588948447b-w4s4q        250m (6%)     500m (12%)  0 (0%)           0 (0%)         49d
  kube-system                 metrics-server-7b4f8b595-b4h2q                           0 (0%)        0 (0%)      0 (0%)           0 (0%)         43d
  default                     redis-master-0                                           0 (0%)        0 (0%)      0 (0%)           0 (0%)         112d
  standuptime                 vote-front-myrelease1347-584bdb996d-vzlmr                250m (6%)     500m (12%)  0 (0%)           0 (0%)         43d
  standuptime                 vote-back-mybluerelease-589c6cdb8d-fsvwk                 0 (0%)        0 (0%)      0 (0%)           0 (0%)         43d
  default                     harbor-registry-harbor-notary-signer-c97648889-gr6rd     0 (0%)        0 (0%)      0 (0%)           0 (0%)         49d
  standuptime                 vote-back-myrelease1347-b5484dbc4-j5hc8                  0 (0%)        0 (0%)      0 (0%)           0 (0%)         49d
  standuptime                 vote-back-myrelease1344-5f675b5fb4-q75rj                 0 (0%)        0 (0%)      0 (0%)           0 (0%)         112d
  default                     dapr-workflows-host-85d9d74777-mcq7n                     0 (0%)        0 (0%)      0 (0%)           0 (0%)         43d
  default                     docker-registry-6d9dc74c67-8vp68                         0 (0%)        0 (0%)      0 (0%)           0 (0%)         43d
  kube-system                 coredns-66c464876b-qkk6t                                 100m (2%)     0 (0%)      70Mi (0%)        170Mi (2%)     112d
  istio-system                kiali-5bfbd64d59-m5sfj                                   0 (0%)        0 (0%)      0 (0%)           0 (0%)         42d
  default                     nfs-client-provisioner-d54c468c4-vwzln                   0 (0%)        0 (0%)      0 (0%)           0 (0%)         49d
  kube-system                 local-path-provisioner-7ff9579c6-rbrqb                   0 (0%)        0 (0%)      0 (0%)           0 (0%)         112d
  default                     dapr-sidecar-injector-56b8954855-sqn8n                   0 (0%)        0 (0%)      0 (0%)           0 (0%)         43d
  cert-manager                cert-manager-86548b886-vhtwv                             0 (0%)        0 (0%)      0 (0%)           0 (0%)         43d
  default                     dapr-sentry-958fdd984-7cwrr                              0 (0%)        0 (0%)      0 (0%)           0 (0%)         99d
  cert-manager                cert-manager-webhook-578954cdd-9mhqz                     0 (0%)        0 (0%)      0 (0%)           0 (0%)         43d
  cert-manager                cert-manager-cainjector-6d59c8d4f7-tbp6k                 0 (0%)        0 (0%)      0 (0%)           0 (0%)         49d
  default                     dapr-operator-7867c79bf9-59ntm                           0 (0%)        0 (0%)      0 (0%)           0 (0%)         43d
  default                     otel-collector-67f645b9b7-8mkr6                          200m (5%)     1 (25%)     400Mi (5%)       2Gi (26%)      49d
  default                     k0s-master-76d596b48f-cq4gw                              0 (0%)        0 (0%)      0 (0%)           0 (0%)         49d
  default                     harbor-registry-harbor-exporter-655dd658bb-q5jhn         0 (0%)        0 (0%)      0 (0%)           0 (0%)         49d
  default                     my-release-ingress-nginx-controller-7978f85c6f-jcqhs     100m (2%)     0 (0%)      90Mi (1%)        0 (0%)         43d
  default                     harbor-registry-harbor-portal-76bdcc7969-2q8xv           0 (0%)        0 (0%)      0 (0%)           0 (0%)         43d
  default                     redis-slave-1                                            0 (0%)        0 (0%)      0 (0%)           0 (0%)         112d
  default                     harbor-registry-harbor-core-7b4594d78d-9x22l             0 (0%)        0 (0%)      0 (0%)           0 (0%)         43d
  default                     react-form-79c7989844-xj728                              0 (0%)        0 (0%)      0 (0%)           0 (0%)         99d
  default                     nodeeventwatcher-deployment-6dddc4858c-vjffp             0 (0%)        0 (0%)      0 (0%)           0 (0%)         85d
  default                     datadogrelease-c49d5                                     0 (0%)        0 (0%)      0 (0%)           0 (0%)         20d
  default                     echoapp-c56bfd446-m8t9x                                  0 (0%)        0 (0%)      0 (0%)           0 (0%)         96d
  local-path-storage          local-path-provisioner-5696dbb894-4n2wj                  0 (0%)        0 (0%)      0 (0%)           0 (0%)         112d
  standuptime                 azdo-newagent-deployment-5b6b489cb6-nls4b                0 (0%)        0 (0%)      0 (0%)           0 (0%)         49d
Allocated resources:
  (Total limits may be over 100 percent, i.e., overcommitted.)
  Resource           Requests     Limits
  --------           --------     ------
  cpu                1660m (41%)  3600m (90%)
  memory             624Mi (7%)   2282Mi (29%)
  ephemeral-storage  0 (0%)       0 (0%)
  hugepages-2Mi      0 (0%)       0 (0%)
Events:              <none>
and then again 5 hours later
$ kubectl describe node isaac-macbookair
Name:               isaac-macbookair
Roles:              master
Labels:             beta.kubernetes.io/arch=amd64
                    beta.kubernetes.io/instance-type=k3s
                    beta.kubernetes.io/os=linux
                    k3s.io/hostname=isaac-macbookair
                    k3s.io/internal-ip=192.168.1.77
                    kubernetes.io/arch=amd64
                    kubernetes.io/hostname=isaac-macbookair
                    kubernetes.io/os=linux
                    node-role.kubernetes.io/master=true
                    node.kubernetes.io/instance-type=k3s
Annotations:        flannel.alpha.coreos.com/backend-data: {"VtepMAC":"22:ee:7b:23:07:17"}
                    flannel.alpha.coreos.com/backend-type: vxlan
                    flannel.alpha.coreos.com/kube-subnet-manager: true
                    flannel.alpha.coreos.com/public-ip: 192.168.1.77
                    k3s.io/node-args: ["server","--disable","traefik"]
                    k3s.io/node-config-hash: OHODIJ63LAVZLSEKQXPLUWENVVYMVG7OEAXDSRLXOHSZVZ5RV3DQ====
                    k3s.io/node-env:
                      {"K3S_DATA_DIR":"/var/lib/rancher/k3s/data/b9574be94e4edbdbb93a39a2cb1f4e4df3ba699171a8b86863d1e8c421c91f63","K3S_TOKEN":"********"}
                    node.alpha.kubernetes.io/ttl: 0
                    volumes.kubernetes.io/controller-managed-attach-detach: true
CreationTimestamp:  Sat, 26 Dec 2020 08:55:04 -0600
Taints:             <none>
Unschedulable:      false
Lease:
  HolderIdentity:  isaac-macbookair
  AcquireTime:     <unset>
  RenewTime:       Tue, 14 Sep 2021 06:40:16 -0500
Conditions:
  Type                 Status  LastHeartbeatTime                 LastTransitionTime                Reason                       Message
  ----                 ------  -----------------                 ------------------                ------                       -------
  NetworkUnavailable   False   Fri, 14 May 2021 17:51:08 -0500   Fri, 14 May 2021 17:51:08 -0500   FlannelIsUp                  Flannel is running on this node
  MemoryPressure       False   Tue, 14 Sep 2021 06:38:43 -0500   Wed, 01 Sep 2021 21:01:26 -0500   KubeletHasSufficientMemory   kubelet has sufficient memory available
  DiskPressure         False   Tue, 14 Sep 2021 06:38:43 -0500   Wed, 01 Sep 2021 21:01:26 -0500   KubeletHasNoDiskPressure     kubelet has no disk pressure
  PIDPressure          False   Tue, 14 Sep 2021 06:38:43 -0500   Wed, 01 Sep 2021 21:01:26 -0500   KubeletHasSufficientPID      kubelet has sufficient PID available
  Ready                True    Tue, 14 Sep 2021 06:38:43 -0500   Thu, 02 Sep 2021 03:54:21 -0500   KubeletReady                 kubelet is posting ready status. AppArmor enabled
Addresses:
  InternalIP:  192.168.1.77
  Hostname:    isaac-macbookair
Capacity:
  cpu:                4
  ephemeral-storage:  115587104Ki
  hugepages-2Mi:      0
  memory:             8057256Ki
  pods:               110
Allocatable:
  cpu:                4
  ephemeral-storage:  112443134684
  hugepages-2Mi:      0
  memory:             8057256Ki
  pods:               110
System Info:
  Machine ID:                 6c625fc1db184a97b858c78a095cef50
  System UUID:                4a9a013c-6cfe-6857-95bf-2be65a68f669
  Boot ID:                    29fdb914-29ea-4b5e-a9ae-cf3bd37ff5af
  Kernel Version:             5.4.0-58-generic
  OS Image:                   Ubuntu 20.04.1 LTS
  Operating System:           linux
  Architecture:               amd64
  Container Runtime Version:  containerd://1.4.3-k3s1
  Kubelet Version:            v1.19.5+k3s2
  Kube-Proxy Version:         v1.19.5+k3s2
PodCIDR:                      10.42.0.0/24
PodCIDRs:                     10.42.0.0/24
ProviderID:                   k3s://isaac-macbookair
Non-terminated Pods:          (53 in total)
  Namespace                   Name                                                     CPU Requests  CPU Limits  Memory Requests  Memory Limits  AGE
  ---------                   ----                                                     ------------  ----------  ---------------  -------------  ---
  default                     svclb-react-form-dpklg                                   0 (0%)        0 (0%)      0 (0%)           0 (0%)         158d
  default                     perl-debugger-5967f99ff6-c28zr                           0 (0%)        0 (0%)      0 (0%)           0 (0%)         43d
  default                     nodesqswatcher-deployment-67b65f645f-c8vd6               0 (0%)        0 (0%)      0 (0%)           0 (0%)         43d
  default                     mongo-x86-release-mongodb-7cb86d48f8-lcvb2               0 (0%)        0 (0%)      0 (0%)           0 (0%)         49d
  standuptime                 vote-back-myrelease1346-5b56967cd4-d6gkt                 0 (0%)        0 (0%)      0 (0%)           0 (0%)         43d
  default                     dapr-dashboard-6ff6f44778-qrdnd                          0 (0%)        0 (0%)      0 (0%)           0 (0%)         43d
  standuptime                 vote-front-myrelease1344-5f74d8468d-4rv29                250m (6%)     500m (12%)  0 (0%)           0 (0%)         112d
  default                     cm-acme-http-solver-6smb9                                10m (0%)      100m (2%)   64Mi (0%)        64Mi (0%)      98d
  testing                     azdo-nomad-deployment-5478fd77c5-r58tc                   0 (0%)        0 (0%)      0 (0%)           0 (0%)         43d
  default                     vote-back-azure-vote-1608995981-5df9f78fd8-fxpsp         0 (0%)        0 (0%)      0 (0%)           0 (0%)         49d
  standuptime                 azdo-chefdemo-deployment-568fb9f75f-np5sz                0 (0%)        0 (0%)      0 (0%)           0 (0%)         49d
  default                     harbor-registry-harbor-notary-server-779c6bddd5-rcdwz    0 (0%)        0 (0%)      0 (0%)           0 (0%)         49d
  default                     node-subscriber-5c75bfc99d-h5cg4                         0 (0%)        0 (0%)      0 (0%)           0 (0%)         43d
  default                     daprtweeter-deployment-68b49d6856-mg7bq                  0 (0%)        0 (0%)      0 (0%)           0 (0%)         43d
  default                     perl-subscriber-57778545dc-bhlrg                         0 (0%)        0 (0%)      0 (0%)           0 (0%)         43d
  default                     python-subscriber-7d7694f594-9b8zm                       0 (0%)        0 (0%)      0 (0%)           0 (0%)         43d
  default                     kubewatch-5d466cffc8-wlkng                               0 (0%)        0 (0%)      0 (0%)           0 (0%)         89d
  standuptime                 vote-front-myrelease1346-7d5b47c944-c8v8v                250m (6%)     500m (12%)  0 (0%)           0 (0%)         112d
  default                     busybox-6c446876c6-qvpfv                                 0 (0%)        0 (0%)      0 (0%)           0 (0%)         112d
  standuptime                 vote-front-mybluerelease-5c86c7bcd8-7qc5l                250m (6%)     500m (12%)  0 (0%)           0 (0%)         49d
  default                     vote-front-azure-vote-1608995981-588948447b-w4s4q        250m (6%)     500m (12%)  0 (0%)           0 (0%)         49d
  kube-system                 metrics-server-7b4f8b595-b4h2q                           0 (0%)        0 (0%)      0 (0%)           0 (0%)         43d
  default                     redis-master-0                                           0 (0%)        0 (0%)      0 (0%)           0 (0%)         112d
  standuptime                 vote-front-myrelease1347-584bdb996d-vzlmr                250m (6%)     500m (12%)  0 (0%)           0 (0%)         43d
  standuptime                 vote-back-mybluerelease-589c6cdb8d-fsvwk                 0 (0%)        0 (0%)      0 (0%)           0 (0%)         43d
  default                     harbor-registry-harbor-notary-signer-c97648889-gr6rd     0 (0%)        0 (0%)      0 (0%)           0 (0%)         49d
  standuptime                 vote-back-myrelease1347-b5484dbc4-j5hc8                  0 (0%)        0 (0%)      0 (0%)           0 (0%)         49d
  standuptime                 vote-back-myrelease1344-5f675b5fb4-q75rj                 0 (0%)        0 (0%)      0 (0%)           0 (0%)         112d
  default                     dapr-workflows-host-85d9d74777-mcq7n                     0 (0%)        0 (0%)      0 (0%)           0 (0%)         43d
  default                     docker-registry-6d9dc74c67-8vp68                         0 (0%)        0 (0%)      0 (0%)           0 (0%)         43d
  kube-system                 coredns-66c464876b-qkk6t                                 100m (2%)     0 (0%)      70Mi (0%)        170Mi (2%)     112d
  istio-system                kiali-5bfbd64d59-m5sfj                                   0 (0%)        0 (0%)      0 (0%)           0 (0%)         42d
  default                     nfs-client-provisioner-d54c468c4-vwzln                   0 (0%)        0 (0%)      0 (0%)           0 (0%)         49d
  kube-system                 local-path-provisioner-7ff9579c6-rbrqb                   0 (0%)        0 (0%)      0 (0%)           0 (0%)         112d
  default                     dapr-sidecar-injector-56b8954855-sqn8n                   0 (0%)        0 (0%)      0 (0%)           0 (0%)         43d
  cert-manager                cert-manager-86548b886-vhtwv                             0 (0%)        0 (0%)      0 (0%)           0 (0%)         43d
  default                     dapr-sentry-958fdd984-7cwrr                              0 (0%)        0 (0%)      0 (0%)           0 (0%)         99d
  cert-manager                cert-manager-webhook-578954cdd-9mhqz                     0 (0%)        0 (0%)      0 (0%)           0 (0%)         43d
  cert-manager                cert-manager-cainjector-6d59c8d4f7-tbp6k                 0 (0%)        0 (0%)      0 (0%)           0 (0%)         49d
  default                     dapr-operator-7867c79bf9-59ntm                           0 (0%)        0 (0%)      0 (0%)           0 (0%)         43d
  default                     otel-collector-67f645b9b7-8mkr6                          200m (5%)     1 (25%)     400Mi (5%)       2Gi (26%)      49d
  default                     k0s-master-76d596b48f-cq4gw                              0 (0%)        0 (0%)      0 (0%)           0 (0%)         49d
  default                     harbor-registry-harbor-exporter-655dd658bb-q5jhn         0 (0%)        0 (0%)      0 (0%)           0 (0%)         49d
  default                     my-release-ingress-nginx-controller-7978f85c6f-jcqhs     100m (2%)     0 (0%)      90Mi (1%)        0 (0%)         43d
  default                     harbor-registry-harbor-portal-76bdcc7969-2q8xv           0 (0%)        0 (0%)      0 (0%)           0 (0%)         43d
  default                     redis-slave-1                                            0 (0%)        0 (0%)      0 (0%)           0 (0%)         112d
  default                     harbor-registry-harbor-core-7b4594d78d-9x22l             0 (0%)        0 (0%)      0 (0%)           0 (0%)         43d
  default                     react-form-79c7989844-xj728                              0 (0%)        0 (0%)      0 (0%)           0 (0%)         99d
  default                     nodeeventwatcher-deployment-6dddc4858c-vjffp             0 (0%)        0 (0%)      0 (0%)           0 (0%)         85d
  default                     datadogrelease-c49d5                                     0 (0%)        0 (0%)      0 (0%)           0 (0%)         20d
  default                     echoapp-c56bfd446-m8t9x                                  0 (0%)        0 (0%)      0 (0%)           0 (0%)         96d
  standuptime                 azdo-newagent-deployment-5b6b489cb6-nls4b                0 (0%)        0 (0%)      0 (0%)           0 (0%)         49d
  local-path-storage          local-path-provisioner-5696dbb894-4n2wj                  0 (0%)        0 (0%)      0 (0%)           0 (0%)         112d
Allocated resources:
  (Total limits may be over 100 percent, i.e., overcommitted.)
  Resource           Requests     Limits
  --------           --------     ------
  cpu                1660m (41%)  3600m (90%)
  memory             624Mi (7%)   2282Mi (29%)
  ephemeral-storage  0 (0%)       0 (0%)
  hugepages-2Mi      0 (0%)       0 (0%)
Events:              <none>
I am still worried about that 90% CPU.
This is a Macbook Air. It doesn’t exactly have *“server class cooling.
We can see from the list all the pods that have high CPU usage.. This is my concern more than anything:
  Namespace                   Name                                                     CPU Requests  CPU Limits  Memory Requests  Memory Limits  AGE
  ---------                   ----                                                     ------------  ----------  ---------------  -------------  ---
  standuptime                 vote-front-myrelease1344-5f74d8468d-4rv29                250m (6%)     500m (12%)  0 (0%)           0 (0%)         112d
  default                     cm-acme-http-solver-6smb9                                10m (0%)      100m (2%)   64Mi (0%)        64Mi (0%)      98d
  standuptime                 vote-front-myrelease1346-7d5b47c944-c8v8v                250m (6%)     500m (12%)  0 (0%)           0 (0%)         112d
  standuptime                 vote-front-mybluerelease-5c86c7bcd8-7qc5l                250m (6%)     500m (12%)  0 (0%)           0 (0%)         49d
  default                     vote-front-azure-vote-1608995981-588948447b-w4s4q        250m (6%)     500m (12%)  0 (0%)           0 (0%)         49d
  standuptime                 vote-front-myrelease1347-584bdb996d-vzlmr                250m (6%)     500m (12%)  0 (0%)           0 (0%)         43d
  kube-system                 coredns-66c464876b-qkk6t                                 100m (2%)     0 (0%)      70Mi (0%)        170Mi (2%)     112d
  default                     otel-collector-67f645b9b7-8mkr6                          200m (5%)     1 (25%)     400Mi (5%)       2Gi (26%)      49d
  default                     my-release-ingress-nginx-controller-7978f85c6f-jcqhs     100m (2%)     0 (0%)      90Mi (1%)        0 (0%)         43d
some of these are important and I would rather not restart them. But the “vote” apps are of little import and can be rotated.
more cleanup
Let’s first try cycling the larger CPU consuming pods.
As an aside, we can get all the pods running just on this node with a field selector kubectl query:
$ kubectl get pods --all-namespaces -o wide --field-selector spec.nodeName=isaac-macbookair
NAMESPACE            NAME                                                    READY   STATUS             RESTARTS   AGE    IP            NODE               NOMINATED NODE   READINESS GATES
default              svclb-react-form-dpklg                                  1/1     Running            0          164d   10.42.0.110   isaac-macbookair   <none>           <none>
default              perl-debugger-5967f99ff6-c28zr                          1/1     Running            0          50d    10.42.0.165   isaac-macbookair   <none>           <none>
default              nodesqswatcher-deployment-67b65f645f-c8vd6              1/1     Running            0          50d    10.42.0.163   isaac-macbookair   <none>           <none>
default              mongo-x86-release-mongodb-7cb86d48f8-lcvb2              1/1     Running            0          56d    10.42.0.147   isaac-macbookair   <none>           <none>
standuptime          vote-back-myrelease1346-5b56967cd4-d6gkt                1/1     Running            0          50d    10.42.0.160   isaac-macbookair   <none>           <none>
default              dapr-dashboard-6ff6f44778-qrdnd                         1/1     Running            0          50d    10.42.0.161   isaac-macbookair   <none>           <none>
standuptime          vote-front-myrelease1344-5f74d8468d-4rv29               1/1     Running            0          119d   10.42.0.105   isaac-macbookair   <none>           <none>
default              cm-acme-http-solver-6smb9                               1/1     Running            0          104d   10.42.0.119   isaac-macbookair   <none>           <none>
testing              azdo-nomad-deployment-5478fd77c5-r58tc                  1/1     Running            0          50d    10.42.0.178   isaac-macbookair   <none>           <none>
default              vote-back-azure-vote-1608995981-5df9f78fd8-fxpsp        1/1     Running            0          56d    10.42.0.145   isaac-macbookair   <none>           <none>
standuptime          azdo-chefdemo-deployment-568fb9f75f-np5sz               1/1     Running            0          56d    10.42.0.141   isaac-macbookair   <none>           <none>
default              harbor-registry-harbor-notary-server-779c6bddd5-rcdwz   1/1     Running            128        56d    10.42.0.146   isaac-macbookair   <none>           <none>
default              node-subscriber-5c75bfc99d-h5cg4                        1/1     Running            0          50d    10.42.0.162   isaac-macbookair   <none>           <none>
default              daprtweeter-deployment-68b49d6856-mg7bq                 1/1     Running            0          50d    10.42.0.174   isaac-macbookair   <none>           <none>
default              perl-subscriber-57778545dc-bhlrg                        1/1     Running            0          50d    10.42.0.176   isaac-macbookair   <none>           <none>
default              python-subscriber-7d7694f594-9b8zm                      1/1     Running            0          50d    10.42.0.177   isaac-macbookair   <none>           <none>
default              kubewatch-5d466cffc8-wlkng                              1/1     Running            0          95d    10.42.0.128   isaac-macbookair   <none>           <none>
standuptime          vote-front-myrelease1346-7d5b47c944-c8v8v               1/1     Running            0          119d   10.42.0.96    isaac-macbookair   <none>           <none>
default              busybox-6c446876c6-qvpfv                                1/1     Running            0          119d   10.42.0.104   isaac-macbookair   <none>           <none>
standuptime          vote-front-mybluerelease-5c86c7bcd8-7qc5l               1/1     Running            0          56d    10.42.0.151   isaac-macbookair   <none>           <none>
default              vote-front-azure-vote-1608995981-588948447b-w4s4q       1/1     Running            0          56d    10.42.0.143   isaac-macbookair   <none>           <none>
kube-system          metrics-server-7b4f8b595-b4h2q                          1/1     Running            21         50d    10.42.0.156   isaac-macbookair   <none>           <none>
default              redis-master-0                                          1/1     Running            0          119d   10.42.0.107   isaac-macbookair   <none>           <none>
standuptime          vote-front-myrelease1347-584bdb996d-vzlmr               1/1     Running            0          50d    10.42.0.170   isaac-macbookair   <none>           <none>
standuptime          vote-back-mybluerelease-589c6cdb8d-fsvwk                1/1     Running            0          50d    10.42.0.158   isaac-macbookair   <none>           <none>
default              harbor-registry-harbor-notary-signer-c97648889-gr6rd    1/1     Running            128        56d    10.42.0.153   isaac-macbookair   <none>           <none>
standuptime          vote-back-myrelease1347-b5484dbc4-j5hc8                 1/1     Running            0          56d    10.42.0.142   isaac-macbookair   <none>           <none>
standuptime          vote-back-myrelease1344-5f675b5fb4-q75rj                1/1     Running            0          119d   10.42.0.98    isaac-macbookair   <none>           <none>
default              dapr-workflows-host-85d9d74777-mcq7n                    1/1     Running            0          50d    10.42.0.171   isaac-macbookair   <none>           <none>
default              docker-registry-6d9dc74c67-8vp68                        1/1     Running            19         50d    10.42.0.168   isaac-macbookair   <none>           <none>
kube-system          coredns-66c464876b-qkk6t                                1/1     Running            16         119d   10.42.0.99    isaac-macbookair   <none>           <none>
istio-system         kiali-5bfbd64d59-m5sfj                                  1/1     Running            15         49d    10.42.0.179   isaac-macbookair   <none>           <none>
default              nfs-client-provisioner-d54c468c4-vwzln                  1/1     Running            10         56d    10.42.0.148   isaac-macbookair   <none>           <none>
kube-system          local-path-provisioner-7ff9579c6-rbrqb                  1/1     Running            54         119d   10.42.0.103   isaac-macbookair   <none>           <none>
default              dapr-sidecar-injector-56b8954855-sqn8n                  1/1     Running            47         50d    10.42.0.164   isaac-macbookair   <none>           <none>
cert-manager         cert-manager-86548b886-vhtwv                            1/1     Running            11         50d    10.42.0.172   isaac-macbookair   <none>           <none>
default              dapr-sentry-958fdd984-7cwrr                             1/1     Running            20         106d   10.42.0.116   isaac-macbookair   <none>           <none>
cert-manager         cert-manager-webhook-578954cdd-9mhqz                    1/1     Running            22         50d    10.42.0.173   isaac-macbookair   <none>           <none>
cert-manager         cert-manager-cainjector-6d59c8d4f7-tbp6k                1/1     Running            55         56d    10.42.0.144   isaac-macbookair   <none>           <none>
default              dapr-operator-7867c79bf9-59ntm                          1/1     Running            59         50d    10.42.0.157   isaac-macbookair   <none>           <none>
default              otel-collector-67f645b9b7-8mkr6                         1/1     Running            23         56d    10.42.0.155   isaac-macbookair   <none>           <none>
default              k0s-master-76d596b48f-cq4gw                             1/1     Running            1          56d    10.42.0.152   isaac-macbookair   <none>           <none>
default              harbor-registry-harbor-exporter-655dd658bb-q5jhn        1/1     Running            127        56d    10.42.0.149   isaac-macbookair   <none>           <none>
default              my-release-ingress-nginx-controller-7978f85c6f-jcqhs    1/1     Running            44         50d    10.42.0.169   isaac-macbookair   <none>           <none>
default              harbor-registry-harbor-portal-76bdcc7969-2q8xv          1/1     Running            12         50d    10.42.0.175   isaac-macbookair   <none>           <none>
default              redis-slave-1                                           1/1     Running            4          119d   10.42.0.109   isaac-macbookair   <none>           <none>
default              harbor-registry-harbor-core-7b4594d78d-9x22l            1/1     Running            1988       50d    10.42.0.166   isaac-macbookair   <none>           <none>
default              react-form-79c7989844-xj728                             2/2     Running            24         106d   10.42.0.117   isaac-macbookair   <none>           <none>
default              nodeeventwatcher-deployment-6dddc4858c-vjffp            2/2     Running            24         92d    10.42.0.129   isaac-macbookair   <none>           <none>
default              datadogrelease-c49d5                                    3/3     Running            4          27d    10.42.0.184   isaac-macbookair   <none>           <none>
default              echoapp-c56bfd446-m8t9x                                 2/2     Running            769        102d   10.42.0.122   isaac-macbookair   <none>           <none>
standuptime          azdo-newagent-deployment-5b6b489cb6-nls4b               0/1     CrashLoopBackOff   15735      56d    10.42.0.150   isaac-macbookair   <none>           <none>
local-path-storage   local-path-provisioner-5696dbb894-4n2wj                 0/1     CrashLoopBackOff   33587      119d   10.42.0.101   isaac-macbookair   <none>           <none>
Cleaning Failed Pods/Deployments
The other issue I see as an issue are the two failing pods:
standuptime          azdo-newagent-deployment-5b6b489cb6-nls4b               0/1     CrashLoopBackOff   15735      56d    10.42.0.150   isaac-macbookair   <none>           <none>
local-path-storage   local-path-provisioner-5696dbb894-4n2wj                 0/1     CrashLoopBackOff   33587      119d   10.42.0.101   isaac-macbookair   <none>           <none>
We can see we already have a local-path-provisioner setup in kube-system:
$ kubectl get pods --all-namespaces | grep local-path
kube-system          local-path-provisioner-7ff9579c6-rbrqb                  1/1     Running             54         119d
local-path-storage   local-path-provisioner-5696dbb894-4n2wj                 0/1     CrashLoopBackOff    33589      119d
Looks like there is app label on the failing:
$ kubectl describe pod local-path-provisioner-5696dbb894-4n2wj -n local-path-storage | grep app
Labels:       app=local-path-provisioner
Let’s clean that one first, since it clearly is unused and just failing. I like to back up deployments first.
$ kubectl get deployments -n local-path-storage
NAME                     READY   UP-TO-DATE   AVAILABLE   AGE
local-path-provisioner   0/1     1            0           261d

$ kubectl get deployment local-path-provisioner -n local-path-storage -o yaml > lpp-dep-local-path-storage.yaml
$ kubectl get cm local-path-config -n local-path-storage -o yaml > cm-lpc-local-path-storage.yaml

$ kubectl delete deployment  local-path-provisioner -n local-path-storage
deployment.apps "local-path-provisioner" deleted
Let’s remove that AzDO agent. It’s not working and not needed right now. When it comes time to redeploy, i’ll likely use fresh a fresh PAT and Helm deploy.
I quick check on helm deploys there first
$ helm list -n standuptime
NAME            NAMESPACE       REVISION        UPDATED                                 STATUS          CHART                                                                                                                           APP VERSION
mybluerelease   standuptime     4               2021-03-03 02:46:19.788962887 +0000 UTC deployed        azure-vote-0.1.1
myrelease1344   standuptime     1               2021-03-03 02:58:52.295009216 +0000 UTC deployed        azure-vote-0.1.1
myrelease1346   standuptime     1               2021-03-03 03:11:30.336257423 +0000 UTC deployed        azure-vote-0.1.1
myrelease1347   standuptime     1               2021-03-03 03:13:25.38505445 +0000 UTC  deployed        azure-vote-0.1.1
Must have done as YAML Deployment
$ kubectl get deployment -n standuptime | grep azdo
azdo-chefdemo-deployment   1/1     1            1           216d
azdo-newagent-deployment   0/1     1            0           256d
Then backup and delete
$ kubectl get deployment azdo-newagent-deployment -n standuptime -o yaml > anad-standuptime.yaml
$ kubectl delete deployment azdo-newagent-deployment -n standuptime
deployment.apps "azdo-newagent-deployment" deleted
Checking the pods on the overloaded node, we see the failed ones are gone now:
$ kubectl get pods --all-namespaces -o wide --field-selector spec.nodeName=isaac-macbookair
NAMESPACE      NAME                                                    READY   STATUS    RESTARTS   AGE    IP            NODE               NOMINATED NODE   READINESS GATES
default        svclb-react-form-dpklg                                  1/1     Running   0          164d   10.42.0.110   isaac-macbookair   <none>           <none>
default        perl-debugger-5967f99ff6-c28zr                          1/1     Running   0          50d    10.42.0.165   isaac-macbookair   <none>           <none>
default        nodesqswatcher-deployment-67b65f645f-c8vd6              1/1     Running   0          50d    10.42.0.163   isaac-macbookair   <none>           <none>
default        mongo-x86-release-mongodb-7cb86d48f8-lcvb2              1/1     Running   0          56d    10.42.0.147   isaac-macbookair   <none>           <none>
standuptime    vote-back-myrelease1346-5b56967cd4-d6gkt                1/1     Running   0          50d    10.42.0.160   isaac-macbookair   <none>           <none>
default        dapr-dashboard-6ff6f44778-qrdnd                         1/1     Running   0          50d    10.42.0.161   isaac-macbookair   <none>           <none>
standuptime    vote-front-myrelease1344-5f74d8468d-4rv29               1/1     Running   0          119d   10.42.0.105   isaac-macbookair   <none>           <none>
default        cm-acme-http-solver-6smb9                               1/1     Running   0          104d   10.42.0.119   isaac-macbookair   <none>           <none>
testing        azdo-nomad-deployment-5478fd77c5-r58tc                  1/1     Running   0          50d    10.42.0.178   isaac-macbookair   <none>           <none>
default        vote-back-azure-vote-1608995981-5df9f78fd8-fxpsp        1/1     Running   0          56d    10.42.0.145   isaac-macbookair   <none>           <none>
standuptime    azdo-chefdemo-deployment-568fb9f75f-np5sz               1/1     Running   0          56d    10.42.0.141   isaac-macbookair   <none>           <none>
default        harbor-registry-harbor-notary-server-779c6bddd5-rcdwz   1/1     Running   128        56d    10.42.0.146   isaac-macbookair   <none>           <none>
default        node-subscriber-5c75bfc99d-h5cg4                        1/1     Running   0          50d    10.42.0.162   isaac-macbookair   <none>           <none>
default        daprtweeter-deployment-68b49d6856-mg7bq                 1/1     Running   0          50d    10.42.0.174   isaac-macbookair   <none>           <none>
default        perl-subscriber-57778545dc-bhlrg                        1/1     Running   0          50d    10.42.0.176   isaac-macbookair   <none>           <none>
default        python-subscriber-7d7694f594-9b8zm                      1/1     Running   0          50d    10.42.0.177   isaac-macbookair   <none>           <none>
default        kubewatch-5d466cffc8-wlkng                              1/1     Running   0          95d    10.42.0.128   isaac-macbookair   <none>           <none>
standuptime    vote-front-myrelease1346-7d5b47c944-c8v8v               1/1     Running   0          119d   10.42.0.96    isaac-macbookair   <none>           <none>
default        busybox-6c446876c6-qvpfv                                1/1     Running   0          119d   10.42.0.104   isaac-macbookair   <none>           <none>
standuptime    vote-front-mybluerelease-5c86c7bcd8-7qc5l               1/1     Running   0          56d    10.42.0.151   isaac-macbookair   <none>           <none>
default        vote-front-azure-vote-1608995981-588948447b-w4s4q       1/1     Running   0          56d    10.42.0.143   isaac-macbookair   <none>           <none>
kube-system    metrics-server-7b4f8b595-b4h2q                          1/1     Running   21         50d    10.42.0.156   isaac-macbookair   <none>           <none>
default        redis-master-0                                          1/1     Running   0          119d   10.42.0.107   isaac-macbookair   <none>           <none>
standuptime    vote-front-myrelease1347-584bdb996d-vzlmr               1/1     Running   0          50d    10.42.0.170   isaac-macbookair   <none>           <none>
standuptime    vote-back-mybluerelease-589c6cdb8d-fsvwk                1/1     Running   0          50d    10.42.0.158   isaac-macbookair   <none>           <none>
default        harbor-registry-harbor-notary-signer-c97648889-gr6rd    1/1     Running   128        56d    10.42.0.153   isaac-macbookair   <none>           <none>
standuptime    vote-back-myrelease1347-b5484dbc4-j5hc8                 1/1     Running   0          56d    10.42.0.142   isaac-macbookair   <none>           <none>
standuptime    vote-back-myrelease1344-5f675b5fb4-q75rj                1/1     Running   0          119d   10.42.0.98    isaac-macbookair   <none>           <none>
default        dapr-workflows-host-85d9d74777-mcq7n                    1/1     Running   0          50d    10.42.0.171   isaac-macbookair   <none>           <none>
default        docker-registry-6d9dc74c67-8vp68                        1/1     Running   19         50d    10.42.0.168   isaac-macbookair   <none>           <none>
kube-system    coredns-66c464876b-qkk6t                                1/1     Running   16         119d   10.42.0.99    isaac-macbookair   <none>           <none>
istio-system   kiali-5bfbd64d59-m5sfj                                  1/1     Running   15         49d    10.42.0.179   isaac-macbookair   <none>           <none>
default        nfs-client-provisioner-d54c468c4-vwzln                  1/1     Running   10         56d    10.42.0.148   isaac-macbookair   <none>           <none>
kube-system    local-path-provisioner-7ff9579c6-rbrqb                  1/1     Running   54         119d   10.42.0.103   isaac-macbookair   <none>           <none>
default        dapr-sidecar-injector-56b8954855-sqn8n                  1/1     Running   47         50d    10.42.0.164   isaac-macbookair   <none>           <none>
cert-manager   cert-manager-86548b886-vhtwv                            1/1     Running   11         50d    10.42.0.172   isaac-macbookair   <none>           <none>
default        dapr-sentry-958fdd984-7cwrr                             1/1     Running   20         106d   10.42.0.116   isaac-macbookair   <none>           <none>
cert-manager   cert-manager-webhook-578954cdd-9mhqz                    1/1     Running   22         50d    10.42.0.173   isaac-macbookair   <none>           <none>
cert-manager   cert-manager-cainjector-6d59c8d4f7-tbp6k                1/1     Running   55         56d    10.42.0.144   isaac-macbookair   <none>           <none>
default        dapr-operator-7867c79bf9-59ntm                          1/1     Running   59         50d    10.42.0.157   isaac-macbookair   <none>           <none>
default        otel-collector-67f645b9b7-8mkr6                         1/1     Running   23         56d    10.42.0.155   isaac-macbookair   <none>           <none>
default        k0s-master-76d596b48f-cq4gw                             1/1     Running   1          56d    10.42.0.152   isaac-macbookair   <none>           <none>
default        harbor-registry-harbor-exporter-655dd658bb-q5jhn        1/1     Running   127        56d    10.42.0.149   isaac-macbookair   <none>           <none>
default        my-release-ingress-nginx-controller-7978f85c6f-jcqhs    1/1     Running   44         50d    10.42.0.169   isaac-macbookair   <none>           <none>
default        harbor-registry-harbor-portal-76bdcc7969-2q8xv          1/1     Running   12         50d    10.42.0.175   isaac-macbookair   <none>           <none>
default        redis-slave-1                                           1/1     Running   4          119d   10.42.0.109   isaac-macbookair   <none>           <none>
default        harbor-registry-harbor-core-7b4594d78d-9x22l            1/1     Running   1988       50d    10.42.0.166   isaac-macbookair   <none>           <none>
default        react-form-79c7989844-xj728                             2/2     Running   24         106d   10.42.0.117   isaac-macbookair   <none>           <none>
default        nodeeventwatcher-deployment-6dddc4858c-vjffp            2/2     Running   24         92d    10.42.0.129   isaac-macbookair   <none>           <none>
default        datadogrelease-c49d5                                    3/3     Running   4          27d    10.42.0.184   isaac-macbookair   <none>           <none>
default        echoapp-c56bfd446-m8t9x                                 2/2     Running   769        102d   10.42.0.122   isaac-macbookair   <none>           <none>
rotating pods
We already determined the heavy load comes from these:
  standuptime                 vote-front-myrelease1344-5f74d8468d-4rv29                250m (6%)     500m (12%)  0 (0%)           0 (0%)         112d
  default                     cm-acme-http-solver-6smb9                                10m (0%)      100m (2%)   64Mi (0%)        64Mi (0%)      98d
  standuptime                 vote-front-myrelease1346-7d5b47c944-c8v8v                250m (6%)     500m (12%)  0 (0%)           0 (0%)         112d
  standuptime                 vote-front-mybluerelease-5c86c7bcd8-7qc5l                250m (6%)     500m (12%)  0 (0%)           0 (0%)         49d
  default                     vote-front-azure-vote-1608995981-588948447b-w4s4q        250m (6%)     500m (12%)  0 (0%)           0 (0%)         49d
  standuptime                 vote-front-myrelease1347-584bdb996d-vzlmr                250m (6%)     500m (12%)  0 (0%)           0 (0%)         43d
  kube-system                 coredns-66c464876b-qkk6t                                 100m (2%)     0 (0%)      70Mi (0%)        170Mi (2%)     112d
  default                     otel-collector-67f645b9b7-8mkr6                          200m (5%)     1 (25%)     400Mi (5%)       2Gi (26%)      49d
  default                     my-release-ingress-nginx-controller-7978f85c6f-jcqhs     100m (2%)     0 (0%)      90Mi (1%)        0 (0%)         43d
We can easily craft a line to cycle the pods that arent critical:
We can see the full set of pods in standuptime namespace on this host as such:
$ for pod in $(kubectl get pods -n standuptime --field-selector spec.nodeName=isaac-macbookair --output=jsonpath={.items..metadata.name}); do echo $pod; done
vote-back-myrelease1346-5b56967cd4-d6gkt
vote-front-myrelease1344-5f74d8468d-4rv29
azdo-chefdemo-deployment-568fb9f75f-np5sz
vote-front-myrelease1346-7d5b47c944-c8v8v
vote-front-mybluerelease-5c86c7bcd8-7qc5l
vote-front-myrelease1347-584bdb996d-vzlmr
vote-back-mybluerelease-589c6cdb8d-fsvwk
vote-back-myrelease1347-b5484dbc4-j5hc8
vote-back-myrelease1344-5f675b5fb4-q75rj
First, show all the azure-vote-front pods in standuptime namespace that are on this master node:
$ for pod in $(kubectl get pods -n standuptime --field-selector spec.nodeName=isaac-macbookair --output=jsonpath={.items..metadata.name}); do if [[ "$pod" == *"vote-front"* ]]; then echo $pod; fi; done
vote-front-myrelease1344-5f74d8468d-4rv29
vote-front-myrelease1346-7d5b47c944-c8v8v
vote-front-mybluerelease-5c86c7bcd8-7qc5l
vote-front-myrelease1347-584bdb996d-vzlmr
Now, in a similar fashion, bounce them all:
$ for pod in $(kubectl get pods -n standuptime --field-selector spec.nodeName=isaac-macbookair --output=jsonpath={.items..metadata.name}); do if [[ "$pod" == *"vote-front"* ]]; then kubectl delete pod $pod -n standuptime; fi; done
pod "vote-front-myrelease1344-5f74d8468d-4rv29" deleted
pod "vote-front-myrelease1346-7d5b47c944-c8v8v" deleted
pod "vote-front-mybluerelease-5c86c7bcd8-7qc5l" deleted
pod "vote-front-myrelease1347-584bdb996d-vzlmr" deleted
Now when we check the pods in standuptime running, it’s just the backend pool and the chef demo:
$ for pod in $(kubectl get pods -n standuptime --field-selector spec.nodeName=isaac-macbookair --output=jsonpath={.items..metadata.name}); do echo $pod; done
vote-back-myrelease1346-5b56967cd4-d6gkt
azdo-chefdemo-deployment-568fb9f75f-np5sz
vote-back-mybluerelease-589c6cdb8d-fsvwk
vote-back-myrelease1347-b5484dbc4-j5hc8
vote-back-myrelease1344-5f675b5fb4-q75rj
Verification: Checking Health
How did we do? did we release the pressure valve on our primary host?
We can see indeed we brought the CPU down to a much more reasonable level:
$ kubectl describe node isaac-macbookair | tail -n 8
  (Total limits may be over 100 percent, i.e., overcommitted.)
  Resource           Requests    Limits
  --------           --------    ------
  cpu                660m (16%)  1600m (40%)
  memory             624Mi (7%)  2282Mi (29%)
  ephemeral-storage  0 (0%)      0 (0%)
  hugepages-2Mi      0 (0%)      0 (0%)
Events:              <none>
Another thing I noticed in the Infra window was k0s running
I SSHed to the host thinking I must have installed directly, but no service or binary existed. But a find on the name hinted that perhaps I had gone mad months ago and tried to run k0s in k3s.
$ sudo find / -name k0s -print
/run/k3s/containerd/io.containerd.runtime.v2.task/k8s.io/c52a1007f647a2a0dd1292fa4b155a2a7e1d15693c00ecb9a0dbaf547b4421f6/rootfs/run/k0s
/run/k3s/containerd/io.containerd.runtime.v2.task/k8s.io/c52a1007f647a2a0dd1292fa4b155a2a7e1d15693c00ecb9a0dbaf547b4421f6/rootfs/usr/local/bin/k0s
find: ‘/run/user/1000/doc’: Permission denied
find: ‘/run/user/1000/gvfs’: Permission denied
/var/lib/kubelet/pods/e4da904e-ffd6-4014-ae22-eb7382009132/volumes/kubernetes.io~empty-dir/k0smount/k0s
/var/lib/rancher/k3s/agent/containerd/io.containerd.snapshotter.v1.overlayfs/snapshots/29409/fs/run/k0s
/var/lib/rancher/k3s/agent/containerd/io.containerd.snapshotter.v1.overlayfs/snapshots/57514/fs/usr/local/bin/k0s
/var/lib/rancher/k3s/agent/containerd/io.containerd.snapshotter.v1.overlayfs/snapshots/57523/fs/run/k0s
/var/lib/rancher/k3s/agent/containerd/io.containerd.snapshotter.v1.overlayfs/snapshots/255/fs/usr/local/bin/k0s
/var/lib/rancher/k3s/agent/containerd/io.containerd.snapshotter.v1.overlayfs/snapshots/29404/fs/usr/local/bin/k0s
find: ‘/proc/2330753’: No such file or directory
find: ‘/proc/2330990’: No such file or directory
and indeed I found that deployment in default:
$ kubectl get deployments | grep k0s
k0s-master                             1/1     1            1           178d
Since that is wasting a lot of resources (and I know I’m not using it), let’s clean that up too.
$ kubectl get deployment k0s-master -o yaml > k0sm-default.yaml
$ kubectl delete deployment k0s-master
deployment.apps "k0s-master" deleted
Updating DD Agent
I noticed that I was not collecting process details on my hosts.
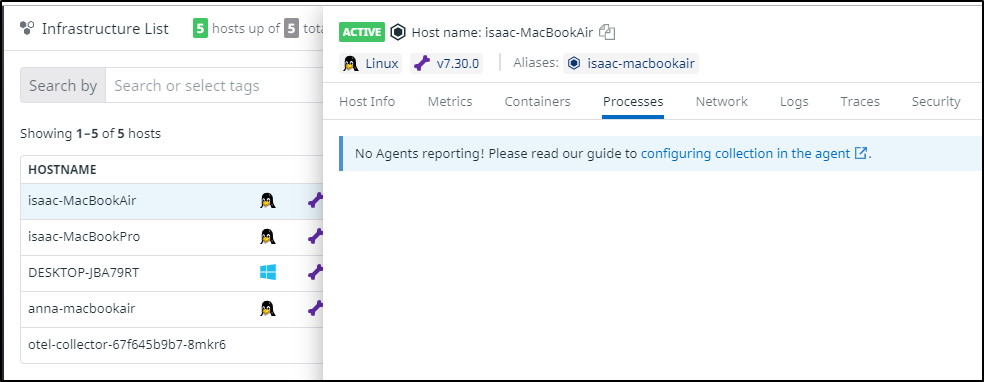
This is easily remidied by following the steps here.
$ helm get values datadogrelease -o yaml
USER-SUPPLIED VALUES: null
clusterAgent:
  enabled: true
  metricsProvider:
    enabled: true
datadog:
  apiKeyExistingSecret: dd-secret
  apm:
    enabled: true
    port: 8126
  appKey: asdfasdfasdfasdfasdfasdfasdfasdfasdf
  logs:
    containerCollectAll: true
    enabled: true

$ helm get values datadogrelease -o yaml > ddvalues.yaml

# add to the end
$ cat ddvalues.yaml | tail -n6
  logs:
    containerCollectAll: true
    enabled: true
  processAgent:
    processCollection: true
    enabled: true
our former chart was 2.20.1
$ helm list | grep datadog
datadogrelease          default         3               2021-08-17 13:50:12.866989275 -0500 CDT deployed        datadog-2.20.1
We might as well upgrade the agents while we are at it
$ helm repo add datadog https://helm.datadoghq.com
"datadog" already exists with the same configuration, skipping

$ helm repo update
Hang tight while we grab the latest from your chart repositories...
...Successfully got an update from the "kuma" chart repository
...Successfully got an update from the "datadog" chart repository
Update Complete. ⎈Happy Helming!⎈
Now upgrade
$ helm upgrade -f ddvalues.yaml datadogrelease datadog/datadog
Release "datadogrelease" has been upgraded. Happy Helming!
NAME: datadogrelease
LAST DEPLOYED: Tue Sep 14 07:44:49 2021
NAMESPACE: default
STATUS: deployed
REVISION: 4
TEST SUITE: None
NOTES:
Datadog agents are spinning up on each node in your cluster. After a few
minutes, you should see your agents starting in your event stream:
    https://app.datadoghq.com/event/stream
You disabled creation of Secret containing API key, therefore it is expected
that you create Secret named 'dd-secret' which includes a key called 'api-key' containing the API key.

The Datadog Agent is listening on port 8126 for APM service.

#################################################################
####               WARNING: Deprecation notice               ####
#################################################################

The option `datadog.apm.enabled` is deprecated, please use `datadog.apm.portEnabled` to enable TCP communication to the trace-agent.
The option `datadog.apm.socketEnabled` is enabled by default and can be used to rely on unix socket or name-pipe communication.
verification
$ helm list | grep datadog
datadogrelease          default         4               2021-09-14 07:44:49.162285587 -0500 CDT deployed        datadog-2.22.1
Checking up on updates:
$ kubectl get pods --all-namespaces | grep datadog
default        datadogrelease-kube-state-metrics-6b5956746b-ndcg9      1/1     Running             0          27d
default        datadogrelease-c49d5                                    3/3     Running             4          27d
default        datadogrelease-cluster-agent-5f5f84dd9b-cmc6r           1/1     Running             0          2m10s
default        datadogrelease-d7zc5                                    3/3     Running             0          119s
default        datadogrelease-5jsmh                                    0/3     Init:0/2            0          49s

$ kubectl get pods --all-namespaces | grep datadog
default        datadogrelease-kube-state-metrics-6b5956746b-ndcg9      1/1     Running             0          27d
default        datadogrelease-c49d5                                    3/3     Running             4          27d
default        datadogrelease-cluster-agent-5f5f84dd9b-cmc6r           1/1     Running             0          2m35s
default        datadogrelease-d7zc5                                    3/3     Running             0          2m24s
default        datadogrelease-5jsmh                                    2/3     Running             0          74s
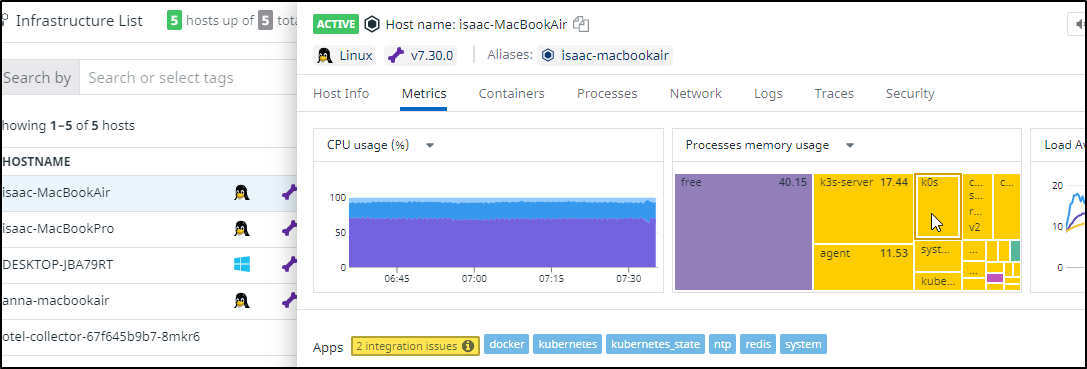
The process explorer is now available to us:
We can now see process details are being gathered:
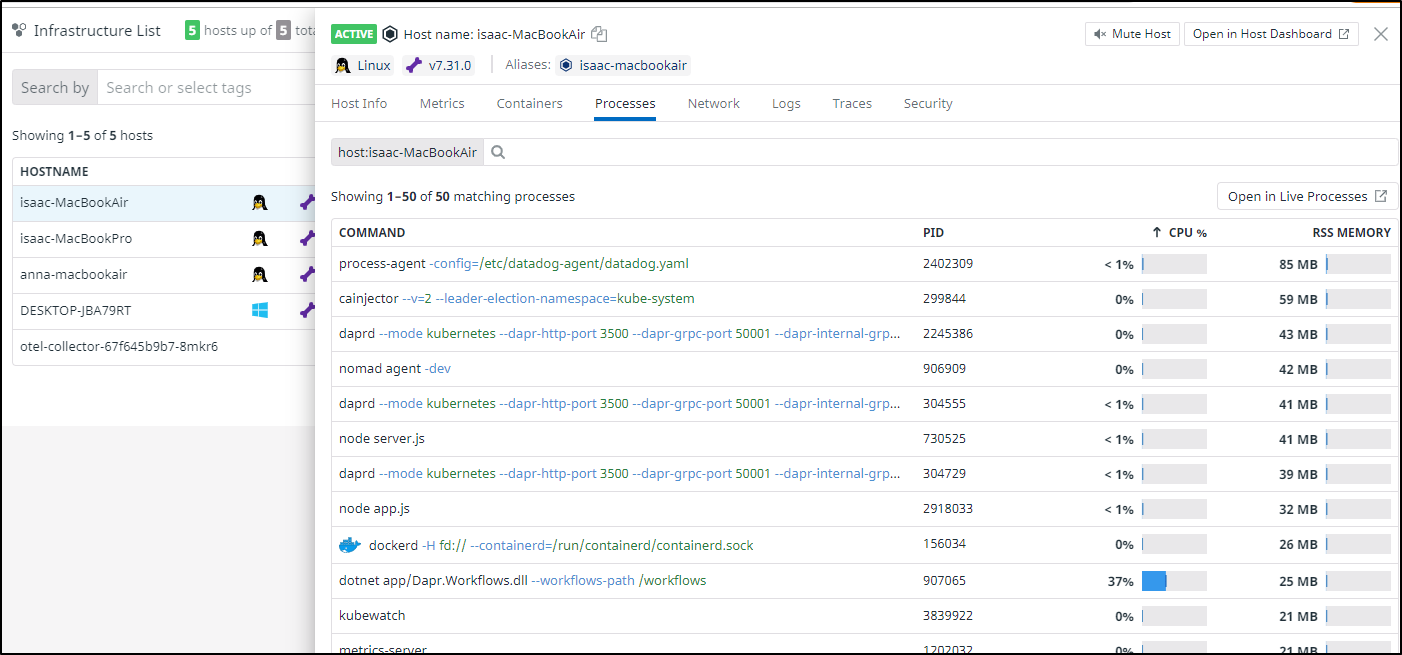
and if we hop on the host, we can indeed see our Dapr workflow dotnet servie is dominating the CPU
$ ps -ef | grep dotnet
root      907065  903511 99 Jul25 ?        88-20:16:34 dotnet app/Dapr.Workflows.dll --workflows-path /workflows
isaac    2400949 2399891  0 07:49 pts/2    00:00:00 grep --color=auto dotnet
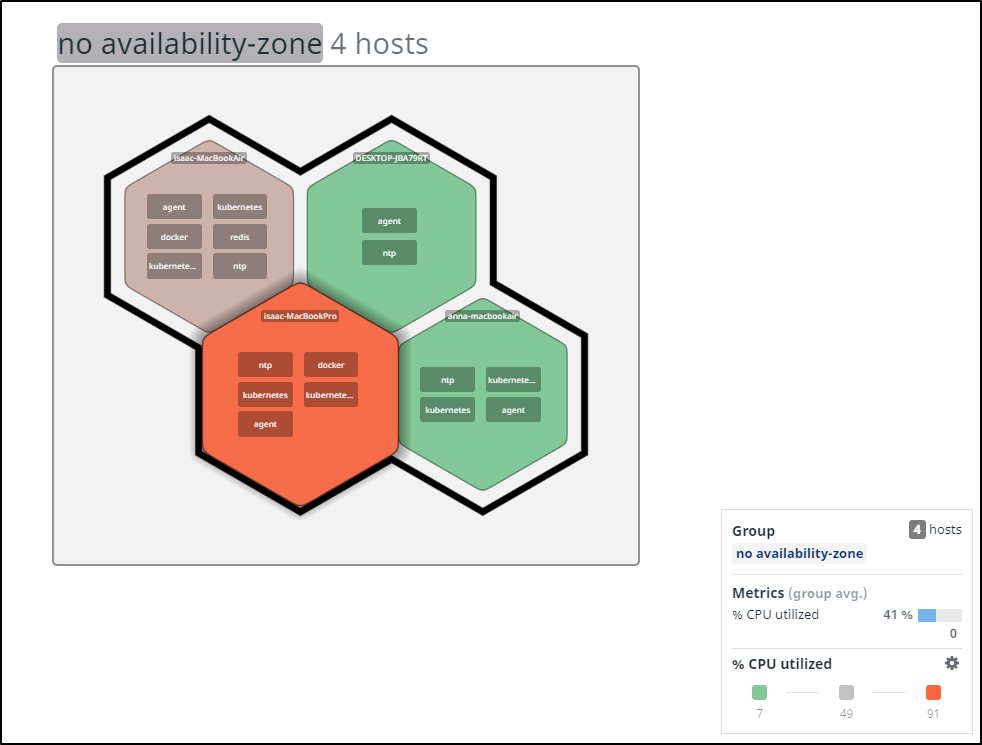
And our host list shows similar:
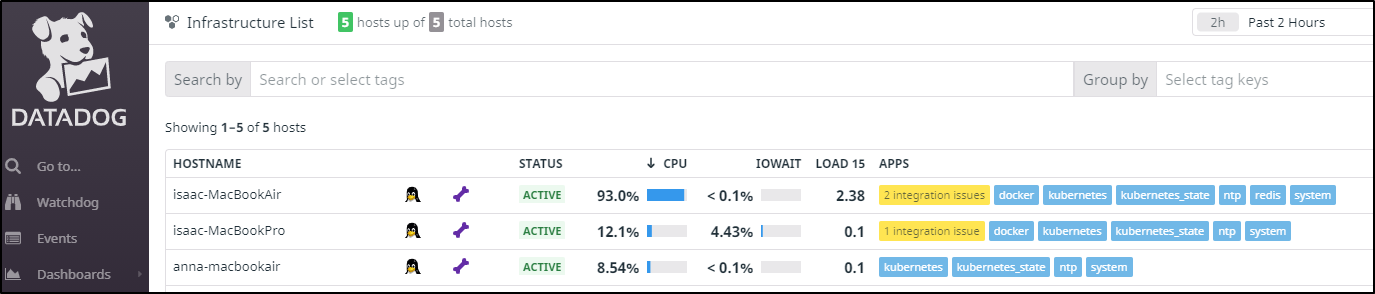
I can bounce that node and see if its just needing a quick cycle
$ kubectl delete pod dapr-workflows-host-85d9d74777-mcq7n
pod "dapr-workflows-host-85d9d74777-mcq7n" deleted
And I can see we are now below 90% which was my goal.
This is a bit outside the scope of cleanup. We do use that Workflow component regularily. So for now we have cleaned all we can.
What if we wanted to set an alert? Perhaps we cleanup the CPU issue and would like to know when our nodes get pegged.
DD Monitor (for future detection)
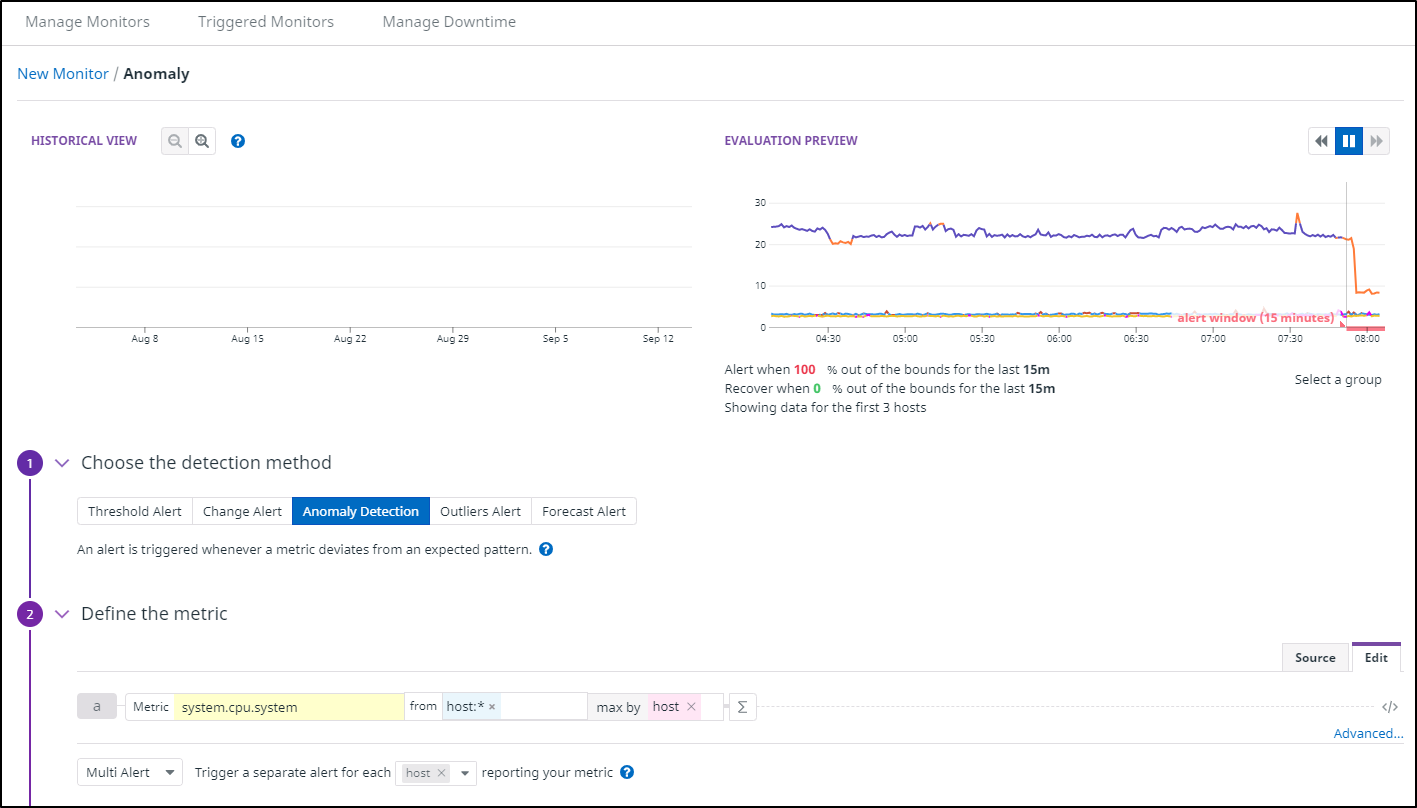
We can set up a new Anomoly detection monitor:
Here we set the metric of system.cpu.system. There are some similar metrics from which to choose. I used the “Evaluation” preview to hone in on the detail I was seeking.
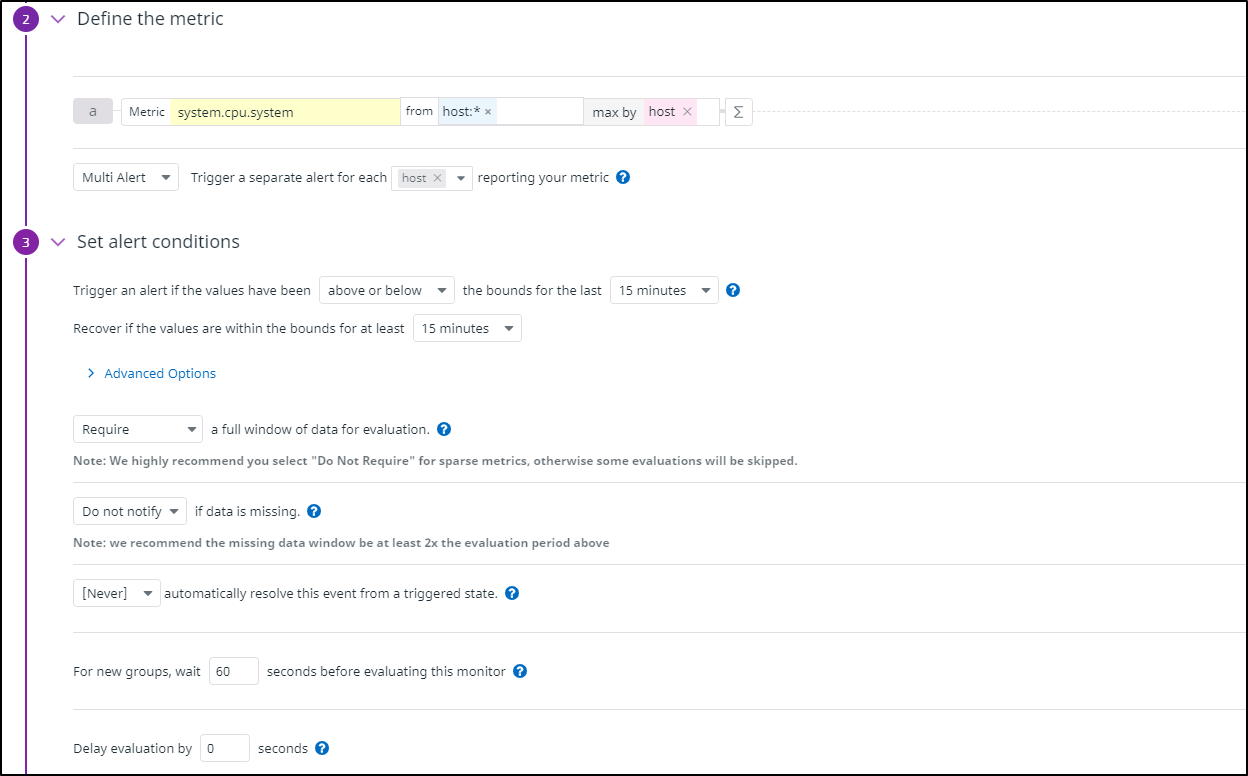
We then want to set some conditions. I might thin the host selector later. For now, on all hosts, if the max exceeds the anomoly detection for more than 15m, send the alert
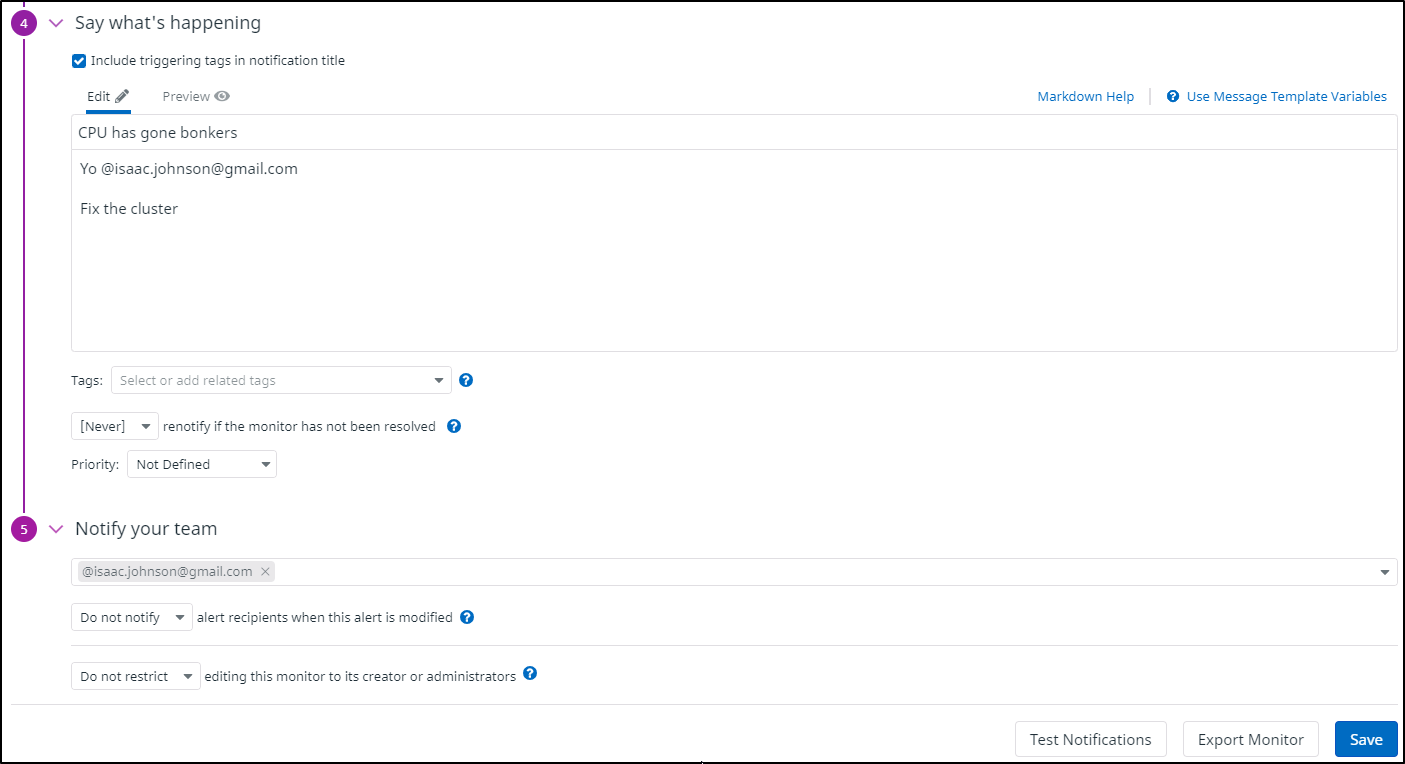
Lastly, we set the alert details and audience
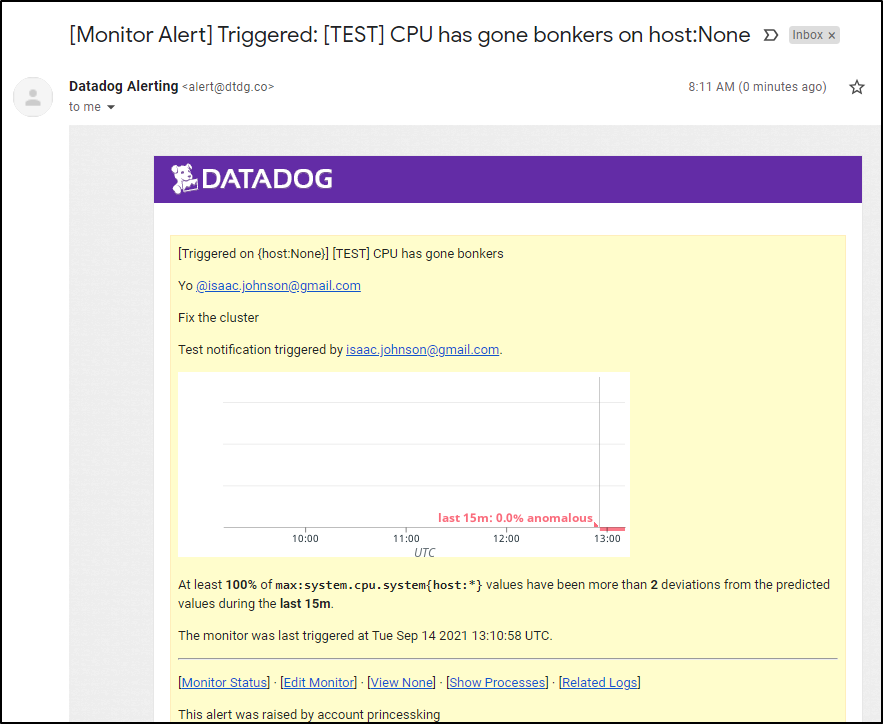
A test triggering shows what an alert will look like:
Epilogue
Hours later i could hear fans again. But upon inspection, it was from a different laptop. I had to mute the DD Alert since it kept going off. But only later did i realize it was not a false alert.
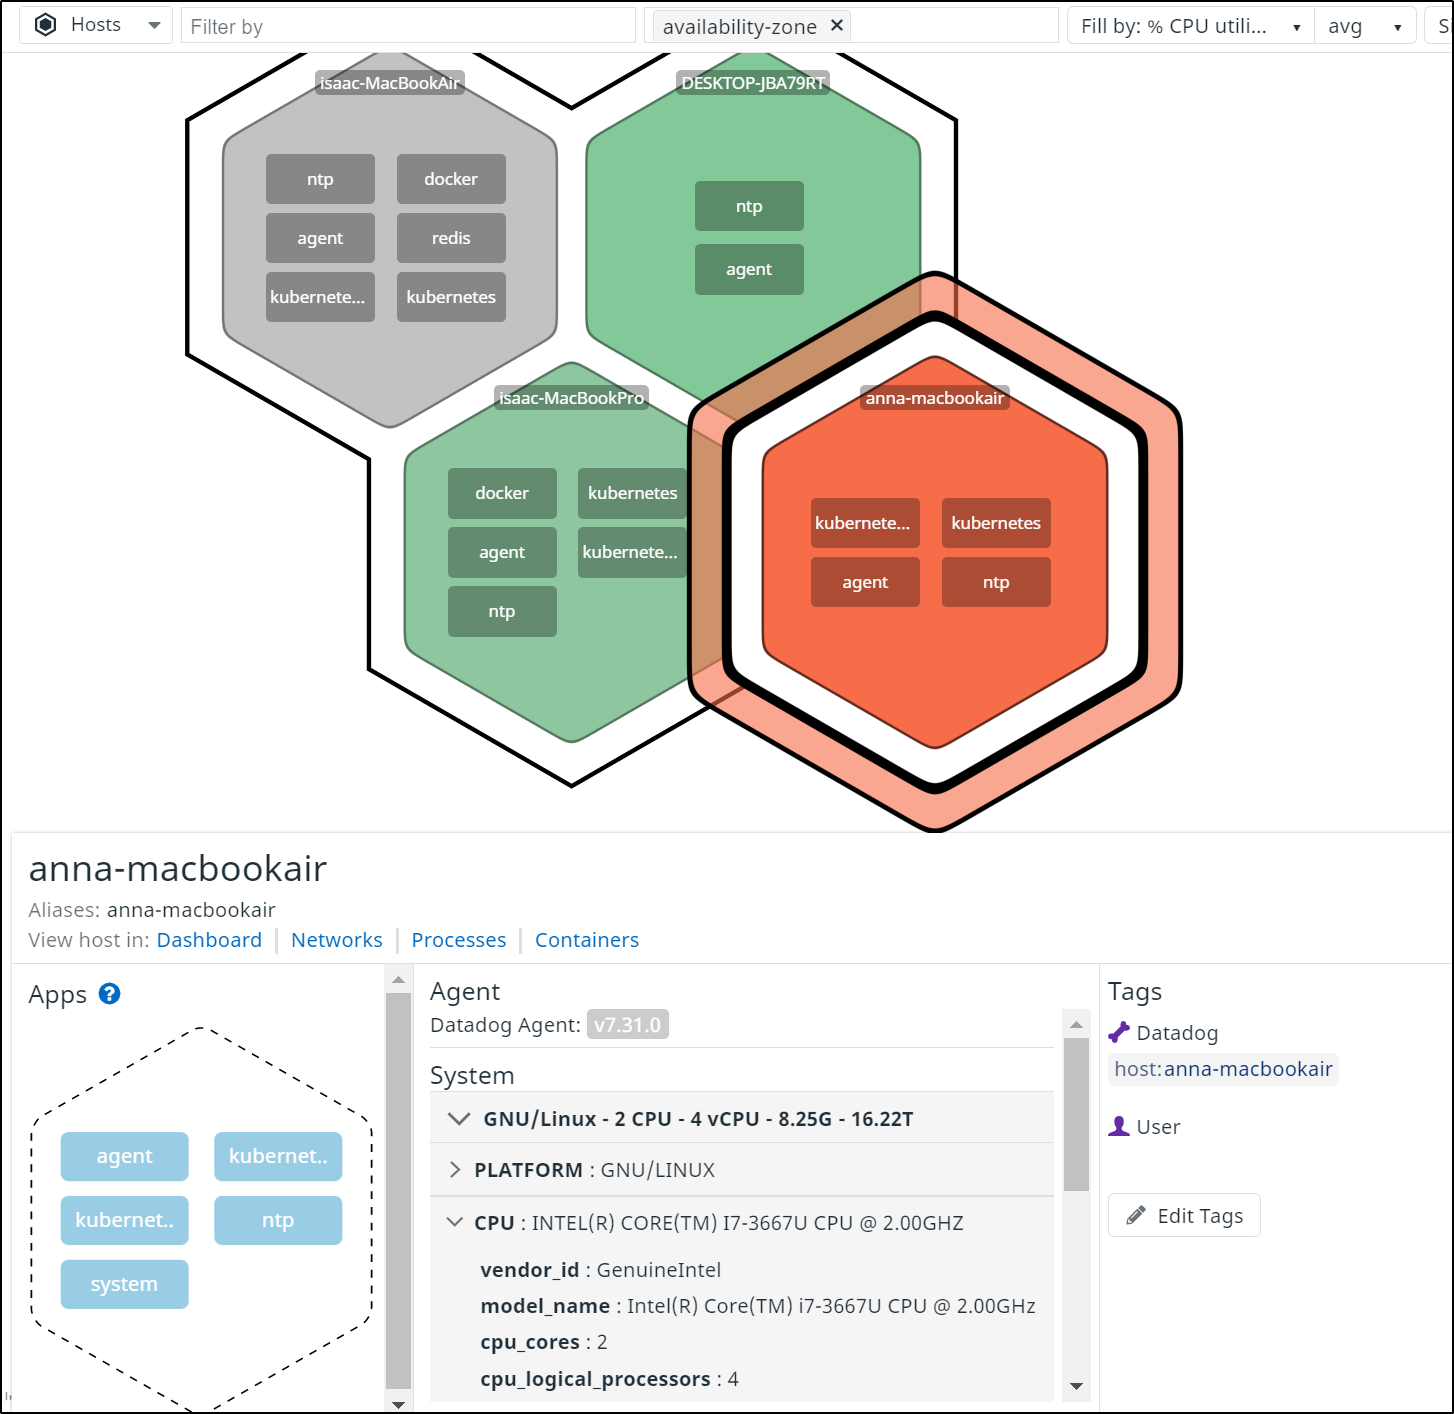
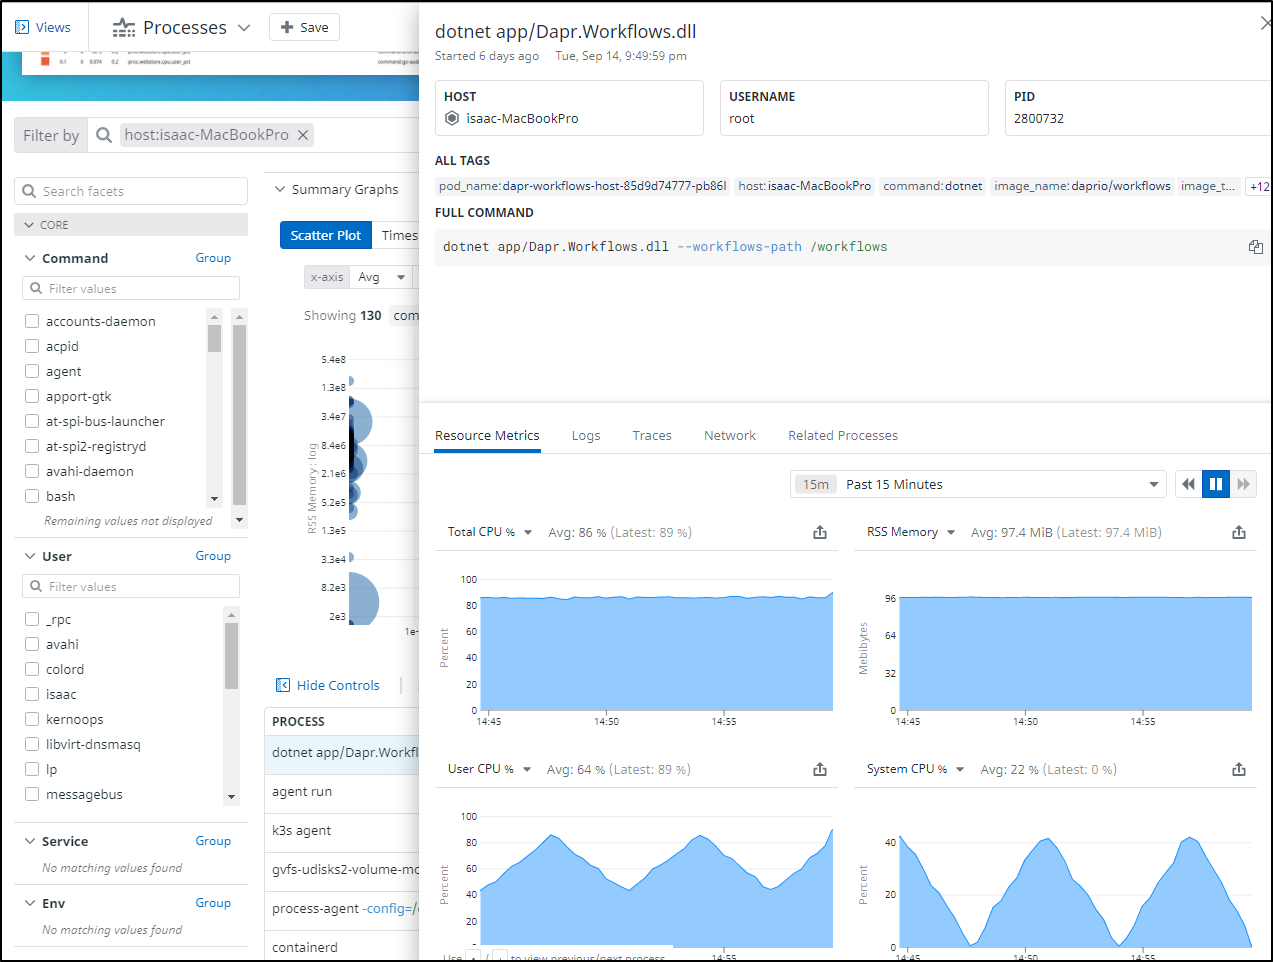
I could see the details of the host in question including CPU and memory details.
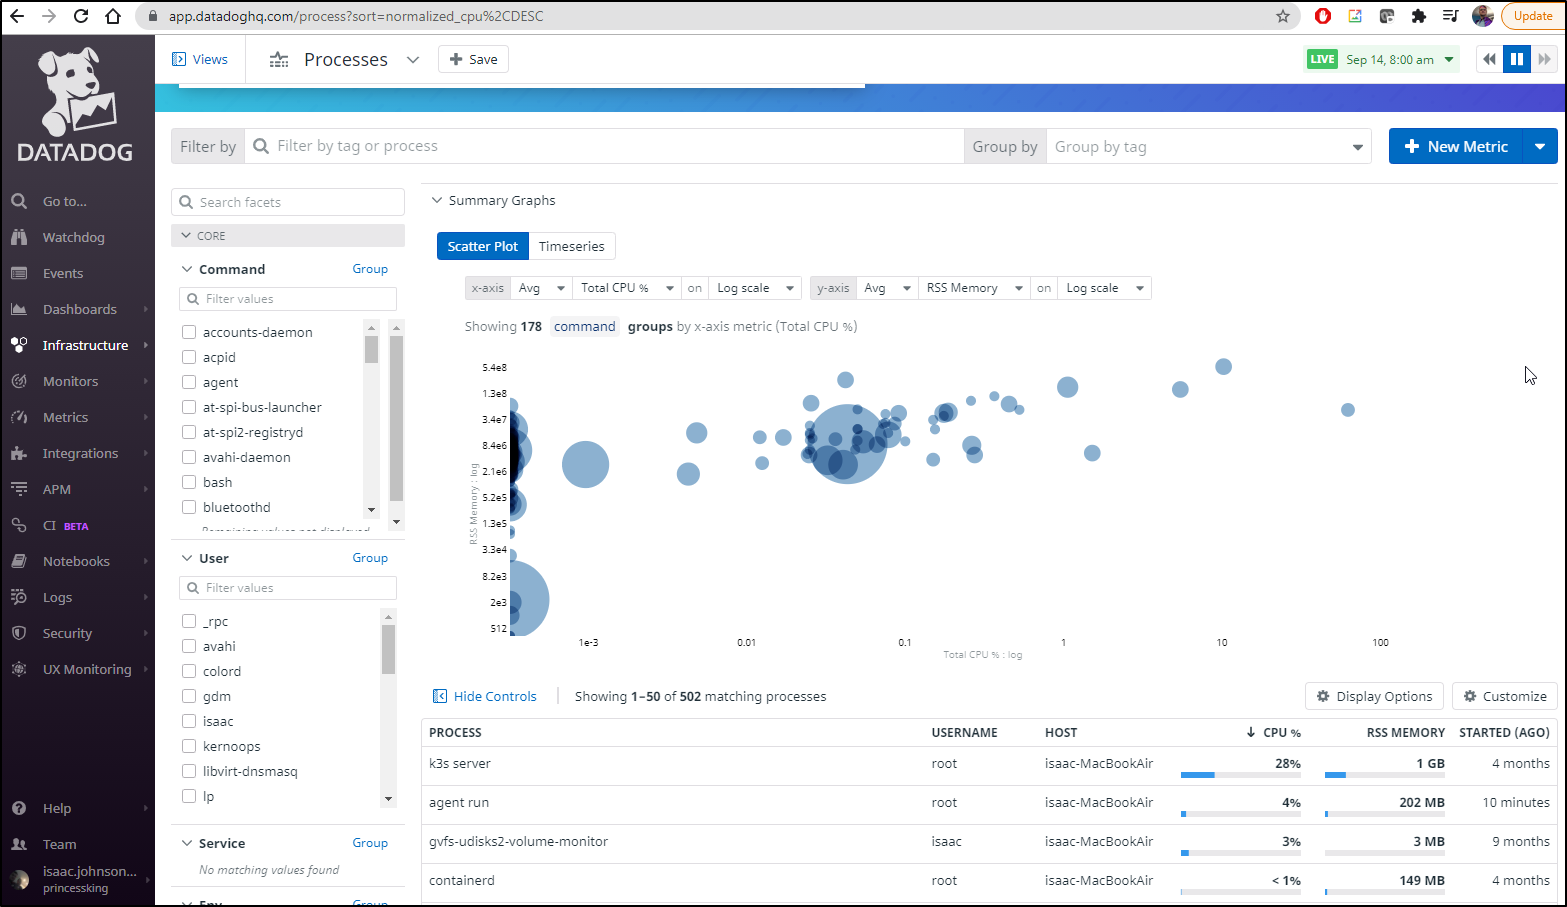
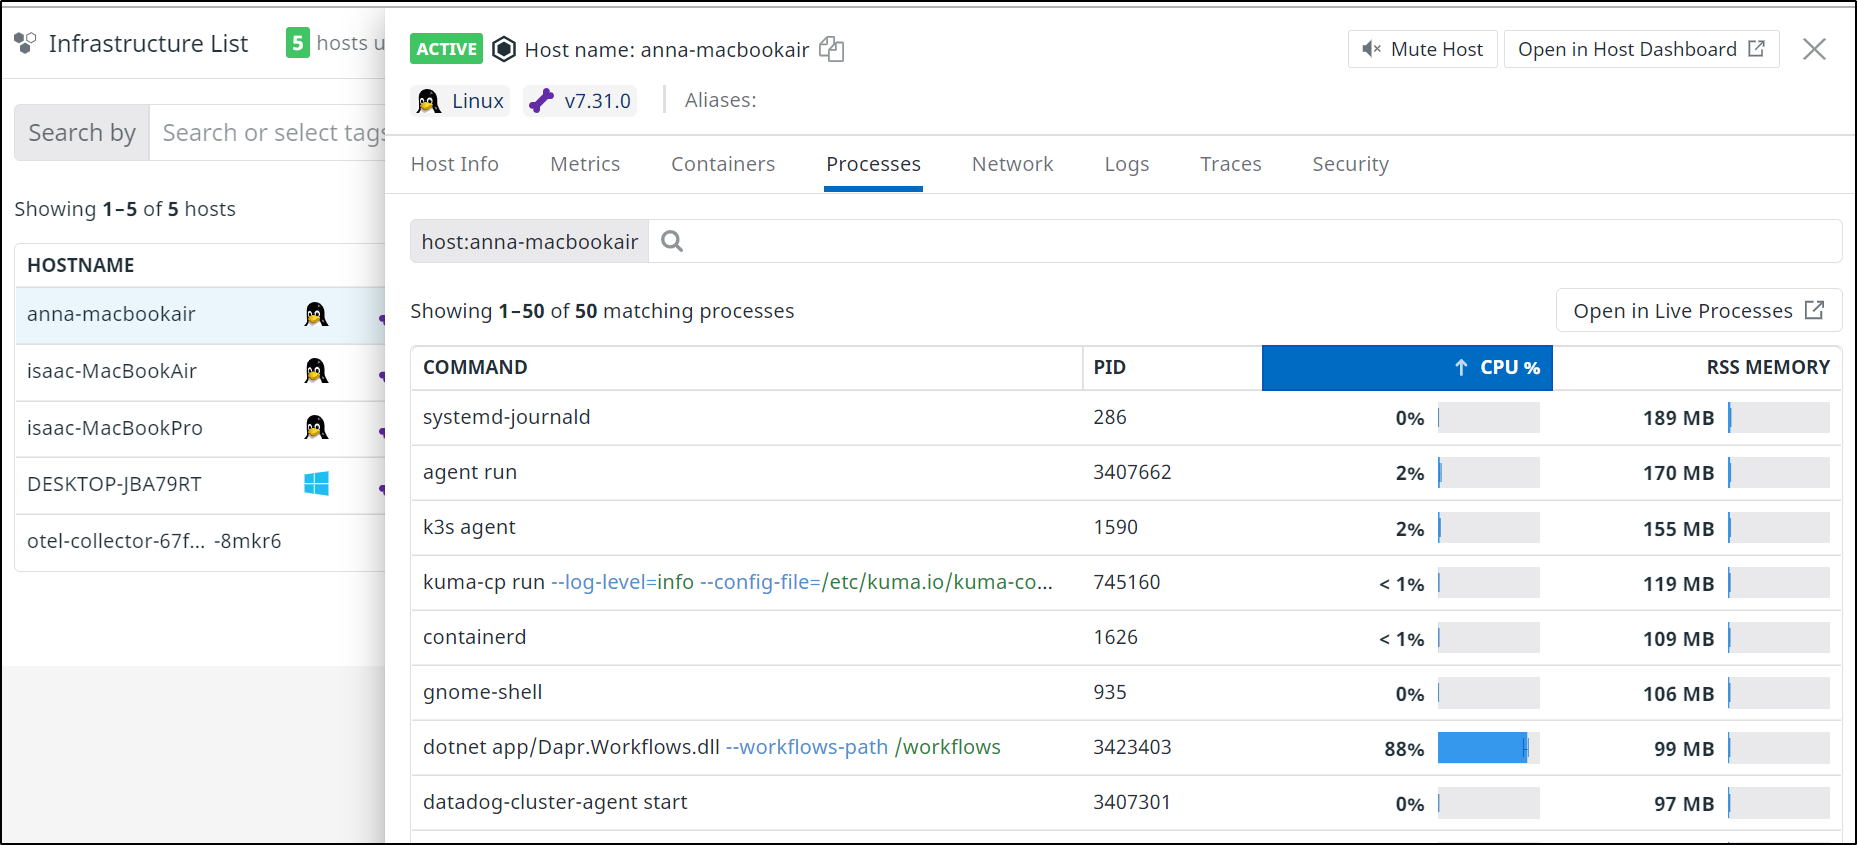
Next, I was able to go to the Infrastructure Dashboard and look at the Processes tab on the host with high CPU. From there i could sort on CPU usage and see it was the same problematic prcoess; the Dapr Workflow engine.
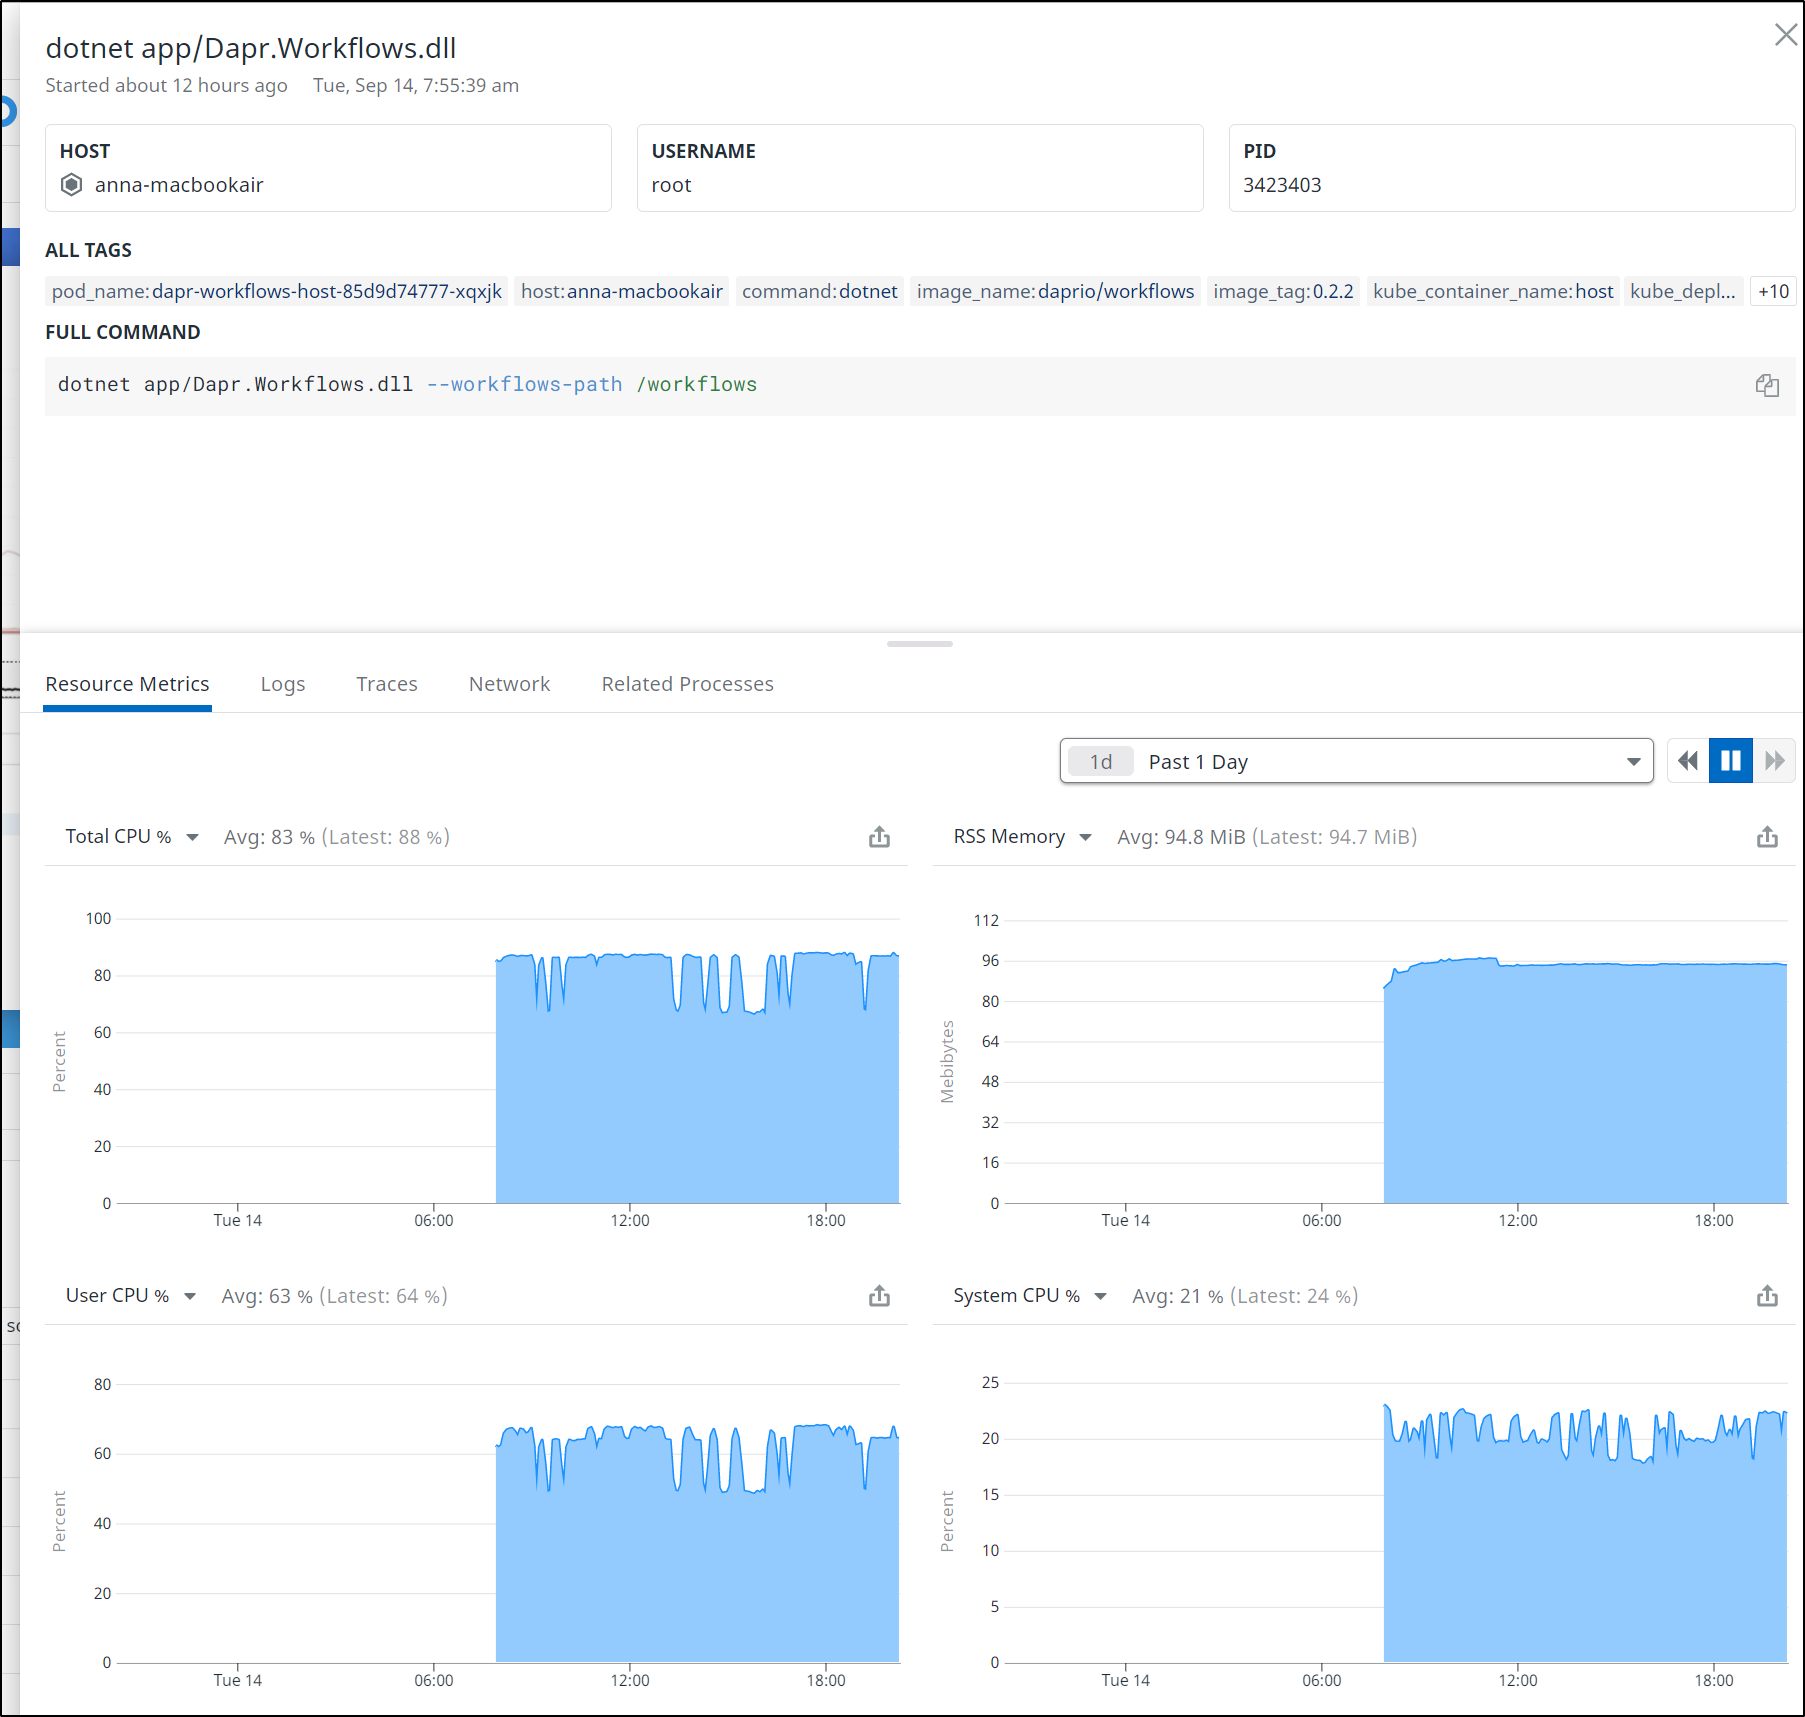
I could then get details on that process on that host and see that indeed, after i had cycled the pod, it spiked usage on this host.
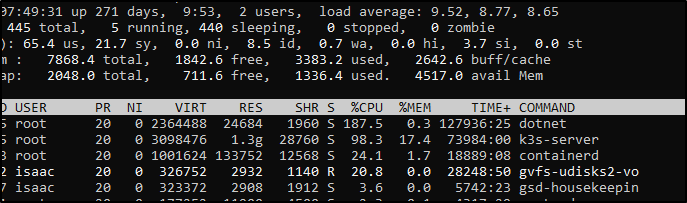
Logging into the host shows the dotnet process is indeed dominating the CPU
builder@anna-MacBookAir:~$ top
top - 20:57:08 up 42 days, 12:13,  1 user,  load average: 6.22, 5.62, 5.23
Tasks: 312 total,   2 running, 310 sleeping,   0 stopped,   0 zombie
%Cpu(s): 71.1 us, 20.5 sy,  0.0 ni,  8.4 id,  0.0 wa,  0.0 hi,  0.0 si,  0.0 st
MiB Mem :   7867.8 total,    119.0 free,   1579.2 used,   6169.7 buff/cache
MiB Swap:   2048.0 total,   1964.0 free,     84.0 used.   6119.9 avail Mem

    PID USER      PR  NI    VIRT    RES    SHR S  %CPU  %MEM     TIME+ COMMAND
3423403 root      20   0 2356504  97064  51388 S 351.3   1.2   2541:33 dotnet
3407742 root      20   0 1519296  90964  42816 S   4.0   1.1  10:18.26 process-agent
   1590 root      20   0  896744 151132  29452 S   2.6   1.9   6980:32 k3s-agent
3407662 root      20   0 2068672 165816  75396 S   1.7   2.1  37:26.54 agent
3407301 root      20   0 1523488  94708  52728 S   1.0   1.2   6:36.49 datadog-cluster
    935 gdm       20   0 4012732 103432  42976 S   0.7   1.3  47:10.45 gnome-shell
 562482 builder   20   0   12460   4208   3400 R   0.7   0.1   0:00.03 top
 745160 6789      20   0  850924 115836  46896 S   0.7   1.4 769:53.92 kuma-cp
3890605 5678      20   0 2298480  54904  25760 S   0.7   0.7   1022:01 envoy
    286 root      19  -1  314976 208984 207476 S   0.3   2.6  18:57.78 systemd-journal
   1626 root      20   0  900608 106900  31140 S   0.3   1.3   1025:35 containerd
I tried to nice the PID
builder@anna-MacBookAir:~$ sudo renice -n 10 -p 3423403
[sudo] password for builder:
3423403 (process ID) old priority 0, new priority 10
that failed
I tried setting the resource limits
builder@DESKTOP-72D2D9T:~$ kubectl get deployments dapr-workflows-host -o yaml > dapr-wf.dep.yaml
builder@DESKTOP-72D2D9T:~$ kubectl get deployments dapr-workflows-host -o yaml > dapr-wf.dep.yaml.backup
builder@DESKTOP-72D2D9T:~$ vi dapr-wf.dep.yaml
builder@DESKTOP-72D2D9T:~$ diff dapr-wf.dep.yaml dapr-wf.dep.yaml.backup
193,199d192
<         resources:
<           limits:
<             cpu: "1"
<             memory: 512Mi
<           requests:
<             cpu: "1"
<             memory: 512Mi
builder@DESKTOP-72D2D9T:~$ kubectl apply -f dapr-wf.dep.yaml
deployment.apps/dapr-workflows-host configured
I even cycled the pod, which scheduled it on a different host. But it did not fix the CPU usage
isaac@isaac-MacBookPro:~$ top
top - 21:54:23 up 42 days, 13:08,  2 users,  load average: 5.01, 3.34, 1.66
Tasks: 325 total,   2 running, 323 sleeping,   0 stopped,   0 zombie
%Cpu(s): 67.2 us, 23.7 sy,  0.0 ni,  8.2 id,  0.9 wa,  0.0 hi,  0.1 si,  0.0 st
MiB Mem :   7871.9 total,   2834.6 free,   1687.5 used,   3349.8 buff/cache
MiB Swap:   2048.0 total,   1463.1 free,    584.9 used.   6305.3 avail Mem

    PID USER      PR  NI    VIRT    RES    SHR S  %CPU  %MEM     TIME+ COMMAND
2800732 root      20   0 2356768  88792  50532 S 340.5   1.1  13:08.12 dotnet
    992 root      20   0  895500 144356  29224 S   6.6   1.8   5933:57 k3s-agent
1231762 root      20   0 1519040  90948  43520 S   5.0   1.1  12:33.11 process-agent
   1558 root      20   0  927916 107160  36200 S   3.7   1.3   1009:12 containerd
 307704 5678      20   0 2298480  32860  11836 S   0.7   0.4 850:19.16 envoy
1230818 root      20   0  713572  13128   7392 S   0.7   0.2   2:05.58 containerd-shim
1231585 root      20   0 2428180 207572  75440 S   0.7   2.6  67:01.21 agent
More than a week passed since then and the fans died down.
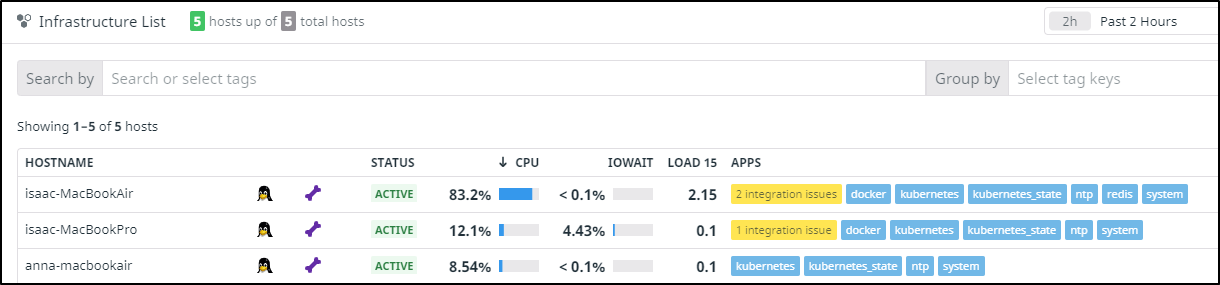
checking the cluster today I see:
while it’s more than I would like, we can see it doesnt seem to be pushing the host over the top just yet:
The usage is still high, but not critical
Issues in Datadog (Incident Management)
A feature we haven’t explored to date is Datadog Incident Management. With Incident management we can create tickets to address issues and assign them to a team or person.
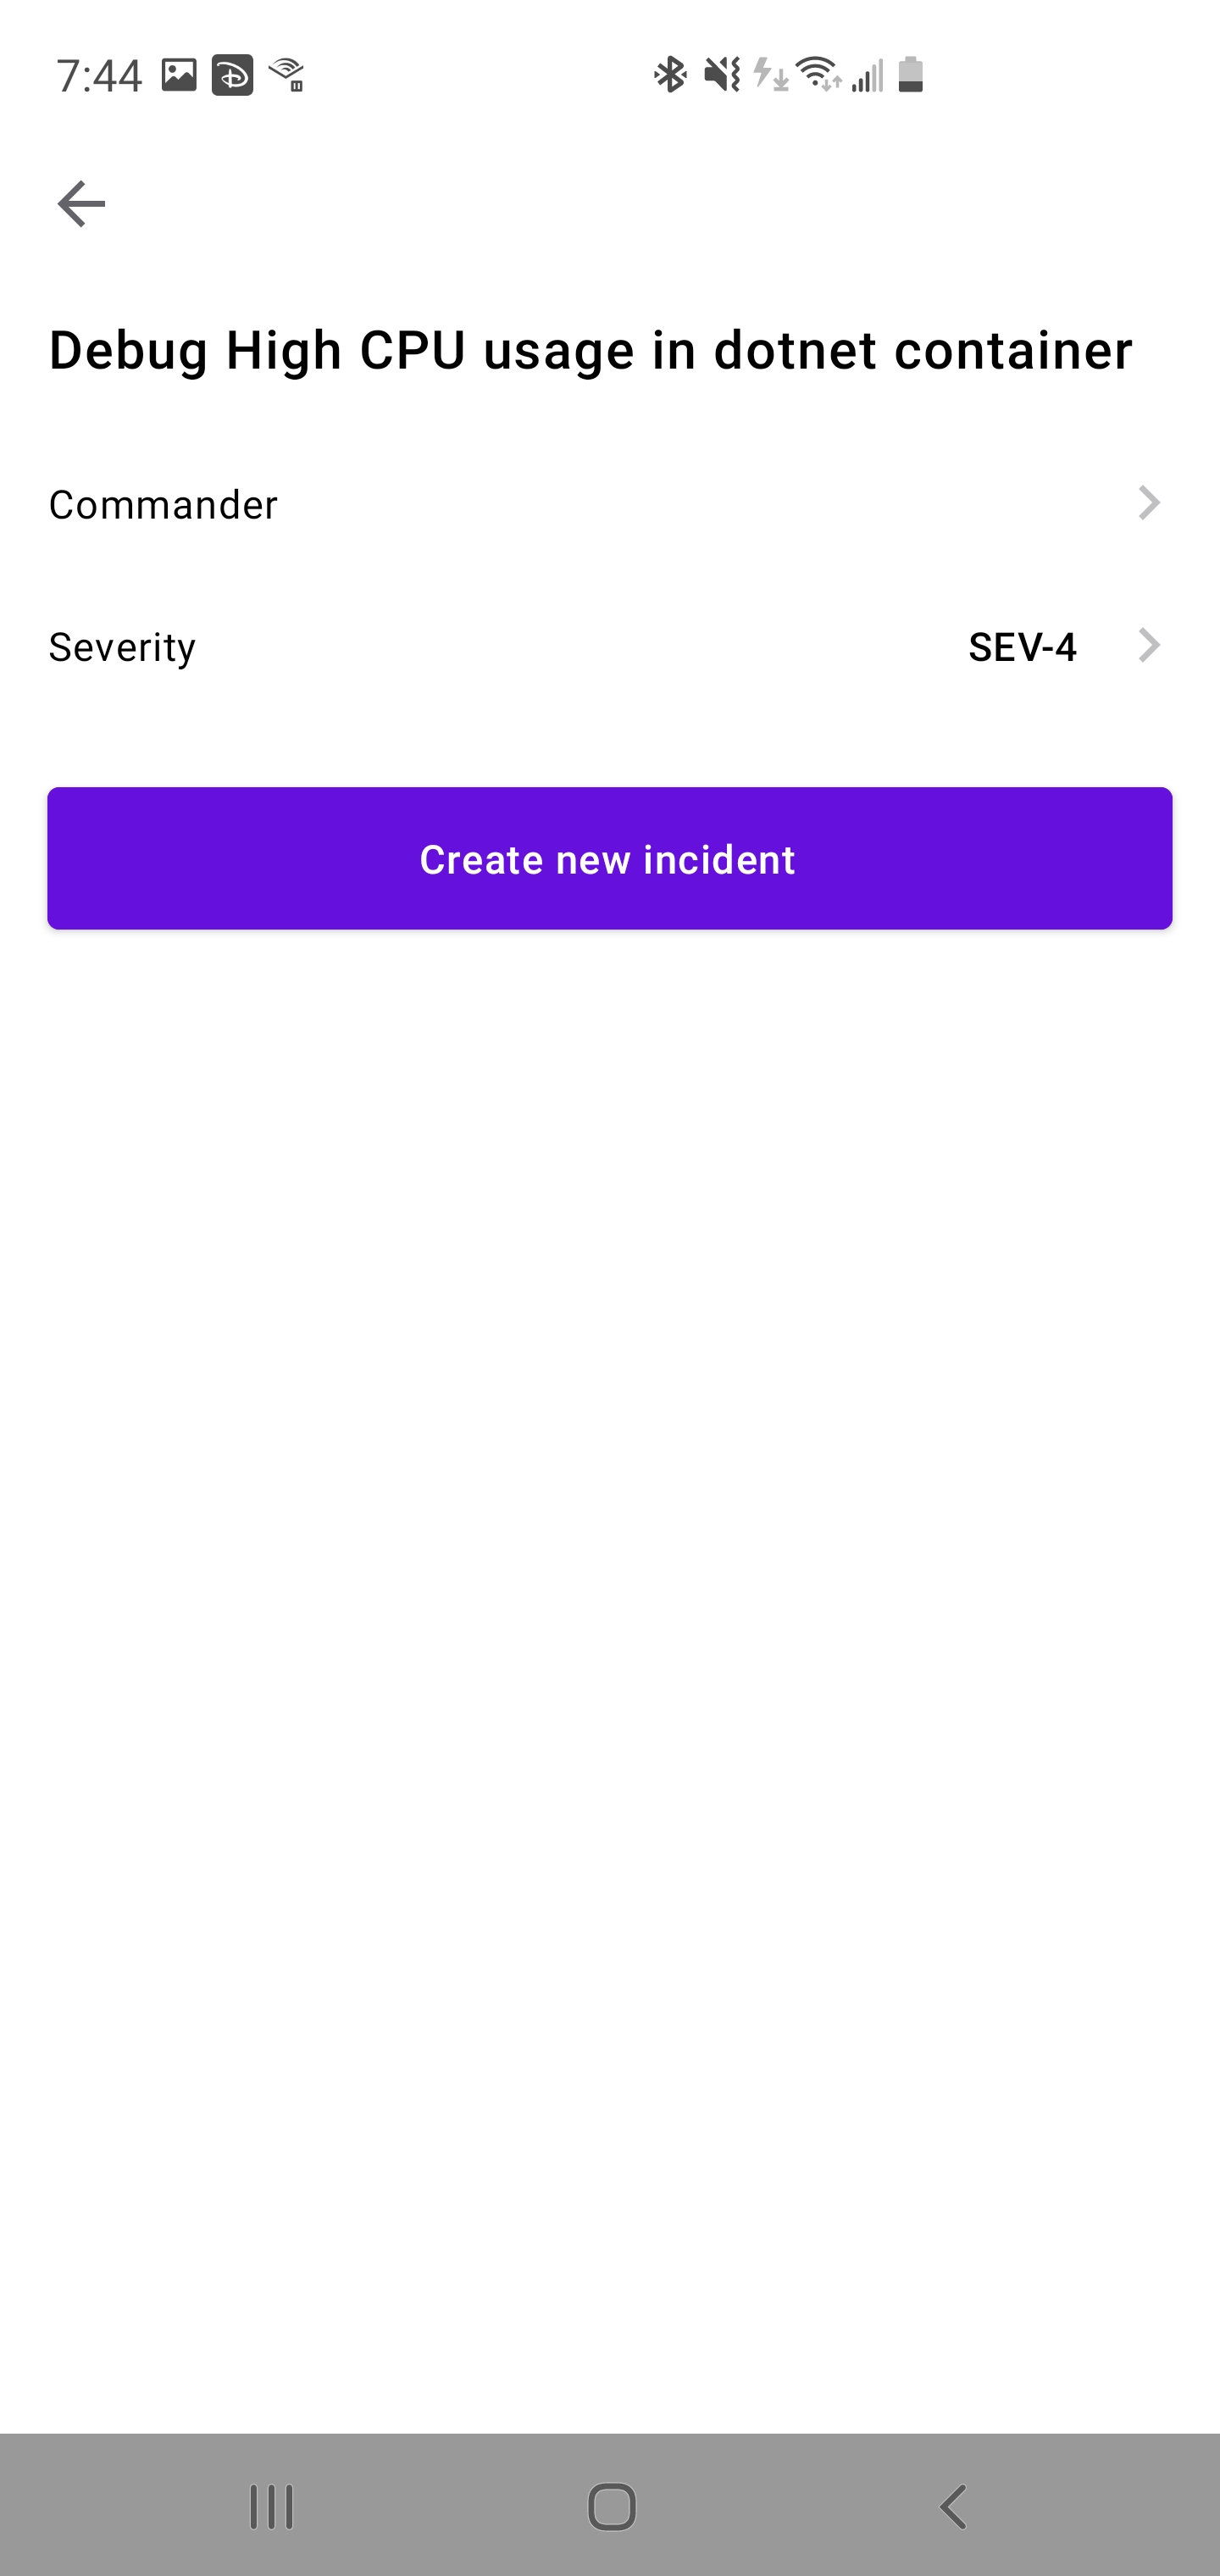
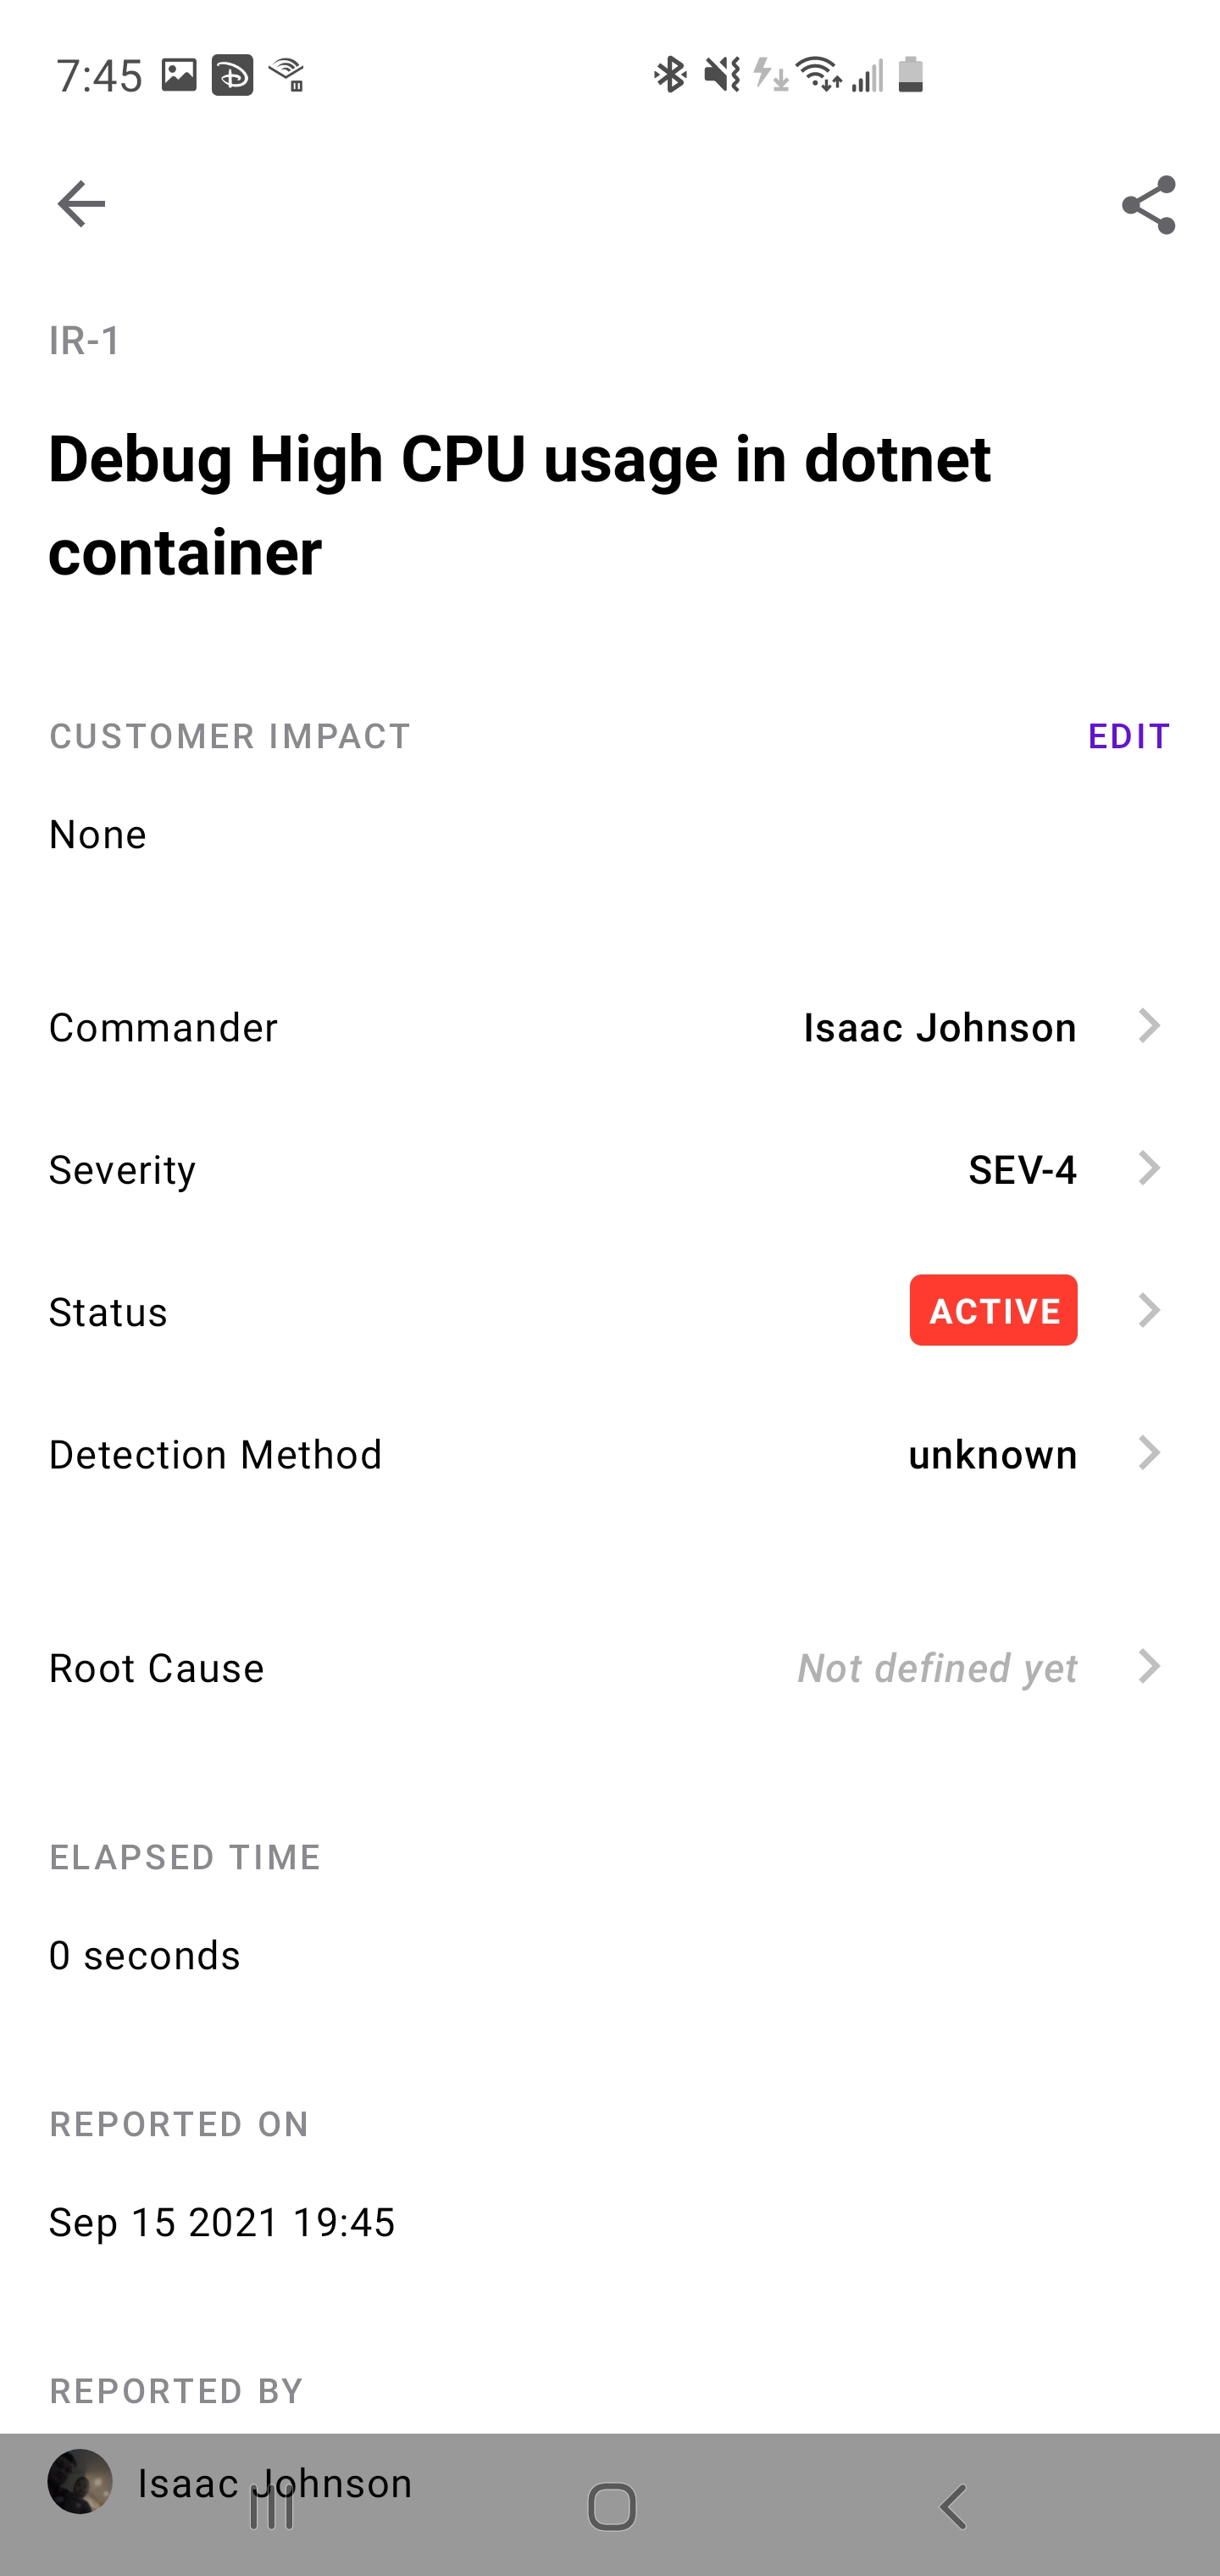
Here i’ll create one to address the High CPU later. I create from the “Incidents” tab. In this example, I’ll do it all entirely from my phone.
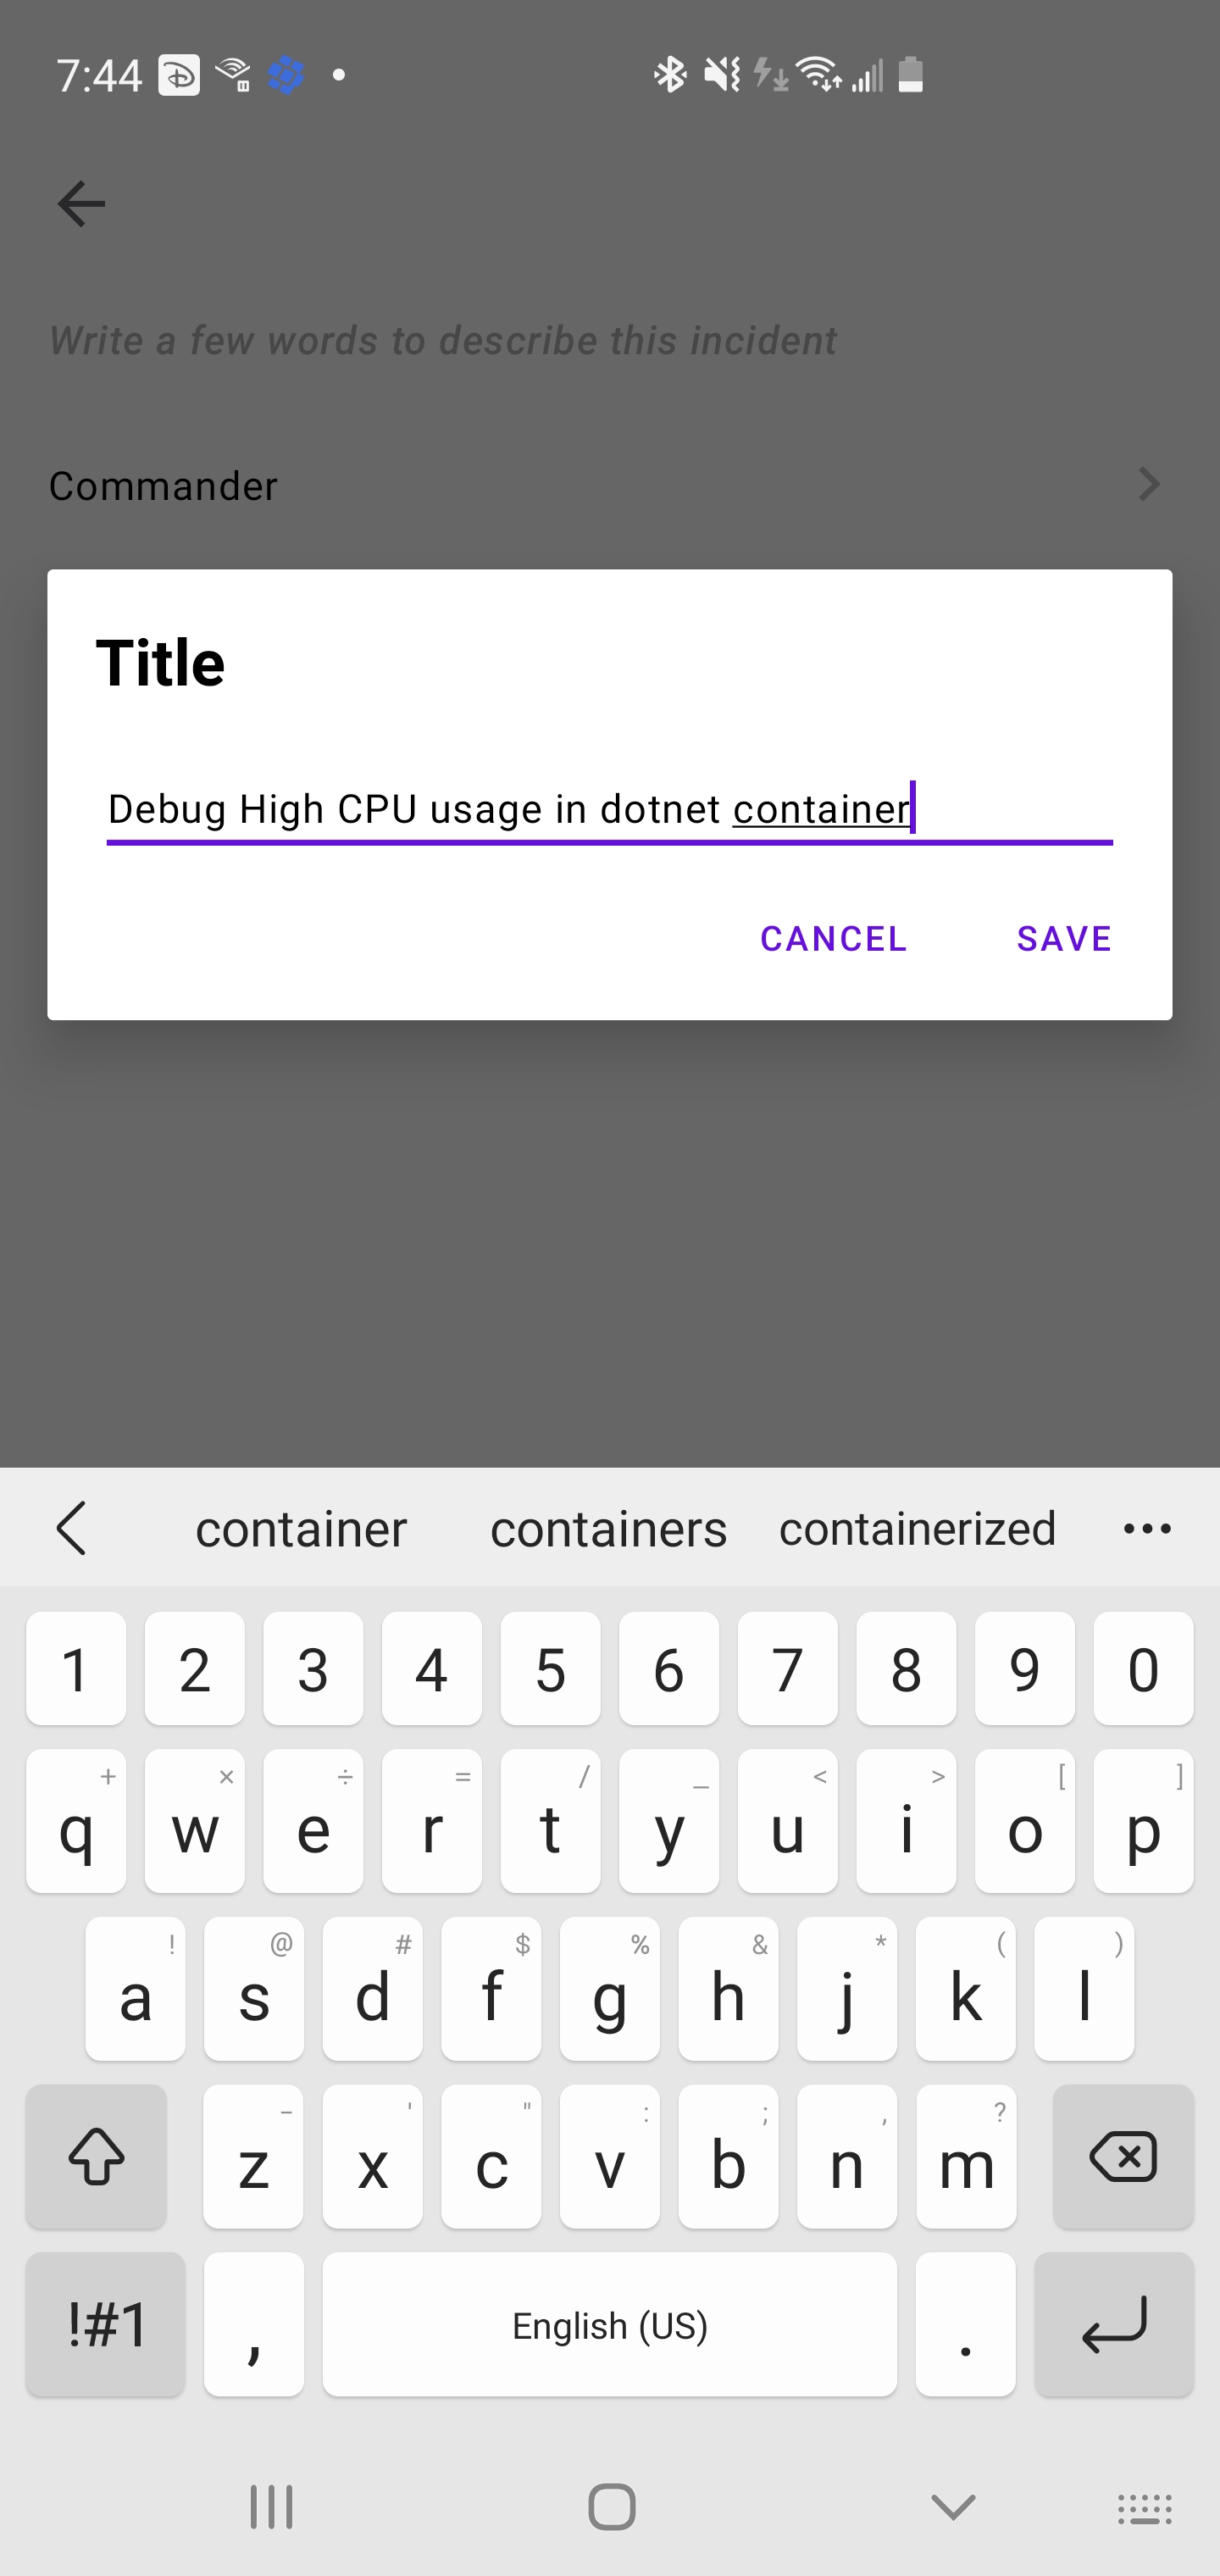
I can set the severity and tie to APM logs as well by picking an Application if i desire
Once saved, I can see details of this incident:
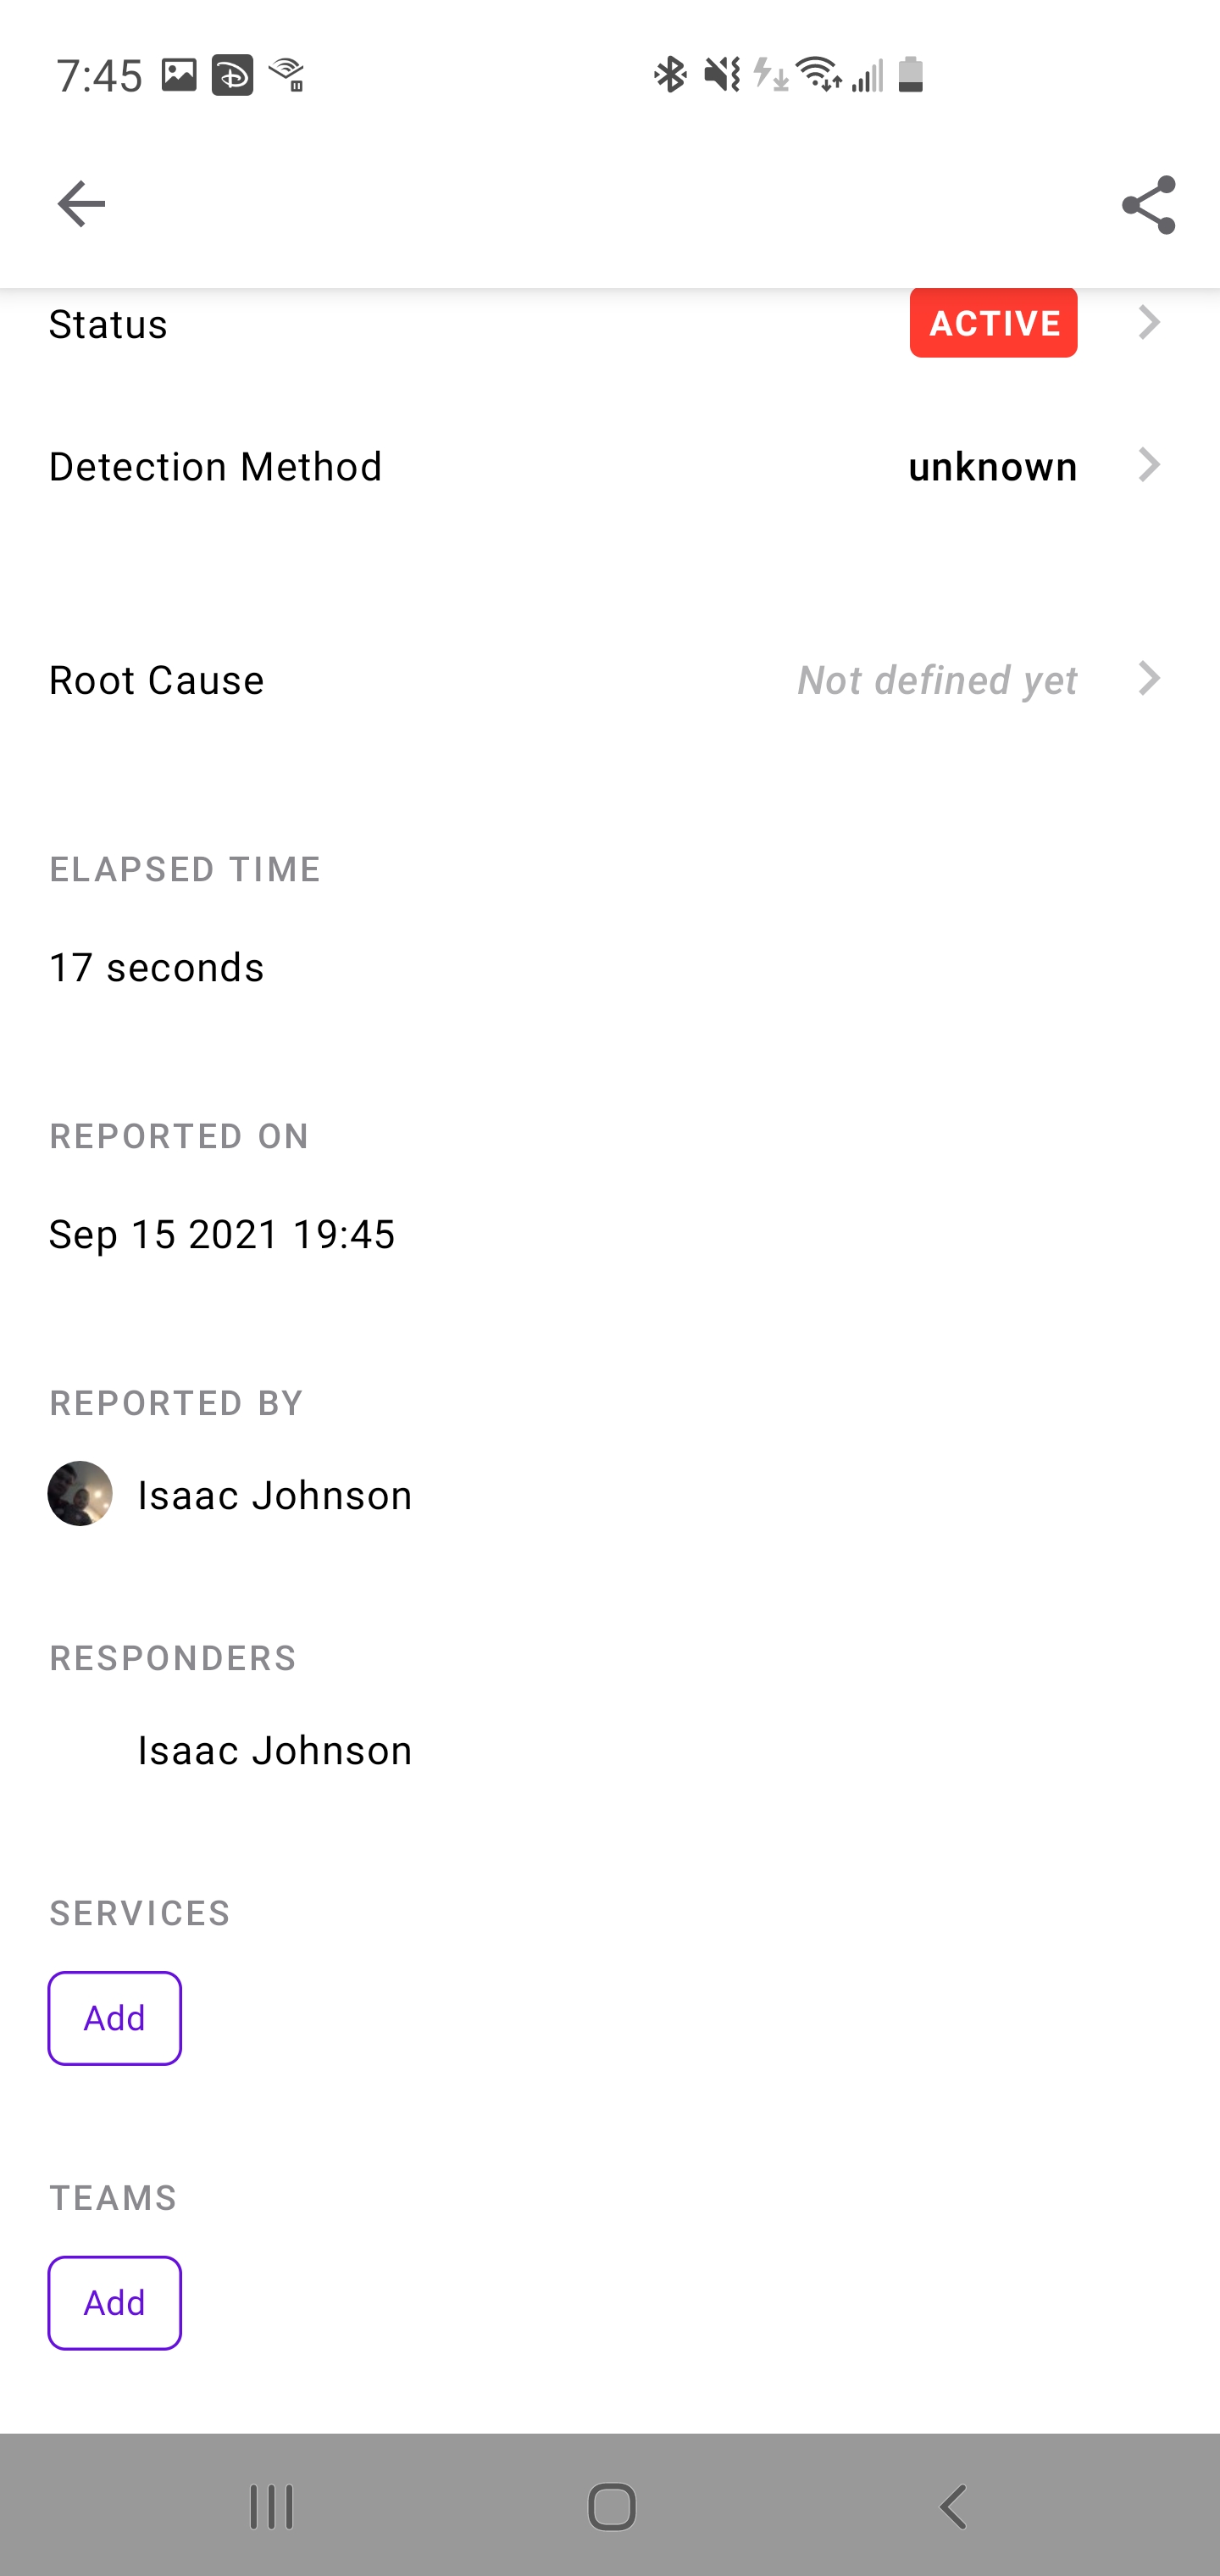
I can then share it in a variety of ways:
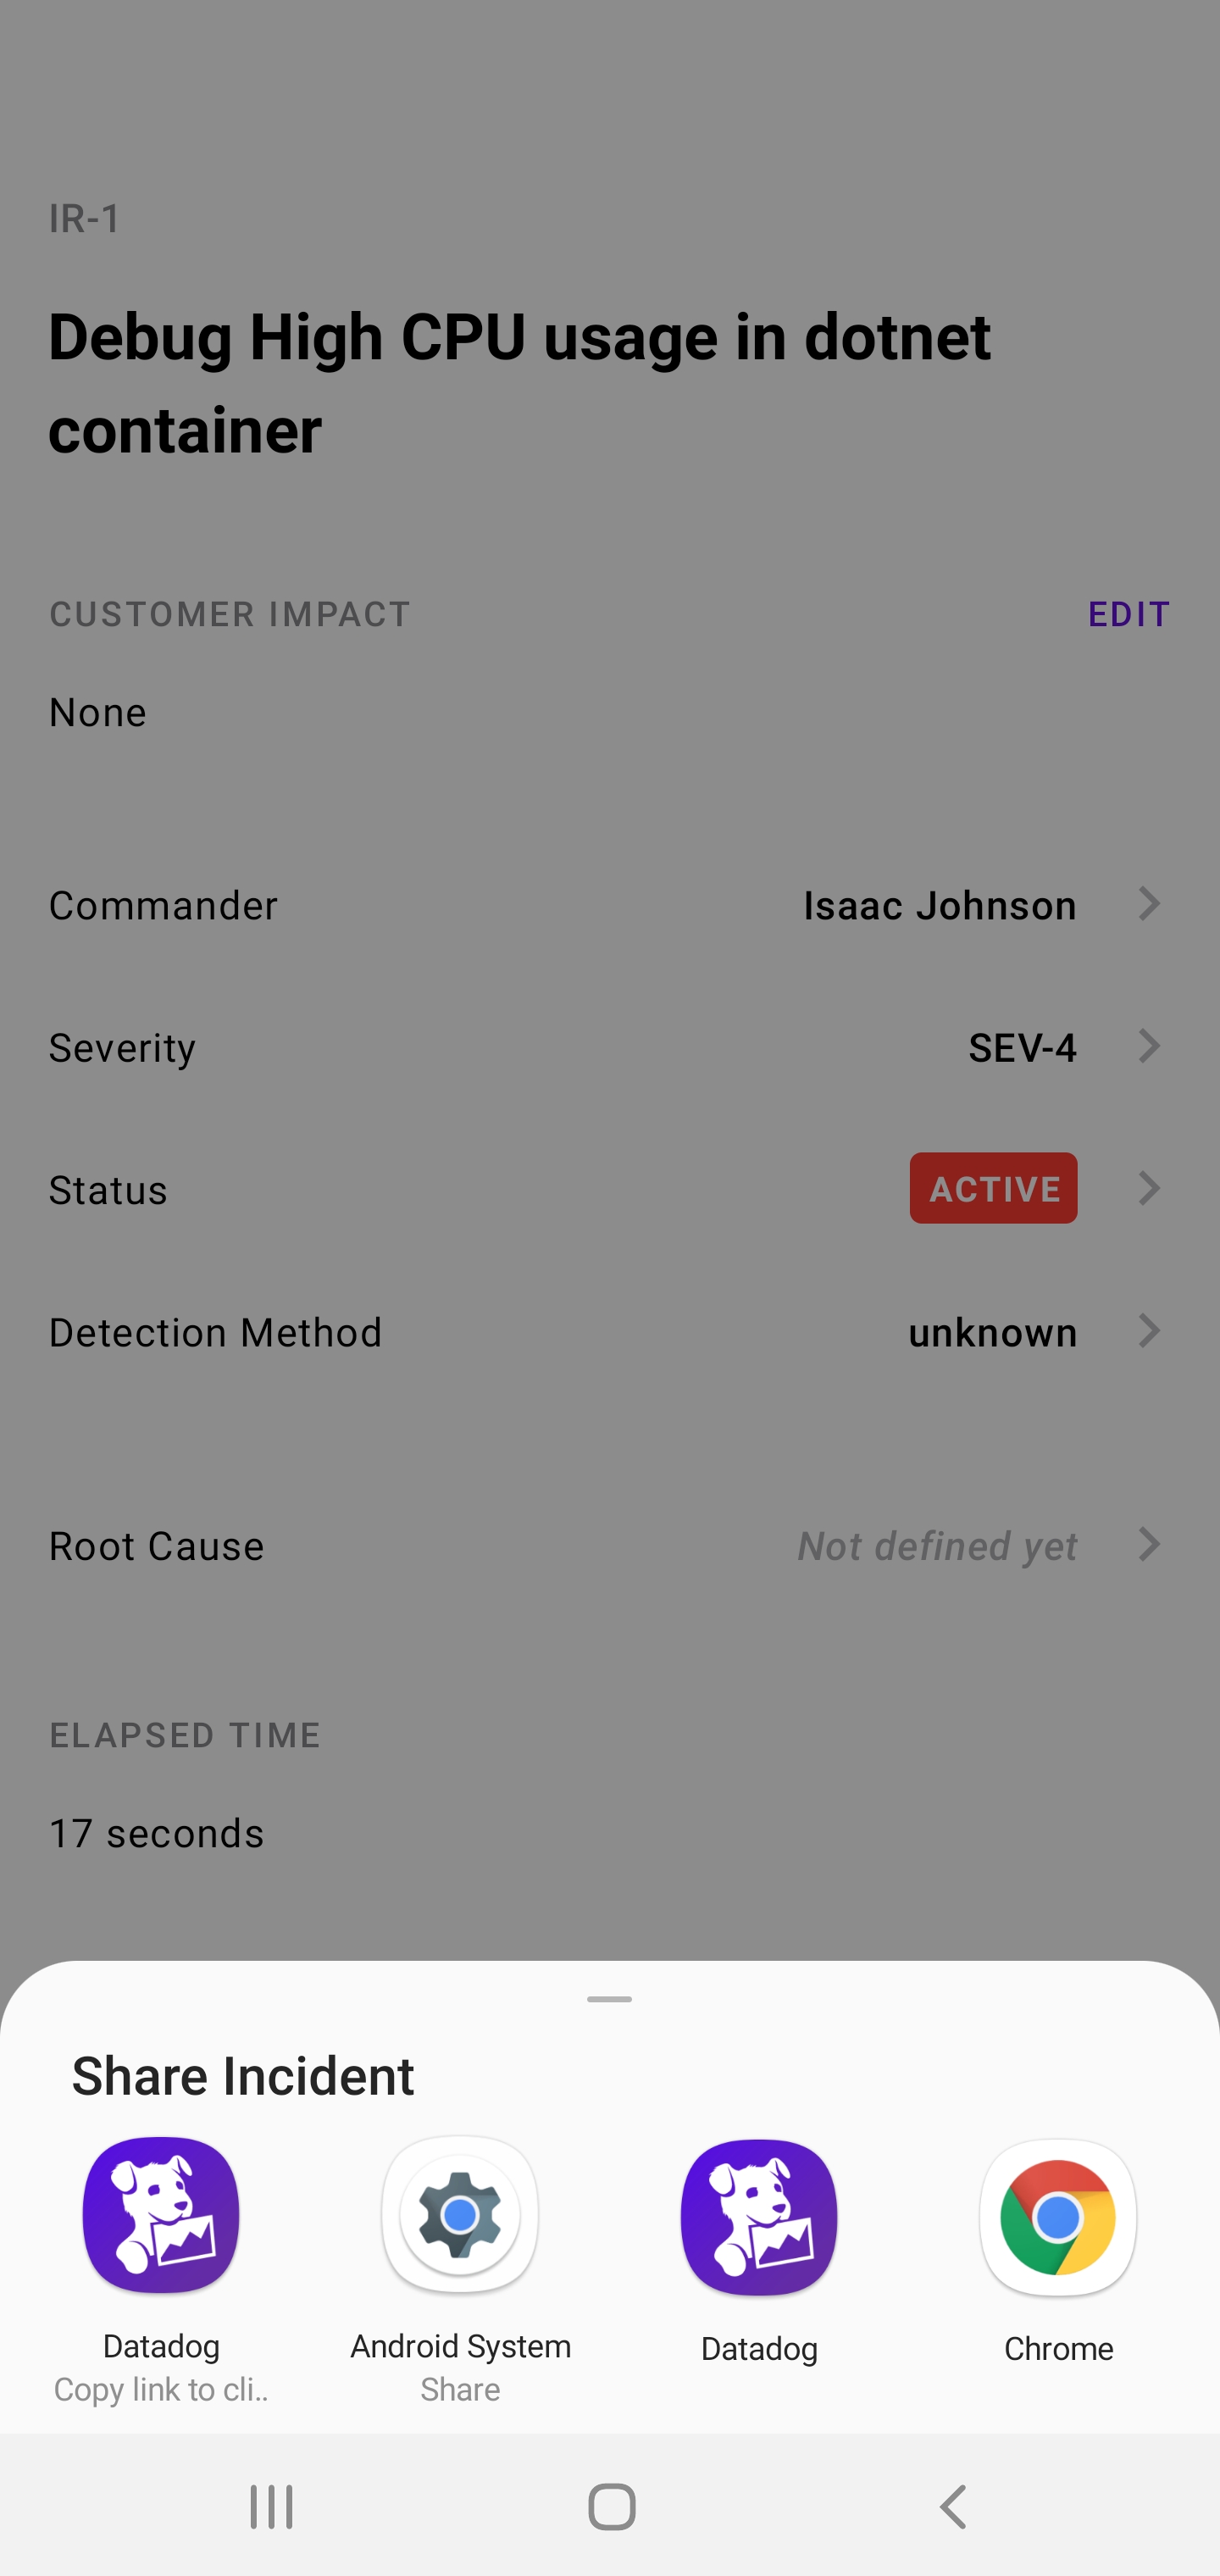
Such as copying the link and sharing it by SMS or to a Teams or Slack channel.
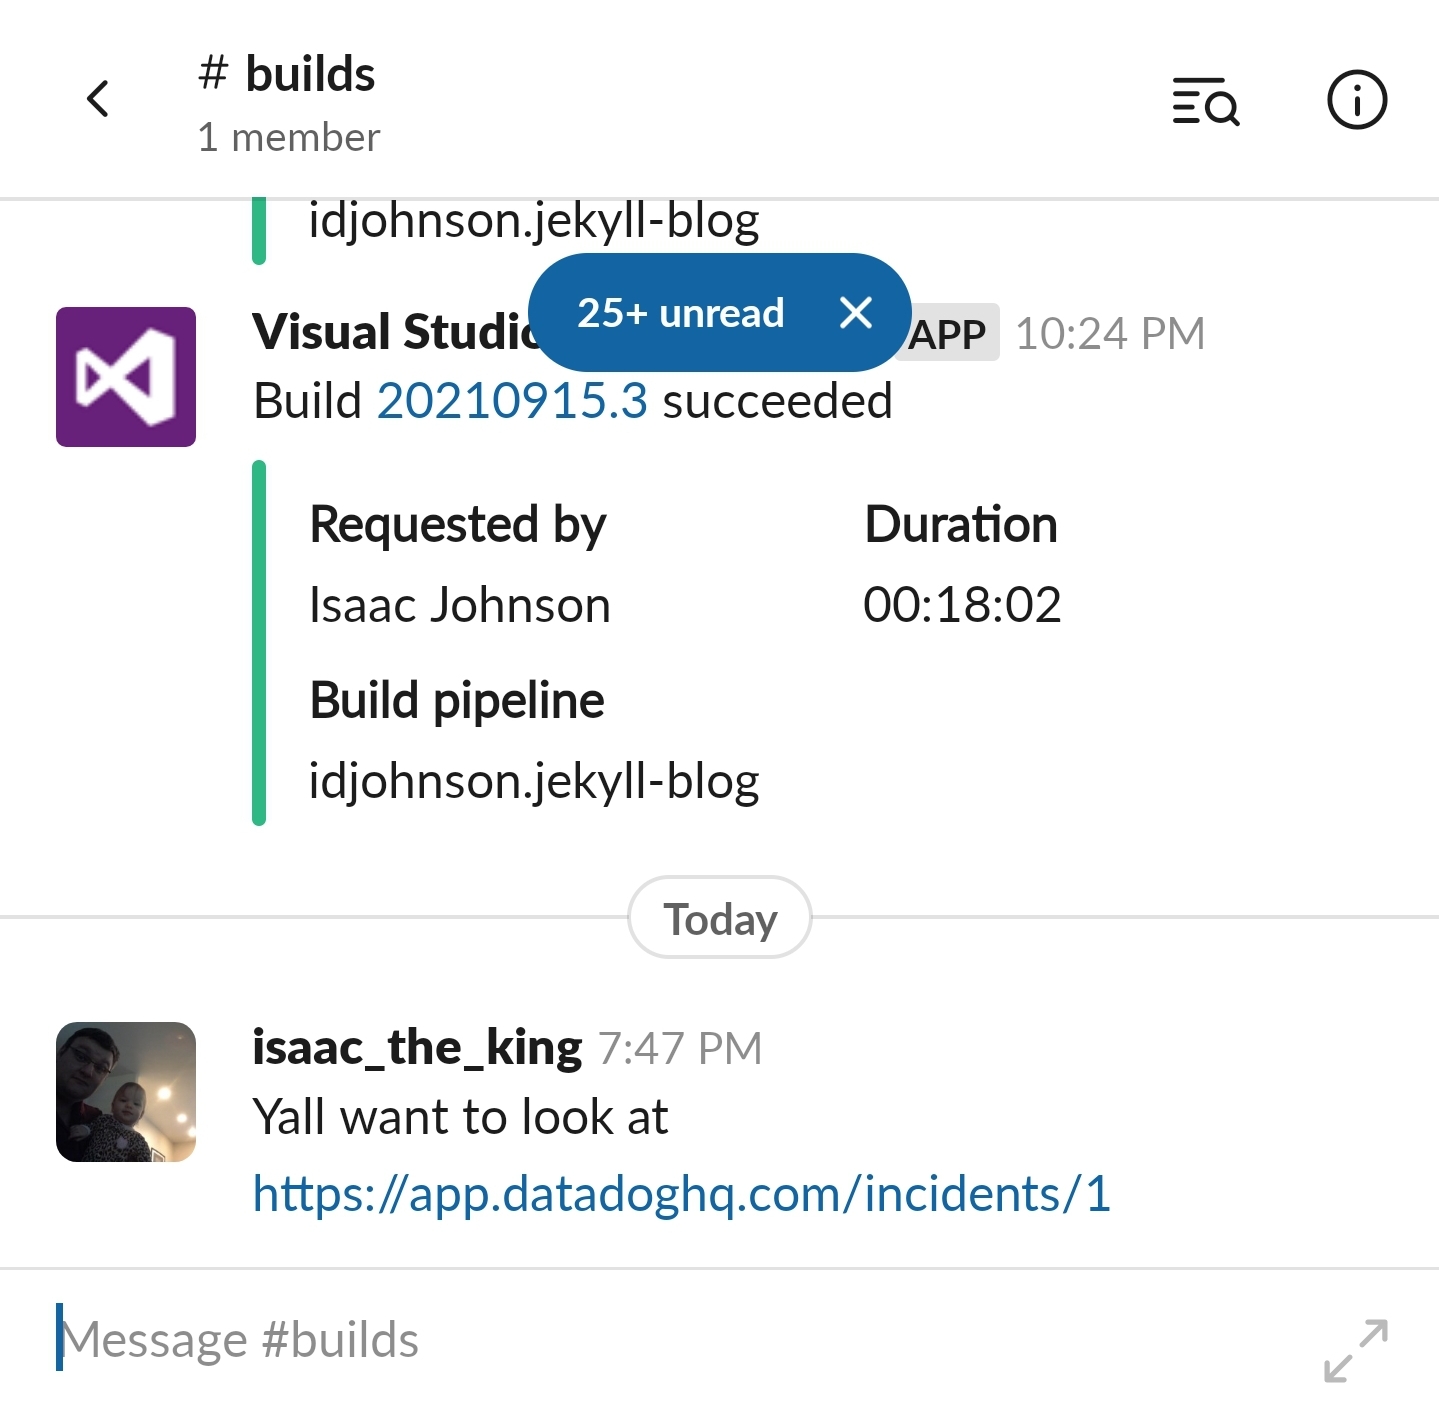

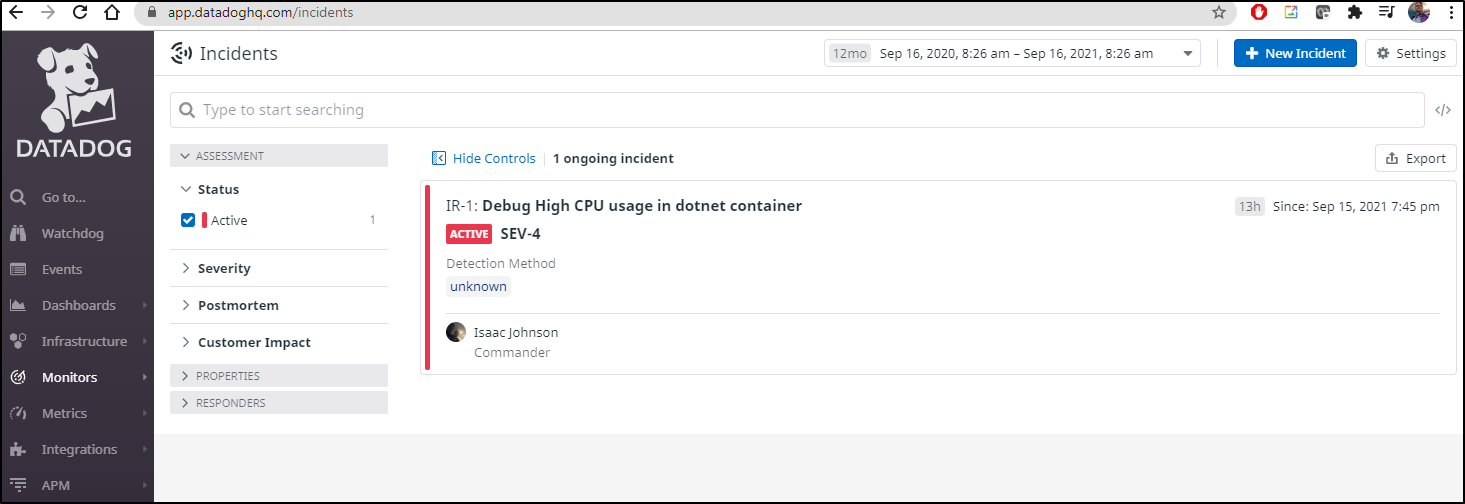
We can always look up details later under incidents:
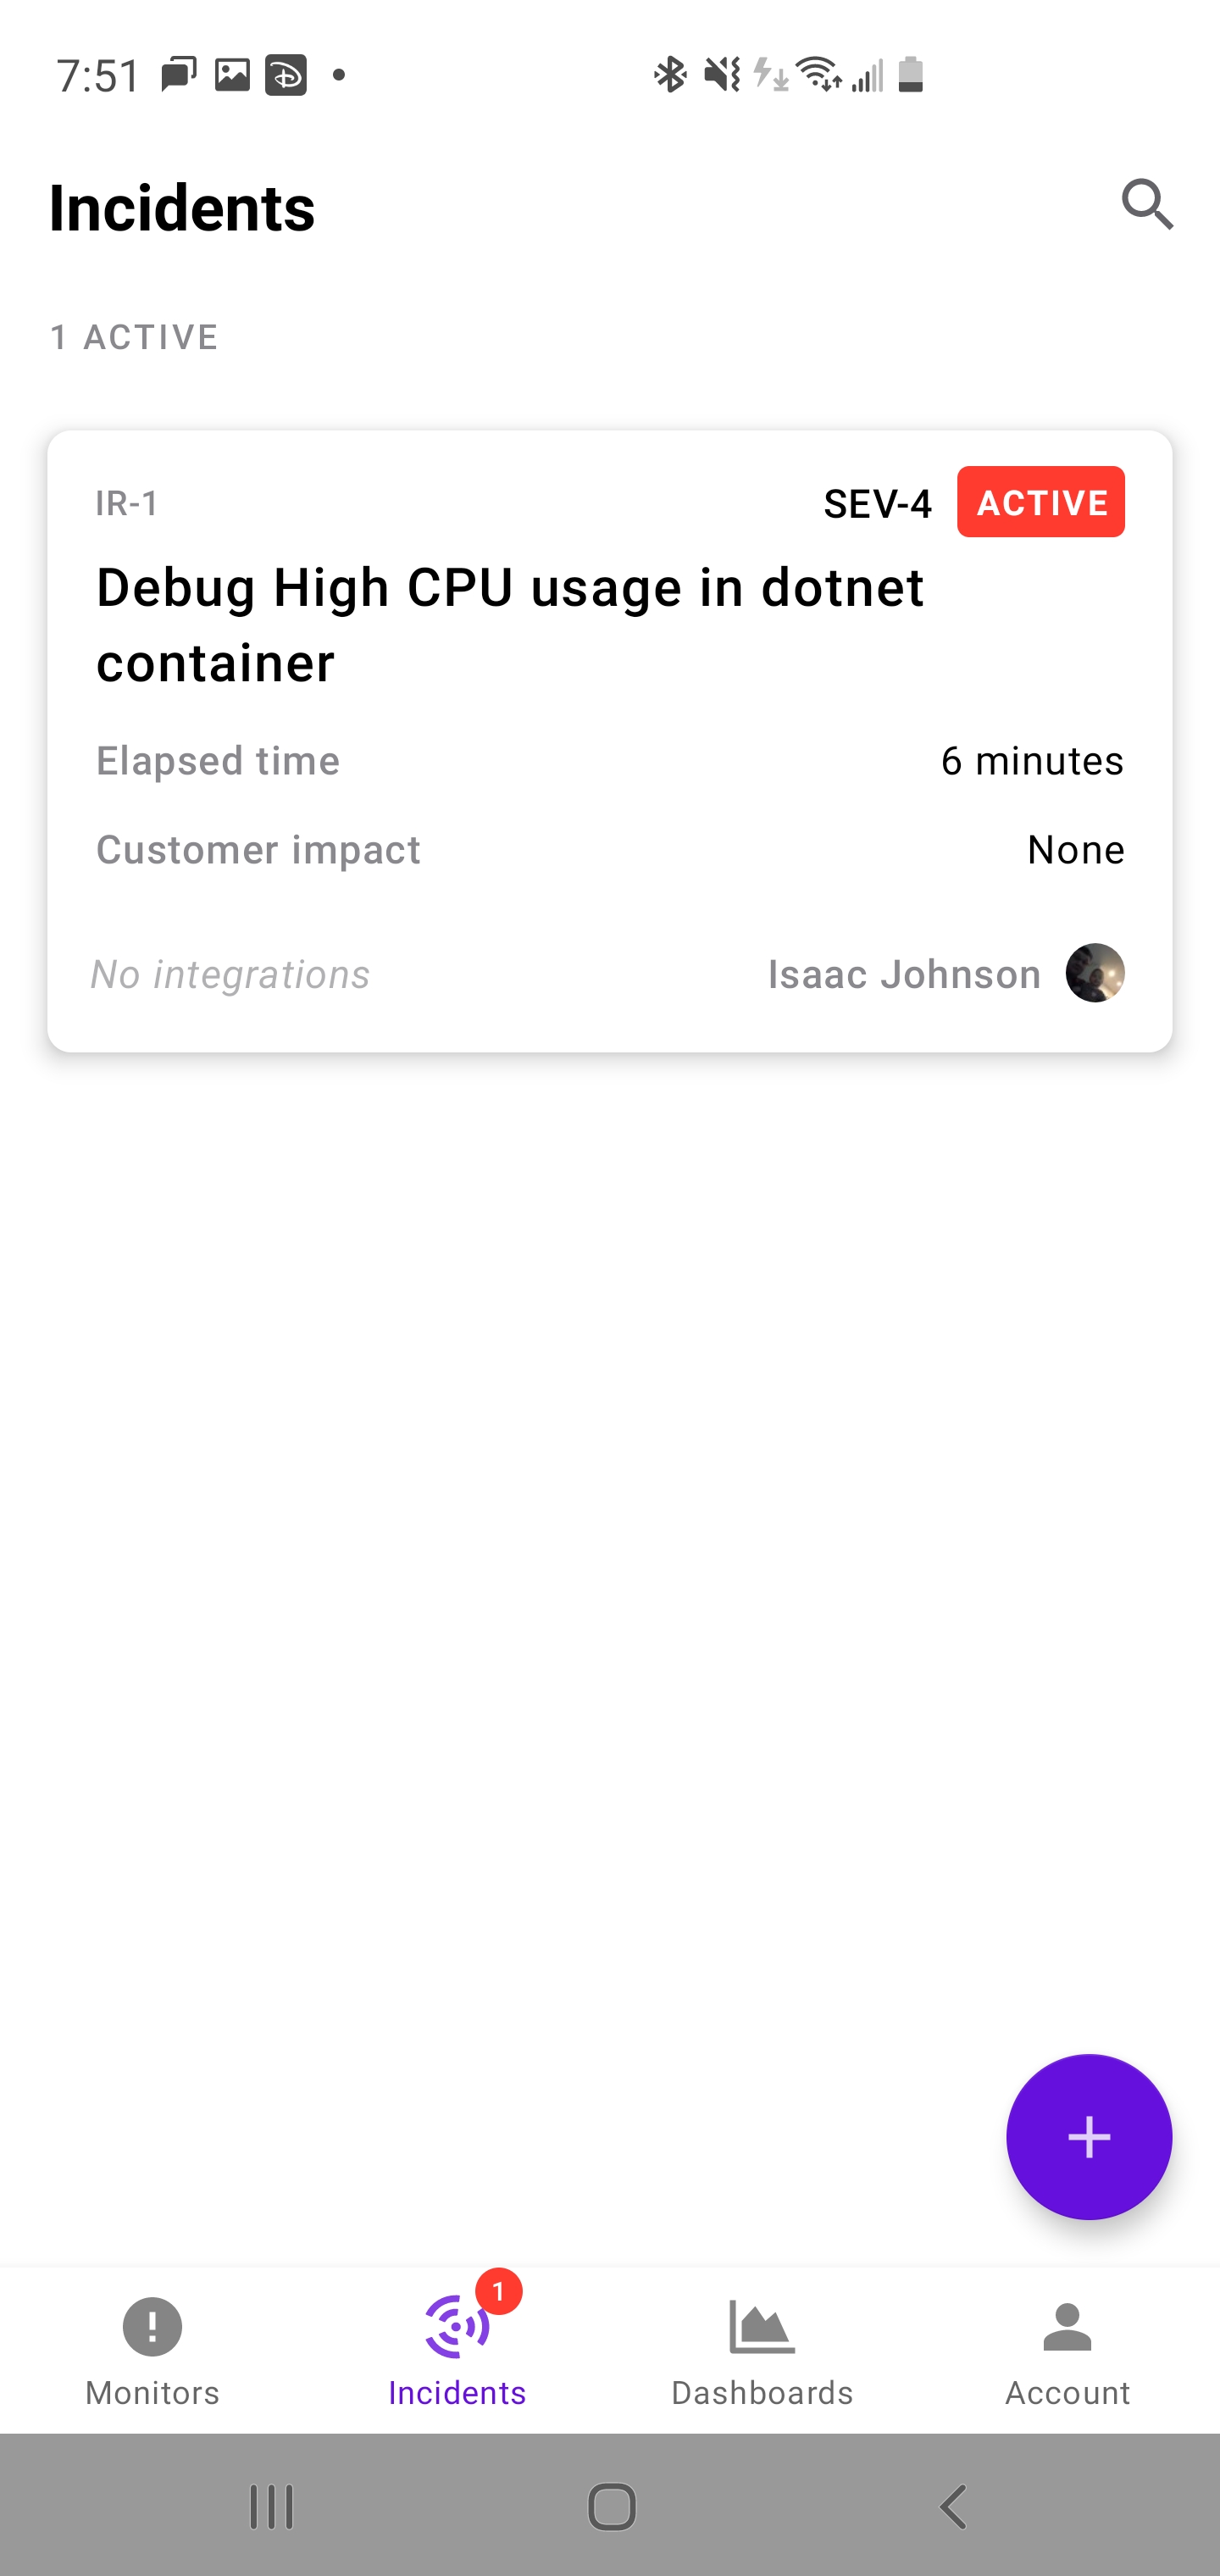
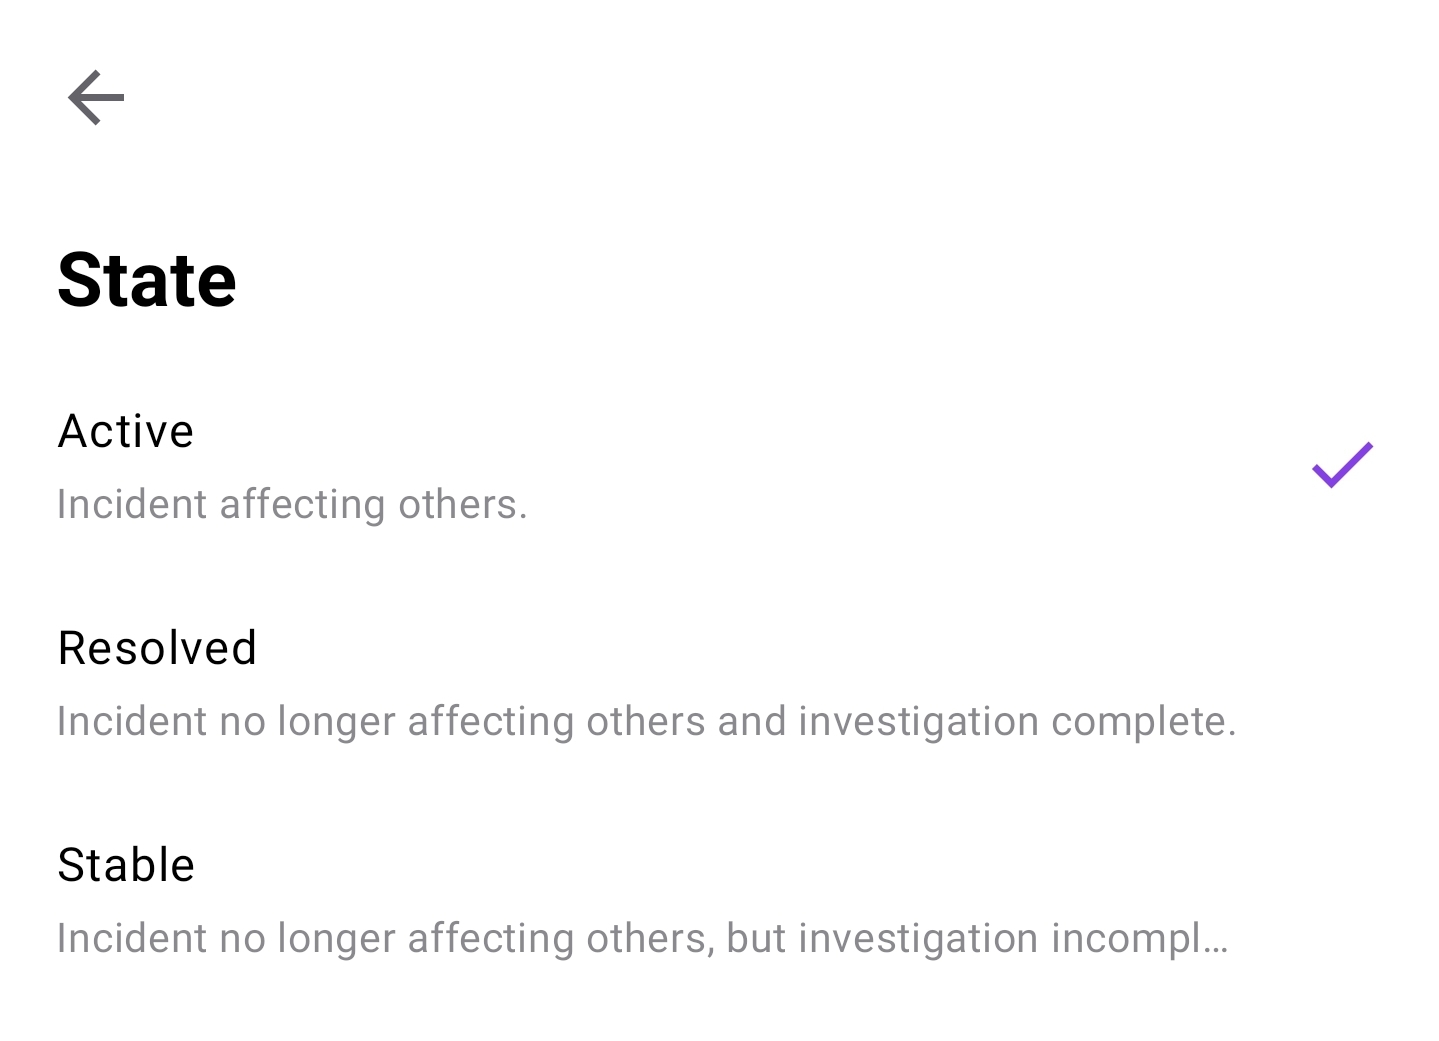
There is not much you can modify by way of proces flow. The 3 states are Active, Resolved and Stable:
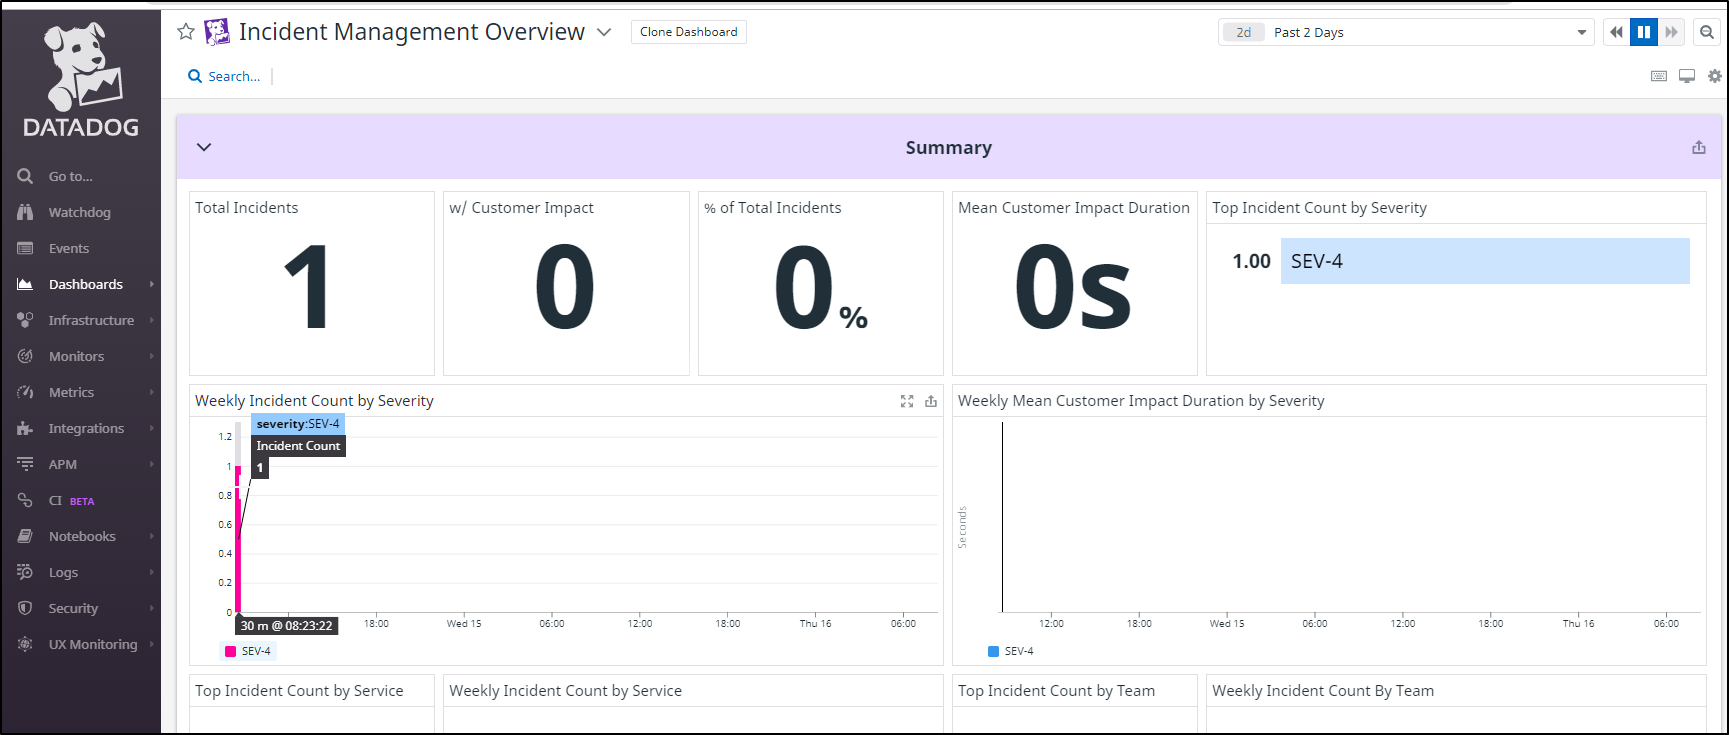
We can also find Incident Management in Dashboards
As well as “Incidents” under the Monitors heading
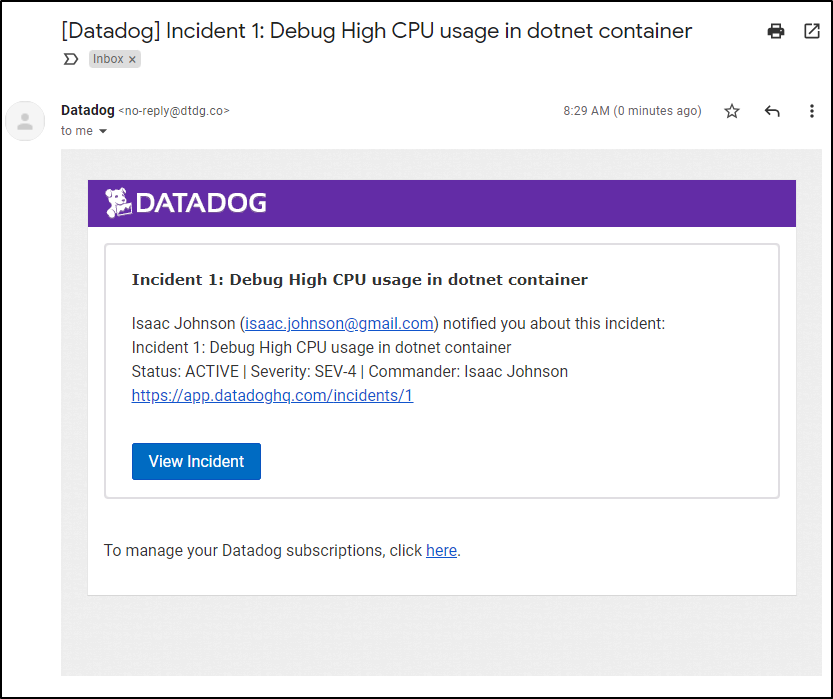
From the new Notifications pane, we can send the incident from the web portal:
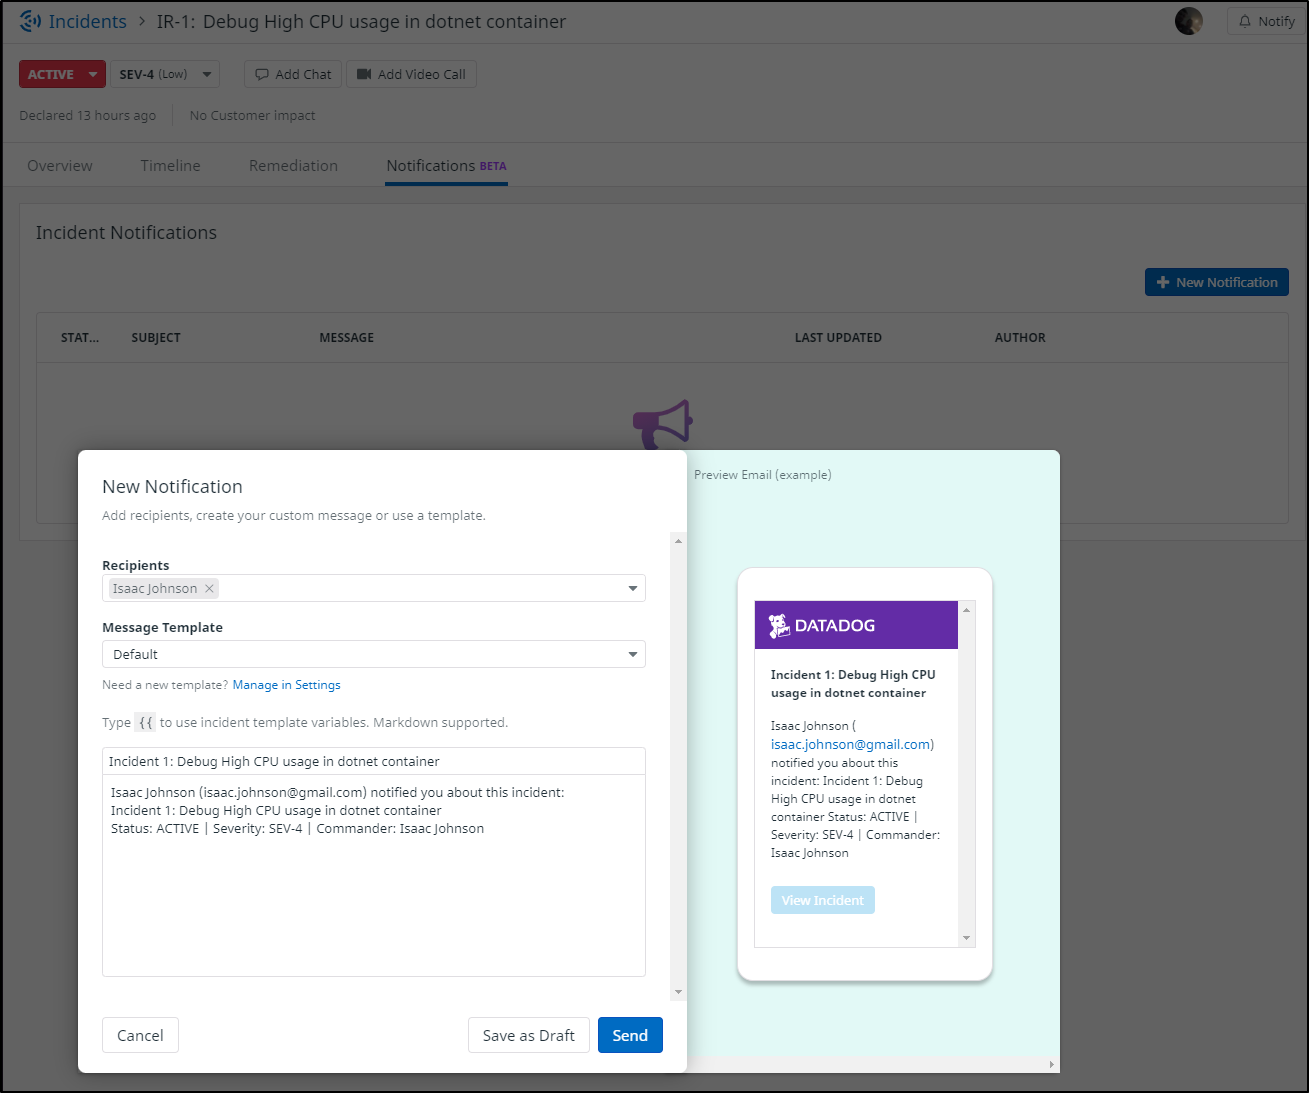
which, if using email, looks like:
Summary
We dug into the issues on the cluster. Highlighting the overcapacity host, we cleanuped up unused services and failing deployments. We cycled some front-end pods which immediately rescheduled to new nodes. Lastly, we removed a cluster in a cluster (k0s) and bounced the Dapr workflow agent, which was the root issue of the high CPU usage.
We updated the Datadog agent with a fresh helm chart and enabled process metrics. We explored those and then setup a Datadog monitor for Anomolies in CPU usage and showed what that would look like.
A quick pro-tip, for the purpose of seeing our cluster by size, we can sort our node pool by memory capacity:
$ kubectl get no -o json | jq -r '.items | sort_by(.status.capacity.memory)[]|[.metadata.name,.status.capacity.memory]| @tsv'
anna-macbookair 8056668Ki
isaac-macbookair        8057256Ki
isaac-macbookpro        8060876Ki
or CPU capacity
$ kubectl get no -o json | jq -r '.items | sort_by(.status.capacity.cpu)[]|[.metadata.name,.status.capacity.cpu]| @tsv'
anna-macbookair 4
isaac-macbookair        4
isaac-macbookpro        4
In our Epilogue section, we looked at some remediation ideas and then created a Datadog incident and showed how we can manage Incidents inside Datadog for basic work item tracking.
I know I come across as a fanboy, but all that I’ve demoed has stayed within the free tier of Datadog which shows how useful that offering can be.