Published: Jul 26, 2021 by Isaac Johnson
When working with Service Meshes, some questions that are often asked are; what microservices are included in my mesh and how are they connected? Additionally, how are they performing and is it safe to modify them?
Kialiis an open source project (now included with the default Istio install) that aims to answer these questions. It run’s under the Apache 2.0 license and is considered part of Isitio and OpenShift Service Mesh (there is no ‘commercial’ standalone Kiali)
Kiali’s commit history goes backto Feb 2018 when John Mazzitelli created the initial repo. Hecontinues to lead sprints and there is active development with things such as envoy integration and traffic replays.
Getting started
First thing we need to do is set up a cluster to run Istio that Kiali will use. We will use a fresh AKS for this.
First create a Resource Group that can hold the cluster
$ az group create --name idjkali01rg --location centralus
{
  "id": "/subscriptions/70b42e6a-6faf-4fed-bcec-9f3995b1aca8/resourceGroups/idjkali01rg",
  "location": "centralus",
  "managedBy": null,
  "name": "idjkali01rg",
  "properties": {
    "provisioningState": "Succeeded"
  },
  "tags": null,
  "type": "Microsoft.Resources/resourceGroups"
}
Next we will create a new Service Principal (App Registration) that will be the identity of the cluster
$ az ad sp create-for-rbac -n idjakskali01sp --skip-assignment --output json > my_sp.json
WARNING: Changing "idjakskali01sp" to a valid URI of "http://idjakskali01sp", which is the required format used for service principal names
WARNING: The output includes credentials that you must protect. Be sure that you do not include these credentials in your code or check the credentials into your source control. For more information, see https://aka.ms/azadsp-cli
$ cat my_sp.json | jq -r .appId
9f3e3d87-75a2-459e-a564-b4a389aec75f
we will want to set env vars for the Client ID and Pass
$ export SP_PASS=`cat my_sp.json | jq -r .password`
$ export SP_ID=`cat my_sp.json | jq -r .appId
At this point we have a resource group in Central US and an identity but not much else. Let’s go ahead and create the cluster. Also it is worth pointing out that most of my prior AKS posts assume Azure CNI networking plugin, but in this case, as we are going to use Istio, we want kubenet so the network option specifies that:
$ az aks create --name idjkali01aks --resource-group idjkali01rg --location centralus --node-count 3 --enable-cluster-autoscaler --min-count 2 --max-count 4 --generate-ssh-keys --network-plugin kubenet --service-principal $SP_ID --client-secret $SP_PASS
{| Finished ..
  "aadProfile": null,
  "addonProfiles": null,
  "agentPoolProfiles": [
    {
      "availabilityZones": null,
      "count": 3,
      "enableAutoScaling": true,
      "enableEncryptionAtHost": false,
      "enableNodePublicIp": false,
      "kubeletConfig": null,
      "kubeletDiskType": "OS",
      "linuxOsConfig": null,
      "maxCount": 4,
      "maxPods": 110,
      "minCount": 2,
      "mode": "System",
      "name": "nodepool1",
      "nodeImageVersion": "AKSUbuntu-1804gen2containerd-2021.06.12",
      "nodeLabels": {},
      "nodePublicIpPrefixId": null,
      "nodeTaints": null,
      "orchestratorVersion": "1.19.11",
      "osDiskSizeGb": 128,
      "osDiskType": "Managed",
      "osType": "Linux",
      "podSubnetId": null,
      "powerState": {
        "code": "Running"
      },
      "provisioningState": "Succeeded",
      "proximityPlacementGroupId": null,
      "scaleSetEvictionPolicy": null,
      "scaleSetPriority": null,
      "spotMaxPrice": null,
      "tags": null,
      "type": "VirtualMachineScaleSets",
      "upgradeSettings": null,
      "vmSize": "Standard_DS2_v2",
      "vnetSubnetId": null
    }
  ],
  "apiServerAccessProfile": null,
  "autoScalerProfile": {
    "balanceSimilarNodeGroups": "false",
    "expander": "random",
    "maxEmptyBulkDelete": "10",
    "maxGracefulTerminationSec": "600",
    "maxNodeProvisionTime": "15m",
    "maxTotalUnreadyPercentage": "45",
    "newPodScaleUpDelay": "0s",
    "okTotalUnreadyCount": "3",
    "scaleDownDelayAfterAdd": "10m",
    "scaleDownDelayAfterDelete": "10s",
    "scaleDownDelayAfterFailure": "3m",
    "scaleDownUnneededTime": "10m",
    "scaleDownUnreadyTime": "20m",
    "scaleDownUtilizationThreshold": "0.5",
    "scanInterval": "10s",
    "skipNodesWithLocalStorage": "false",
    "skipNodesWithSystemPods": "true"
  },
  "autoUpgradeProfile": null,
  "azurePortalFqdn": "idjkali01a-idjkali01rg-70b42e-bafddc22.portal.hcp.centralus.azmk8s.io",
  "diskEncryptionSetId": null,
  "dnsPrefix": "idjkali01a-idjkali01rg-70b42e",
  "enablePodSecurityPolicy": null,
  "enableRbac": true,
  "fqdn": "idjkali01a-idjkali01rg-70b42e-bafddc22.hcp.centralus.azmk8s.io",
  "fqdnSubdomain": null,
  "id": "/subscriptions/70b42e6a-6faf-4fed-bcec-9f3995b1aca8/resourcegroups/idjkali01rg/providers/Microsoft.ContainerService/managedClusters/idjkali01aks",
  "identity": null,
  "identityProfile": null,
  "kubernetesVersion": "1.19.11",
  "linuxProfile": {
    "adminUsername": "azureuser",
    "ssh": {
      "publicKeys": [
        {
          "keyData": "ssh-rsa AAAAB3NzaC1yc2EAAAADAQABAAABAQDLzysqDWJpJ15Sho/NYk3ZHzC36LHw5zE1gyxhEQCH53BSbgA39XVXs/8TUjrkoVi6/YqlliYVg7TMQSjG51d3bLuelMh7IGIPGqSnT5rQe4x9ugdi+rLeFgP8+rf9aGYwkKMd98Aj2i847/deNLFApDoTtI54obZDuhu2ySW23BiQqV3lXuIe/0WwKpG0MFMoXU9JrygPXyNKbgJHR7pLR9U8WVLMF51fmUEeKb5johgrKeIrRMKBtiijaJO8NP6ULuOcQ+Z0VpUUbZZpIqeo8wqdMbDHkyFqh5a5Z1qrY5uDSpqcElqR5SiVesumUfMTBxz83/oprz23e747h8rP"
        }
      ]
    }
  },
  "location": "centralus",
  "maxAgentPools": 100,
  "name": "idjkali01aks",
  "networkProfile": {
    "dnsServiceIp": "10.0.0.10",
    "dockerBridgeCidr": "172.17.0.1/16",
    "loadBalancerProfile": {
      "allocatedOutboundPorts": null,
      "effectiveOutboundIps": [
        {
          "id": "/subscriptions/70b42e6a-6faf-4fed-bcec-9f3995b1aca8/resourceGroups/MC_idjkali01rg_idjkali01aks_centralus/providers/Microsoft.Network/publicIPAddresses/b6832fbf-f4be-49d0-a295-ca870b49b70c",
          "resourceGroup": "MC_idjkali01rg_idjkali01aks_centralus"
        }
      ],
      "idleTimeoutInMinutes": null,
      "managedOutboundIps": {
        "count": 1
      },
      "outboundIpPrefixes": null,
      "outboundIps": null
    },
    "loadBalancerSku": "Standard",
    "networkMode": null,
    "networkPlugin": "kubenet",
    "networkPolicy": null,
    "outboundType": "loadBalancer",
    "podCidr": "10.244.0.0/16",
    "serviceCidr": "10.0.0.0/16"
  },
  "nodeResourceGroup": "MC_idjkali01rg_idjkali01aks_centralus",
  "podIdentityProfile": null,
  "powerState": {
    "code": "Running"
  },
  "privateFqdn": null,
  "provisioningState": "Succeeded",
  "resourceGroup": "idjkali01rg",
  "servicePrincipalProfile": {
    "clientId": "9f3e3d87-75a2-459e-a564-b4a389aec75f",
    "secret": null
  },
  "sku": {
    "name": "Basic",
    "tier": "Free"
  },
  "tags": null,
  "type": "Microsoft.ContainerService/ManagedClusters",
  "windowsProfile": null
}
Verification
$ az aks list -o table
Name Location ResourceGroup KubernetesVersion ProvisioningState Fqdn
------------ ---------- --------------- ------------------- ------------------- --------------------------------------------------------------
idjkali01aks centralus idjkali01rg 1.19.11 Succeeded idjkali01a-idjkali01rg-70b42e-bafddc22.hcp.centralus.azmk8s.io
Get kube config
$ (rm -f ~/.kube/config || true) && az aks get-credentials -n idjkali01aks -g idjkali01rg --admin
Merged "idjkali01aks-admin" as current context in /home/builder/.kube/config
check the nodes
$ kubectl get nodes
NAME STATUS ROLES AGE VERSION
aks-nodepool1-18904454-vmss000000 Ready agent 5m45s v1.19.11
aks-nodepool1-18904454-vmss000001 Ready agent 5m55s v1.19.11
aks-nodepool1-18904454-vmss000002 Ready agent 6m v1.19.11
Istio
Next we will install Istio
We can do this one of two ways. We could start over and use ‘aks-engine’ binary from Istio to do it (guide here) or the standard istioctl method.
builder@DESKTOP-JBA79RT:~/Workspaces/blogKiali$ curl -L https://istio.io/downloadIstio | sh -
  % Total % Received % Xferd Average Speed Time Time Time Current
                                 Dload Upload Total Spent Left Speed
100 102 100 102 0 0 200 0 --:--:-- --:--:-- --:--:-- 200
100 4573 100 4573 0 0 5496 0 --:--:-- --:--:-- --:--:-- 5496

Downloading istio-1.10.3 from https://github.com/istio/istio/releases/download/1.10.3/istio-1.10.3-linux-amd64.tar.gz ...

Istio 1.10.3 Download Complete!

Istio has been successfully downloaded into the istio-1.10.3 folder on your system.

Next Steps:
See https://istio.io/latest/docs/setup/install/ to add Istio to your Kubernetes cluster.

To configure the istioctl client tool for your workstation,
add the /home/builder/Workspaces/blogKiali/istio-1.10.3/bin directory to your environment path variable with:
         export PATH="$PATH:/home/builder/Workspaces/blogKiali/istio-1.10.3/bin"

Begin the Istio pre-installation check by running:
         istioctl x precheck

Need more information? Visit https://istio.io/latest/docs/setup/install/
Now use the binary to install
builder@DESKTOP-JBA79RT:~/Workspaces/blogKiali$ cd istio-1.10.3/
builder@DESKTOP-JBA79RT:~/Workspaces/blogKiali/istio-1.10.3$ export PATH=$PWD/bin:$PATH
builder@DESKTOP-JBA79RT:~/Workspaces/blogKiali/istio-1.10.3$ istioctl install --set profile=demo -y
✔ Istio core installed
✔ Istiod installed
✔ Egress gateways installed
✔ Ingress gateways installed
✔ Installation complete Thank you for installing Istio 1.10. Please take a few minutes to tell us about your install/upgrade experience! https://forms.gle/asdasdfasdfA
Istio is installed but won’t process anything without a namespace annotation. We can just use the default namespace for now.
$ kubectl label namespace default istio-injection=enabled
namespace/default labeled
Sample App
Install the sample application. Here we can use the Istio Bookinfo app to verify things
$ kubectl apply -f https://raw.githubusercontent.com/istio/istio/release-1.10/samples/bookinfo/platform/kube/bookinfo.yaml
service/details created
serviceaccount/bookinfo-details created
deployment.apps/details-v1 created
service/ratings created
serviceaccount/bookinfo-ratings created
deployment.apps/ratings-v1 created
service/reviews created
serviceaccount/bookinfo-reviews created
deployment.apps/reviews-v1 created
deployment.apps/reviews-v2 created
deployment.apps/reviews-v3 created
service/productpage created
serviceaccount/bookinfo-productpage created
deployment.apps/productpage-v1 created
verify it deployed
builder@DESKTOP-JBA79RT:~/Workspaces/blogKiali$ kubectl get svc
NAME TYPE CLUSTER-IP EXTERNAL-IP PORT(S) AGE
details ClusterIP 10.0.33.167 <none> 9080/TCP 40s
kubernetes ClusterIP 10.0.0.1 <none> 443/TCP 14m
productpage ClusterIP 10.0.182.11 <none> 9080/TCP 39s
ratings ClusterIP 10.0.37.171 <none> 9080/TCP 40s
reviews ClusterIP 10.0.144.106 <none> 9080/TCP 40s
builder@DESKTOP-JBA79RT:~/Workspaces/blogKiali$ kubectl get pods
NAME READY STATUS RESTARTS AGE
details-v1-79f774bdb9-cs2t4 2/2 Running 0 46s
productpage-v1-6b746f74dc-zxxgp 1/2 Running 0 45s
ratings-v1-b6994bb9-vqqdx 2/2 Running 0 46s
reviews-v1-545db77b95-fxf5p 2/2 Running 0 45s
reviews-v2-7bf8c9648f-nssfn 2/2 Running 0 45s
reviews-v3-84779c7bbc-ncp92 2/2 Running 0 45s
and test we can view the page
$ kubectl exec "$(kubectl get pod -l app=ratings -o jsonpath='{.items[0].metadata.name}')" -c ratings -- curl -sS productpage:9080/productpage | grep -o "<title>.*</title>"
<title>Simple Bookstore App</title>
Open up for ingress
$ kubectl apply -f https://raw.githubusercontent.com/istio/istio/release-1.10/samples/bookinfo/networking/bookinfo-gateway.yaml
gateway.networking.istio.io/bookinfo-gateway created
virtualservice.networking.istio.io/bookinfo created
And we can use istioctl to verify that there are no issues
$ istioctl analyze

✔ No validation issues found when analyzing namespace: default.
So far the only external IP that has been exposed is from Istio itself:
$ kubectl get svc -n istio-system
NAME TYPE CLUSTER-IP EXTERNAL-IP PORT(S) AGE
istio-egressgateway ClusterIP 10.0.229.168 <none> 80/TCP,443/TCP 6m33s
istio-ingressgateway LoadBalancer 10.0.70.246 52.158.213.88 15021:32345/TCP,80:31104/TCP,443:30775/TCP,31400:32066/TCP,15443:30301/TCP 6m33s
istiod ClusterIP 10.0.53.101 <none> 15010/TCP,15012/TCP,443/TCP,15014/TCP 6m46s
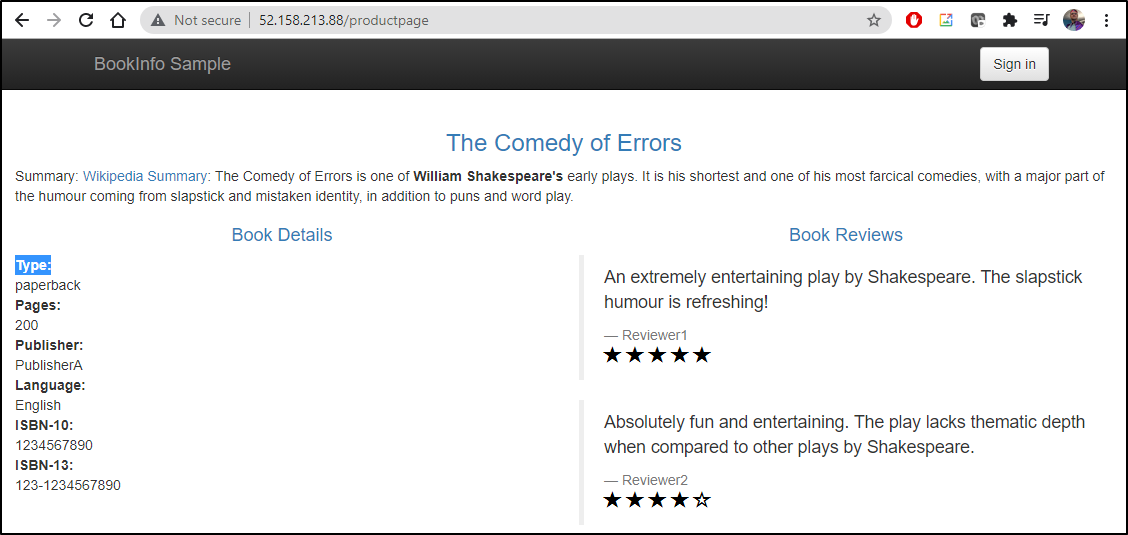
We can get to the product page via the ingress url and port:
$ export INGRESS_HOST=$(kubectl -n istio-system get service istio-ingressgateway -o jsonpath='{.status.loadBalancer.ingress[0].ip}')
$ export INGRESS_PORT=$(kubectl -n istio-system get service istio-ingressgateway -o jsonpath='{.spec.ports[?(@.name=="http2")].port}')
$ export SECURE_INGRESS_PORT=$(kubectl -n istio-system get service istio-ingressgateway -o jsonpath='{.spec.ports[?(@.name=="https")].port}')

$ echo "http://$INGRESS_HOST:$INGRESS_PORT/productpage"
http://52.158.213.88:80/productpage
$ echo "https://$INGRESS_HOST:$SECURE_INGRESS_PORT/productpage"
https://52.158.213.88:443/productpage
Add the standard add ons including Kiali , Prometheus and Graphana.
$ kubectl apply -f samples/addons
serviceaccount/grafana created
configmap/grafana created
service/grafana created
deployment.apps/grafana created
configmap/istio-grafana-dashboards created
configmap/istio-services-grafana-dashboards created
deployment.apps/jaeger created
service/tracing created
service/zipkin created
service/jaeger-collector created
customresourcedefinition.apiextensions.k8s.io/monitoringdashboards.monitoring.kiali.io created
serviceaccount/kiali created
configmap/kiali created
clusterrole.rbac.authorization.k8s.io/kiali-viewer created
clusterrole.rbac.authorization.k8s.io/kiali created
clusterrolebinding.rbac.authorization.k8s.io/kiali created
role.rbac.authorization.k8s.io/kiali-controlplane created
rolebinding.rbac.authorization.k8s.io/kiali-controlplane created
service/kiali created
deployment.apps/kiali created
serviceaccount/prometheus created
configmap/prometheus created
clusterrole.rbac.authorization.k8s.io/prometheus created
clusterrolebinding.rbac.authorization.k8s.io/prometheus created
service/prometheus created
deployment.apps/prometheus created
serviceaccount/prometheus unchanged
configmap/prometheus configured
clusterrole.rbac.authorization.k8s.io/prometheus configured
clusterrolebinding.rbac.authorization.k8s.io/prometheus unchanged
service/prometheus unchanged
deployment.apps/prometheus configured
serviceaccount/prometheus unchanged
configmap/prometheus configured
clusterrole.rbac.authorization.k8s.io/prometheus unchanged
clusterrolebinding.rbac.authorization.k8s.io/prometheus unchanged
service/prometheus unchanged
deployment.apps/prometheus configured
unable to recognize "samples/addons/kiali.yaml": no matches for kind "MonitoringDashboard" in version "monitoring.kiali.io/v1alpha1"
unable to recognize "samples/addons/kiali.yaml": no matches for kind "MonitoringDashboard" in version "monitoring.kiali.io/v1alpha1"
unable to recognize "samples/addons/kiali.yaml": no matches for kind "MonitoringDashboard" in version "monitoring.kiali.io/v1alpha1"
unable to recognize "samples/addons/kiali.yaml": no matches for kind "MonitoringDashboard" in version "monitoring.kiali.io/v1alpha1"
unable to recognize "samples/addons/kiali.yaml": no matches for kind "MonitoringDashboard" in version "monitoring.kiali.io/v1alpha1"
unable to recognize "samples/addons/kiali.yaml": no matches for kind "MonitoringDashboard" in version "monitoring.kiali.io/v1alpha1"
unable to recognize "samples/addons/kiali.yaml": no matches for kind "MonitoringDashboard" in version "monitoring.kiali.io/v1alpha1"
unable to recognize "samples/addons/kiali.yaml": no matches for kind "MonitoringDashboard" in version "monitoring.kiali.io/v1alpha1"
unable to recognize "samples/addons/kiali.yaml": no matches for kind "MonitoringDashboard" in version "monitoring.kiali.io/v1alpha1"
unable to recognize "samples/addons/kiali.yaml": no matches for kind "MonitoringDashboard" in version "monitoring.kiali.io/v1alpha1"
unable to recognize "samples/addons/kiali.yaml": no matches for kind "MonitoringDashboard" in version "monitoring.kiali.io/v1alpha1"
unable to recognize "samples/addons/kiali.yaml": no matches for kind "MonitoringDashboard" in version "monitoring.kiali.io/v1alpha1"
unable to recognize "samples/addons/kiali.yaml": no matches for kind "MonitoringDashboard" in version "monitoring.kiali.io/v1alpha1"
unable to recognize "samples/addons/kiali.yaml": no matches for kind "MonitoringDashboard" in version "monitoring.kiali.io/v1alpha1"
unable to recognize "samples/addons/kiali.yaml": no matches for kind "MonitoringDashboard" in version "monitoring.kiali.io/v1alpha1"
unable to recognize "samples/addons/kiali.yaml": no matches for kind "MonitoringDashboard" in version "monitoring.kiali.io/v1alpha1"
unable to recognize "samples/addons/kiali.yaml": no matches for kind "MonitoringDashboard" in version "monitoring.kiali.io/v1alpha1"
unable to recognize "samples/addons/kiali.yaml": no matches for kind "MonitoringDashboard" in version "monitoring.kiali.io/v1alpha1"
unable to recognize "samples/addons/kiali.yaml": no matches for kind "MonitoringDashboard" in version "monitoring.kiali.io/v1alpha1"
unable to recognize "samples/addons/kiali.yaml": no matches for kind "MonitoringDashboard" in version "monitoring.kiali.io/v1alpha1"
Since i got errors the first time (presumably some CRDs were being added), i re-ran without errors:
$ kubectl apply -f samples/addons
serviceaccount/grafana unchanged
configmap/grafana unchanged
service/grafana unchanged
deployment.apps/grafana configured
configmap/istio-grafana-dashboards configured
configmap/istio-services-grafana-dashboards configured
deployment.apps/jaeger unchanged
service/tracing unchanged
service/zipkin unchanged
service/jaeger-collector unchanged
customresourcedefinition.apiextensions.k8s.io/monitoringdashboards.monitoring.kiali.io unchanged
serviceaccount/kiali unchanged
configmap/kiali unchanged
clusterrole.rbac.authorization.k8s.io/kiali-viewer unchanged
clusterrole.rbac.authorization.k8s.io/kiali unchanged
clusterrolebinding.rbac.authorization.k8s.io/kiali unchanged
role.rbac.authorization.k8s.io/kiali-controlplane unchanged
rolebinding.rbac.authorization.k8s.io/kiali-controlplane unchanged
service/kiali unchanged
deployment.apps/kiali unchanged
monitoringdashboard.monitoring.kiali.io/envoy created
monitoringdashboard.monitoring.kiali.io/go created
monitoringdashboard.monitoring.kiali.io/kiali created
monitoringdashboard.monitoring.kiali.io/micrometer-1.0.6-jvm-pool created
monitoringdashboard.monitoring.kiali.io/micrometer-1.0.6-jvm created
monitoringdashboard.monitoring.kiali.io/micrometer-1.1-jvm created
monitoringdashboard.monitoring.kiali.io/microprofile-1.1 created
monitoringdashboard.monitoring.kiali.io/microprofile-x.y created
monitoringdashboard.monitoring.kiali.io/nodejs created
monitoringdashboard.monitoring.kiali.io/quarkus created
monitoringdashboard.monitoring.kiali.io/springboot-jvm-pool created
monitoringdashboard.monitoring.kiali.io/springboot-jvm created
monitoringdashboard.monitoring.kiali.io/springboot-tomcat created
monitoringdashboard.monitoring.kiali.io/thorntail created
monitoringdashboard.monitoring.kiali.io/tomcat created
monitoringdashboard.monitoring.kiali.io/vertx-client created
monitoringdashboard.monitoring.kiali.io/vertx-eventbus created
monitoringdashboard.monitoring.kiali.io/vertx-jvm created
monitoringdashboard.monitoring.kiali.io/vertx-pool created
monitoringdashboard.monitoring.kiali.io/vertx-server created
serviceaccount/prometheus unchanged
configmap/prometheus configured
clusterrole.rbac.authorization.k8s.io/prometheus configured
clusterrolebinding.rbac.authorization.k8s.io/prometheus unchanged
service/prometheus unchanged
deployment.apps/prometheus configured
serviceaccount/prometheus unchanged
configmap/prometheus configured
clusterrole.rbac.authorization.k8s.io/prometheus configured
clusterrolebinding.rbac.authorization.k8s.io/prometheus unchanged
service/prometheus unchanged
deployment.apps/prometheus configured
serviceaccount/prometheus unchanged
configmap/prometheus configured
clusterrole.rbac.authorization.k8s.io/prometheus unchanged
clusterrolebinding.rbac.authorization.k8s.io/prometheus unchanged
service/prometheus unchanged
deployment.apps/prometheus configured
Check on Kiali deployment
$ kubectl rollout status deployment/kiali -n istio-system
deployment "kiali" successfully rolled out
We could view the dashboard now:
However, we would really like to use the latest Kiali dashboard, so let’s delete the existing deployment and deploy a fresh one via helm
builder@DESKTOP-JBA79RT:~/Workspaces/blogKiali/istio-1.10.3$ kubectl delete -f samples/addons/kiali.yaml --ignore-not-found
customresourcedefinition.apiextensions.k8s.io "monitoringdashboards.monitoring.kiali.io" deleted
serviceaccount "kiali" deleted
configmap "kiali" deleted
clusterrole.rbac.authorization.k8s.io "kiali-viewer" deleted
clusterrole.rbac.authorization.k8s.io "kiali" deleted
clusterrolebinding.rbac.authorization.k8s.io "kiali" deleted
role.rbac.authorization.k8s.io "kiali-controlplane" deleted
rolebinding.rbac.authorization.k8s.io "kiali-controlplane" deleted
service "kiali" deleted
deployment.apps "kiali" deleted
And then install fresh
$ helm install --namespace istio-system --set auth.strategy="anonymous" --repo https://kiali.org/helm-charts kiali-server kiali-server
NAME: kiali-server
LAST DEPLOYED: Thu Jul 22 06:46:46 2021
NAMESPACE: istio-system
STATUS: deployed
REVISION: 1
TEST SUITE: None
NOTES:
Welcome to Kiali! For more details on Kiali, see: https://kiali.io

The Kiali Server [v1.37.0] has been installed in namespace [istio-system]. It will be ready soon.

(Helm: Chart=[kiali-server], Release=[kiali-server], Version=[1.37.0])
This is largely the same but a newer version
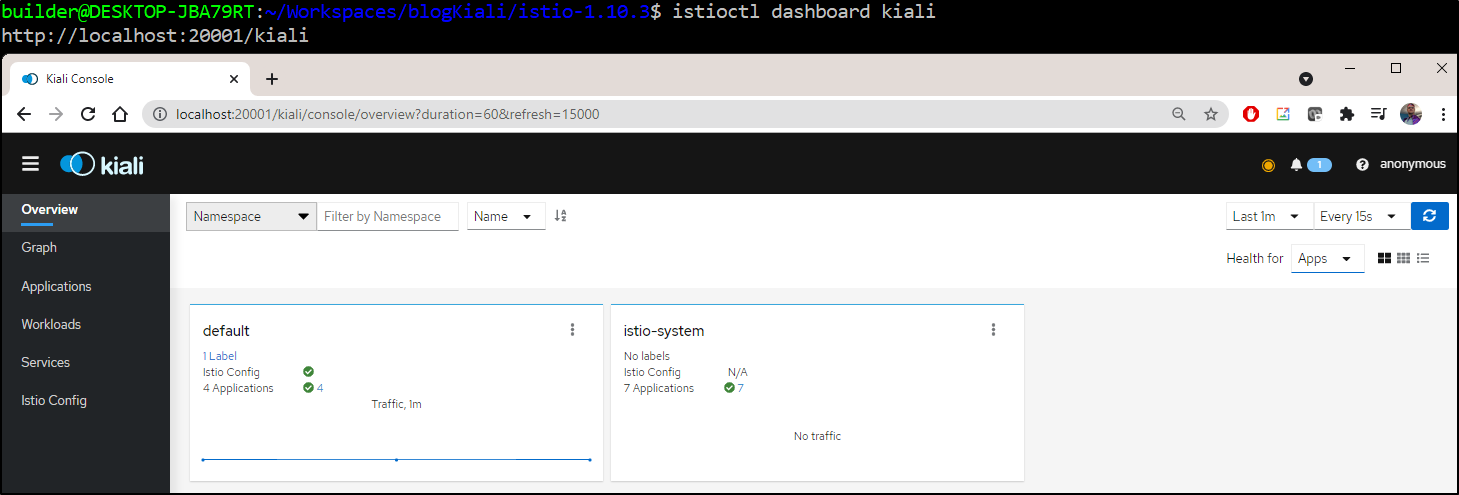
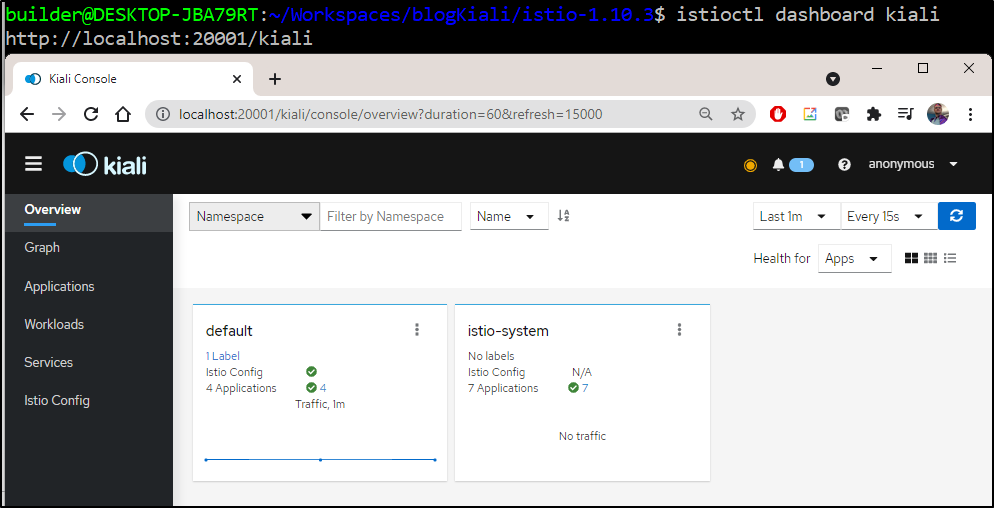
We can now view our sample application (bookinfo)
I hit the URL then checked the details on product page to see a full trace:
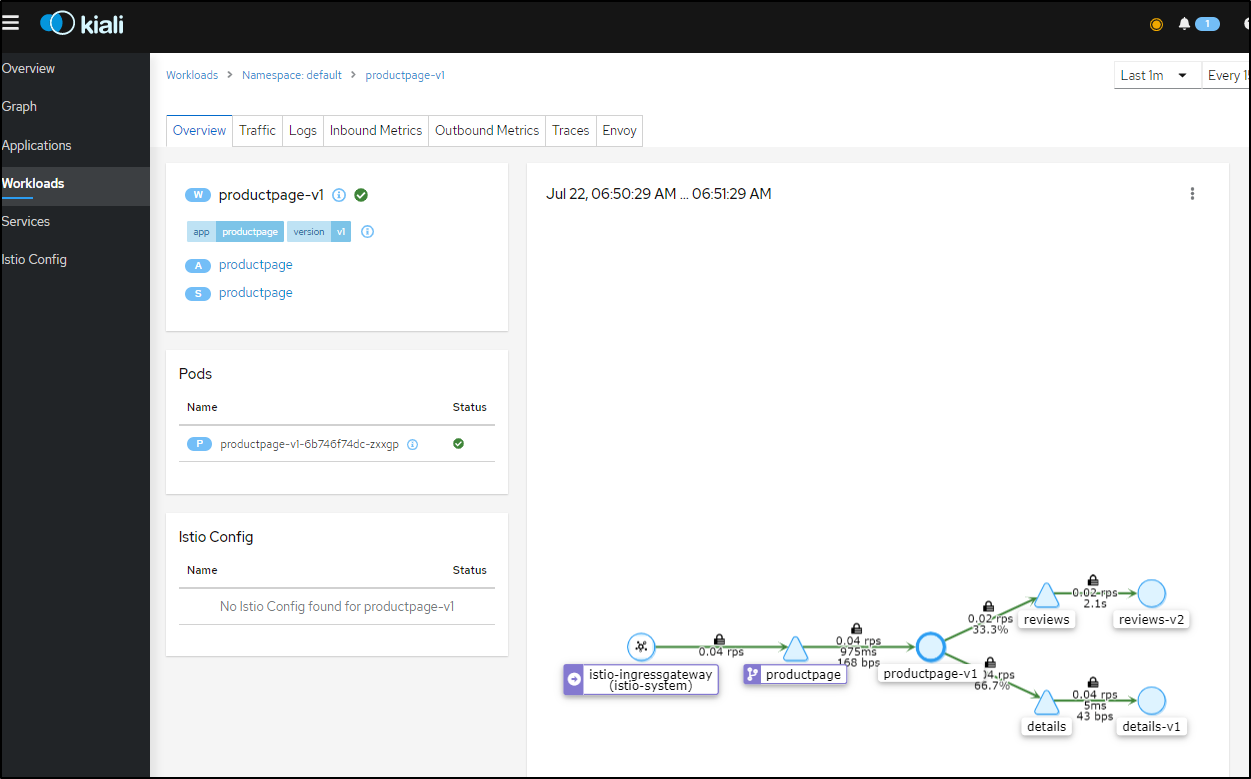
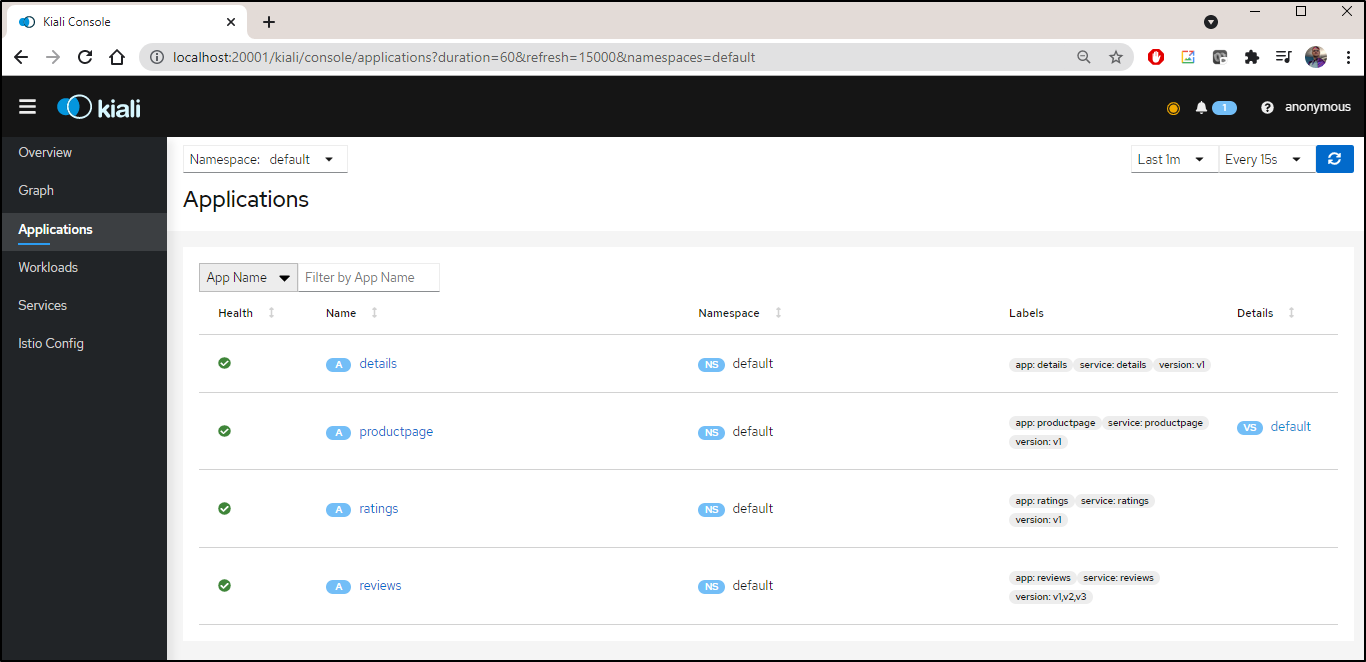
I can refresh the URL a few times and see updated details
If i pick a given service, like the triangle with “productpage” listed above, i can scope to just that app
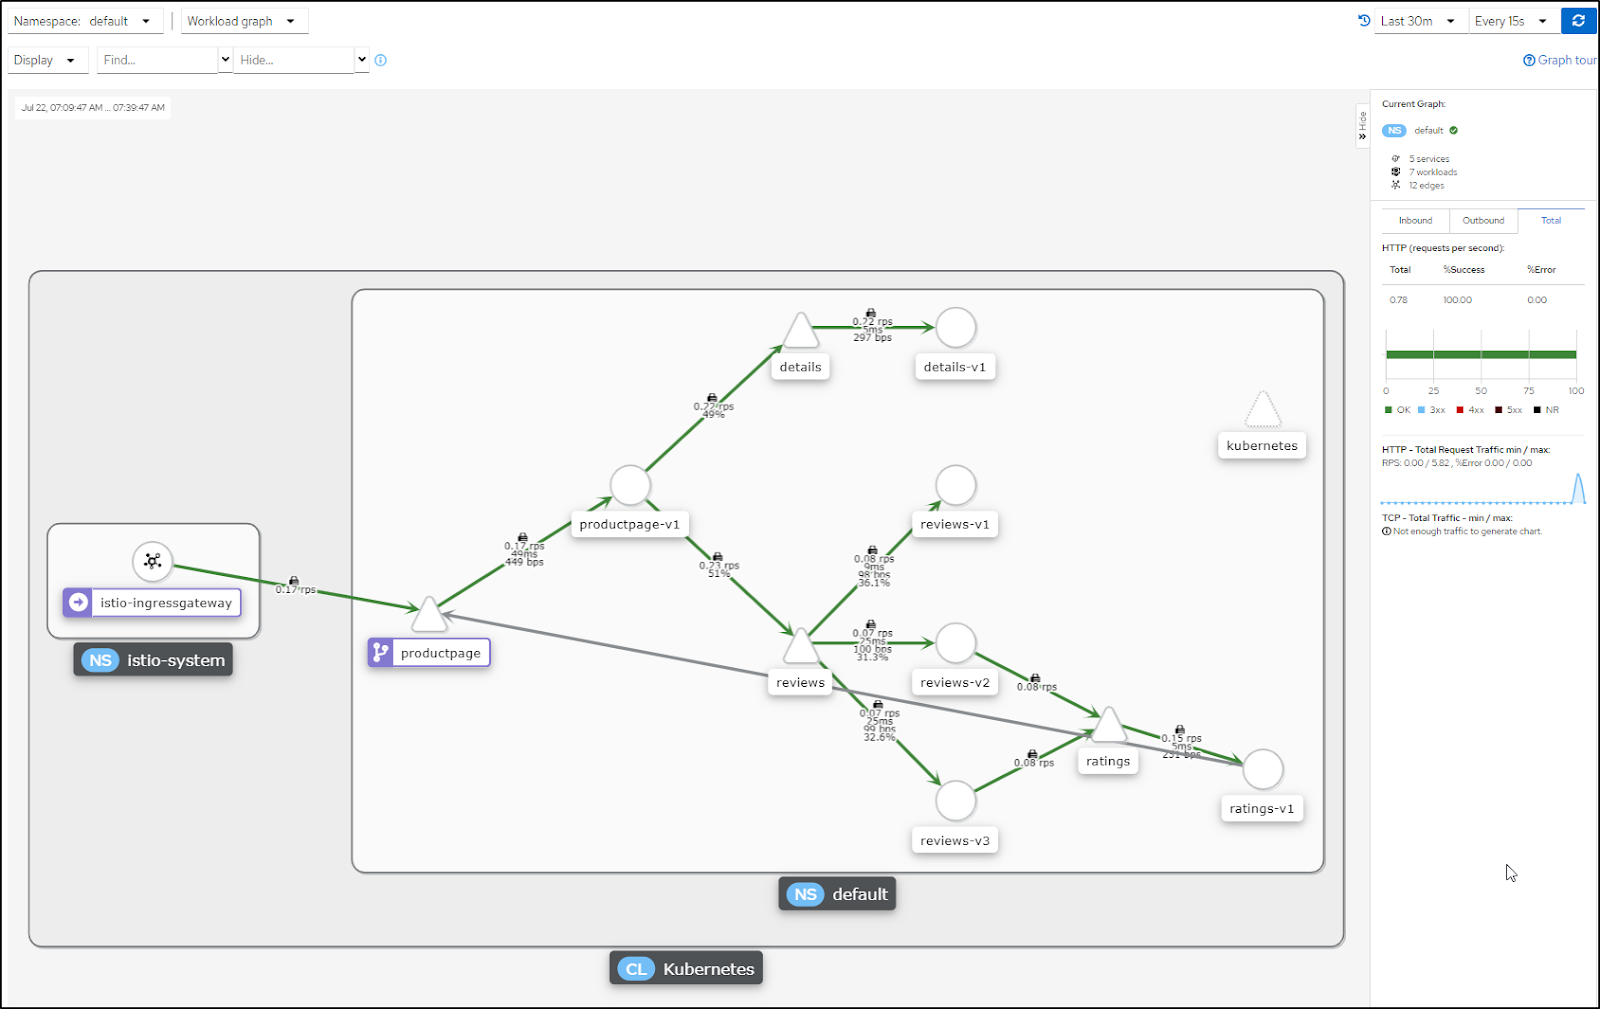
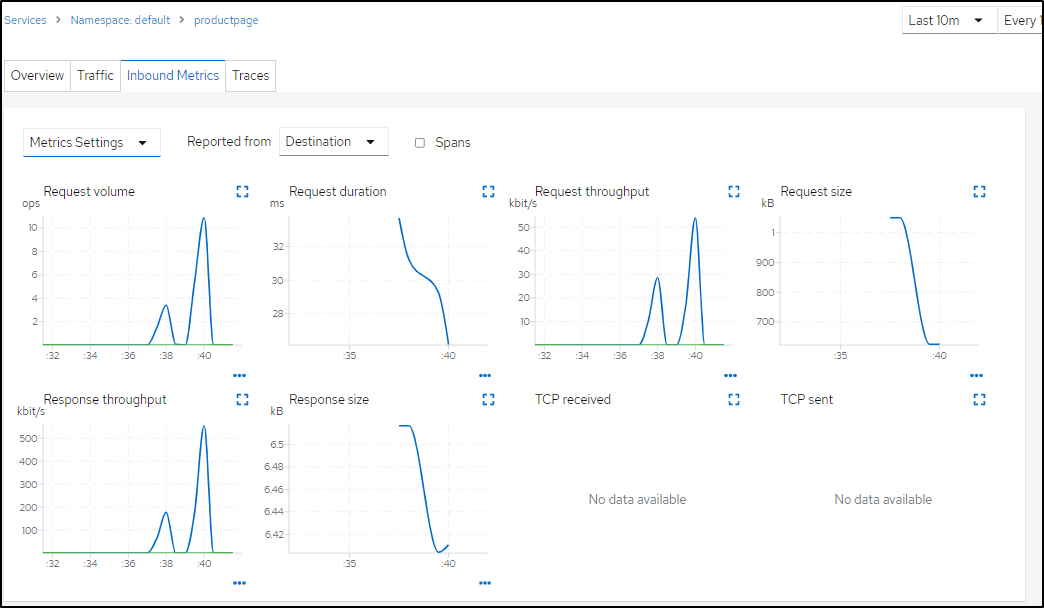
In Traffic, we can monitor how successful our apps are
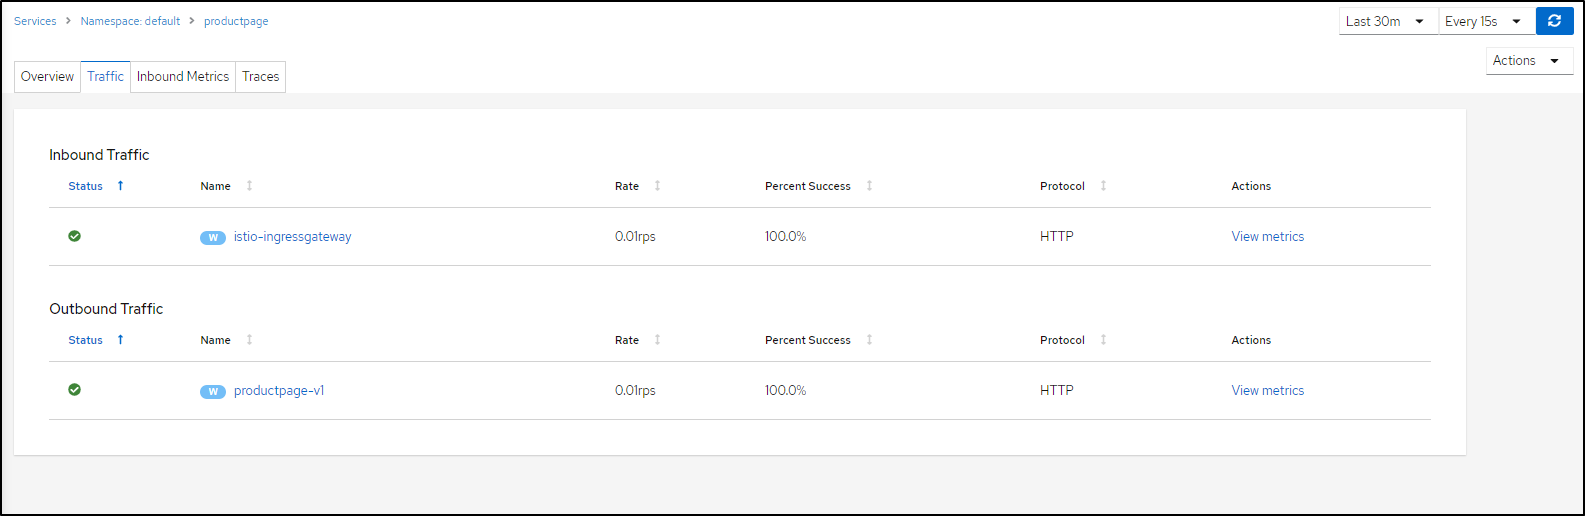
which includes details metrics gathering
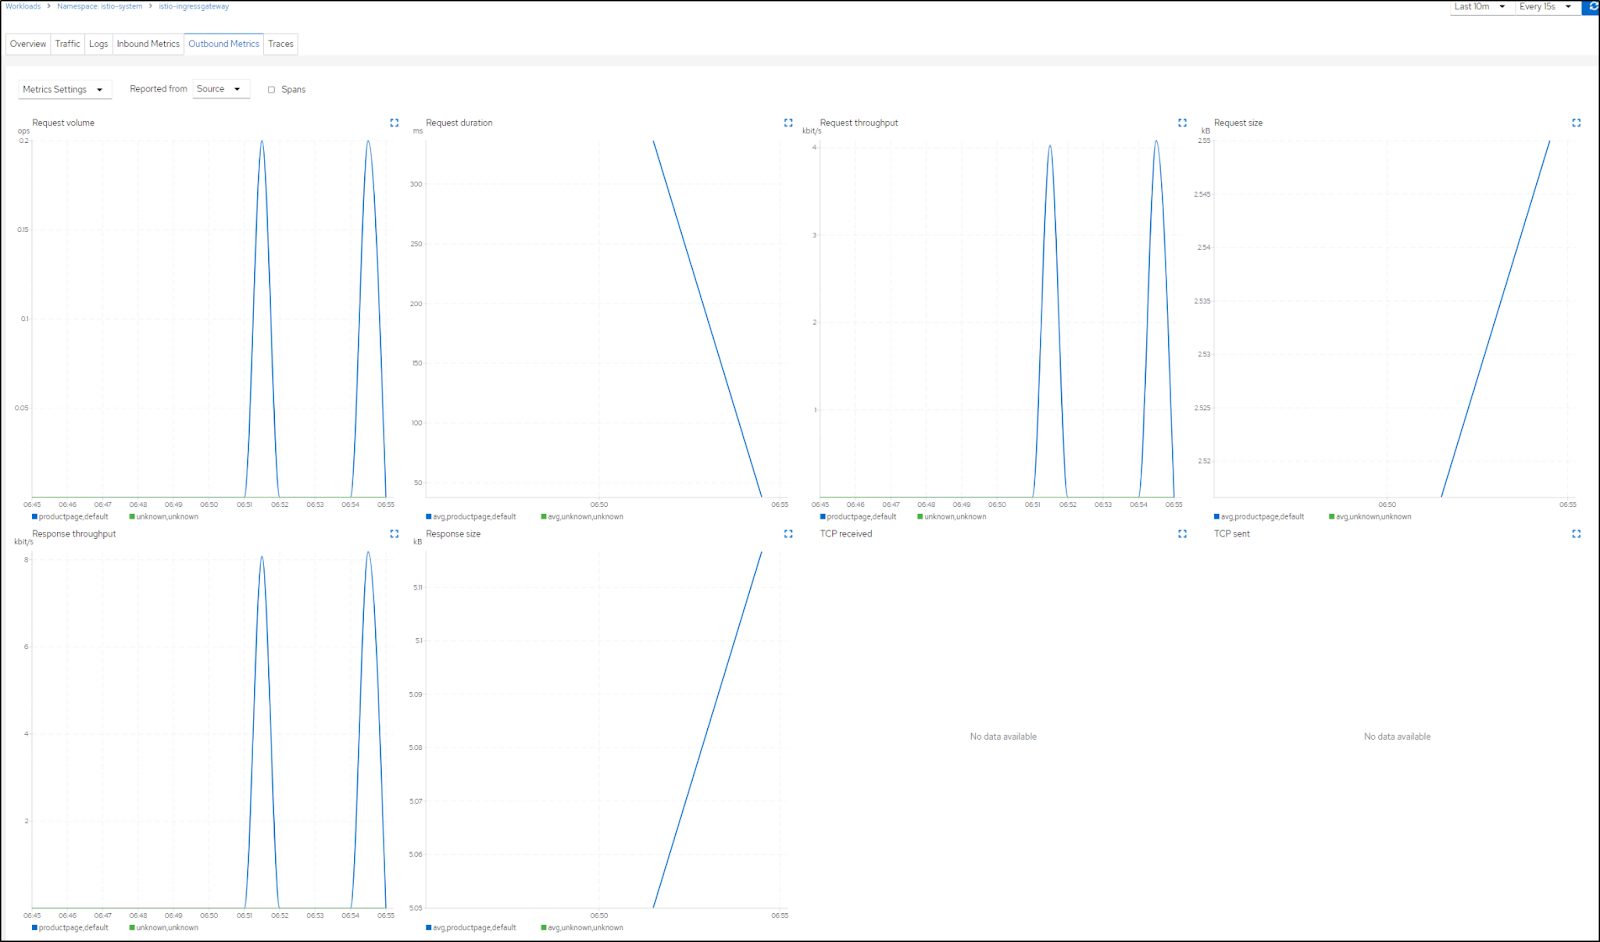
(Request Volume (ops), duration (ms), throughput (kbit/s), size (kb) )
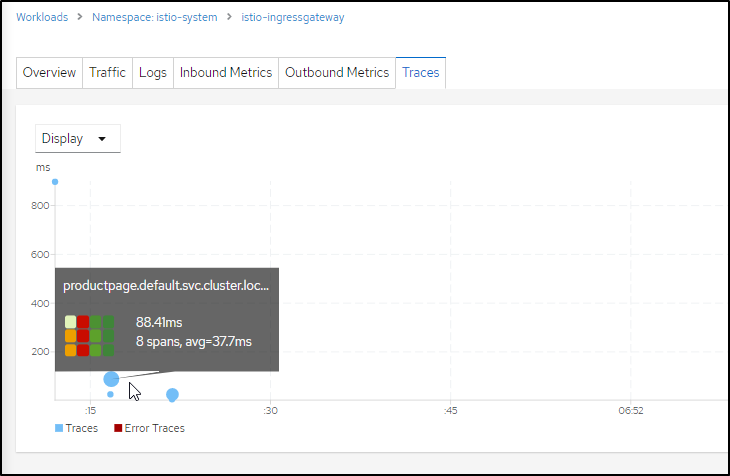
And in the Traces tab, we can view spans over time
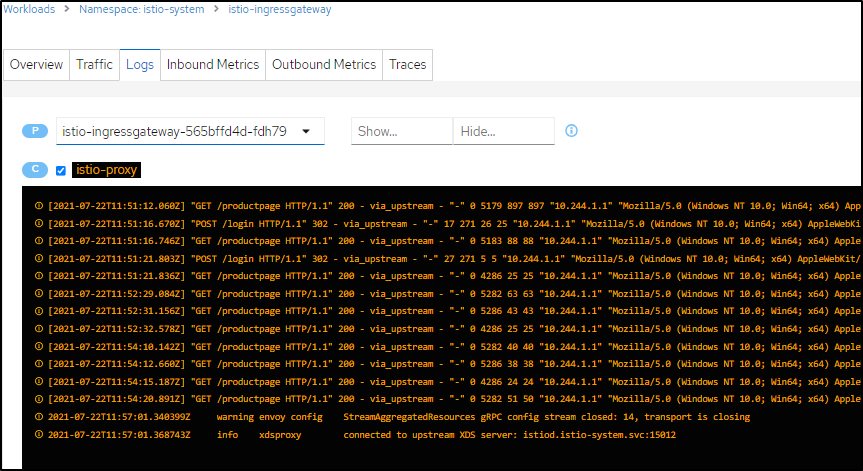
And lastly we can view the gateway logs should we need to debug anything
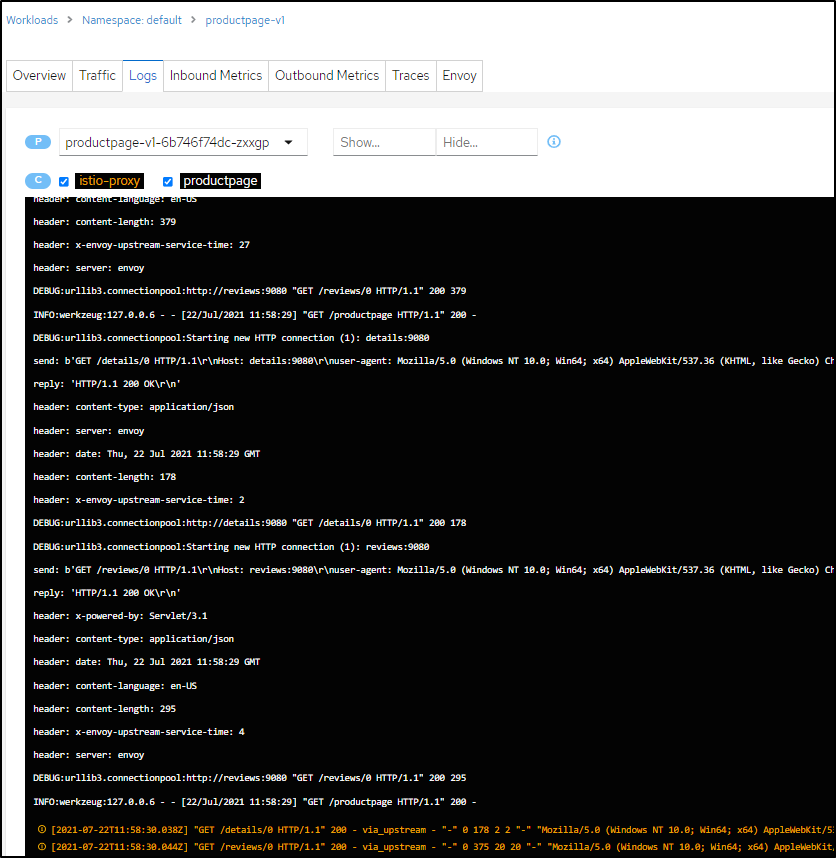
Or the logs from the pods
Note: Since we are only monitoring the default namespace, while I can view details of things running in the istio-system namespace, i won’t get details like metrics or traces.
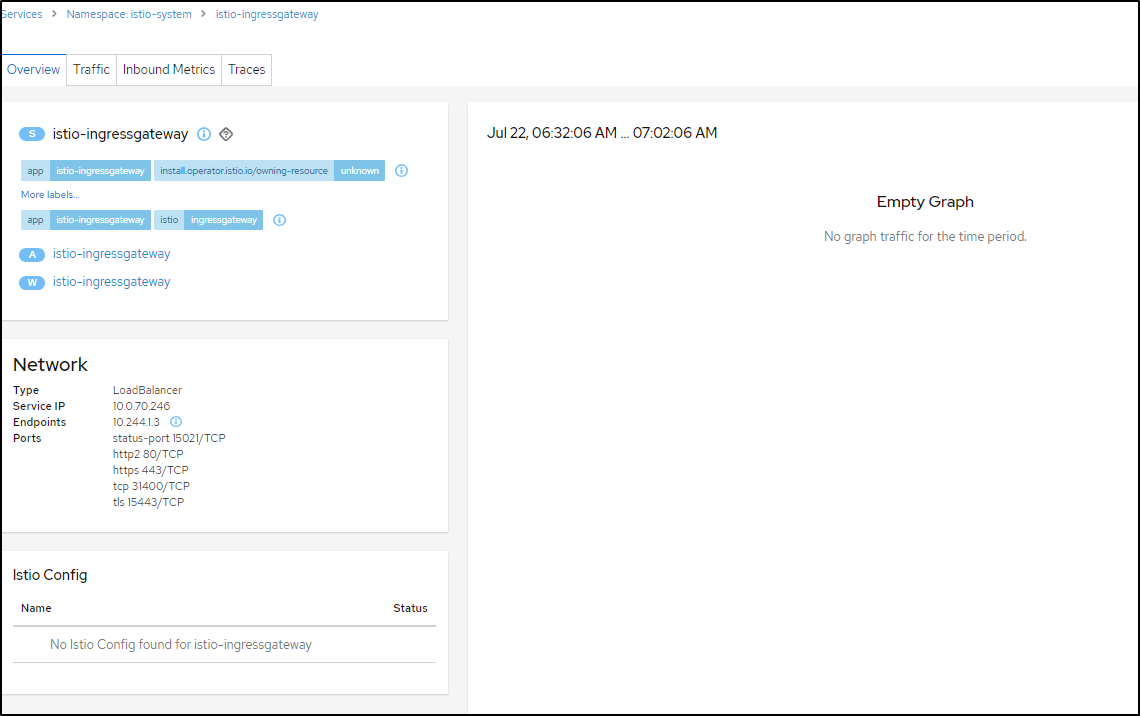
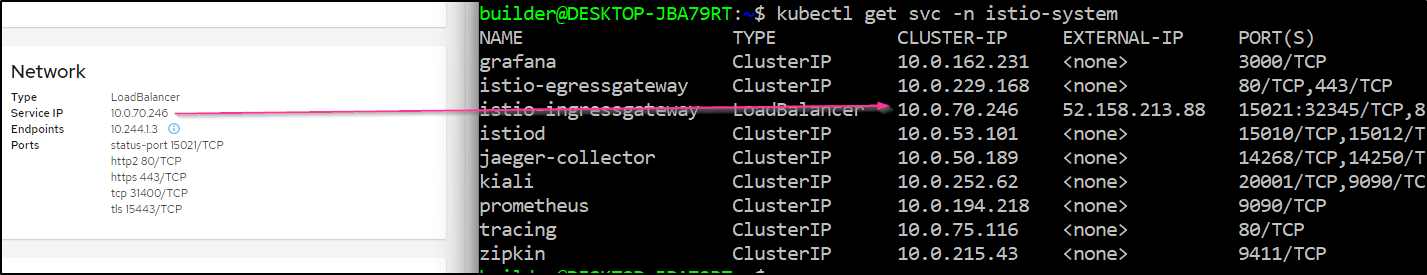
That said, it does accurately details the service IP
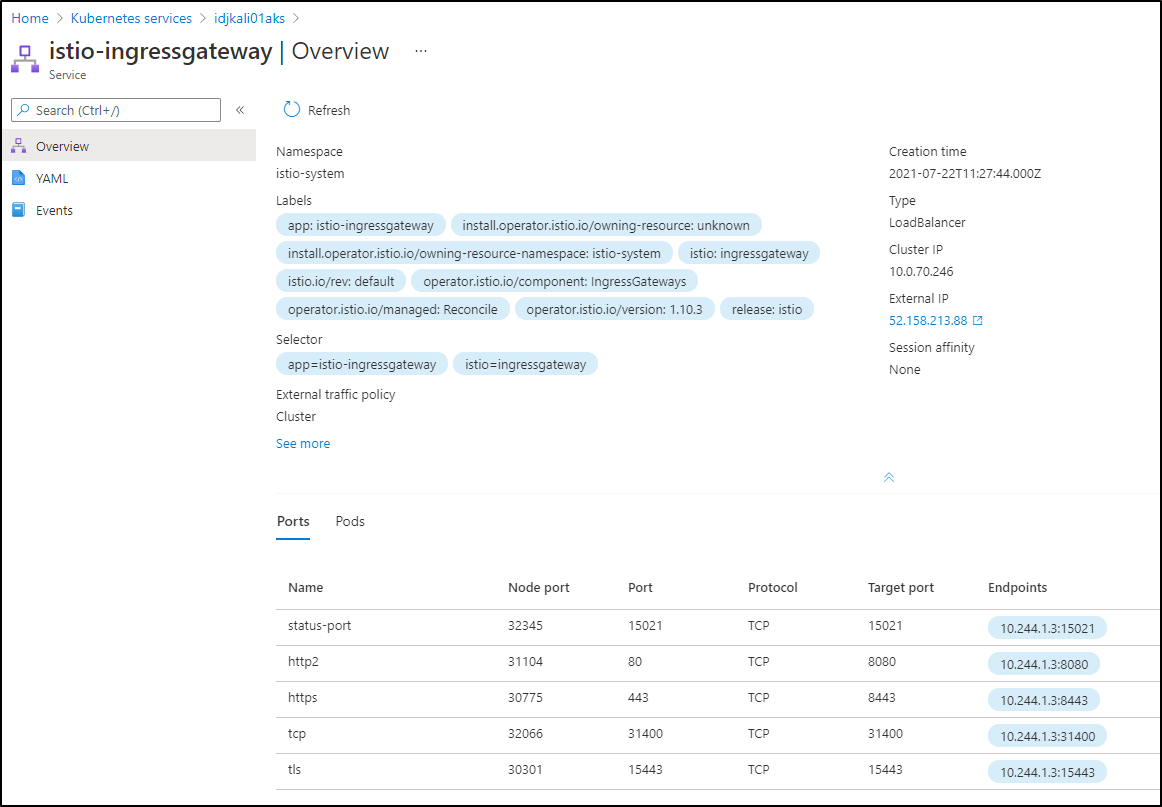
Azure Portal
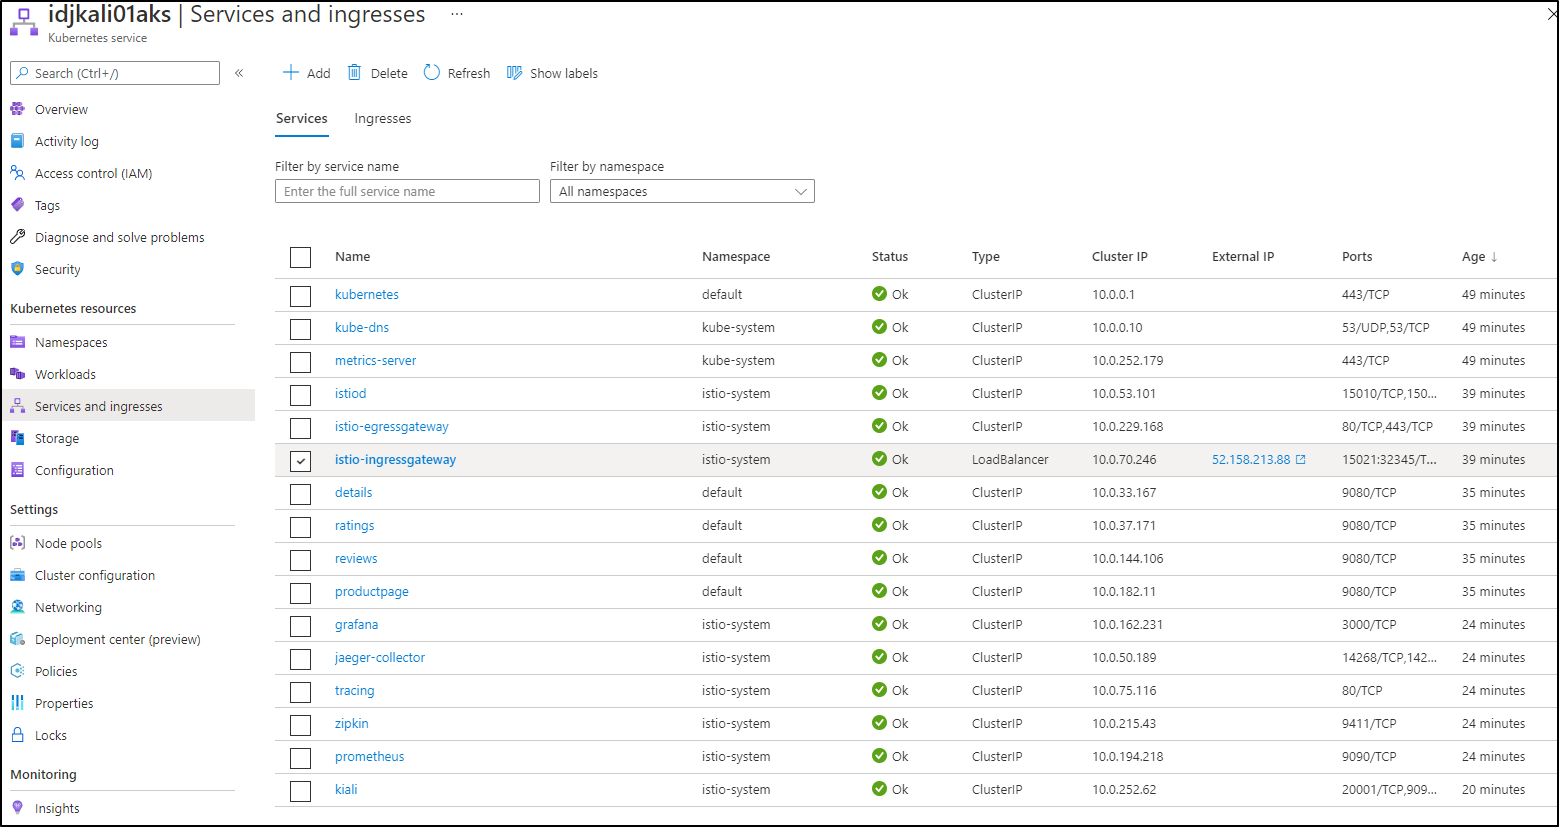
In the Azure Portal we can also look up Ingress Gateway details
Which also includes events which can let us know when it was added or updated
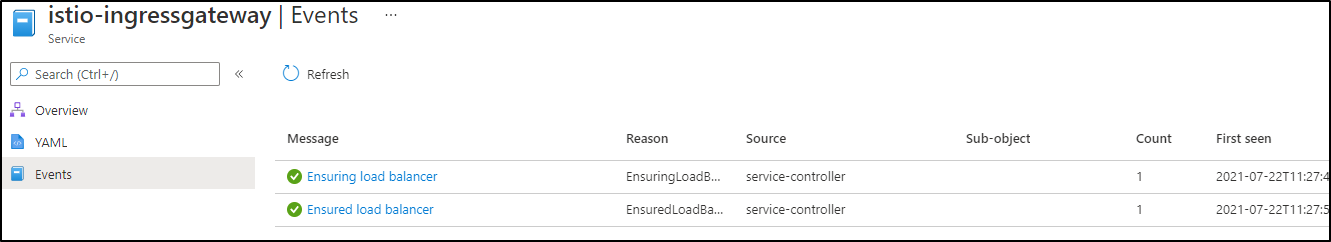
Which you can, of course, get to from the Service and Ingresses section of AKS details
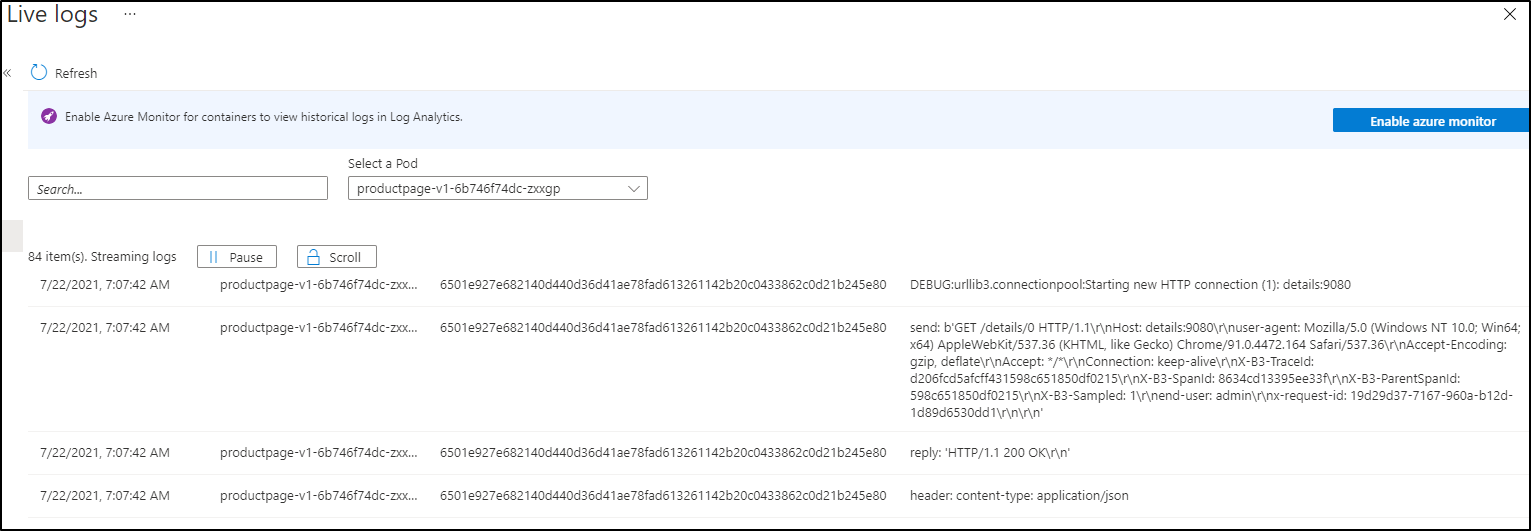
And yet again, we have another equally good place to watch live logs
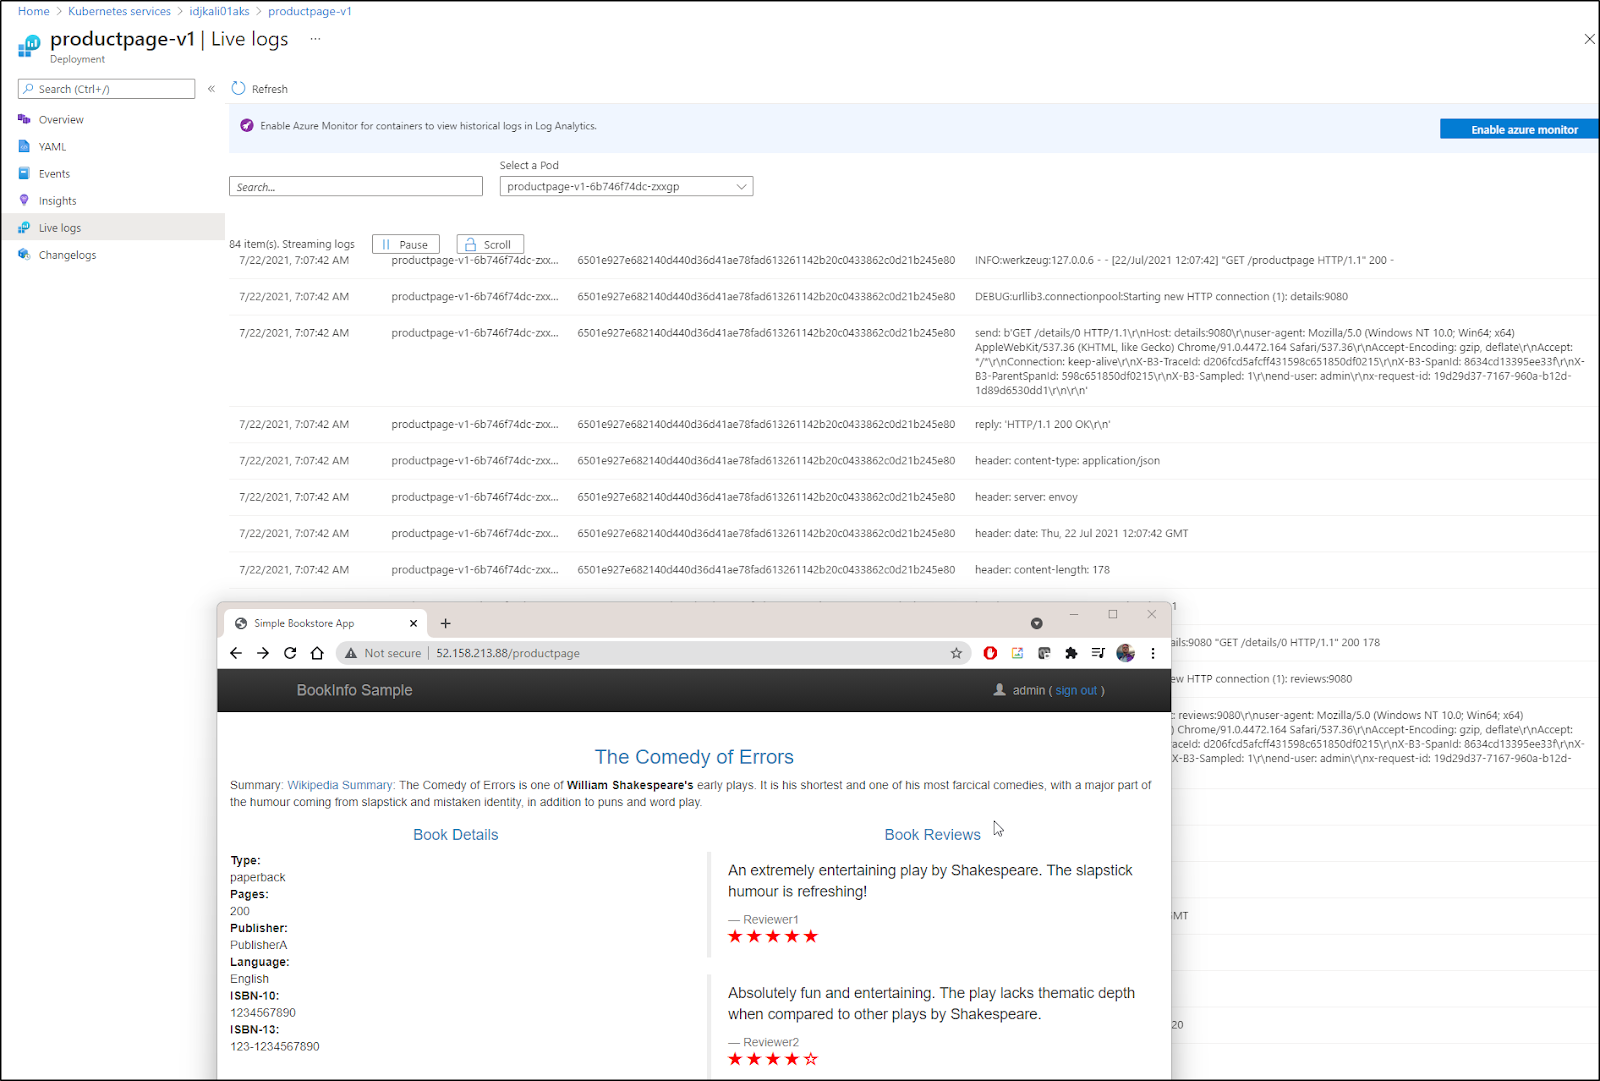
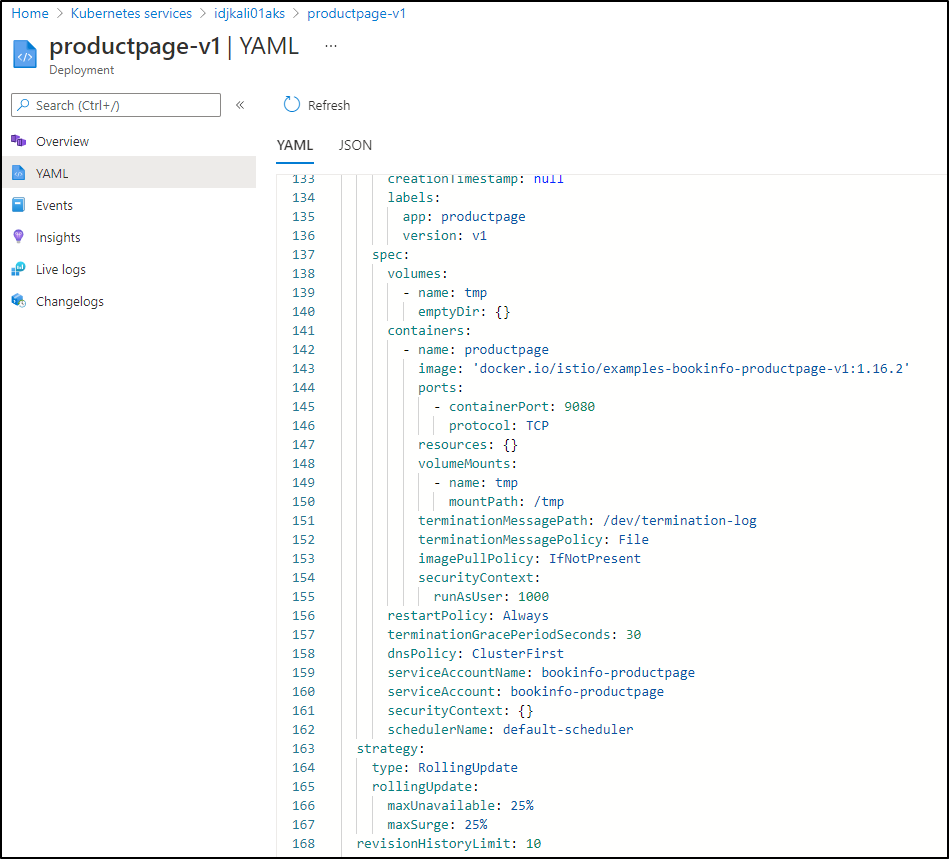
And we can see the YAML behind the app as well (perhaps debugging which container was used)
As you see above, Azure would encourage us to Log Analytics to track historical logs.
In other systems we have done this:
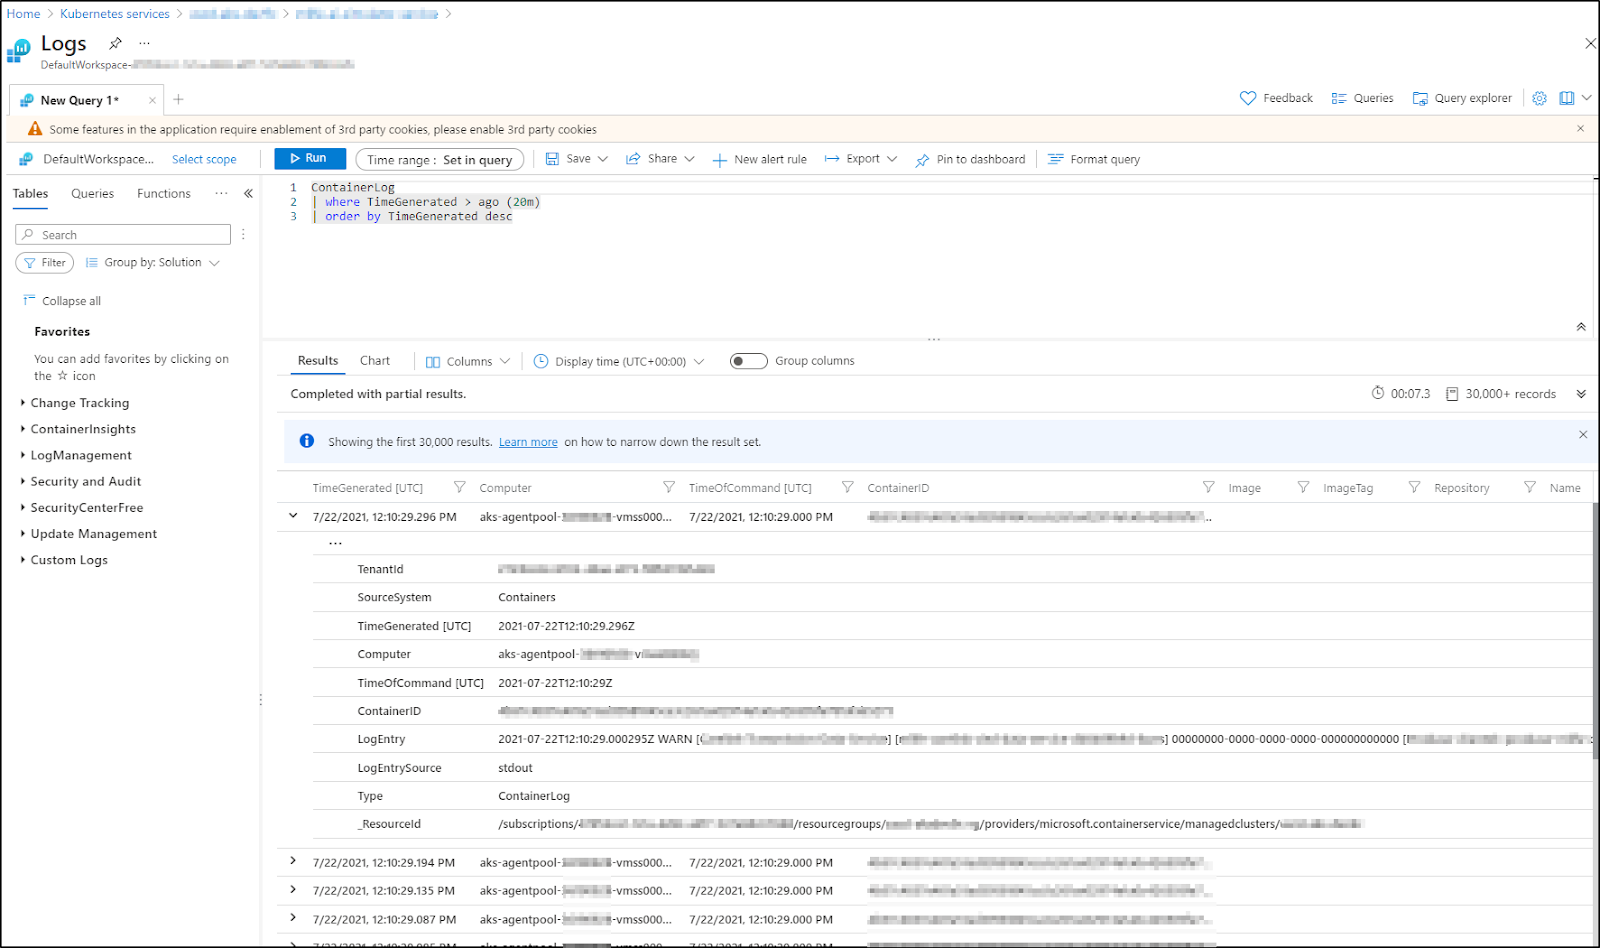
You can use the Azure Monitory Query Language to pull out logs from various namespaces.. e.g.
ContainerLog
|join(KubePodInventory| where TimeGenerated > startofday(ago(1h)))
on ContainerID
|where TimeGenerated > startofday(ago(1h)) and Namespace contains "myappnamespace"
| project TimeGenerated ,Namespace , LogEntrySource , LogEntry
However, I can attest that without controls, storing a massive amount of container logs can add up. In one recent case we generated over 2.5Gb of logs in 24h and you can imagine how that can get pretty spendy.
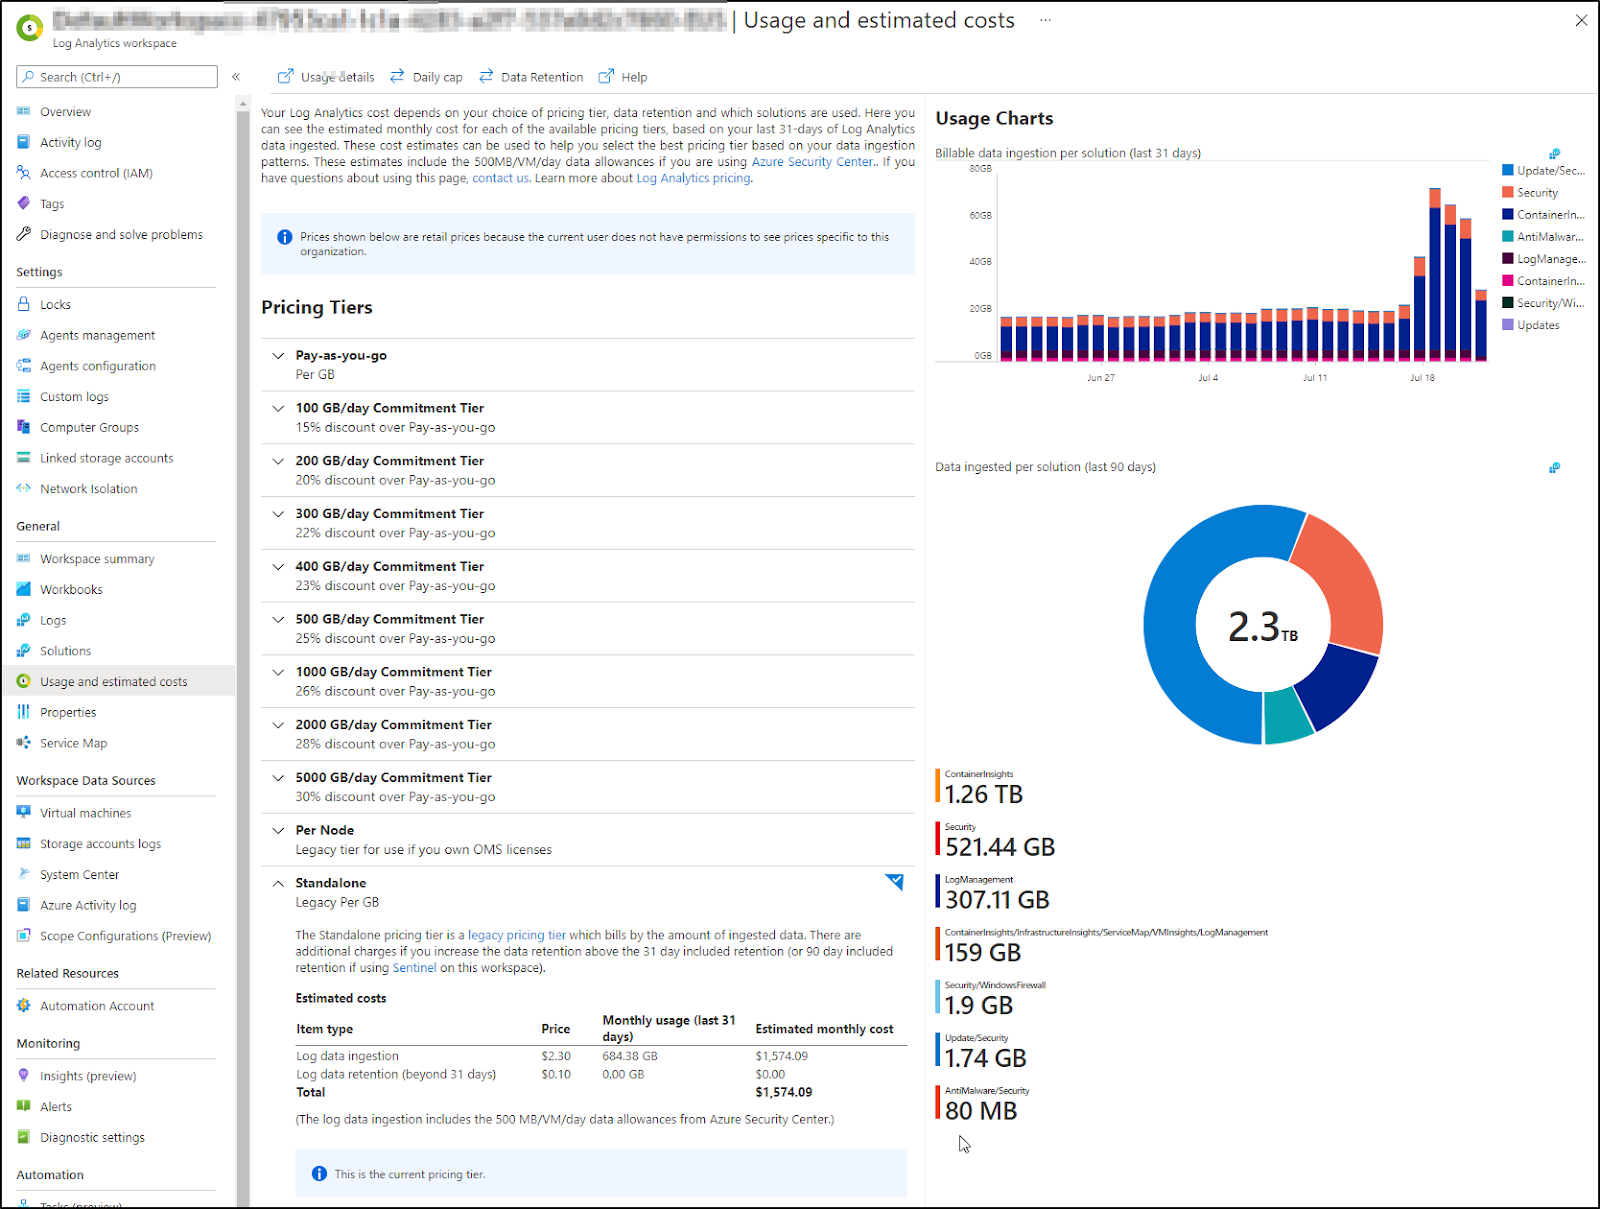
Tanget; Managing Costs in ALM
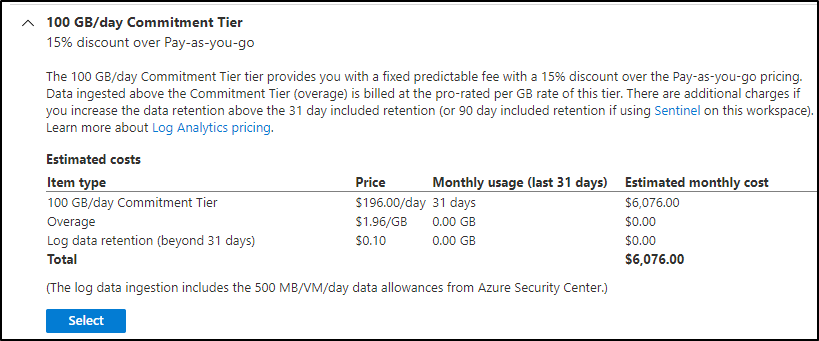
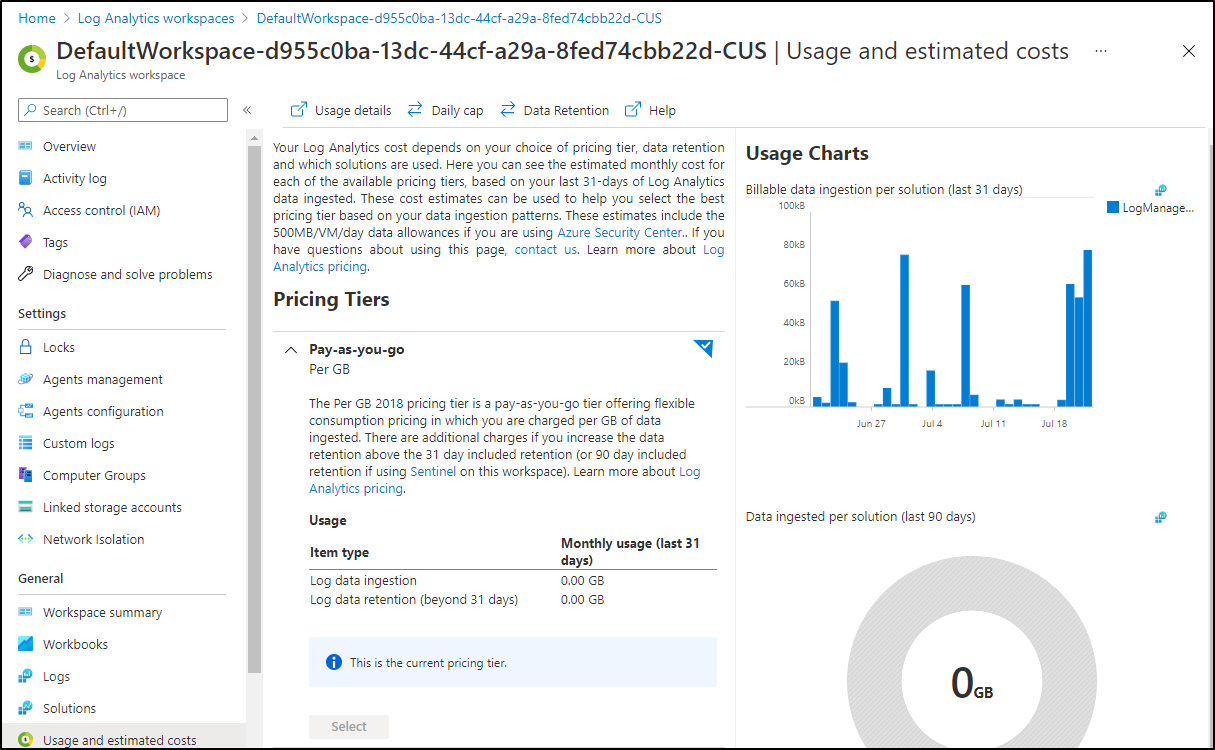
The idea is of course you can change your Pricing Tiers to lower cost (with commitments on GBs ingested)
e.g for the cluster above
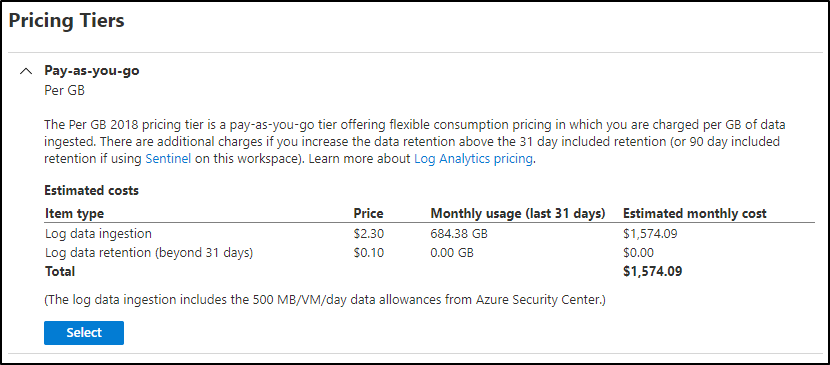
If we were up to 100Gb a day, then we could use the next level to save 15%
Of course it uses our existing (last 31d) details to give us a guidance that as we are averaging just 690Gb/mo now, the pay as you go is cheaper.
You can also adjust your retention (if you’ve set beyond 30d)
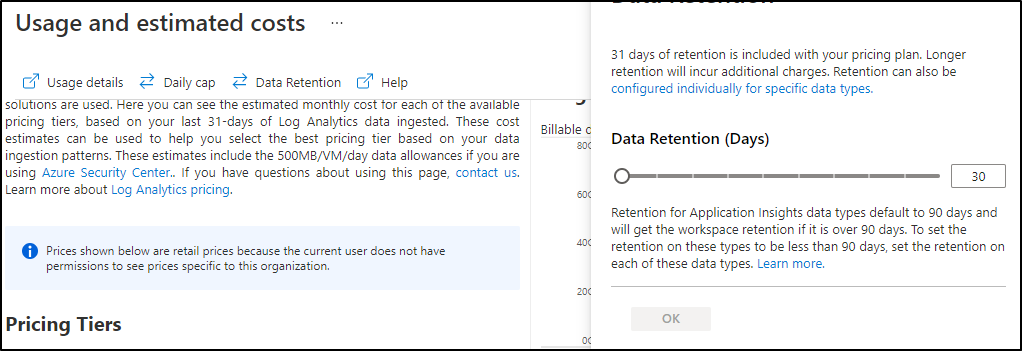
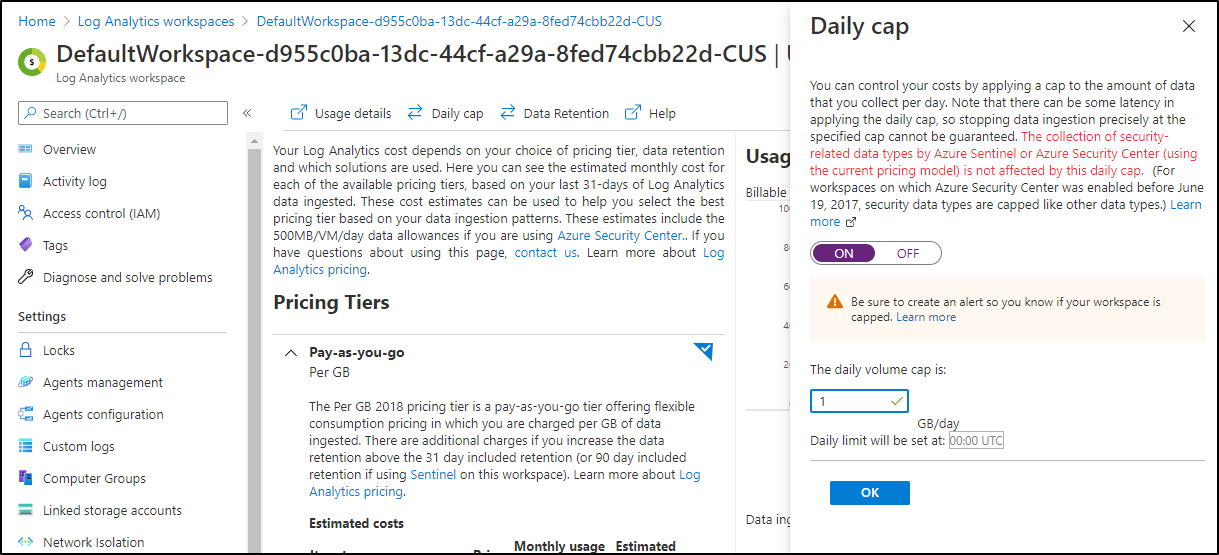
We can also apply a daily cap
Most of my Log Analytics workspaces are empty. I opt for a Workspace per cluster. This has the advantage of minimizing blast radius (if containers were to expose secrets) as well as easier tailor Access Controls. However, you may be in an organization that wants all logs centralized.
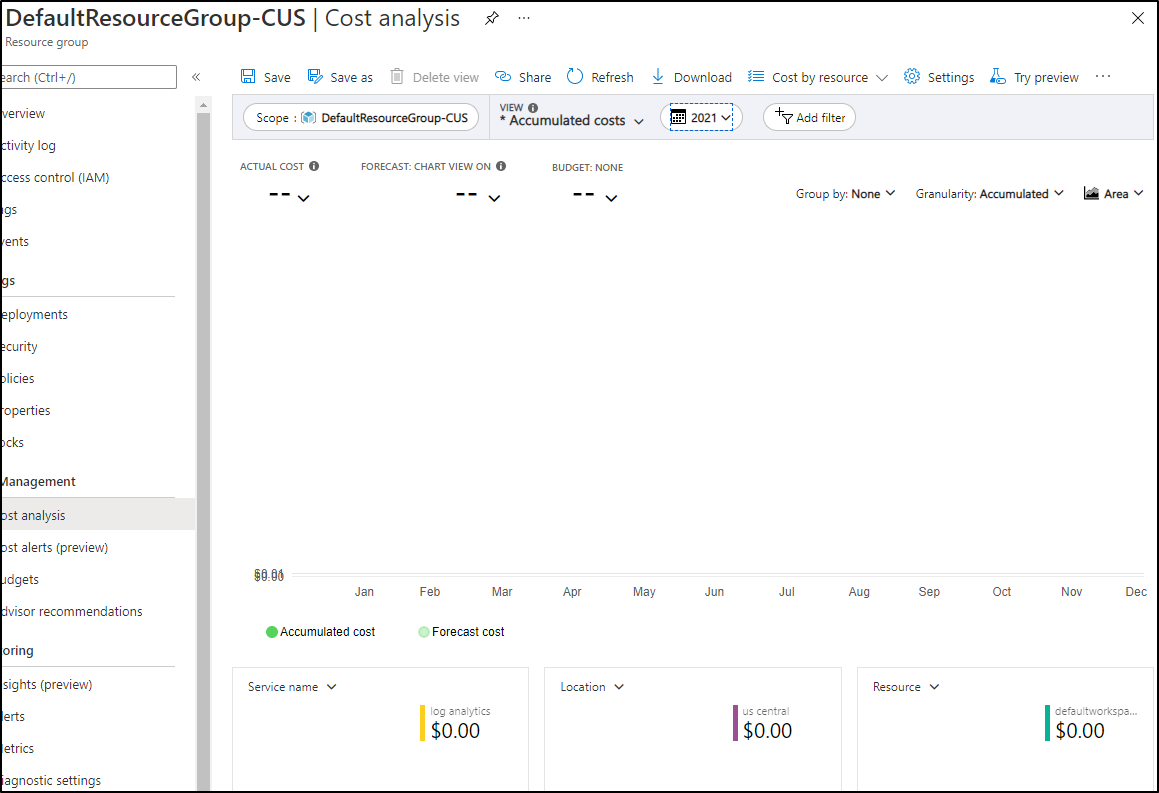
Also, realize that Azure Monitory Workspaces are held within a resource group and you can view usage data on Resource Groups as well
back to Kiali….
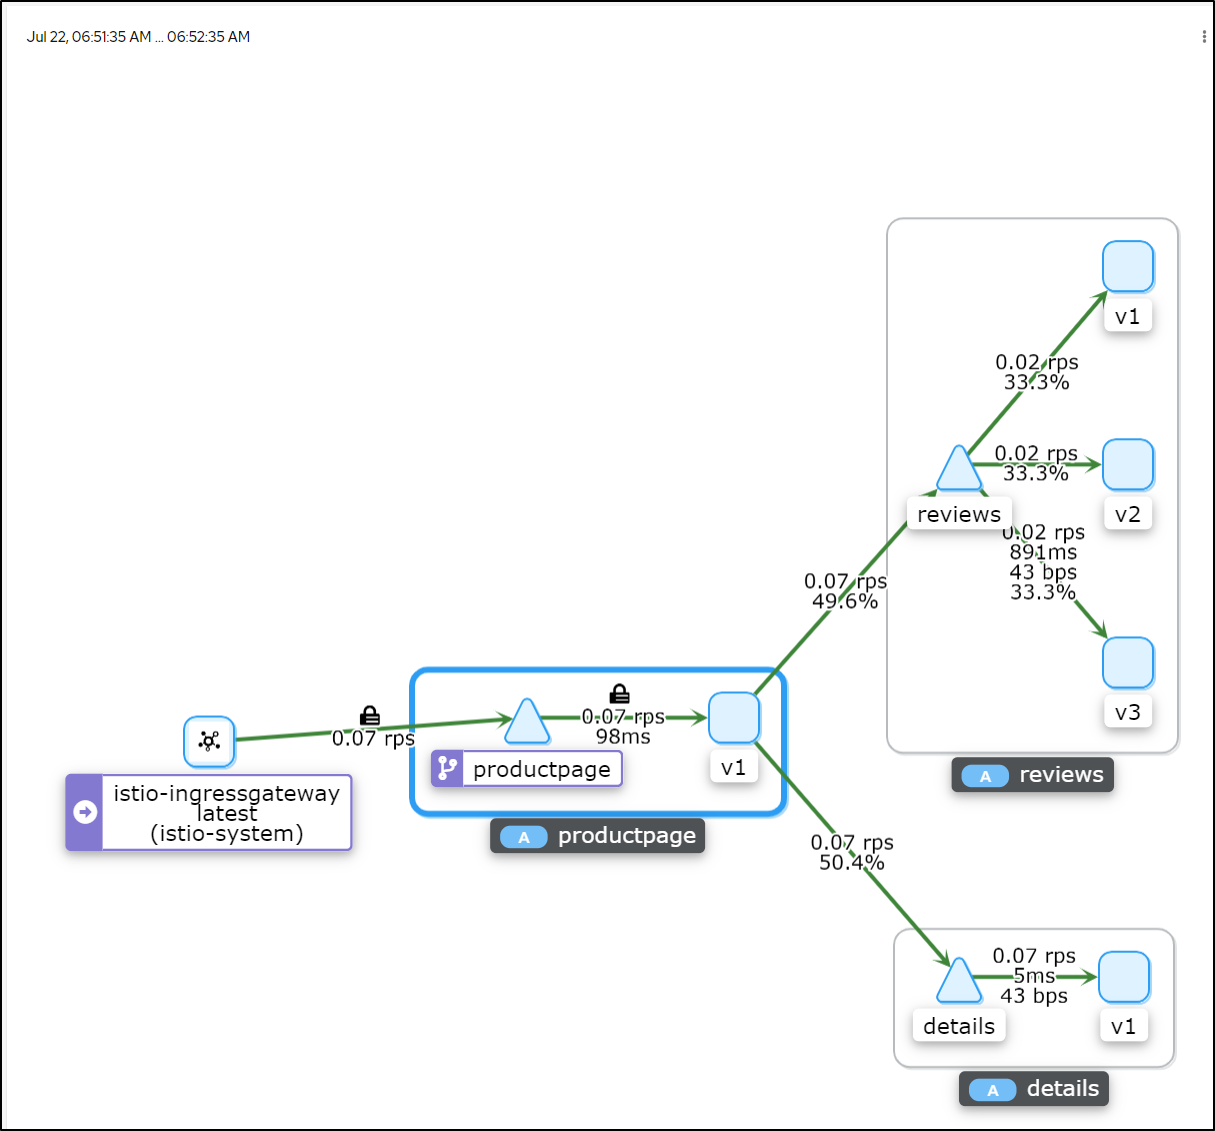
Kiali Visualizations
We can use “graphs” to visualize a lot of useful information:
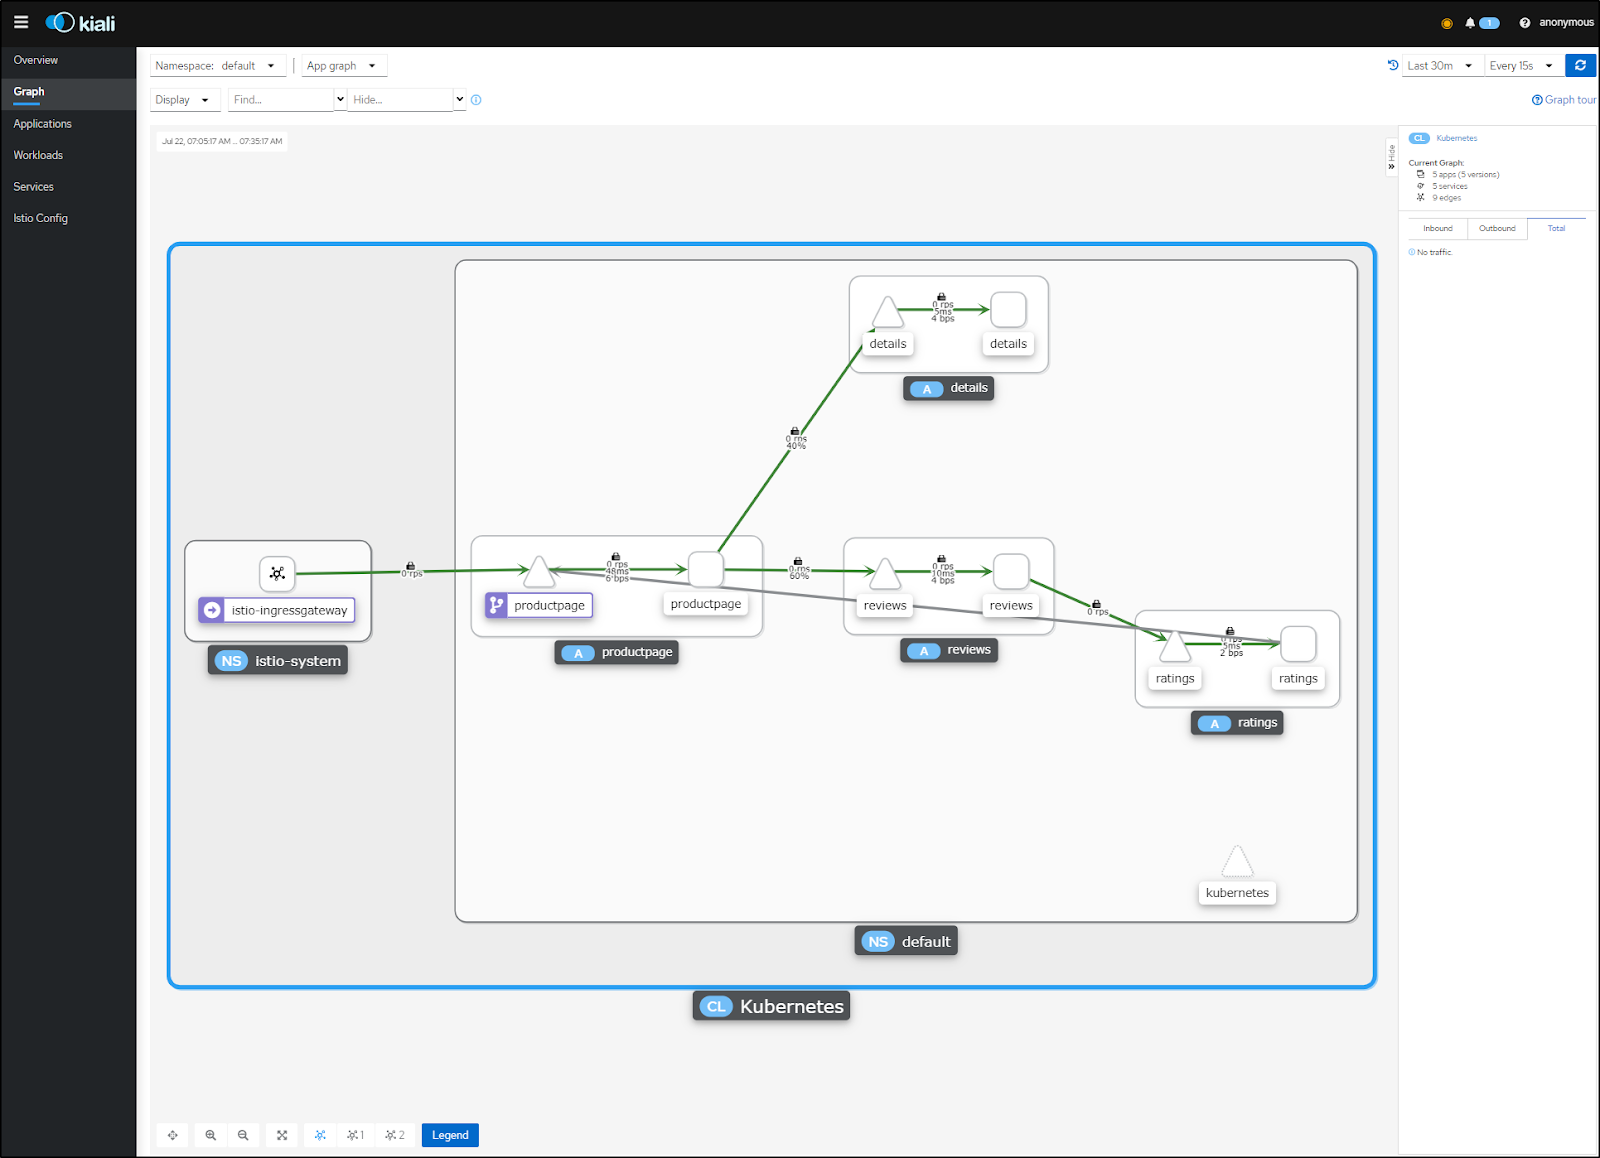
I can slam the cluster with a lot of requests and see how it holds up
This could include things like showing the version of the app using the Versioned App Graph
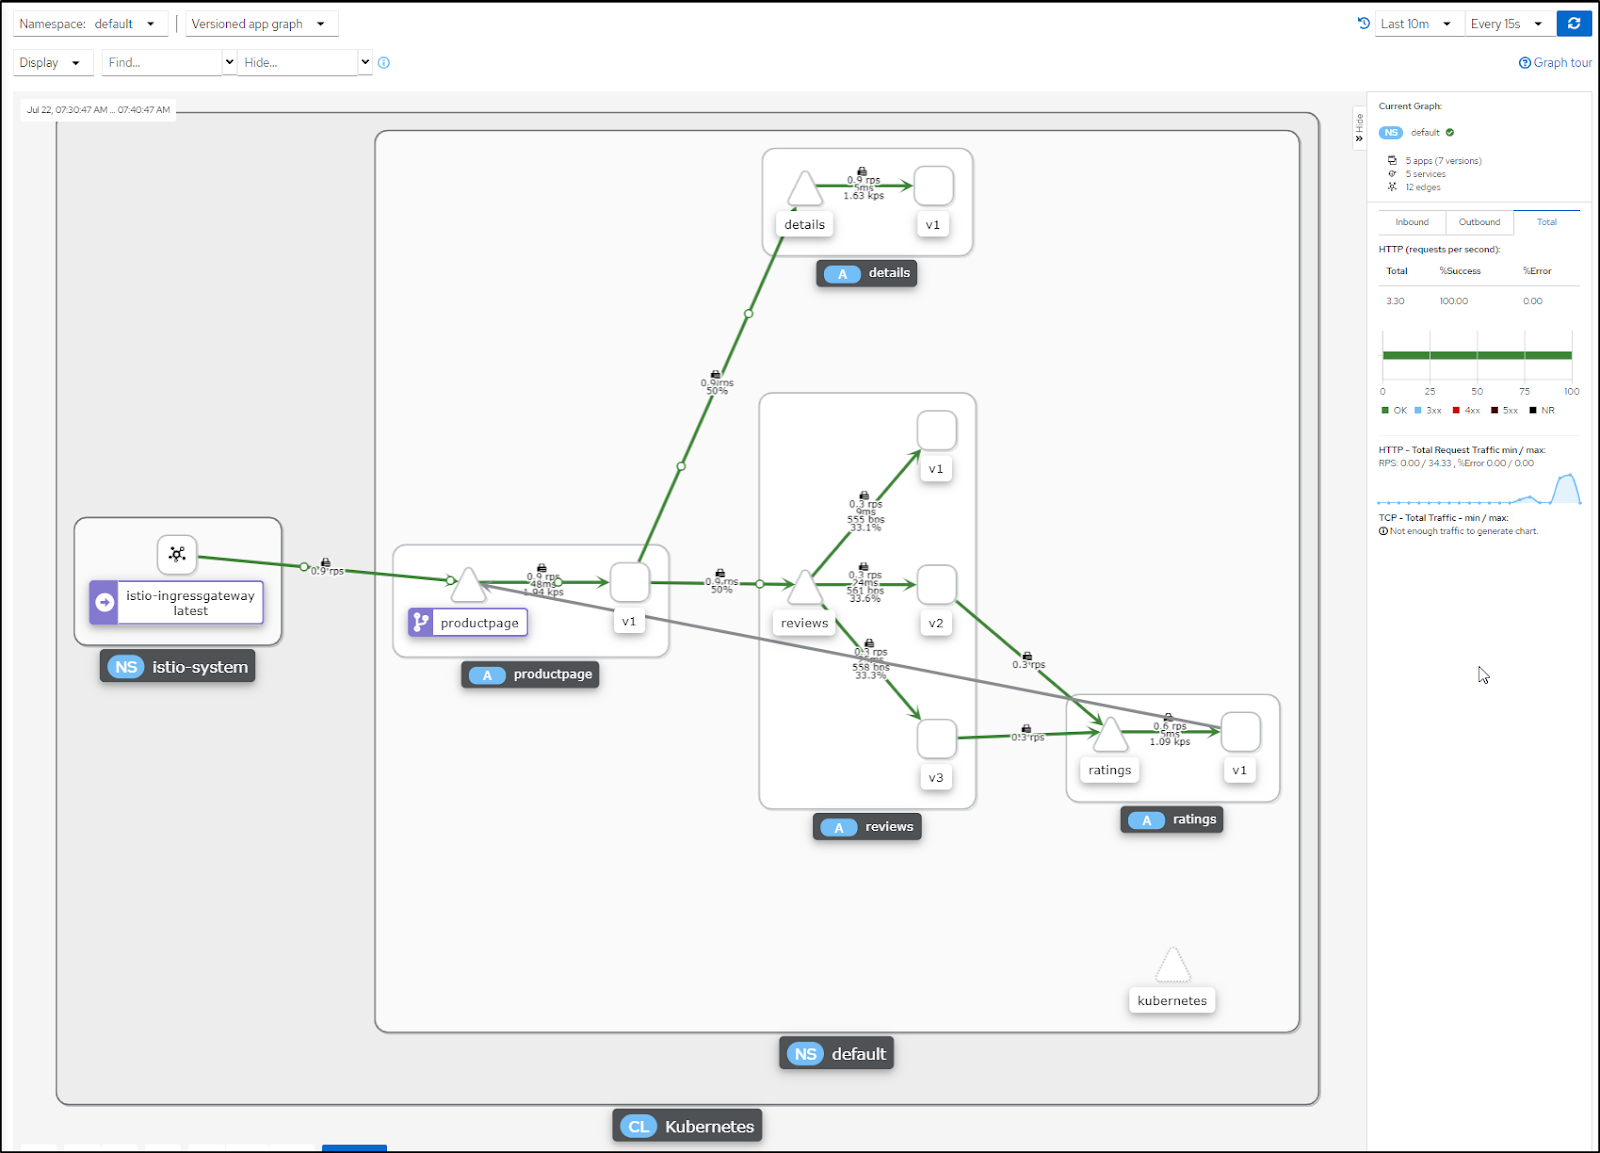
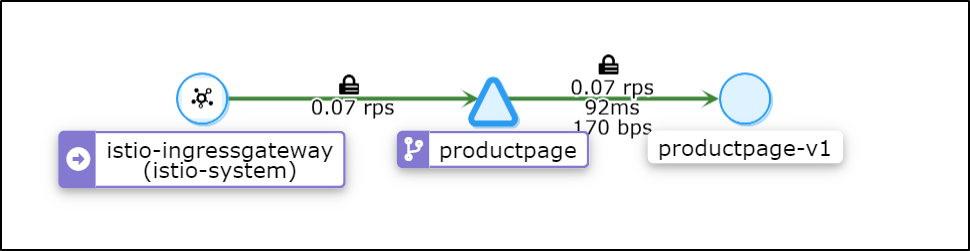
And again, as our namespace is annotated to gather metrics, we can view them on the app as well
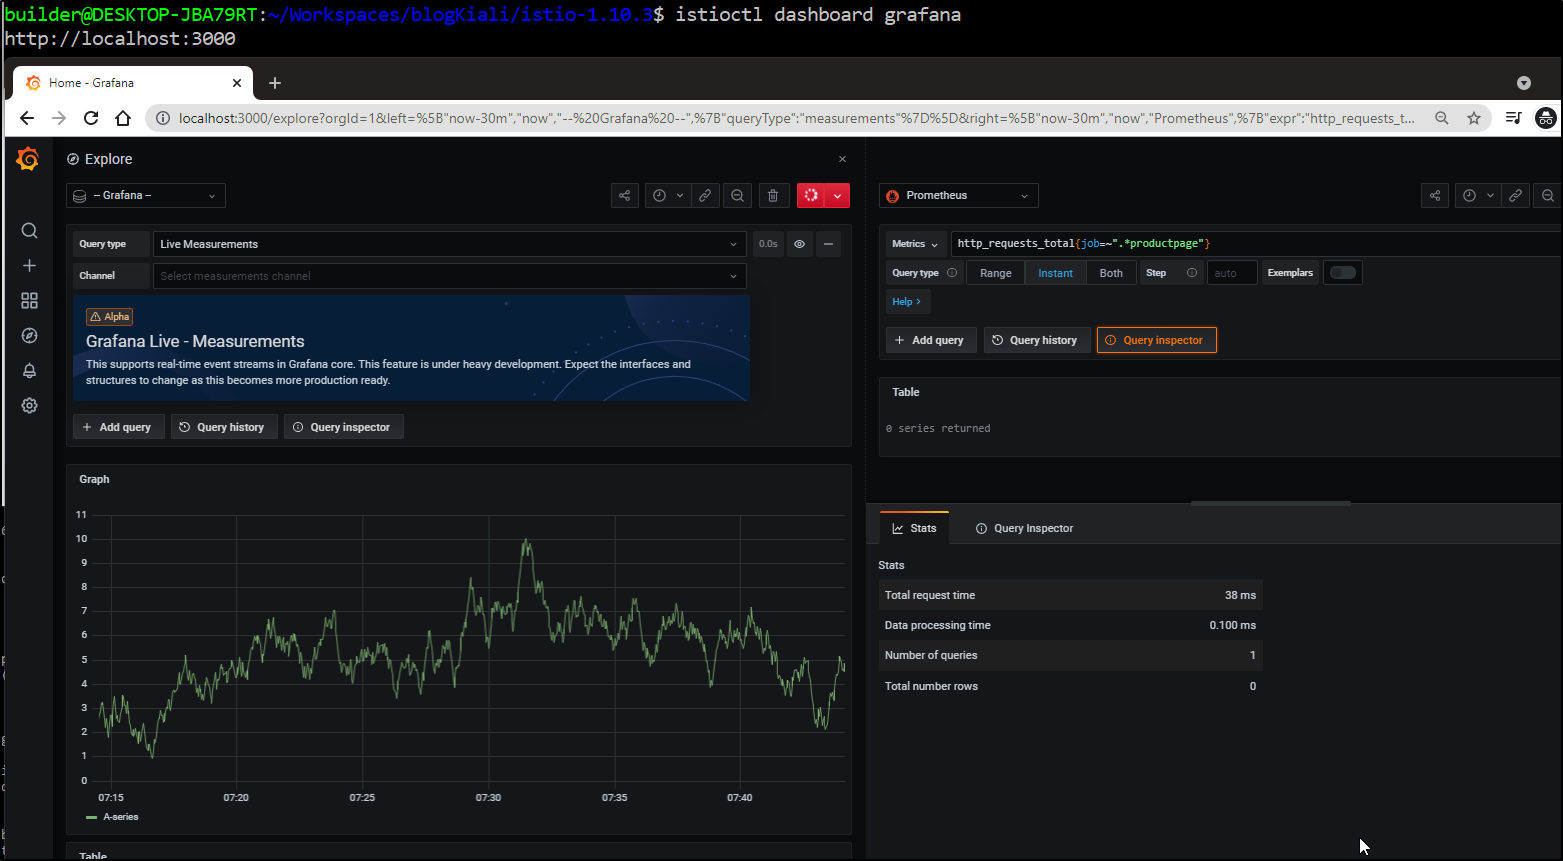
And because we did a full Istio deploy with standard apps, should you need to, you can always go directly to Grafana and/or Prometheus for metrics
Cleanup
First delete your cluster
builder@DESKTOP-JBA79RT:~/Workspaces/blogKiali/istio-1.10.3$ az aks list -o table
Name Location ResourceGroup KubernetesVersion ProvisioningState Fqdn
------------ ---------- --------------- ------------------- ------------------- --------------------------------------------------------------
idjkali01aks centralus idjkali01rg 1.19.11 Succeeded idjkali01a-idjkali01rg-70b42e-bafddc22.hcp.centralus.azmk8s.io
builder@DESKTOP-JBA79RT:~/Workspaces/blogKiali/istio-1.10.3$ az aks delete -n idjkali01aks -g idjkali01rg
Are you sure you want to perform this operation? (y/n): y
 / Running ..
Then you can delete the resource group if this was it’s only use.
Summary
Kiali, when added to Graphana, offers a very complete package for Service Mesh Observability using Istio. The fact that it’s truely open source and used by others means it could work with other meshes (there is an outstanding feature request to support Consul with Kiali). It’s a solid offering and worth watching as it continues to mature and gain adoption.