Published: Mar 13, 2021 by Isaac Johnson
LogDNA has been around about six years and I became familiar with them at DevOps Days in Minneapolis 3 years ago. Their offering has matured a lot since then and it was time to give it a proper look.
Setup
I now use a rather simple script to create AKS and ACRs as well as Service Principals:
#!/bin/bash
set +x

sudo apt-get install -y jq

echo "az aks account set --subscription \"Pay-As-You-Go\""
#az account set --subscription "Visual Studio Enterprise Subscription"
az account set --subscription "Pay-As-You-Go"

echo "az group create --name idjaks$1rg --location centralus"
az group create --name idjaks$1rg --location centralus

echo "az ad sp create-for-rbac -n idjaks$1sp --skip-assignment --output json > my_sp.json"
az ad sp create-for-rbac -n idjaks$1sp --skip-assignment --output json > my_sp.json

echo "cat my_sp.json | jq -r .appId"
cat my_sp.json | jq -r .appId

export SP_PASS=`cat my_sp.json | jq -r .password`
export SP_ID=`cat my_sp.json | jq -r .appId`

sleep 10

echo "az aks create --resource-group idjaks$1rg --name idjaks$1 --location centralus --node-count 3 --enable-cluster-autoscaler --min-count 2 --max-count 4 --generate-ssh-keys --network-plugin azure --network-policy azure --service-principal $SP_ID --client-secret $SP_PASS"
az aks create --resource-group idjaks$1rg --name idjaks$1 --location centralus --node-count 3 --enable-cluster-autoscaler --min-count 2 --max-count 4 --generate-ssh-keys --network-plugin azure --network-policy azure --service-principal $SP_ID --client-secret $SP_PASS

az acr create -n idjacr$1cr -g idjaks$1rg --sku Basic --admin-enabled true

echo "=============== login ================"
set -x

sudo az aks install-cli

(rm -f ~/.kube/config || true) && az aks get-credentials -n idjaks$1 -g idjaks$1rg --admin

kubectl get nodes

kubectl get ns
Running it creates all that i need:
$ ./create_cluster.sh 15
Password:
sudo: apt-get: command not found
az account set --subscription "Visual Studio Enterprise Subscription"
az group create --name idjaks15rg --location centralus
{
  "id": "/subscriptions/93285792-0b66-492a-b419-ad16ddce5337/resourceGroups/idjaks15rg",
  "location": "centralus",
  "managedBy": null,
  "name": "idjaks15rg",
  "properties": {
    "provisioningState": "Succeeded"
  },
  "tags": null,
  "type": "Microsoft.Resources/resourceGroups"
}
az ad sp create-for-rbac -n idjaks15sp --skip-assignment --output json > my_sp.json
Changing "idjaks15sp" to a valid URI of "http://idjaks15sp", which is the required format used for service principal names
The output includes credentials that you must protect. Be sure that you do not include these credentials in your code or check the credentials into your source control. For more information, see https://aka.ms/azadsp-cli
cat my_sp.json | jq -r .appId
12346e8b-dec1-1234-1234-69c9afdd1234
az aks create --resource-group idjaks15rg --name idjaks15 --location centralus --node-count 3 --enable-cluster-autoscaler --min-count 2 --max-count 4 --generate-ssh-keys --network-plugin azure --network-policy azure --service-principal 12346e8b-dec1-1234-1234-69c9afdd1234 --client-secret 4.WxAFAM~wVQ- ~~~~NOTREAL~~~~~ 81
{- Finished ..
  "aadProfile": null,
  "addonProfiles": {
    "KubeDashboard": {
      "config": null,
      "enabled": false,
      "identity": null
    }
  },
  "agentPoolProfiles": [
    {
      "availabilityZones": null,
      "count": 3,
      "enableAutoScaling": true,
      "enableNodePublicIp": false,
      "maxCount": 4,
      "maxPods": 30,
      "minCount": 2,
      "mode": "System",
      "name": "nodepool1",
      "nodeImageVersion": "AKSUbuntu-1804gen2-2021.02.24",
      "nodeLabels": {},
      "nodeTaints": null,
      "orchestratorVersion": "1.18.14",
      "osDiskSizeGb": 128,
      "osDiskType": "Managed",
      "osType": "Linux",
      "powerState": {
        "code": "Running"
      },
      "provisioningState": "Succeeded",
      "proximityPlacementGroupId": null,
      "scaleSetEvictionPolicy": null,
      "scaleSetPriority": null,
      "spotMaxPrice": null,
      "tags": null,
      "type": "VirtualMachineScaleSets",
      "upgradeSettings": null,
      "vmSize": "Standard_DS2_v2",
      "vnetSubnetId": null
    }
  ],
  "apiServerAccessProfile": null,
  "autoScalerProfile": {
    "balanceSimilarNodeGroups": "false",
    "expander": "random",
    "maxEmptyBulkDelete": "10",
    "maxGracefulTerminationSec": "600",
    "maxTotalUnreadyPercentage": "45",
    "newPodScaleUpDelay": "0s",
    "okTotalUnreadyCount": "3",
    "scaleDownDelayAfterAdd": "10m",
    "scaleDownDelayAfterDelete": "10s",
    "scaleDownDelayAfterFailure": "3m",
    "scaleDownUnneededTime": "10m",
    "scaleDownUnreadyTime": "20m",
    "scaleDownUtilizationThreshold": "0.5",
    "scanInterval": "10s",
    "skipNodesWithLocalStorage": "false",
    "skipNodesWithSystemPods": "true"
  },
  "diskEncryptionSetId": null,
  "dnsPrefix": "idjaks15-idjaks15rg-70b42e",
  "enablePodSecurityPolicy": null,
  "enableRbac": true,
  "fqdn": "idjaks15-idjaks15rg-70b42e-e0882381.hcp.centralus.azmk8s.io",
  "id": "/subscriptions/93285792-0b66-492a-b419-ad16ddce5337/resourcegroups/idjaks15rg/providers/Microsoft.ContainerService/managedClusters/idjaks15",
  "identity": null,
  "identityProfile": null,
  "kubernetesVersion": "1.18.14",
  "linuxProfile": {
    "adminUsername": "azureuser",
    "ssh": {
      "publicKeys": [
        {
          "keyData": "ssh-rsa AAAAB3NzaC1yc2EAAAADAQABAAAAAAAAAAAAAAAAAdtr3SZdfI1BWoVYY+/R1pXkwh+/5Gvc0nKMZQhIWnXCEw4DQe8Q6l1MUyi+pTHJKlA1Fiivrky8mofPAO5U/yIHWWhwXdypdzVtvBxRq/aBdCLmI/coXFCTGz0aYNqumP08SIk66PGggnIsTqYYgKaFLnAJw2K9faWyiTrmEO7ggu1fesL5VR6MGAqpgfyHEMv2x21oZD/WmtecsURxbJUHyH9yvXfXSVbpXI9kHWpLEc228xi72ZyIQTTHSuNGHzE7KTyOn93aFhbr4VoMkCWiq2Yxh6Xzzyysmu49sHs5DOX975jhmYSmwJqXMDRg5FnGw8GeZc8kV"
        }
      ]
    }
  },
  "location": "centralus",
  "maxAgentPools": 10,
  "name": "idjaks15",
  "networkProfile": {
    "dnsServiceIp": "10.0.0.10",
    "dockerBridgeCidr": "172.17.0.1/16",
    "loadBalancerProfile": {
      "allocatedOutboundPorts": null,
      "effectiveOutboundIps": [
        {
          "id": "/subscriptions/93285792-0b66-492a-b419-ad16ddce5337/resourceGroups/MC_idjaks15rg_idjaks15_centralus/providers/Microsoft.Network/publicIPAddresses/831fb58e-7930-4a2a-95bc-43c9d95fae07",
          "resourceGroup": "MC_idjaks15rg_idjaks15_centralus"
        }
      ],
      "idleTimeoutInMinutes": null,
      "managedOutboundIps": {
        "count": 1
      },
      "outboundIpPrefixes": null,
      "outboundIps": null
    },
    "loadBalancerSku": "Standard",
    "networkMode": null,
    "networkPlugin": "azure",
    "networkPolicy": "azure",
    "outboundType": "loadBalancer",
    "podCidr": null,
    "serviceCidr": "10.0.0.0/16"
  },
  "nodeResourceGroup": "MC_idjaks15rg_idjaks15_centralus",
  "powerState": {
    "code": "Running"
  },
  "privateFqdn": null,
  "provisioningState": "Succeeded",
  "resourceGroup": "idjaks15rg",
  "servicePrincipalProfile": {
    "clientId": "b8476e8b-dec1-4368-84b2-69c9afdd6f82",
    "secret": null
  },
  "sku": {
    "name": "Basic",
    "tier": "Free"
  },
  "tags": null,
  "type": "Microsoft.ContainerService/ManagedClusters",
  "windowsProfile": {
    "adminPassword": null,
    "adminUsername": "azureuser",
    "enableCSIProxy": true,
    "licenseType": null
  }
}
{- Finished ..
  "adminUserEnabled": true,
  "creationDate": "2021-03-12T14:30:11.706525+00:00",
  "dataEndpointEnabled": false,
  "dataEndpointHostNames": [],
  "encryption": {
    "keyVaultProperties": null,
    "status": "disabled"
  },
  "id": "/subscriptions/93285792-0b66-492a-b419-ad16ddce5337/resourceGroups/idjaks15rg/providers/Microsoft.ContainerRegistry/registries/idjacr15cr",
  "identity": null,
  "location": "centralus",
  "loginServer": "idjacr15cr.azurecr.io",
  "name": "idjacr15cr",
  "networkRuleSet": null,
  "policies": {
    "quarantinePolicy": {
      "status": "disabled"
    },
    "retentionPolicy": {
      "days": 7,
      "lastUpdatedTime": "2021-03-12T14:30:15.257917+00:00",
      "status": "disabled"
    },
    "trustPolicy": {
      "status": "disabled",
      "type": "Notary"
    }
  },
  "privateEndpointConnections": [],
  "provisioningState": "Succeeded",
  "publicNetworkAccess": "Enabled",
  "resourceGroup": "idjaks15rg",
  "sku": {
    "name": "Basic",
    "tier": "Basic"
  },
  "status": null,
  "storageAccount": null,
  "systemData": {
    "createdAt": "2021-03-12T14:30:11.7065257+00:00",
    "createdBy": "johnsi10@medtronic.com",
    "createdByType": "User",
    "lastModifiedAt": "2021-03-12T14:30:11.7065257+00:00",
    "lastModifiedBy": "johnsi10@medtronic.com",
    "lastModifiedByType": "User"
  },
  "tags": {},
  "type": "Microsoft.ContainerRegistry/registries"
}
=============== login ================
+ sudo az aks install-cli
Downloading client to "/usr/local/bin/kubectl" from "https://storage.googleapis.com/kubernetes-release/release/v1.20.4/bin/darwin/amd64/kubectl"
Please ensure that /usr/local/bin is in your search PATH, so the `kubectl` command can be found.
Downloading client to "/tmp/tmprhyrk102/kubelogin.zip" from "https://github.com/Azure/kubelogin/releases/download/v0.0.8/kubelogin.zip"
Please ensure that /usr/local/bin is in your search PATH, so the `kubelogin` command can be found.
+ rm -f /Users/johnsi10/.kube/config
+ az aks get-credentials -n idjaks15 -g idjaks15rg --admin
Merged "idjaks15-admin" as current context in /Users/johnsi10/.kube/config
+ kubectl get nodes
NAME STATUS ROLES AGE VERSION
aks-nodepool1-84069487-vmss000000 Ready agent 51s v1.18.14
aks-nodepool1-84069487-vmss000001 Ready agent 58s v1.18.14
aks-nodepool1-84069487-vmss000002 Ready agent 56s v1.18.14
+ kubectl get ns
NAME STATUS AGE
default Active 109s
kube-node-lease Active 111s
kube-public Active 111s
kube-system Active 111s
LogDNA Account
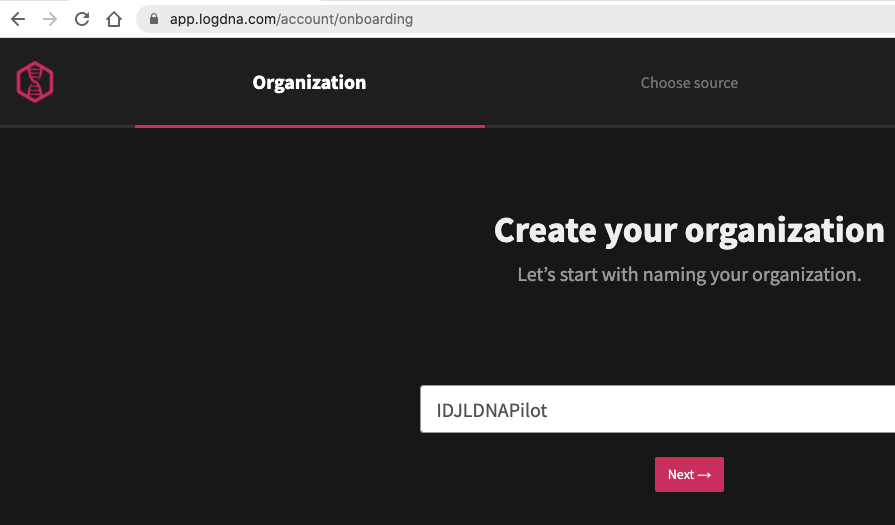
Let’s create an account. We’ll need to create an Org Name:
Next let’s find some platform logs to address
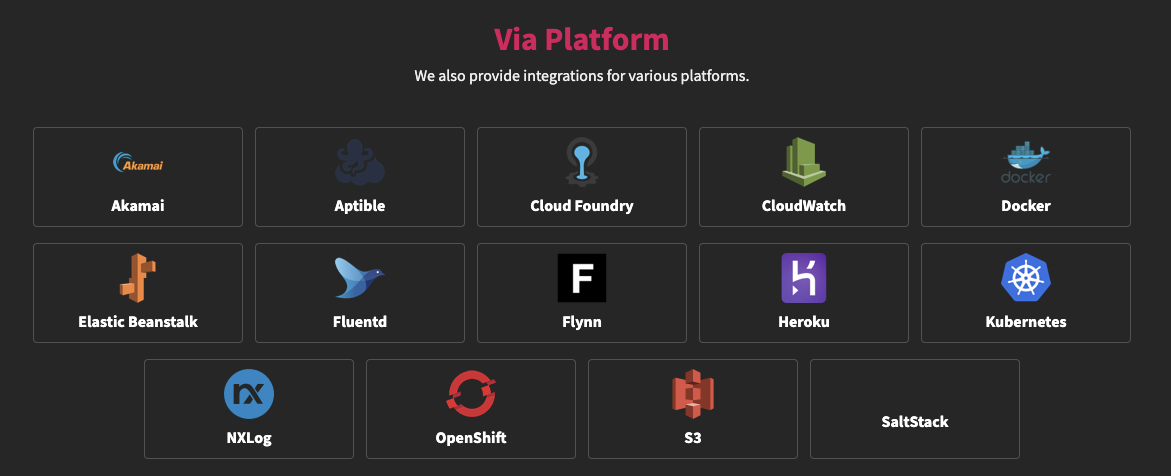
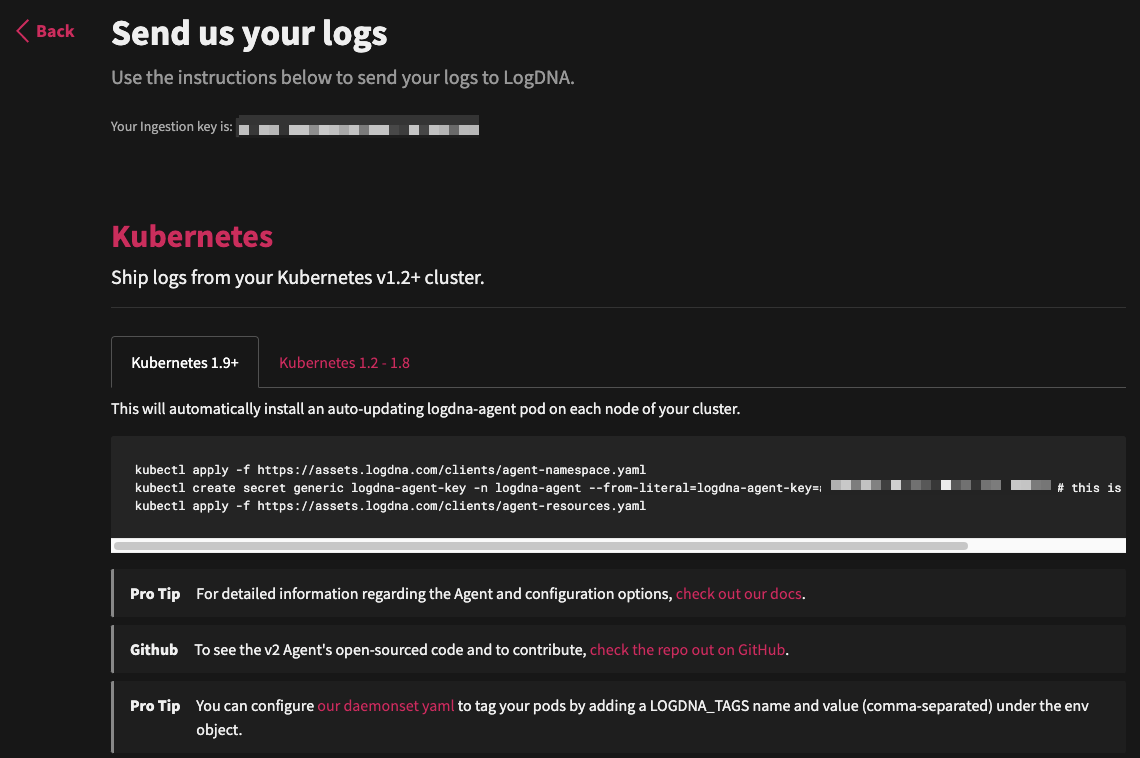
We can pick Kubernetes and see the simple kubectl steps:
Running the steps:
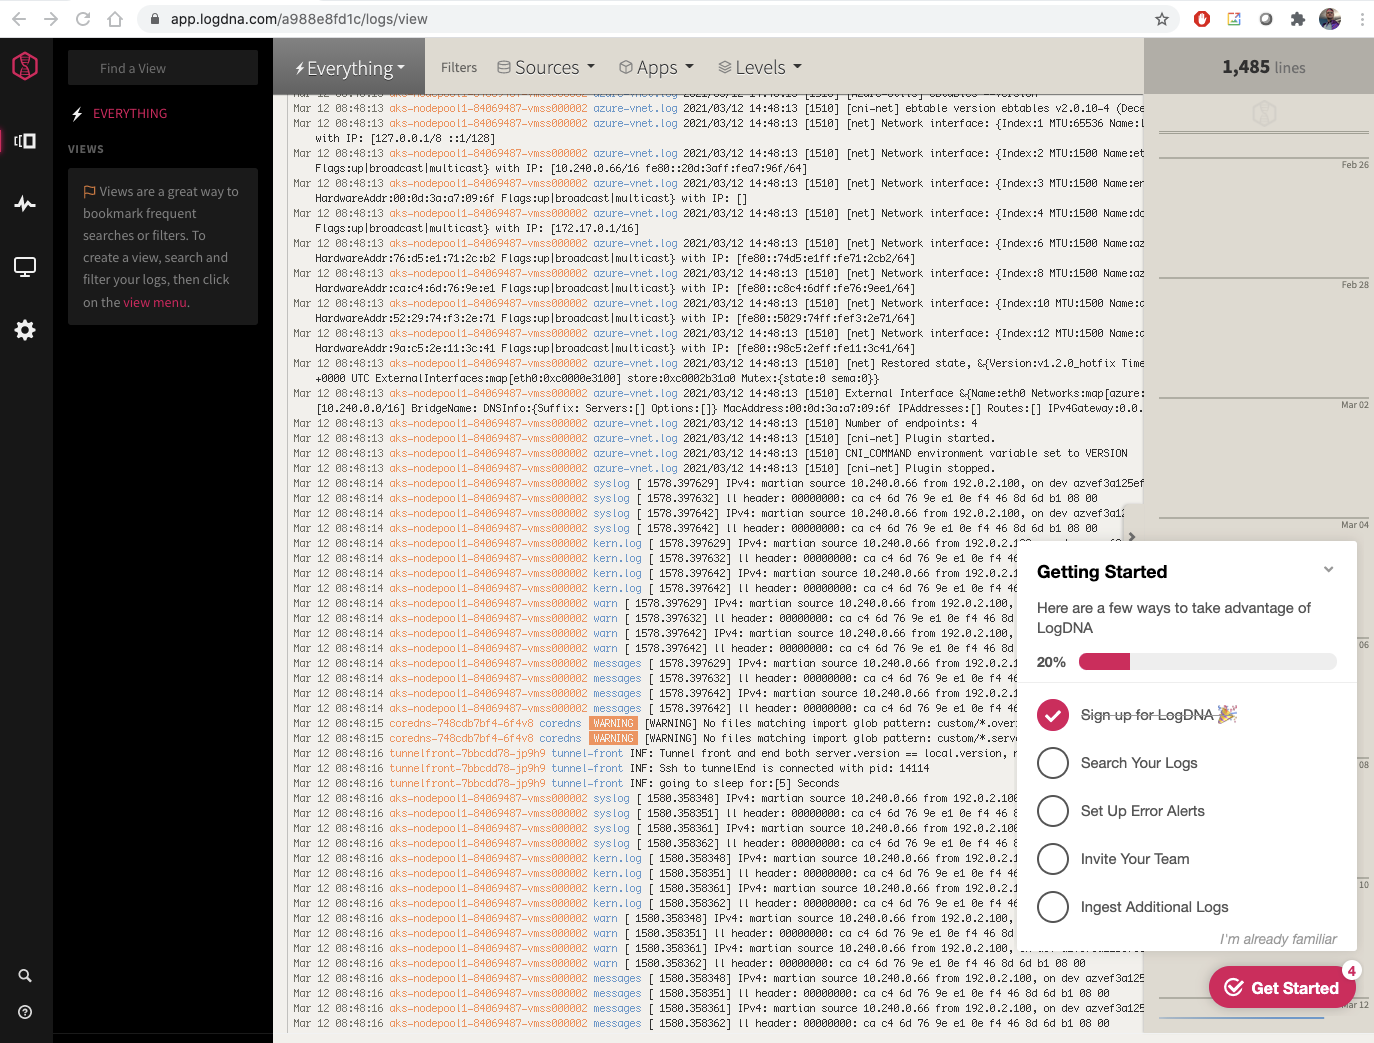
After a few moments, we see logs start to populate our instance:
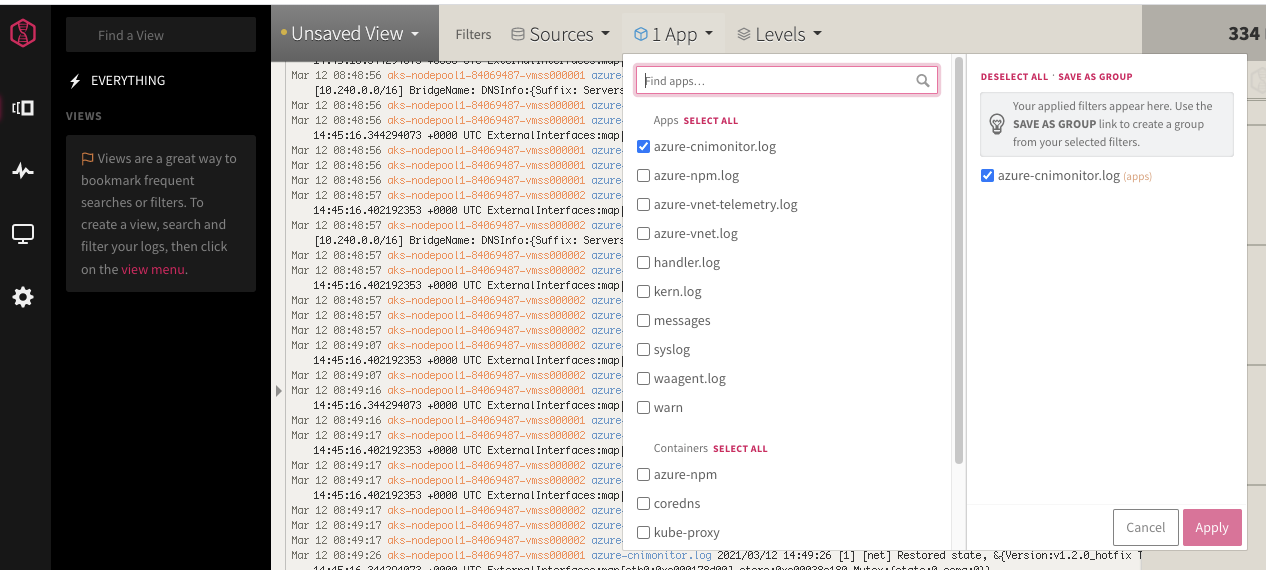
We can use the App filter to trim logs to just an app:
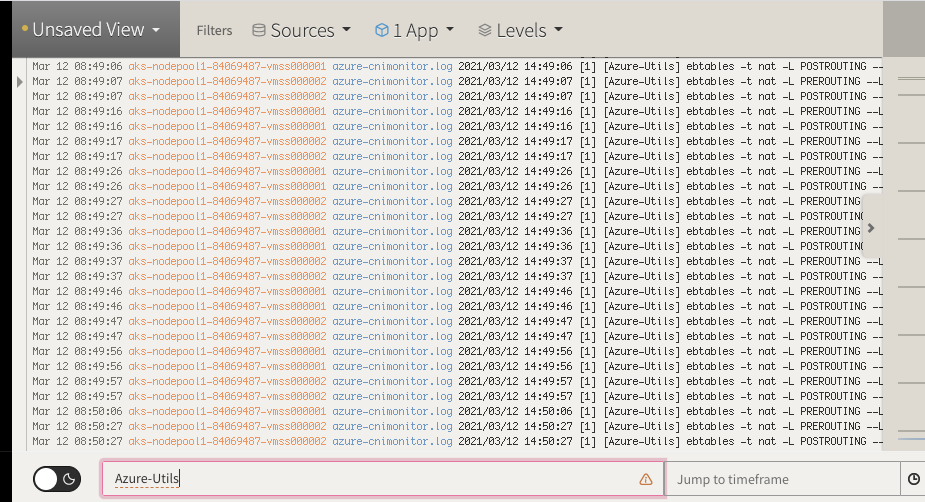
With the App selected, i can search on keywords at the bottom
Alerting
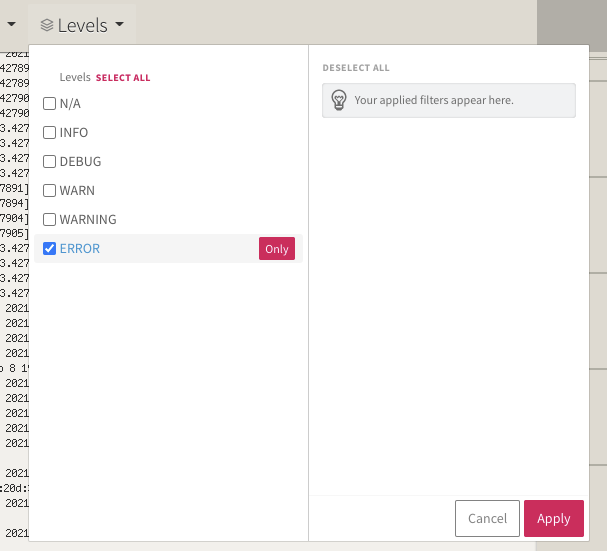
Let’s create an alert notification.. Here we can set the Level to alerts:
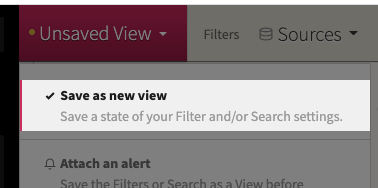
The save the view
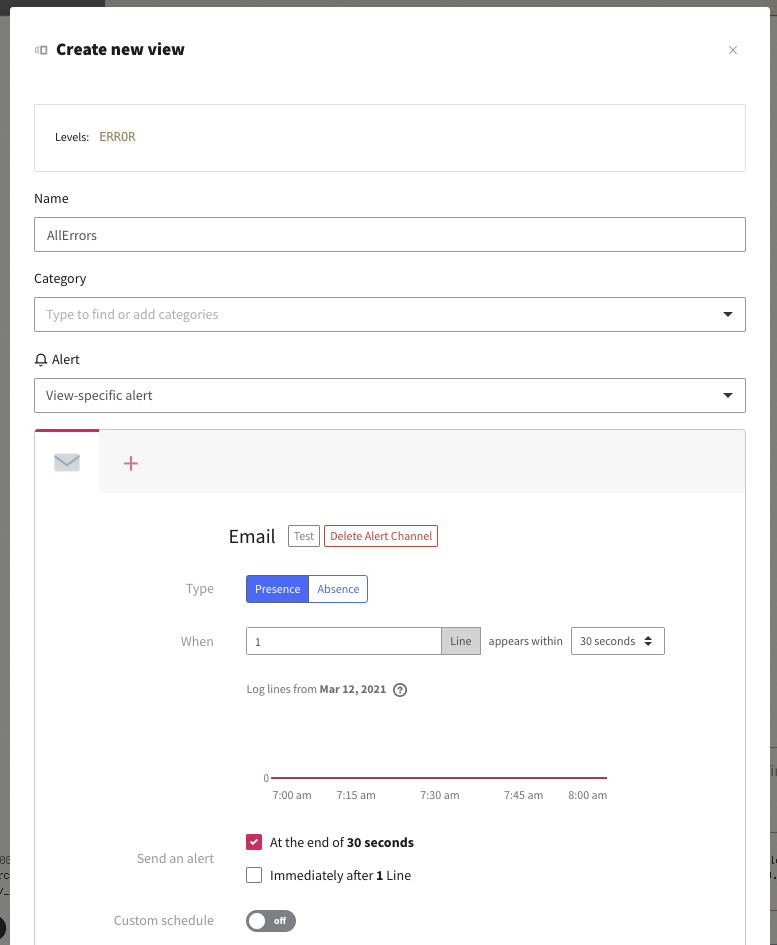
Then we can define some parameters, like a name, category and where to send the alert:
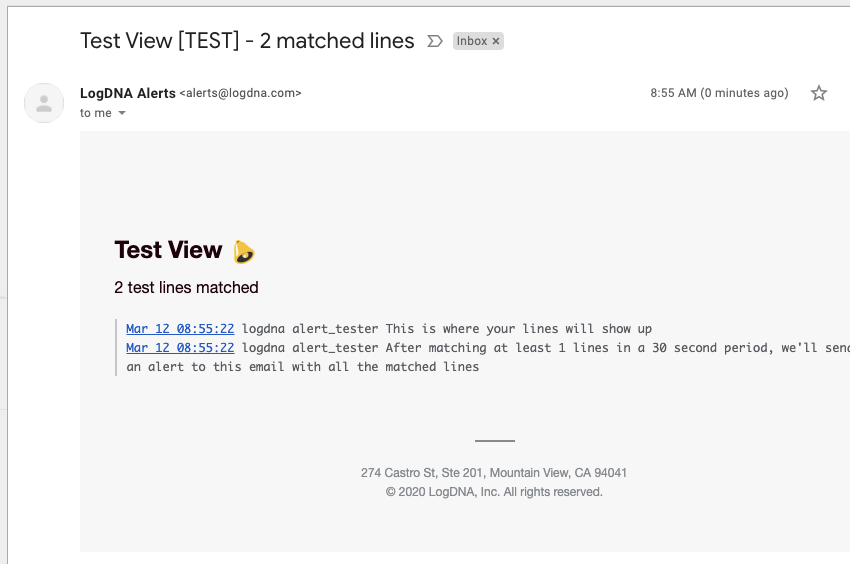
Which looks like this:
Sending Logs from Azure DevOps
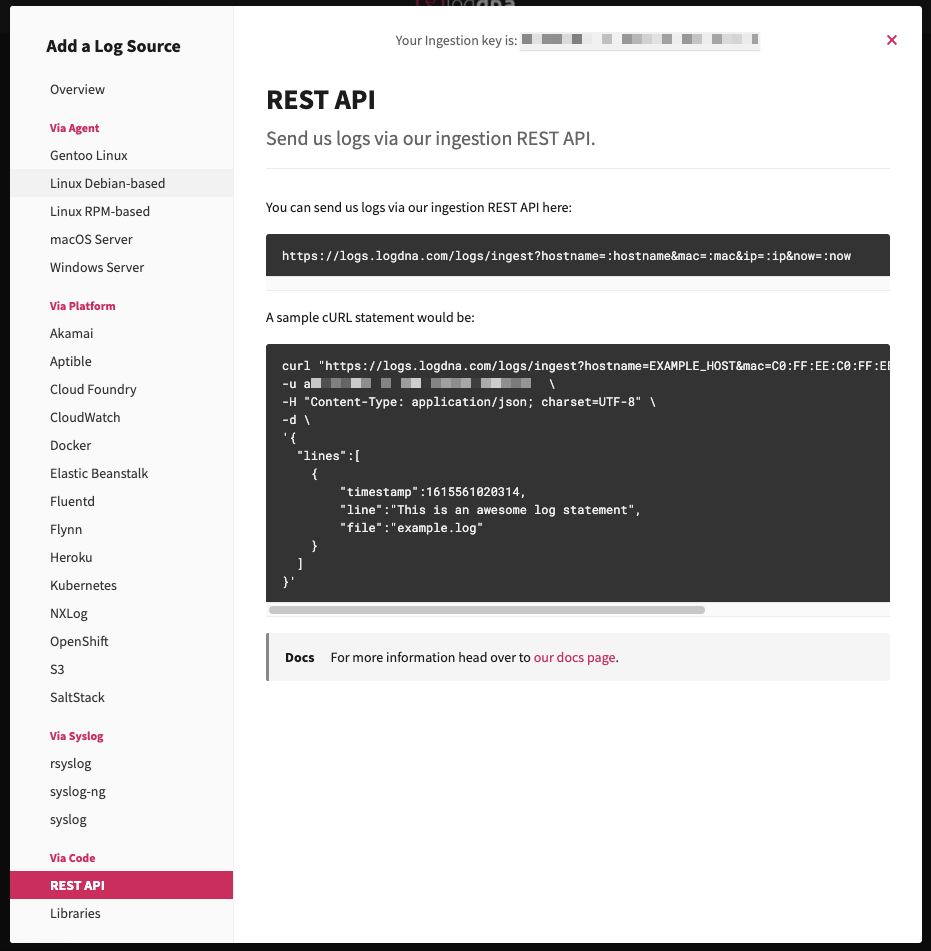
We can use the REST endpoint to accomplish this:
We can use the REST API to integrate events and logs from our pipelines into LogDNA as well:
steps:
- bash: |
   set -x

   date +%s%N | cut -b1-13

   export HNAME=`hostname | tr -d '\n'`
   export IPADDR=`ifconfig eth0 | grep "inet " | awk '{print $2}' | tr -d '\n'`
   export RIGHTNOW=$(date +%s)

   curl "https://logs.logdna.com/logs/ingest?hostname=$HNAME&mac=a0:54:9f:53:b2:6e&ip=$IPADDR&now=$RIGHTNOW" \
   -u 0e0080d105be4029a22ed3b54a167: \
   -H "Content-Type: application/json; charset=UTF-8" \
   -d \
   '{
     "lines":[
       {
           "line":"From Azure DevOps 65",
           "file":"example.log"
       }
     ]
   }'
  displayName: 'Test LogDNA'
And we can see that in the logs:
Dashboards (Screens)
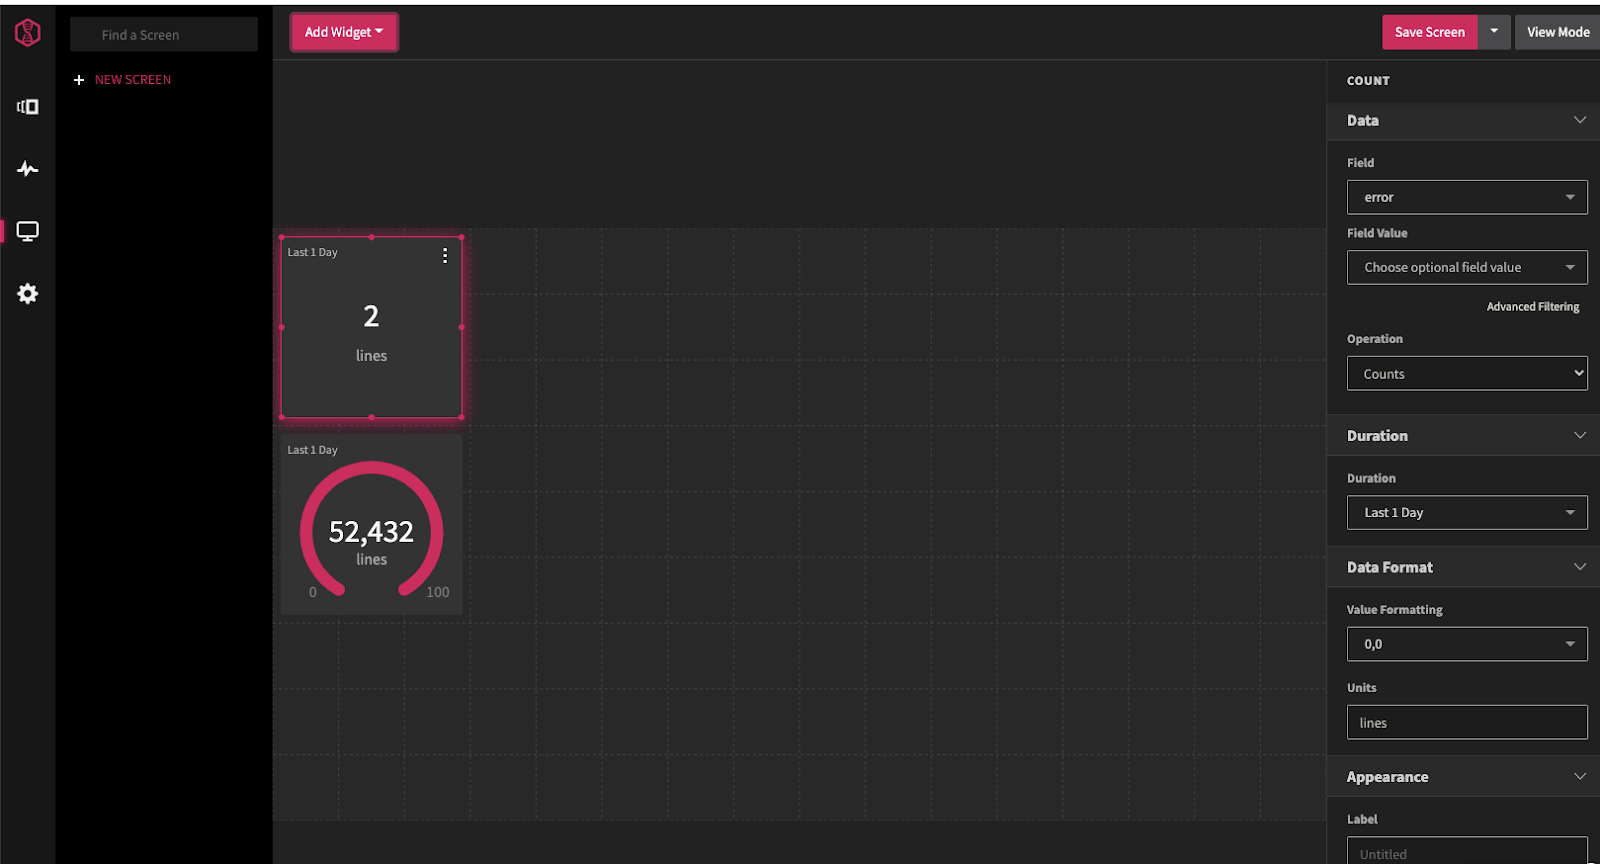
In LogDNA we can create a Screen to view data
We can add Widgets like gauges and counts to show log lines that match.
Here we see a count for errors in the last day
With Gauges, counts and tables, i can easily create an SRE dashboard one could use to monitor a system:
Dashboards (Boards)
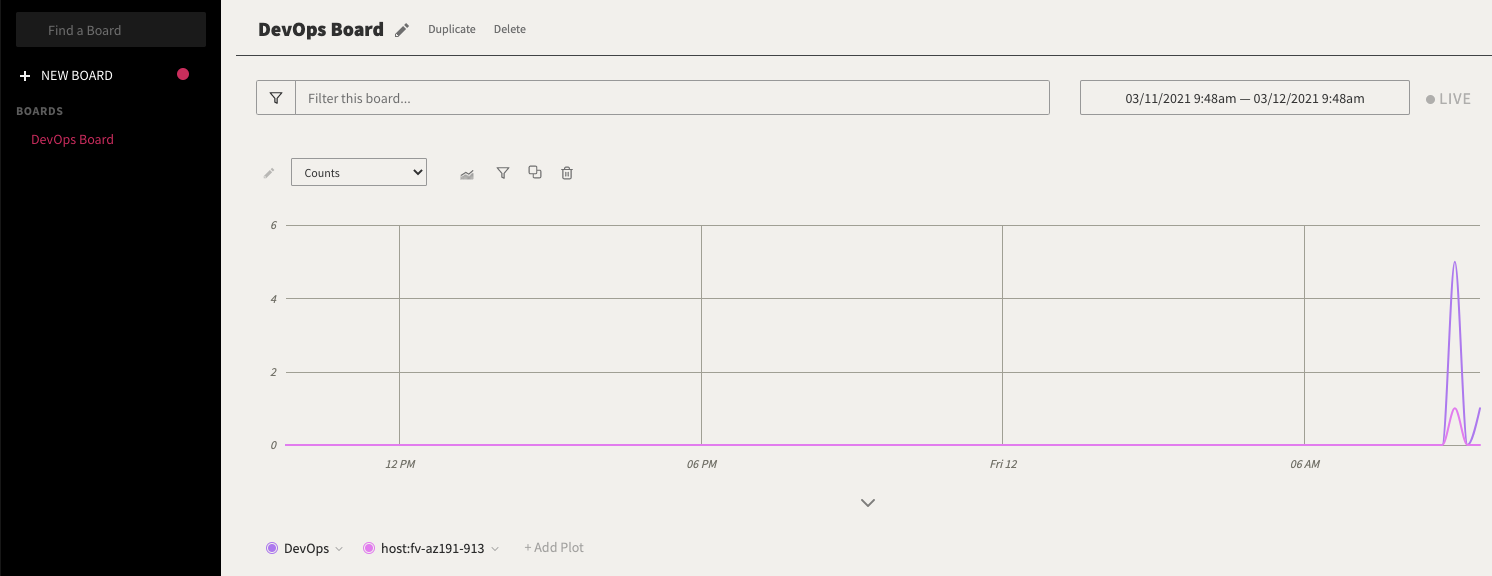
We can also create boards, which are like screens, but more interactive. We can use the “DevOps” event query to create a board of events and add a “plot” line on hosts
Billing
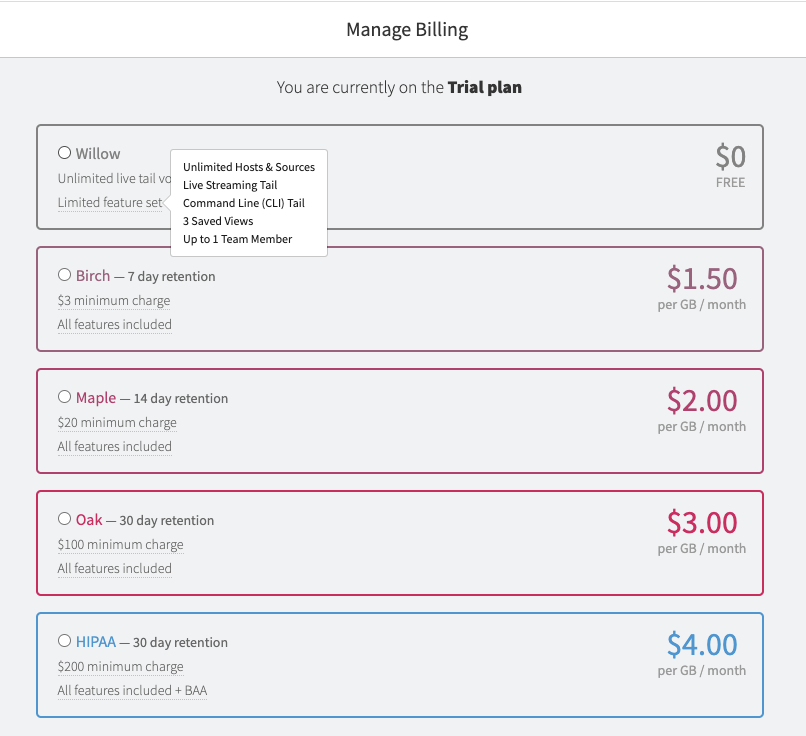
Billing is pretty much focused on retention and volume. There is a very limited free tier (willow) but without the alerting, isn’t something I’de pursue other than to prove out a system.
Security
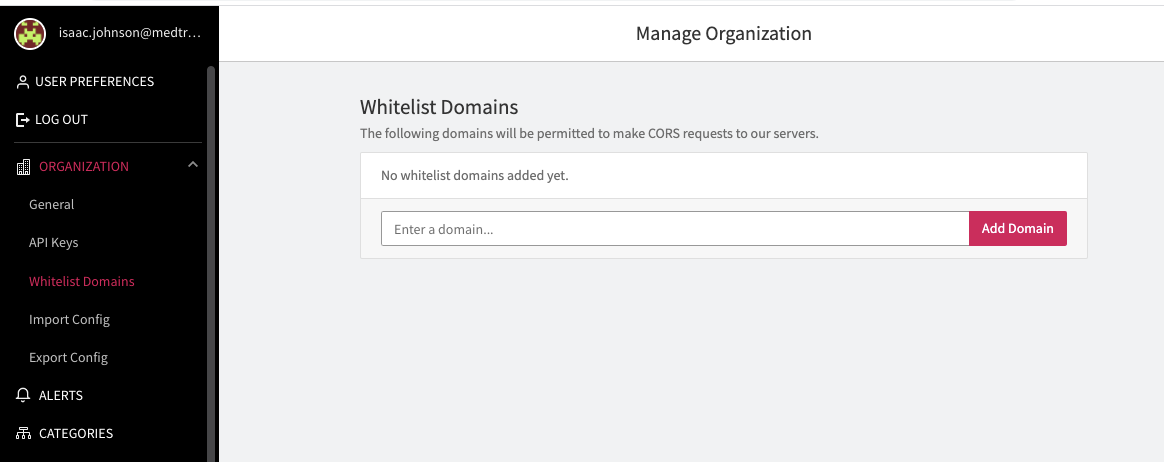
They have the ability to Whitelist domains for CORS requests;
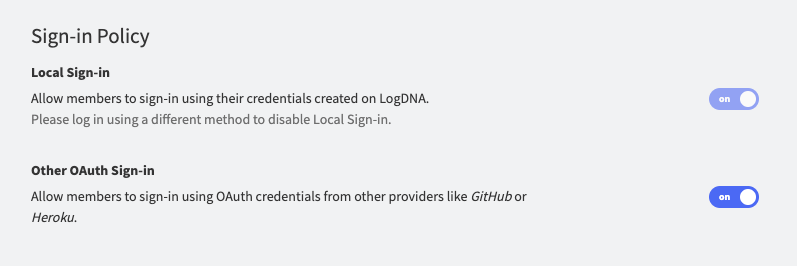
You can also federate to a few known providers, but i did not see SAML as an option (for federating to AD)
Usage
There is a handy Usage dashboard that shows how much we’ve consumed:
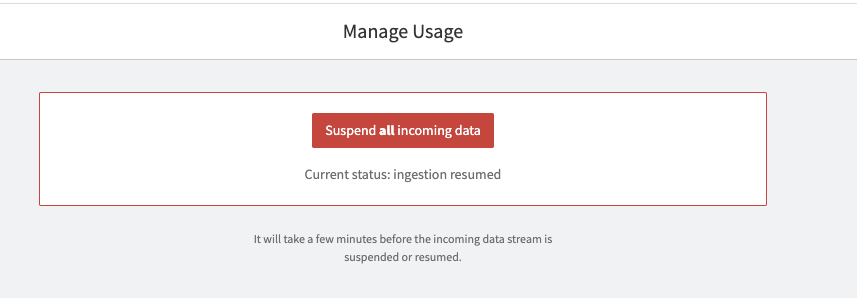
And the ability to flip a kill switch to stop
As a person who watches my costs and does a lot of demos, this could be a very handy feature.
Service Hooks
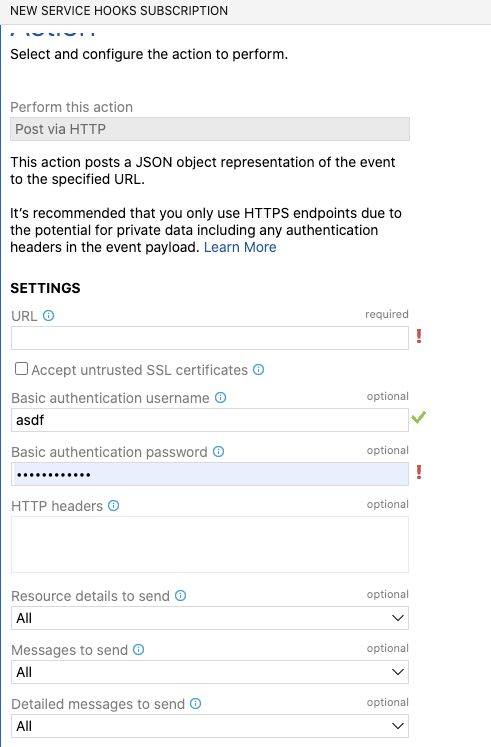
I was hoping to tie into service hooks in Azure DevOps. However, the REST ingest really just wants a lines payload and the generic ‘webhook’ subscription doesn’t let me hack the payload:
So I would need to use code based Curl commands like demoed earlier.
That said, for those using Github, there is a native integration you can use for events: https://docs.logdna.com/docs/github-events
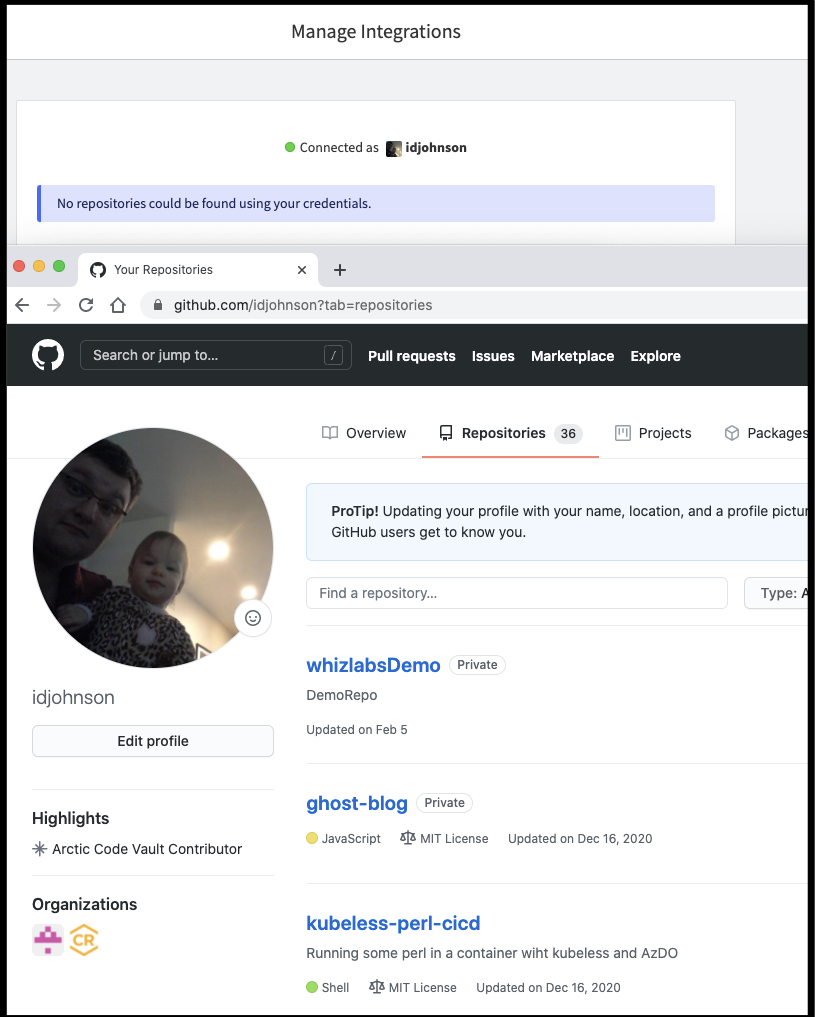
However, despite having some public and private GH repos, i could not get LogDNA to see them:
Terraform
One of the surprising things i found was LogDNA has aterraform providerfor adding alerting:
terraform {
  required_providers {
    logdna = {
      source = "logdna/logdna"
      version = "1.0.0"
    }
  }
}
# Configure the LogDNA Provider
provider "logdna" {
  servicekey = <your_service_key_goes_here>
}

resource "logdna_view" "my_view" {
  apps = ["app1", "app2"]
  categories = ["Demo1", "Demo2"]
  hosts = ["host1", "host2"]
  levels = ["fatal", "critical"]
  name = "Email PagerDuty and Webhook View-specific Alerts"
  query = "test"
  tags = ["tag1", "tag2"]

  email_channel {
    emails = ["test@logdna.com"]
    immediate = "false"
    operator = "absence"
    terminal = "true"
    timezone = "Pacific/Samoa"
    triggerinterval = "15m"
    triggerlimit = 15
  }

  pagerduty_channel {
    immediate = "false"
    key = <your_service_key_goes_here>
    terminal = "true"
    triggerinterval = "15m"
    triggerlimit = 15
  }

  webhook_channel {
    bodytemplate = jsonencode({
      hello = "test1"
      test = "test2"
    })
    headers = {
      hello = "test3"
      test = "test2"
    }
    immediate = "false"
    method = "post"
    terminal = "true"
    triggerinterval = "15m"
    triggerlimit = 15
    url = "https://yourwebhook/endpoint"
  }
}
Note : this is about using Terraform to add notification channels like webhooks, slack, Pagerduty and even Datadog alerts.
Summary
LogDNA has made a lot of product releases in the last year. Founded in 2016 they had focused a lot on Kubernetes but in the last year, they’ve expanded out into AWS logs, Cloudfront and ALB/ELB logging. They added many more 3rd Party integrations such as Slack, and Pagerduty and now have partnerships with IBM for log analysis in their cloud.
2020 also saw one of the founders, Chris Nguyen move from CEO to Chief Strategy Officer as they brought in a Silicon Valley seasoned leader, Tucker Callaway who saw Chef through its acquisition and was Chief Revenue officer at Sauce Labs, a long time automated testing software company. Reading tea leaves, i would surmise the latest Series C round pushed them to get a leader who could help them focus on revenue.
The product itself is very clean. A pink and black motif wraps a fast dynamic site for which logs are the primary focus. However, in today’s Monitoring and Alerting market, being a logs-only solution presents some limitations. They like to talk about the “AI” in their log parsing, but a lot of companies are expanding from logs into APM and Event monitoring. Even setting up REST based AzDO events in the demo had me hacking a MAC address into the curl statement showing they are still fundamentally about server logs.
With the business changes, i would expect more paid-for add-ons coming as a way to increase revenue. A simple “get everything” and only focus on ingestion size and retention doesn’t lend itself to feature improvements. Additionally, the free tier limitations means it’s unlikely I will use it personally as I want to focus on alerting and monitoring of systems, not logs.


