Published: Dec 1, 2020 by Isaac Johnson
Epsagonwas one of the KubeCon sponsors this year that caught my eye. They have a tracing suite with a free tier that seemed interesting. One can track a thousand traces a month in the free tier which includes alerting and monitoring.
So how easy is it to setup and use? And what, if any, are the limitations.
Setup
Everything is done via a wizard. Such as setting up monitoring of clusters
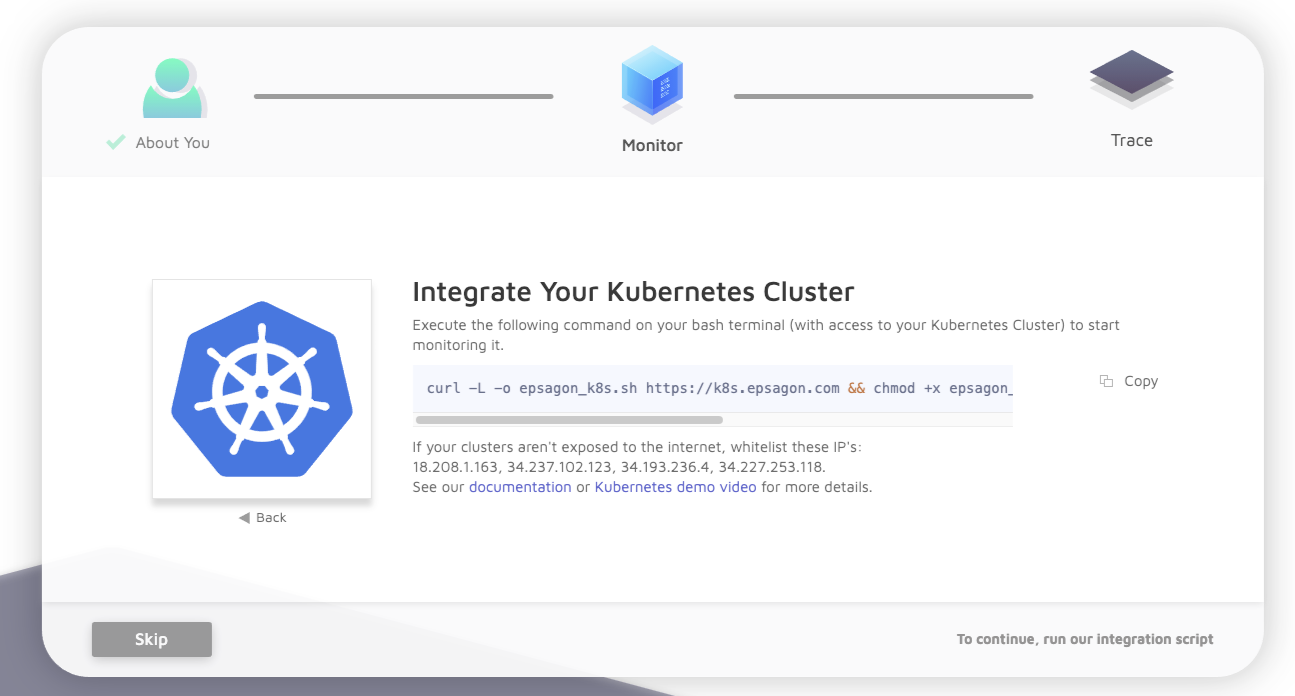
running the command locally
$ curl -L -o epsagon_k8s.sh https://k8s.epsagon.com && chmod +x epsagon_k8s.sh && ./epsagon_k8s.sh 12345-12345-12345-12345-12345
  % Total % Received % Xferd Average Speed Time Time Time Current
                                 Dload Upload Total Spent Left Speed
  0 0 0 0 0 0 0 0 --:--:-- --:--:-- --:--:-- 0
100 8732 100 8732 0 0 14291 0 --:--:-- --:--:-- --:--:-- 14291
Fetching epsagon-role.yaml
  % Total % Received % Xferd Average Speed Time Time Time Current
                                 Dload Upload Total Spent Left Speed
100 1067 100 1067 0 0 4521 0 --:--:-- --:--:-- --:--:-- 4521
          Welcome to Epsagon!

             ###### # ##
             ###### #####
           ############## # ######
           ################### ######
      #### ###########################
     ##### ###########################
 ### ##################################
 #### ### ## ###################
 ### #################
                          ##########
                          ############
                             ### ###
Are you using Rancher Management System? [Y/N] n
Available clusters:
1. default

Choose clusters to integrate. Use spaces for multiple clusters, e.g: 1 2 3...
1

Now installing Epsagon to: default
Applying epsagon-role.yaml to default

namespace/epsagon-monitoring created
serviceaccount/epsagon-monitoring created
Warning: rbac.authorization.k8s.io/v1beta1 ClusterRole is deprecated in v1.17+, unavailable in v1.22+; use rbac.authorization.k8s.io/v1 ClusterRole
clusterrole.rbac.authorization.k8s.io/epsagon-prometheus created
Warning: rbac.authorization.k8s.io/v1beta1 ClusterRoleBinding is deprecated in v1.17+, unavailable in v1.22+; use rbac.authorization.k8s.io/v1 ClusterRoleBinding
clusterrolebinding.rbac.authorization.k8s.io/epsagon-prometheus created
Testing Epsagon connection to server https://192.168.1.74:6443...
  % Total % Received % Xferd Average Speed Time Time Time Current
                                 Dload Upload Total Spent Left Speed
100 1140 100 41 100 1099 1 37 0:00:41 0:00:29 0:00:12 8
Connection to Epsagon failed, please see: https://docs.epsagon.com/docs/environments-kubernetes
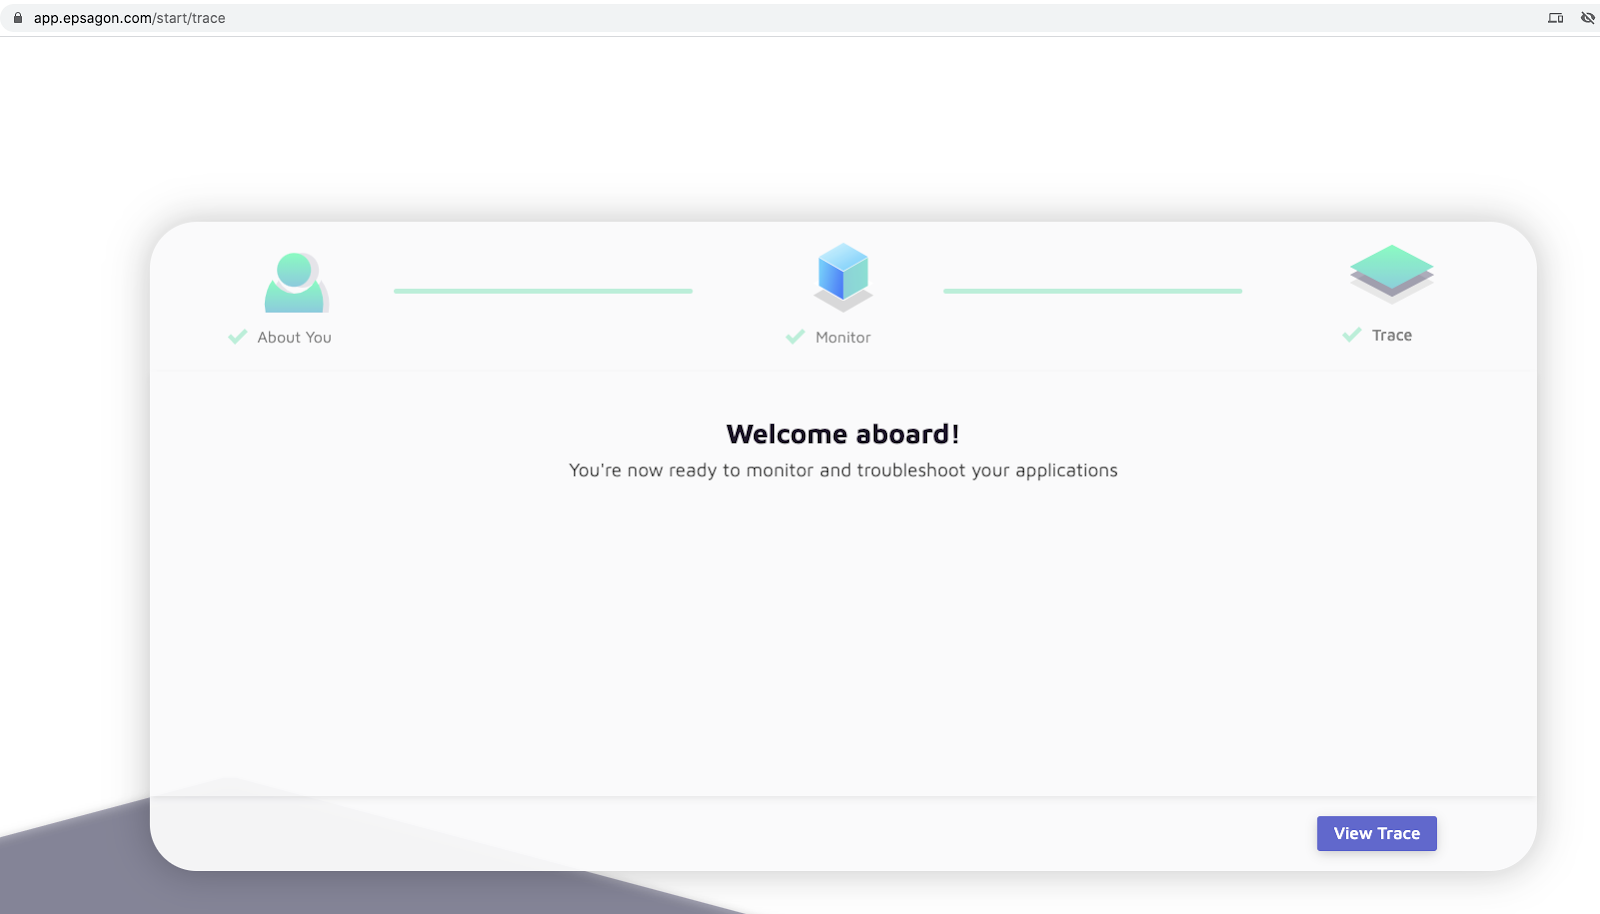
This showed a problem as my k8s is not exposed externally. However, running on my AKS cluster went fine.
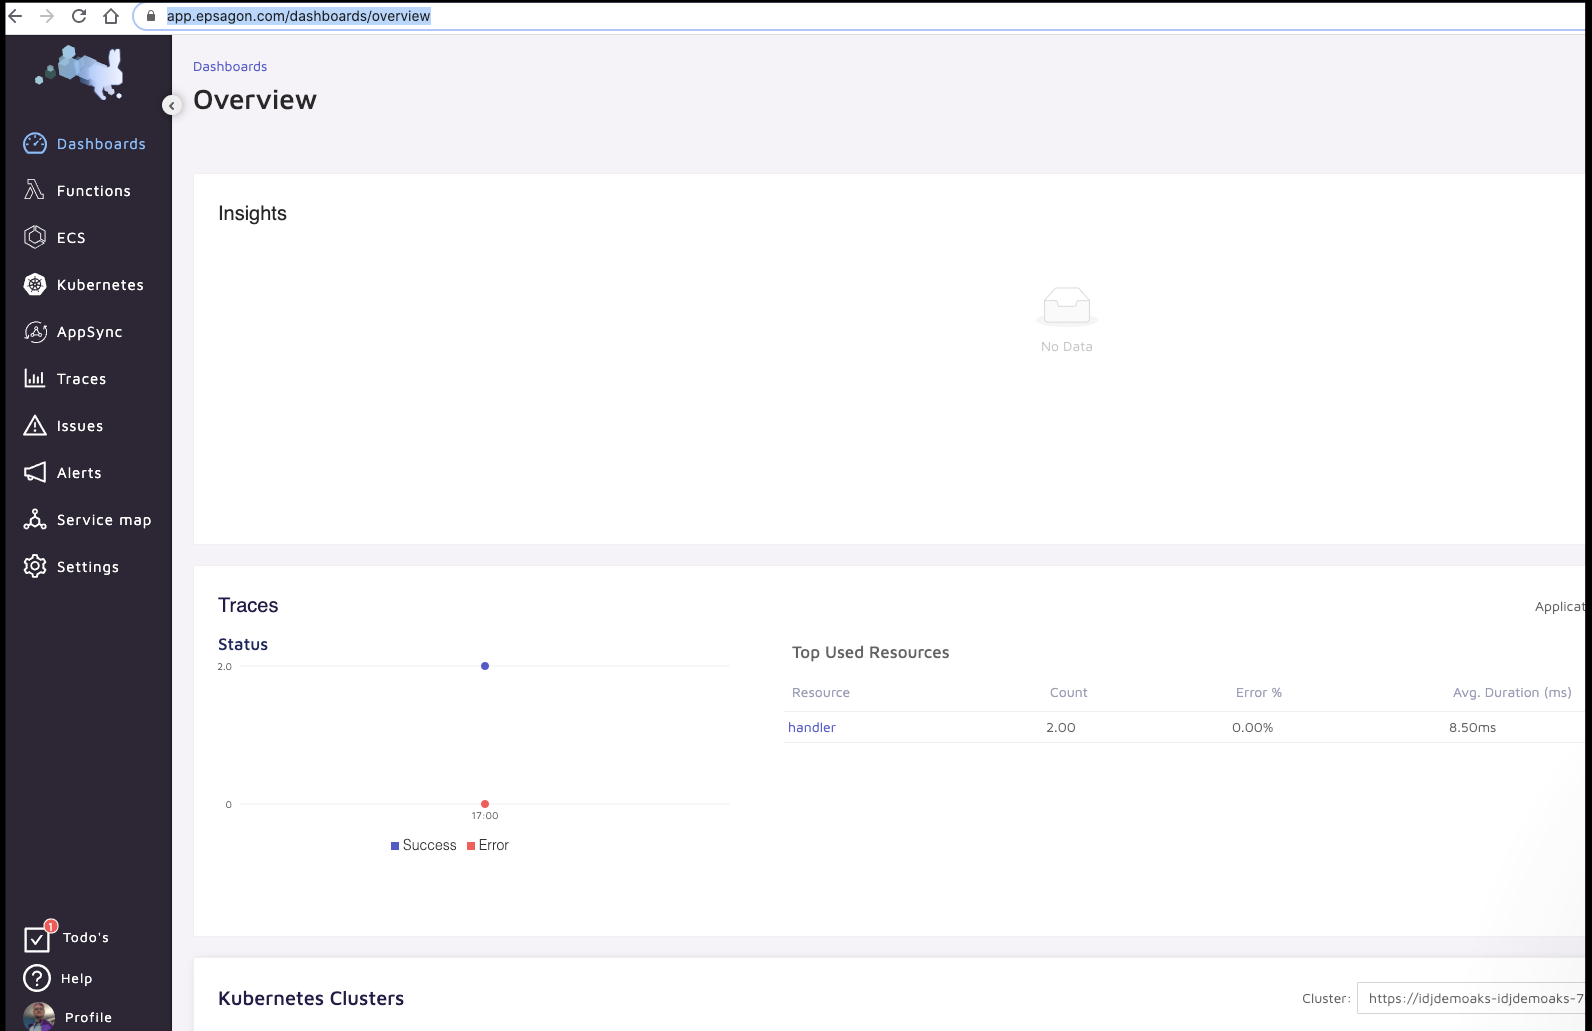
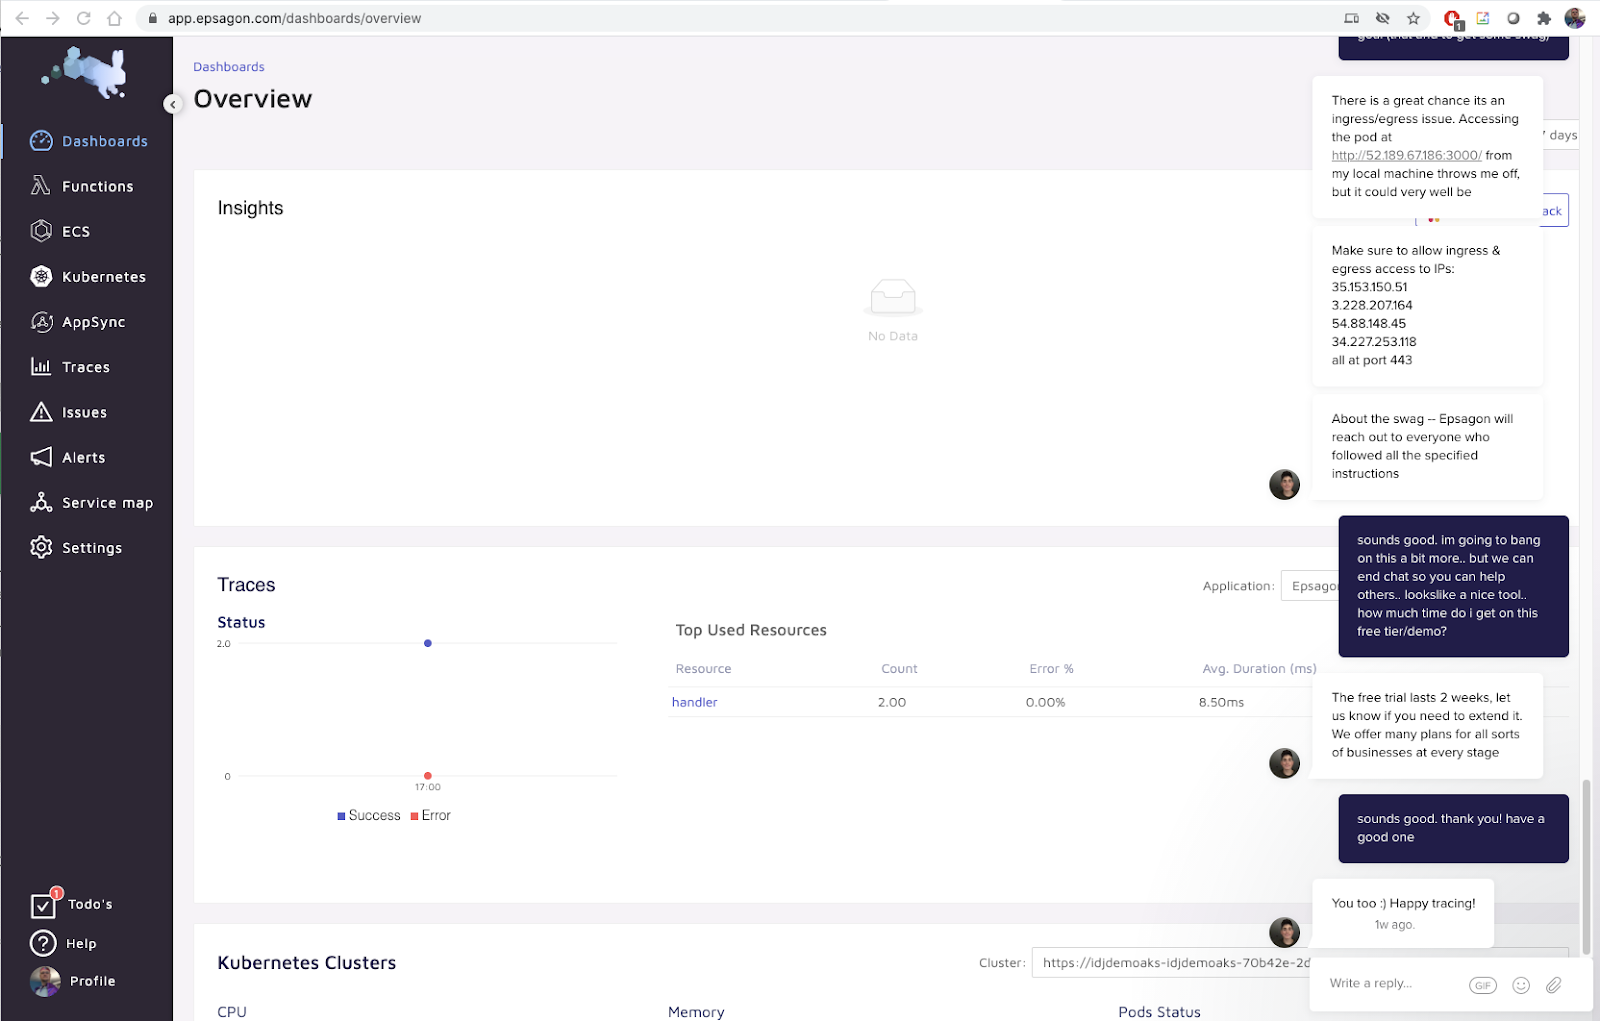
https://app.epsagon.com/dashboards/overview
Instrumenting an App
The next step is to setup some form of tracing. Since I’m most comfortable in NodeJS, let’s just update some Express apps
$ cat app.js
const express = require('express')
const epsagon = require('epsagon-frameworks');

epsagon.init({
  token: 'asdfasdf-asdf-asdf-asdf-asdfasdf',
  appName: 'MyApp',
  metadataOnly: false,
});

const app = express()
const port = 3000

app.get('/', (req, res) => {
  req.epsagon.label('key', 'run7');
  req.epsagon.setError(Error('My custom error'));
  res.send('Hello World!')
})

app.listen(port, () => {
  console.log(`Example app listening at http://localhost:${port}`)
})
Once launched into my cluster:
$ cat Dockerfile
FROM node:12-alpine

RUN mkdir -p /usr/src/app

WORKDIR /usr/src/app

COPY . .

RUN npm install

EXPOSE 3000

CMD ["npm", "run", "start"]


$ cat Deployment.yaml
apiVersion: apps/v1
kind: Deployment
metadata:
  name: idjexpress-deployment
  labels:
    app: idjexpress
spec:
  replicas: 1
  selector:
    matchLabels:
      app: idjexpress
  template:
    metadata:
      labels:
        app: idjexpress
    spec:
      containers:
      - name: idjexpress
        image: idjohnson/expressapp:6
        ports:
        - containerPort: 3000
I can hit the ingress (http://52.189.67.186:3000/) and see it respond
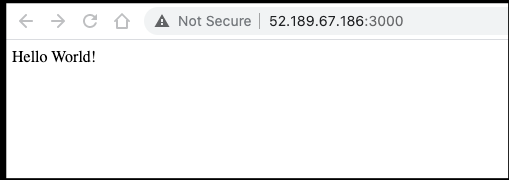
This showed no traces however
But clearly it’s something I’m doing since hitting the pod directly worked
$ kubectl port-forward idjexpress-deployment-785c4bcdd7-49ntc 8080:3000
Forwarding from 127.0.0.1:8080 -> 3000
Forwarding from [::1]:8080 -> 3000
Handling connection for 8080
Handling connection for 8080
I also instrumented up another express demo just for different results
$ kubectl port-forward helloworld-deployment-7bcb884994-qnhqh 8080:80
Forwarding from 127.0.0.1:8080 -> 80
Forwarding from [::1]:8080 -> 80
Handling connection for 8080
Handling connection for 8080
At first no results
but after a few reloads, we can see some traces
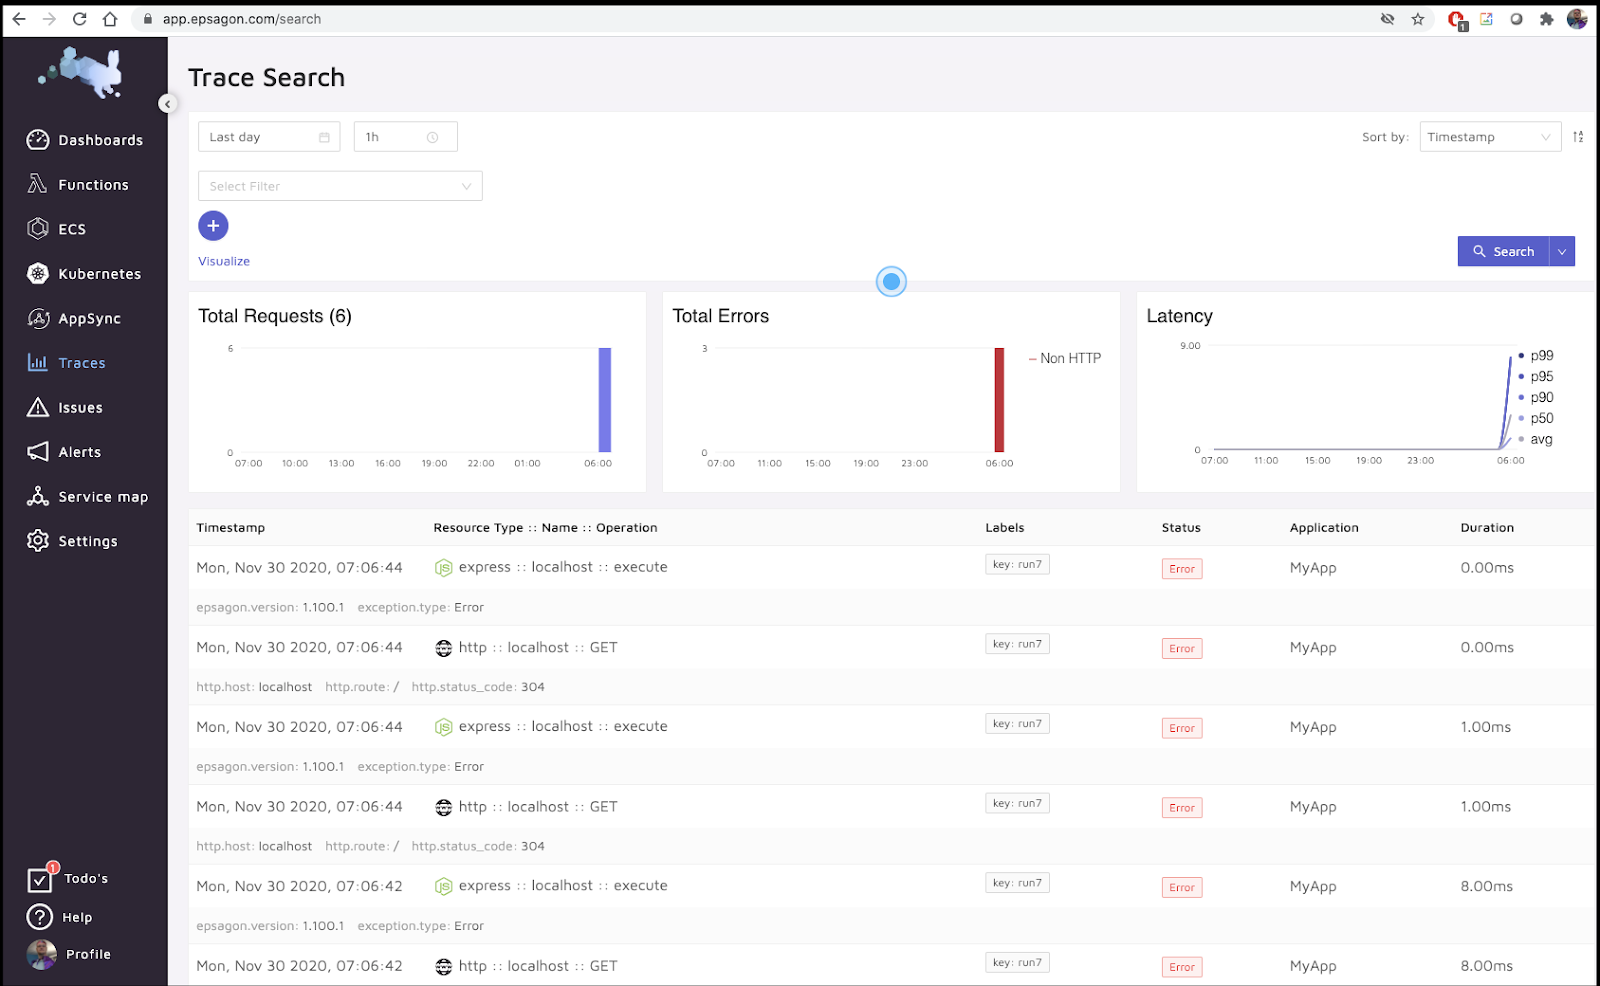
Looking at details:
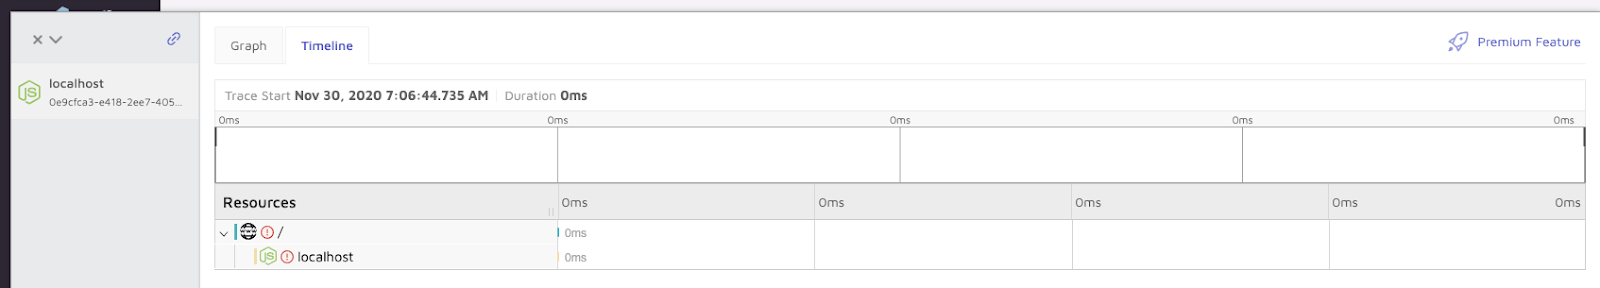
Here we can see the trace, albeit rather simple:
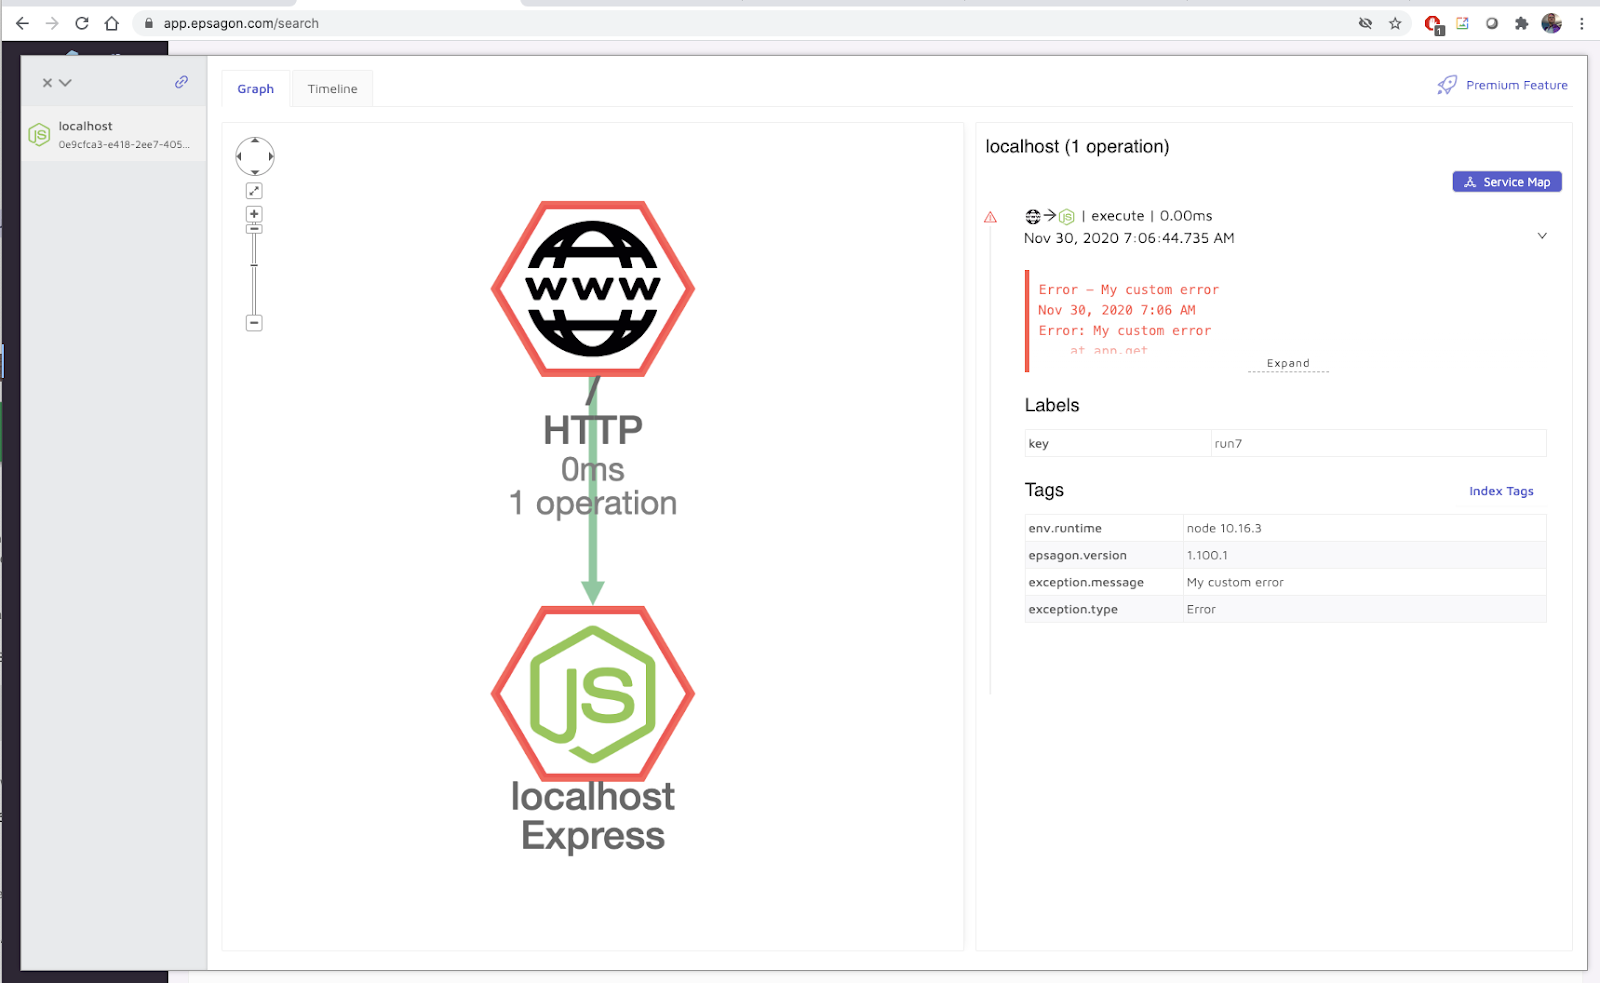
We can expand on that:
We can also look at clusters
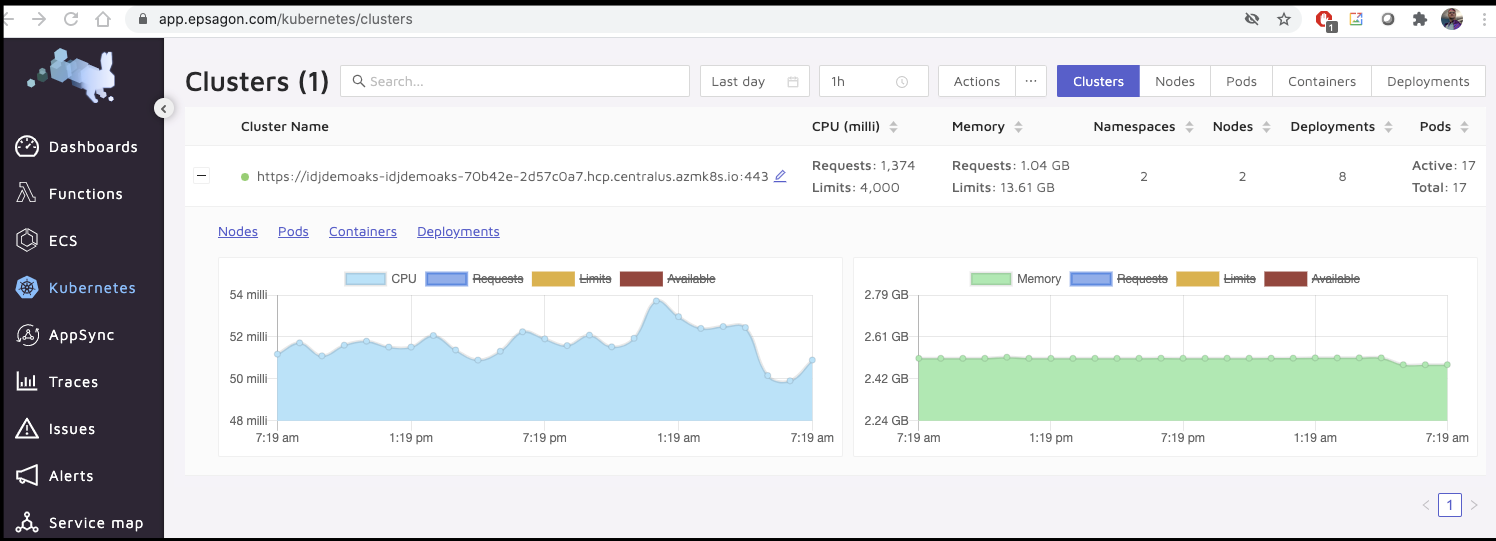
This gives us a nice view of some basics like Node health
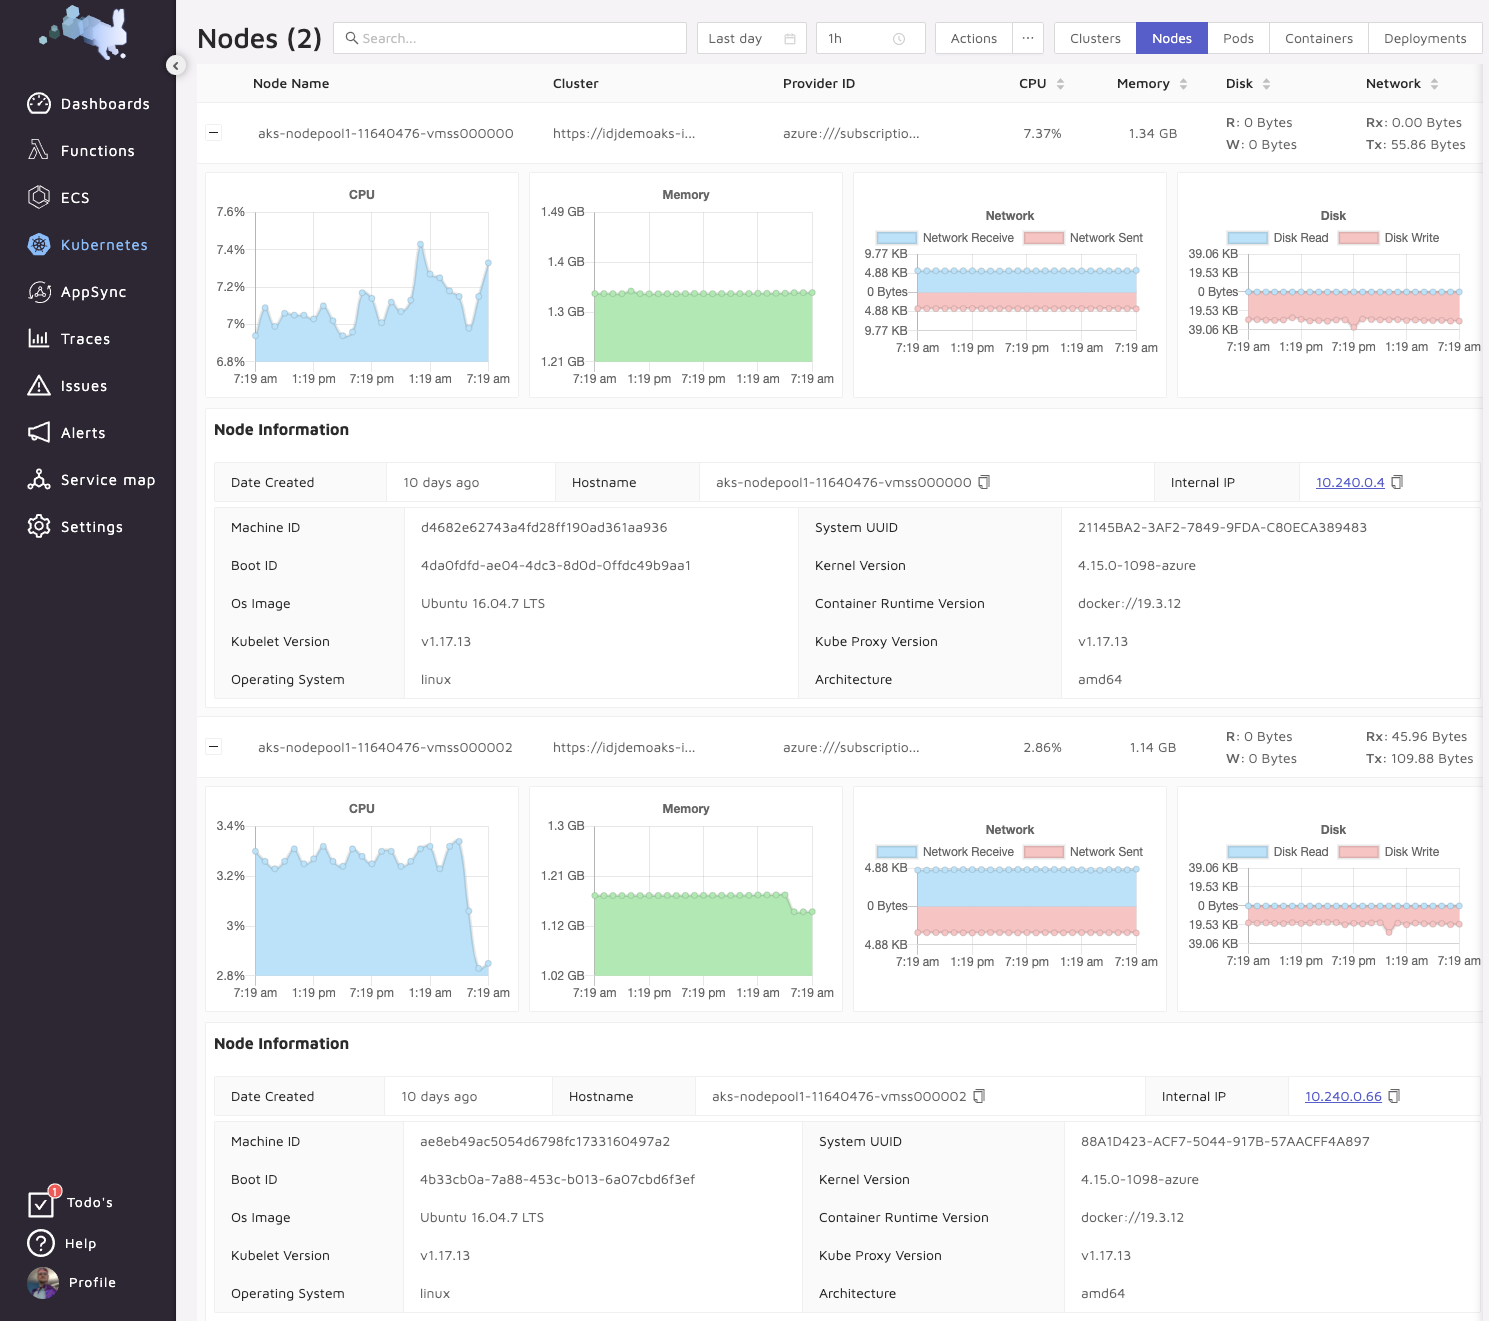
We can also look at pods across our namespaces:
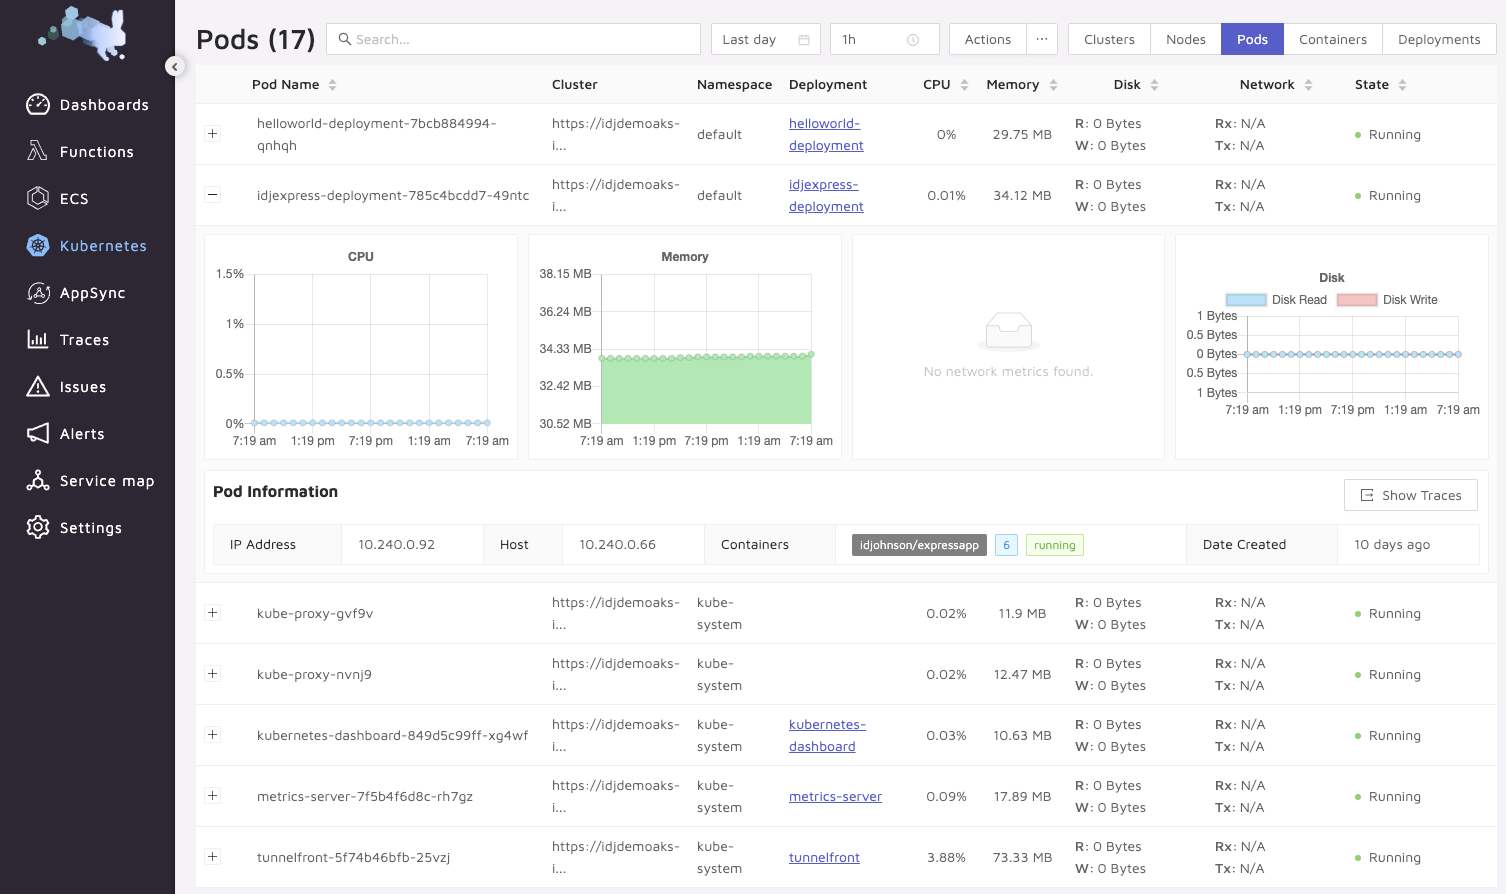
As well as deployment details:
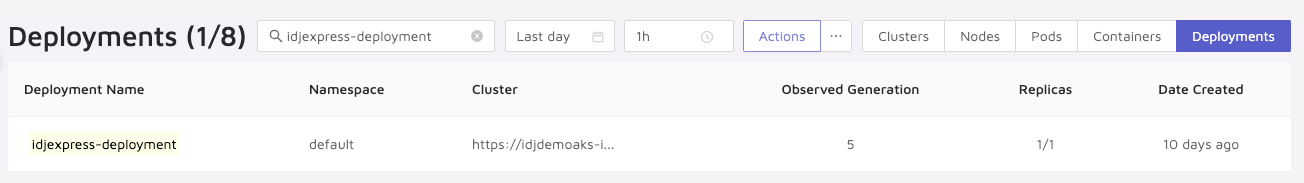
This is pretty handy for tracking when changes occur.
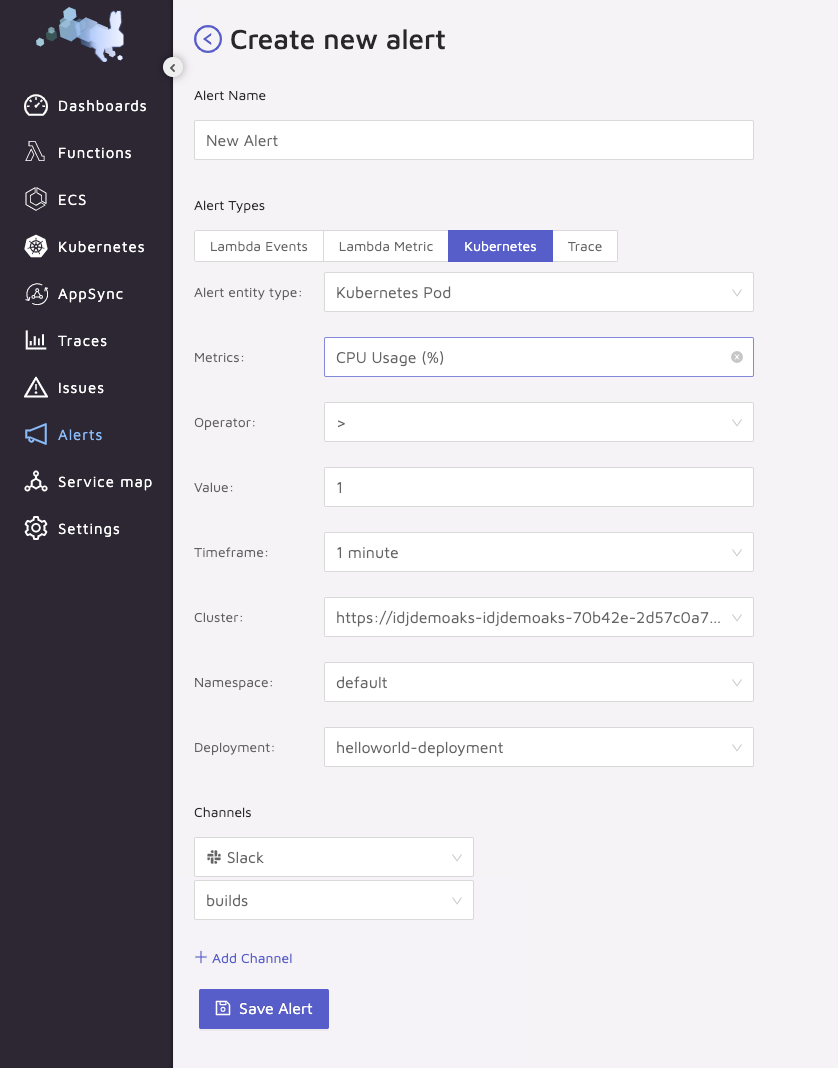
Alerting
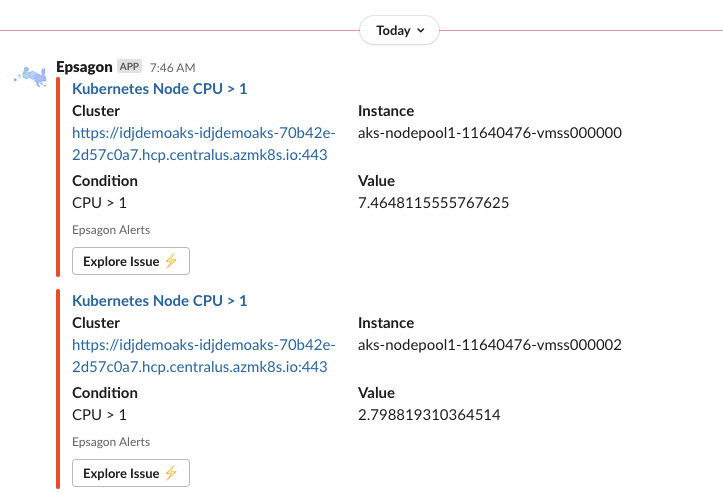
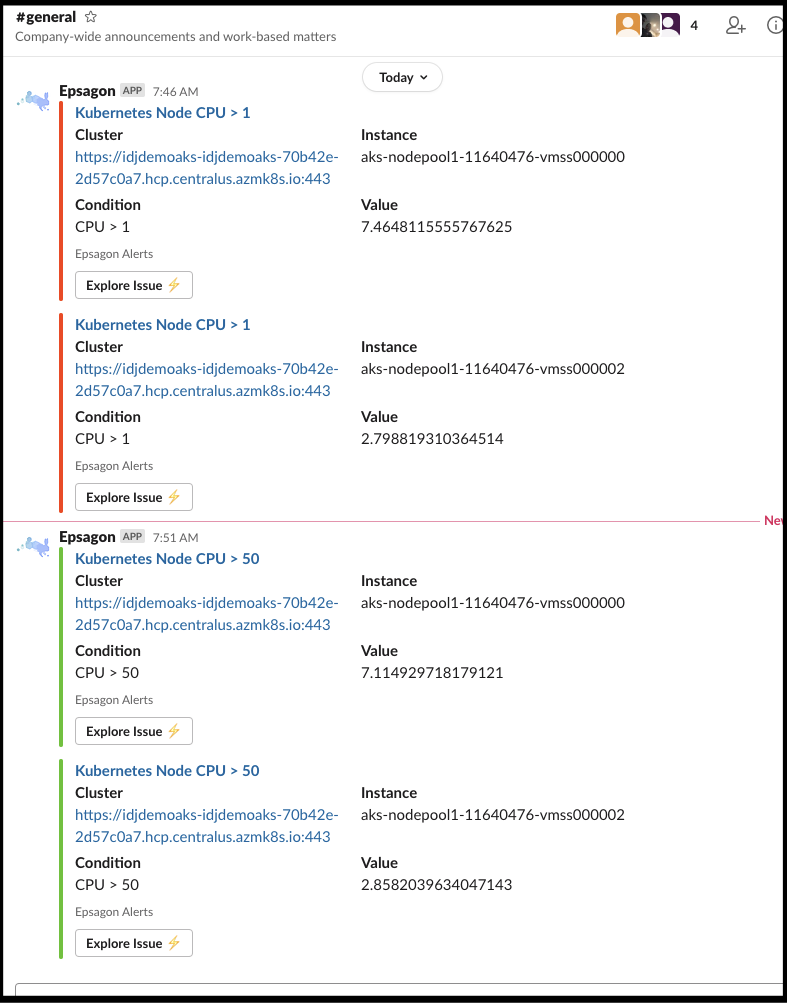
We can create alerts to things like Slack:
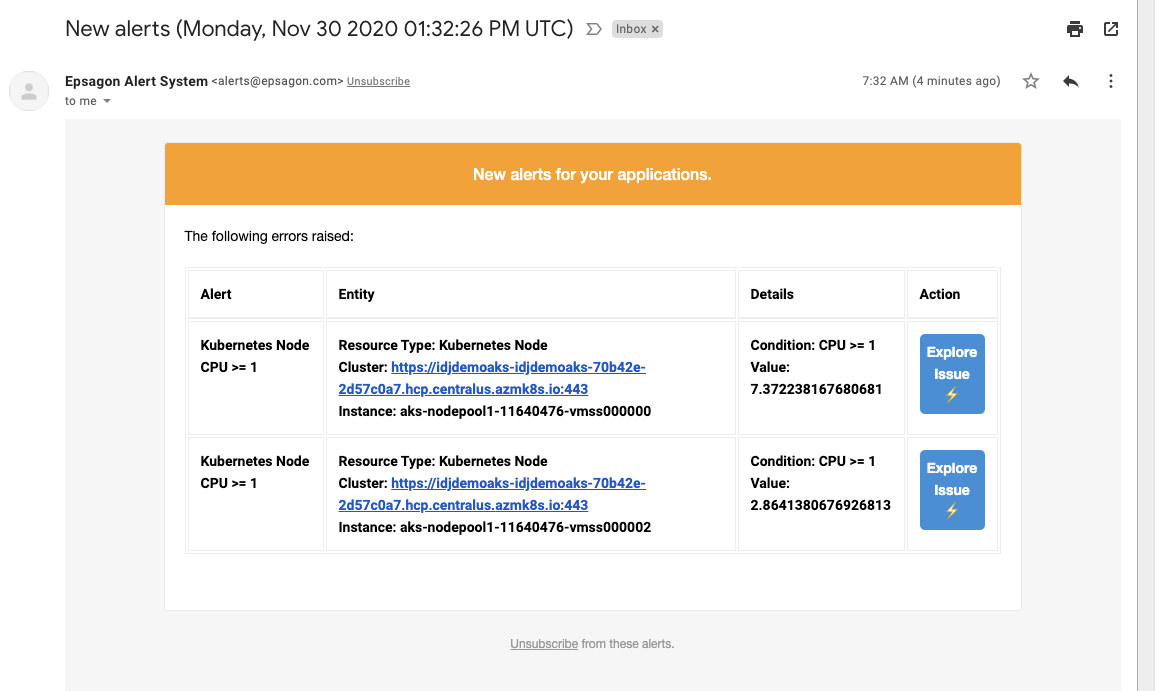
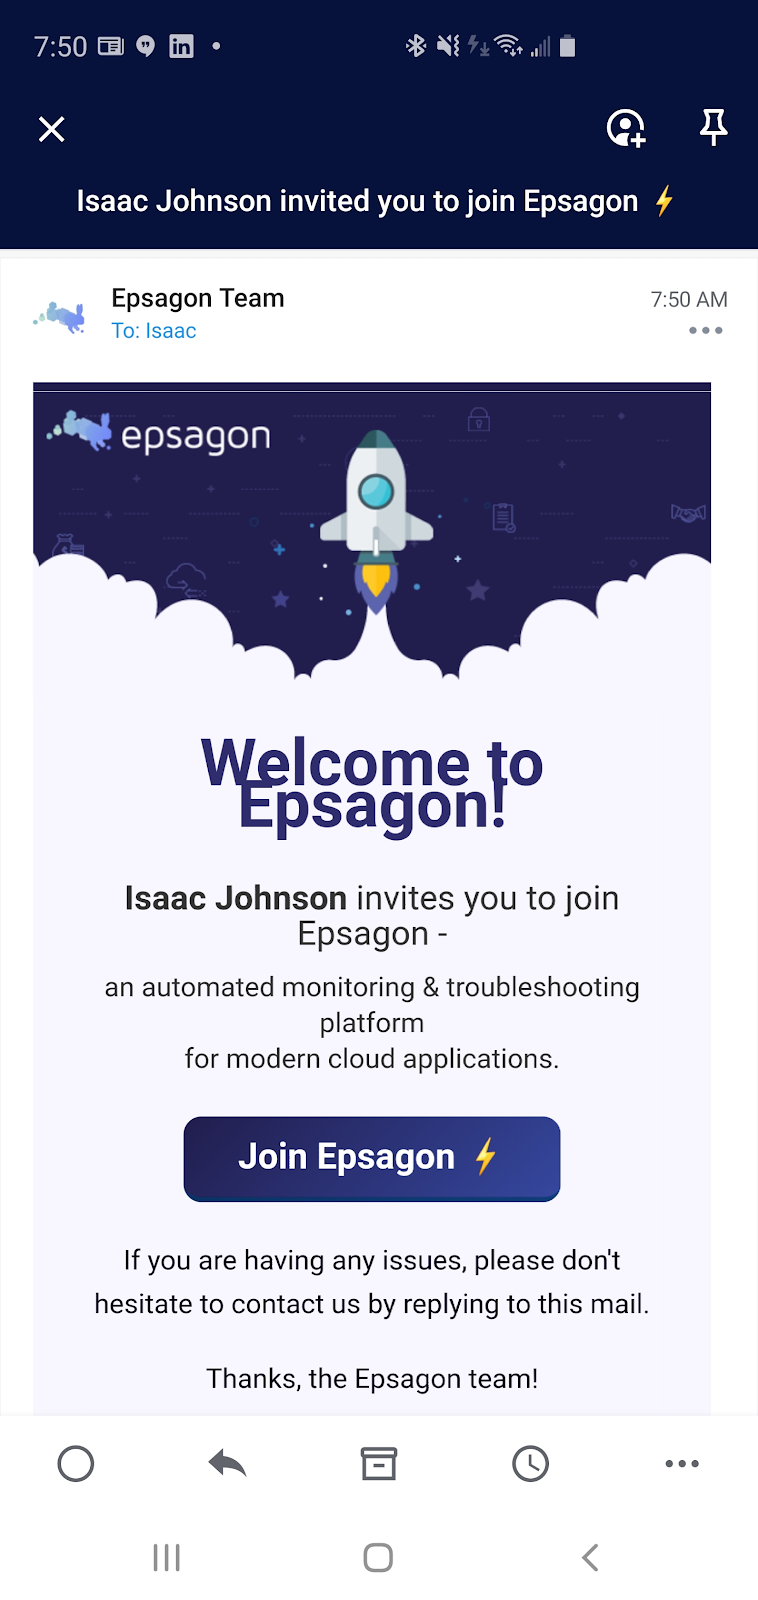
We can also do email alerts:
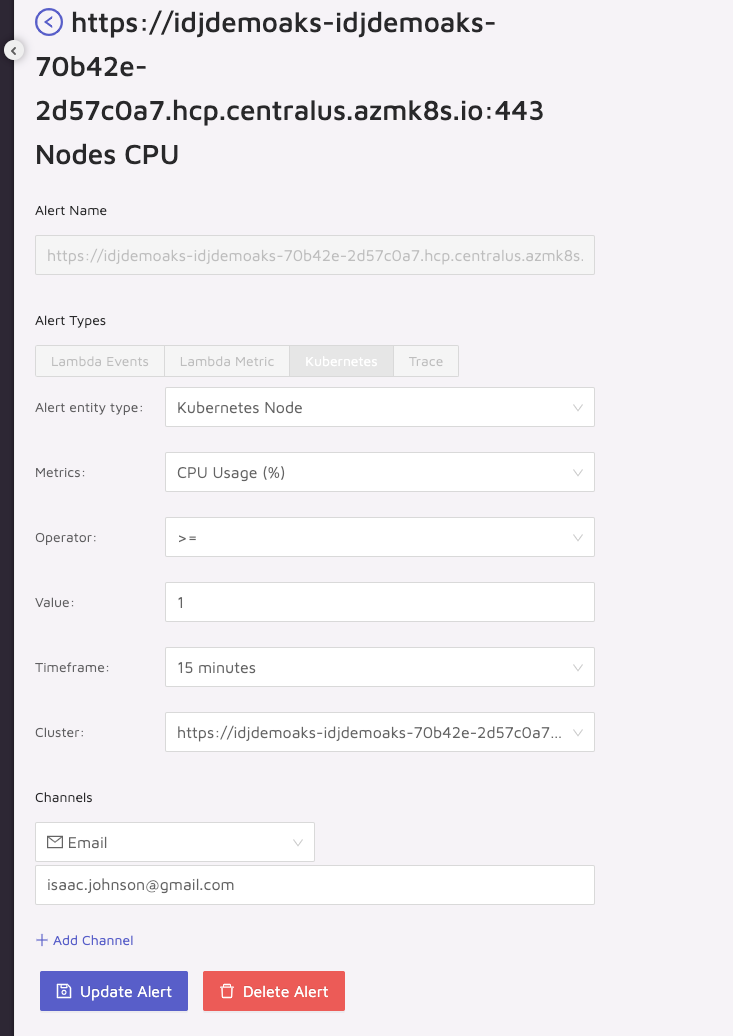
The email alert:
The slack alert:
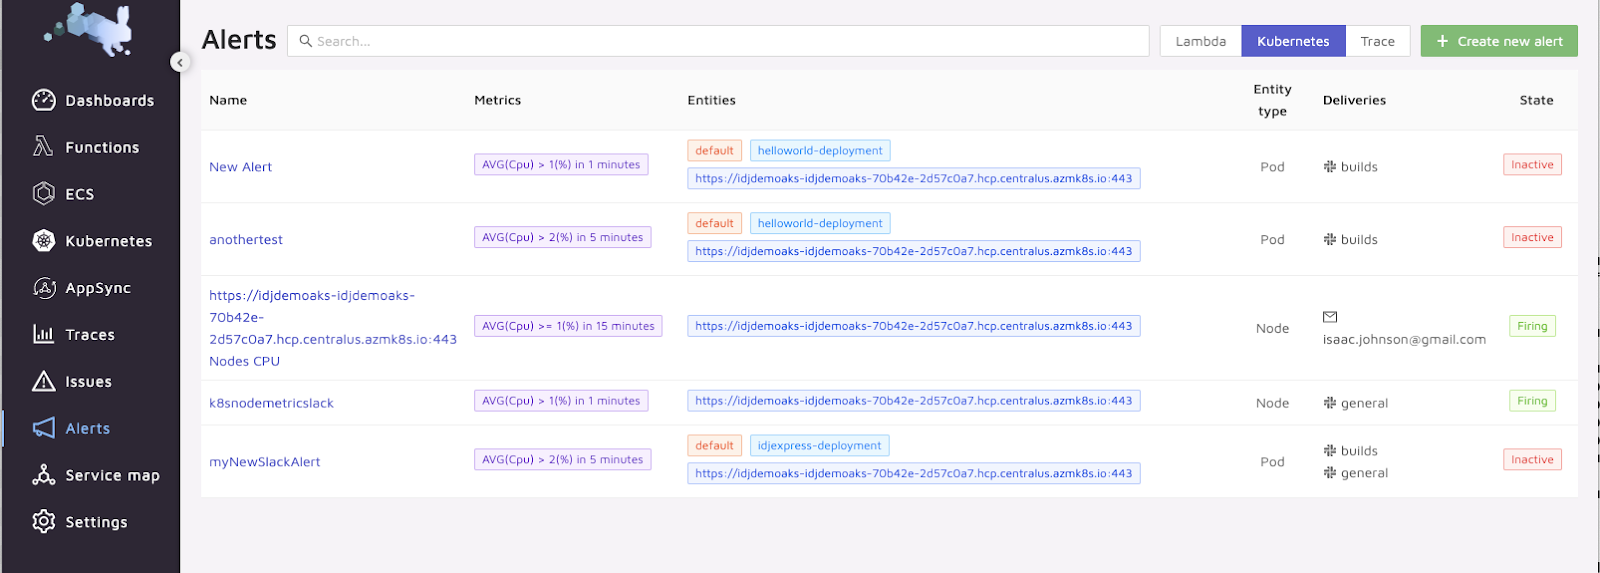
From alerts we can see which ones are firing:
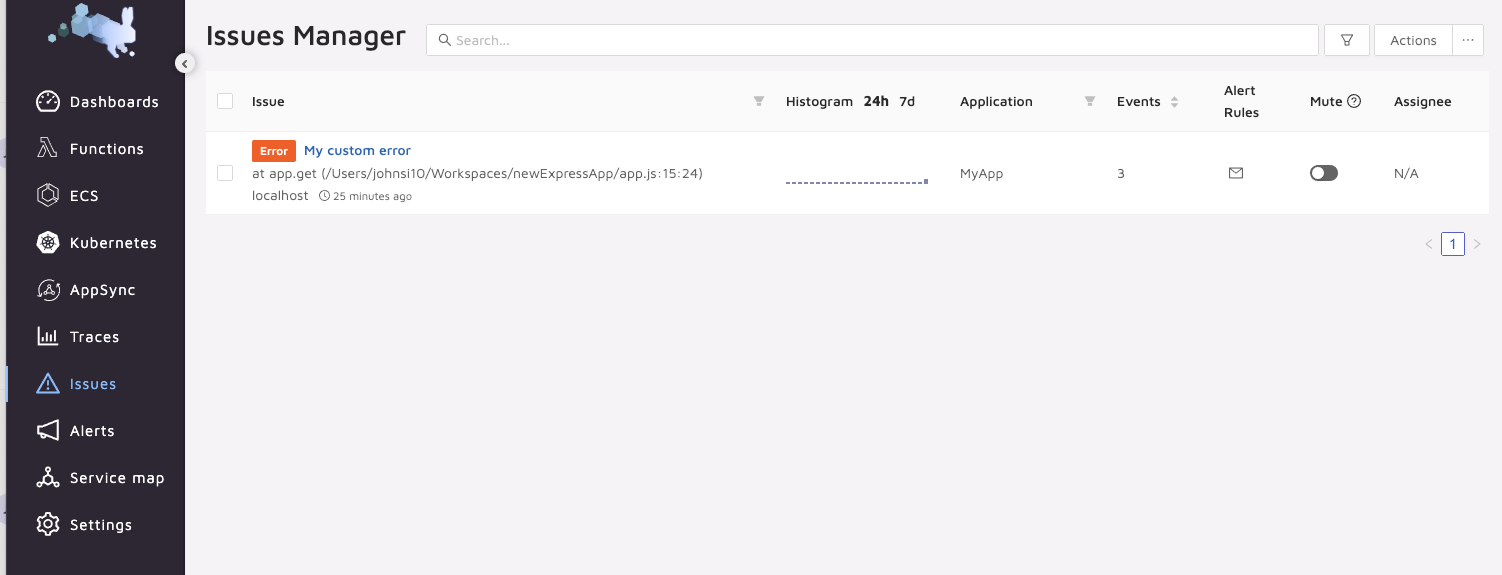
Now when we get errors, such as the “my custom error” we can see them aggregated on the Issues page.
Here we can such to mute them, perhaps they are more of a “warning” and we need not see them all the time.
Once the alerts are resolved, we can see that as well:
User Management
Adding users
We can invite by email:
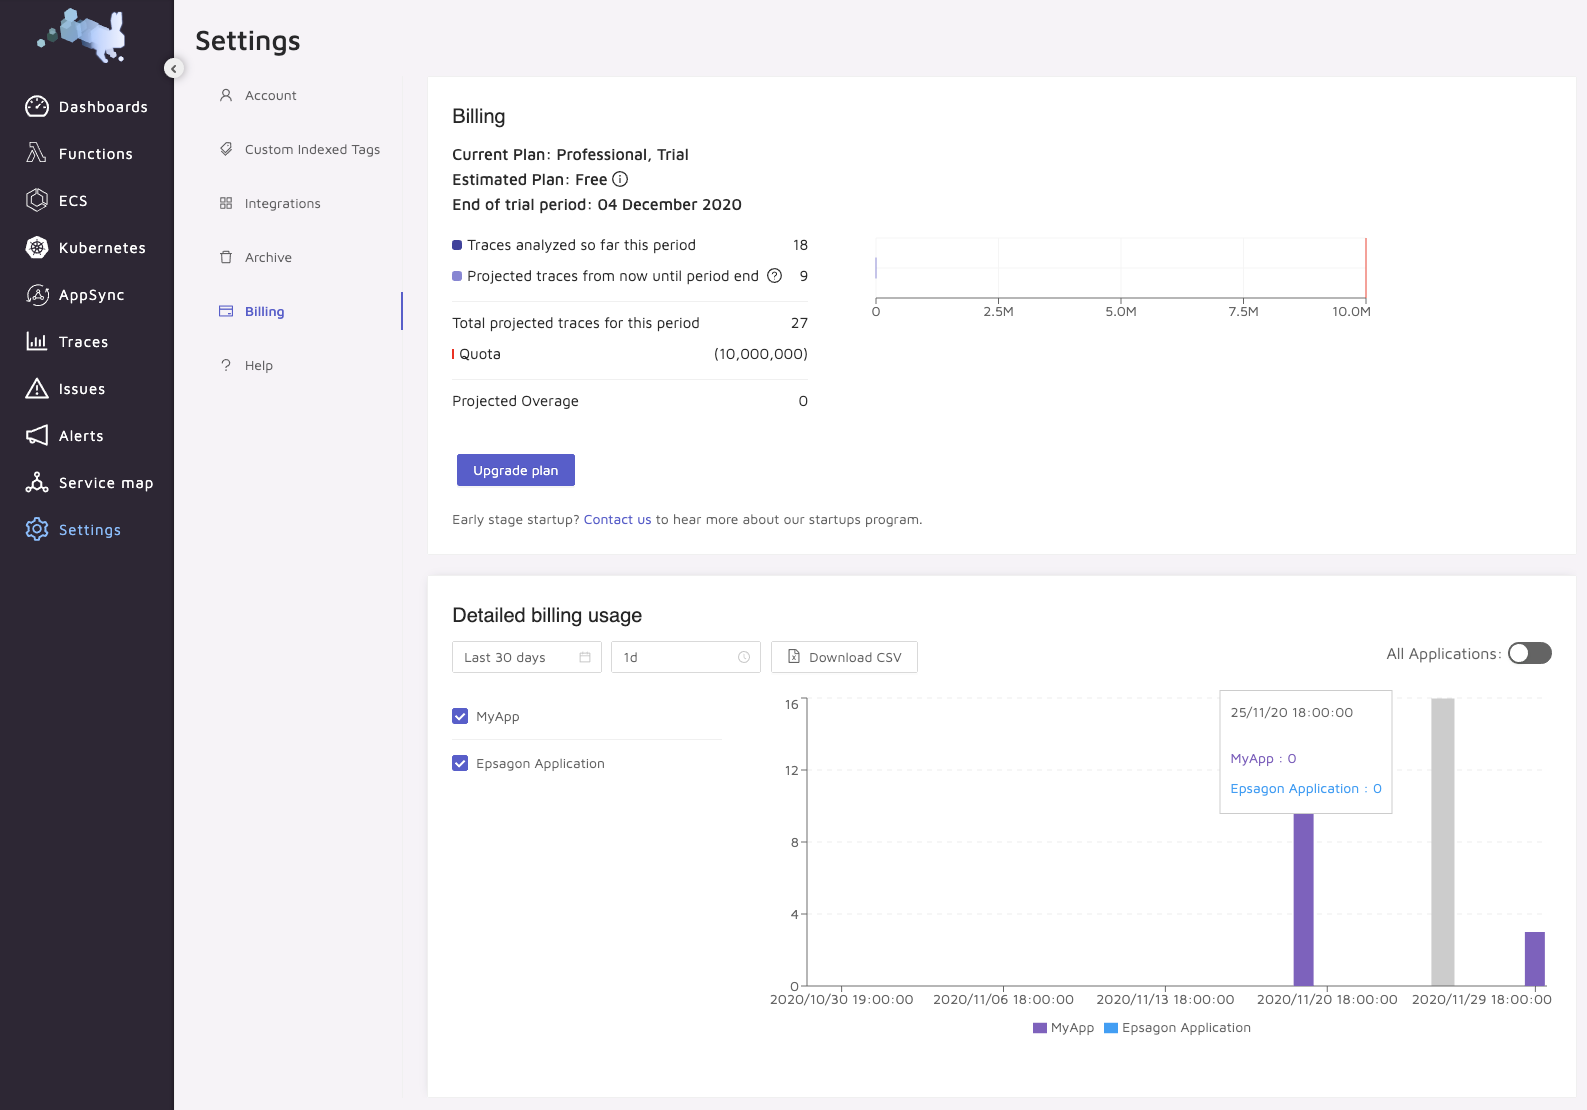
Pricing
Let’s dig into billing.
Of course we have been using a rather unlimited free trial following the sessions at KubeCon
The prices are listed for monthly:
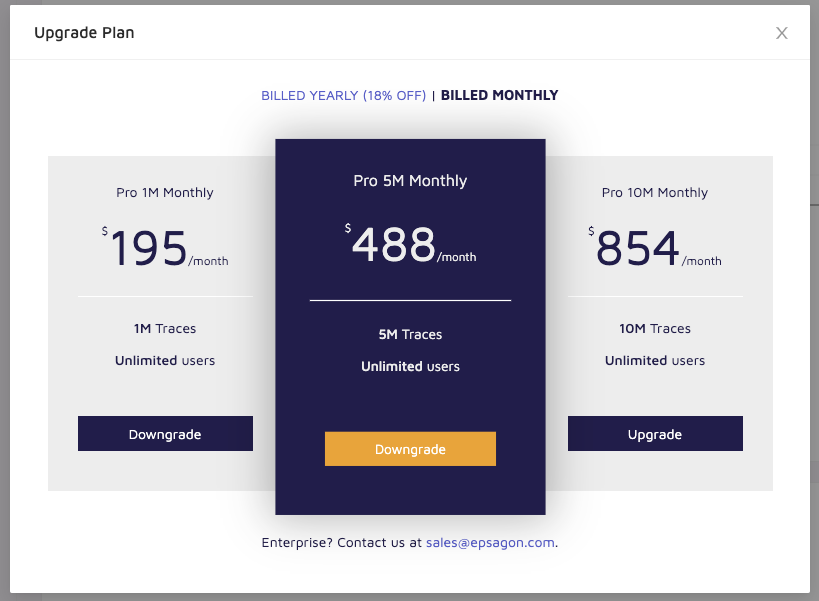
And pay up front annually:
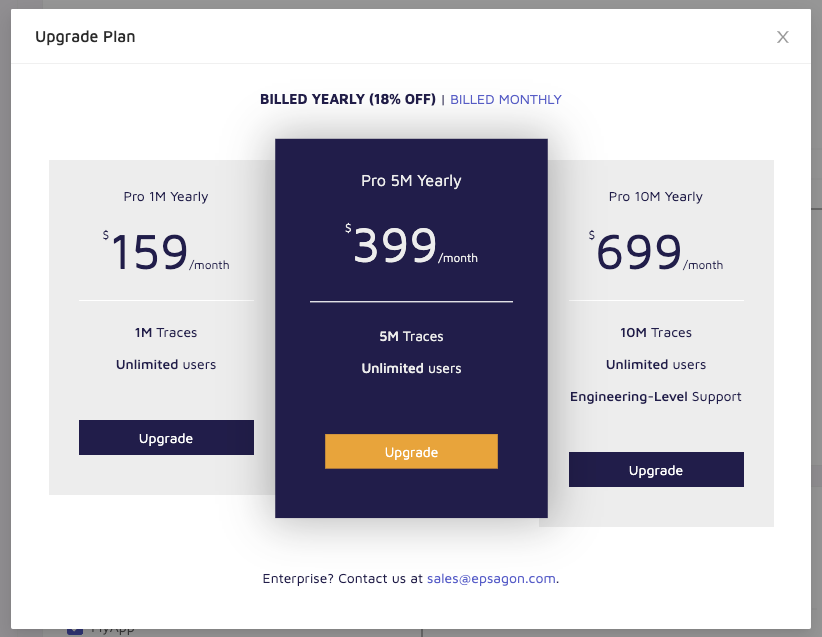
Here is where it can be hard to figure out. Clearly they are about APM thus pricing on traces, but then what about the general cluster observability. I must assume that’s free icing for traces.
Consider Datadog. Datadog is about APM as well as logs and monitoring. For Datadog we pay $31 per “host” per “month”.. We get up to 5 hosts free for logging. And Datadog includes 15-days of 1million spans with $1.27 per million beyond that (for 7d).
I think my struggle is the “simple” pricing on Epsagon actually makes me wary - what am I getting and for how long.
There is a very expansive 2 week demo as well as a free tier with 1k traces an month with metrics and alerting.
Remote Access
I wanted to circle back on that error when i went to onboard a private cluster:
Testing Epsagon connection to server https://192.168.1.74:6443...
  % Total % Received % Xferd Average Speed Time Time Time Current
                                 Dload Upload Total Spent Left Speed
100 1140 100 41 100 1099 1 37 0:00:41 0:00:29 0:00:12 8
Connection to Epsagon failed, please see: https://docs.epsagon.com/docs/environments-kubernetes
Something didn’t sit right about this. I looked at what was installed in the cluster presently monitored.
We have a cluster role “epsagon-prometheus”
$ kubectl get clusterrole epsagon-prometheus -o yaml
apiVersion: rbac.authorization.k8s.io/v1
kind: ClusterRole
metadata:
  annotations:
    kubectl.kubernetes.io/last-applied-configuration: |
      {"apiVersion":"rbac.authorization.k8s.io/v1beta1","kind":"ClusterRole","metadata":{"annotations":{},"name":"epsagon-prometheus"},"rules":[{"apiGroups":[""],"resources":["nodes","nodes/proxy","services","services/proxy","endpoints","pods","pods/proxy","pods/log","namespaces","configmaps"],"verbs":["get","list","watch"]},{"apiGroups":["extensions"],"resources":["ingresses"],"verbs":["get","list","watch"]},{"apiGroups":["extensions","apps"],"resources":["deployments"],"verbs":["get","list","watch"]},{"nonResourceURLs":["/metrics"],"verbs":["get"]}]}
  creationTimestamp: "2020-11-20T16:36:14Z"
  name: epsagon-prometheus
  resourceVersion: "3120"
  selfLink: /apis/rbac.authorization.k8s.io/v1/clusterroles/epsagon-prometheus
  uid: 76be1a97-db94-4f51-9f96-7307edf38092
rules:
- apiGroups:
  - ""
  resources:
  - nodes
  - nodes/proxy
  - services
  - services/proxy
  - endpoints
  - pods
  - pods/proxy
  - pods/log
  - namespaces
  - configmaps
  verbs:
  - get
  - list
  - watch
- apiGroups:
  - extensions
  resources:
  - ingresses
  verbs:
  - get
  - list
  - watch
- apiGroups:
  - extensions
  - apps
  resources:
  - deployments
  verbs:
  - get
  - list
  - watch
- nonResourceURLs:
  - /metrics
  verbs:
  - get
And that is bound to a service account:
$ kubectl get clusterrolebinding epsagon-prometheus -o yaml
apiVersion: rbac.authorization.k8s.io/v1
kind: ClusterRoleBinding
metadata:
  annotations:
    kubectl.kubernetes.io/last-applied-configuration: |
      {"apiVersion":"rbac.authorization.k8s.io/v1beta1","kind":"ClusterRoleBinding","metadata":{"annotations":{},"name":"epsagon-prometheus"},"roleRef":{"apiGroup":"rbac.authorization.k8s.io","kind":"ClusterRole","name":"epsagon-prometheus"},"subjects":[{"kind":"ServiceAccount","name":"epsagon-monitoring","namespace":"epsagon-monitoring"}]}
  creationTimestamp: "2020-11-20T16:36:14Z"
  name: epsagon-prometheus
  resourceVersion: "3121"
  selfLink: /apis/rbac.authorization.k8s.io/v1/clusterrolebindings/epsagon-prometheus
  uid: 68723641-70f4-4cc6-aa49-9f6cc75203db
roleRef:
  apiGroup: rbac.authorization.k8s.io
  kind: ClusterRole
  name: epsagon-prometheus
subjects:
- kind: ServiceAccount
  name: epsagon-monitoring
  namespace: epsagon-monitoring

$ kubectl get sa epsagon-monitoring -n epsagon-monitoring
NAME SECRETS AGE
epsagon-monitoring 1 11d
So what I think is happening is that they are polling my cluster externally - like a remote Kubernetes web viewer, as opposed to pushing out metrics.
This has the advantage of not having to capture and store customers’ logs and metrics. While this method means not having to consume bandwidth on data ingestion and storage costs, it does mean one has to expose publicly one’s cluster with the wide viewing permission on many things. For instance, that CRB includes the verb “get” on resource “pods/log”… what if I have PHI or PII in there.
Comparatively, DataDog can sanitize via the config and I believe Sumo could do it via the FluentD plugin.
Additionally I didn’t ask them to monitor my cluster. Installing the Epsagon Azure plugin was a oneliner for tracing. Datadog works the same for APM tracing. For Nodejs, in a similar fashion, we just import the ‘dd-trace’ tracer and set the requisite tags (see guide).
However, one accepts for cluster agents that run on clusters, there are some compute and storage impacts of said agent but at the benefit of tight control.
Summary
We only touched the surface on Epsagon and for a company that’s just two years old, they have a really solid offering. It’s still run by the foundersin Tel Aviv and recently secured $10m in financing back in July bringing their total to $30m in funding. In the states, they are based in New York and have between 50 and 100 developers.
This tells me it’s a startup that is young and hungry and often that means some great deals, but then one assumes some risk throwing all in on a suite that might be easily acquired by a competitor. Additionally, someone has to pay for free storage and without advertisements, they need to convert folks out of that free tier to mitigate their cash burn.
There is a full featured 14 day demo and as mentioned previously, a nice entry level free tier one can try out. The tech support is chat based and quite fast. Overall pretty friendly and helpful, though I ultimately solved my own problem setting it up (did not’ trigger the alert right in my express app).