Published: Jul 1, 2019 by Isaac Johnson
When we last left off we had our Digital Ocean k8s cluster spun with Terraform and Istio installed with helm. Our next steps will be to have automatic sidecar injection and create a new app with which to test.
Adding Istio
First, let’s add a step to implement sidecar injection with “kubectl label namespace default istio-injection=enabled”. What this does is automatically add sidecars, additional containers to each pod, to all pods in a namespace.
We can also output the namespaces that are enabled:
Creating a YAML pipeline for a NodeJS App:
We need to take a pause and create a build of a nodejs app. You’ve seen me gripe about YAML based builds in Azure Devops, but I can put on my big boy pants for a minute and walk you through how they work.
Head to https://github.com/do-community/nodejs-image-demo and fork the repo:
Once forked, the fork will be in one’s own namespace:
DockerHub account
DockerHub: https://hub.docker.com/
Create a Demo Repo in docker hub:
Creating a YAML based AzDO Build Pipeline
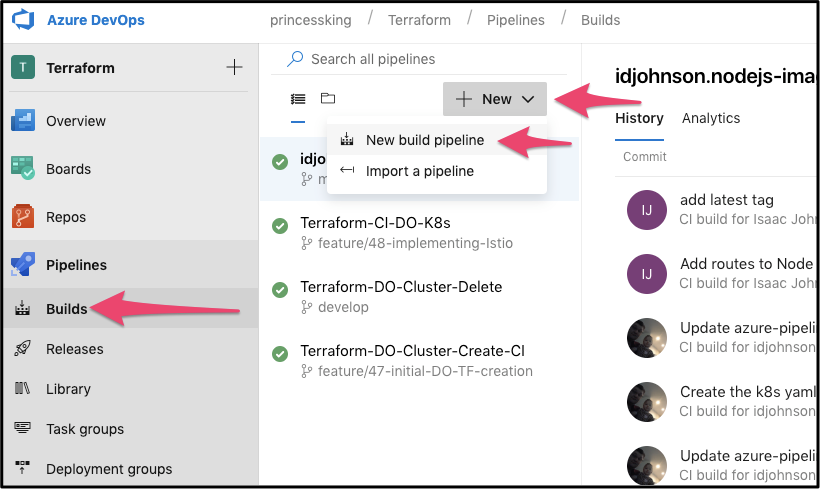
First start a new pipeline:
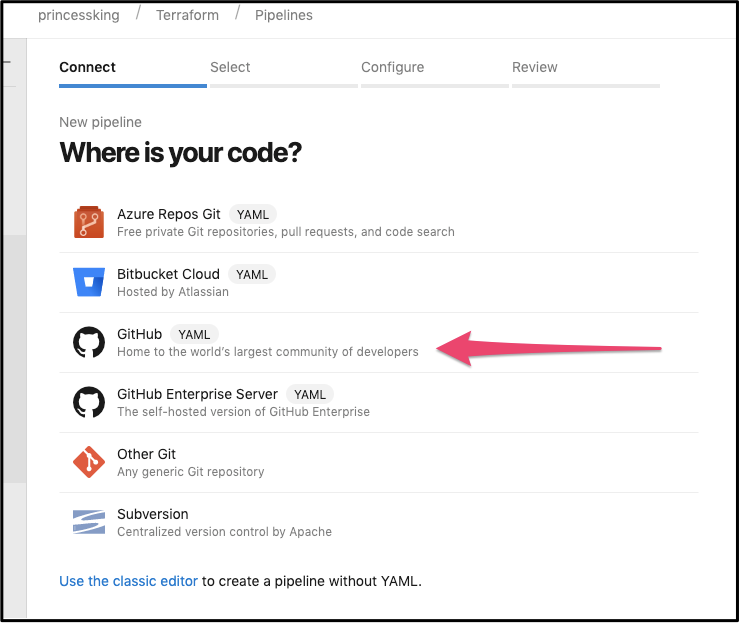
Next we will pick Github for our Repo (we will be choosing our fork):
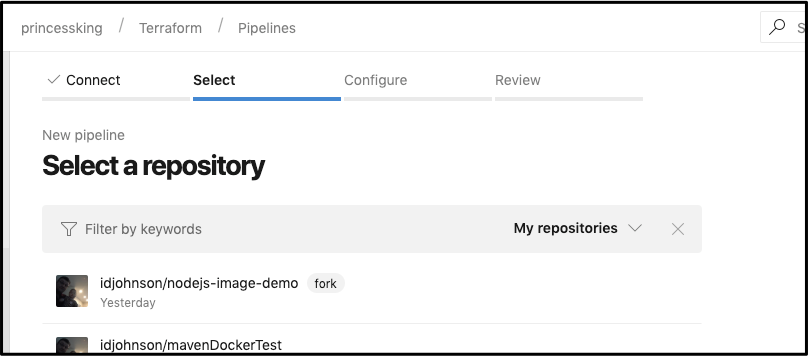
Then pick the forked NodeJS repo:
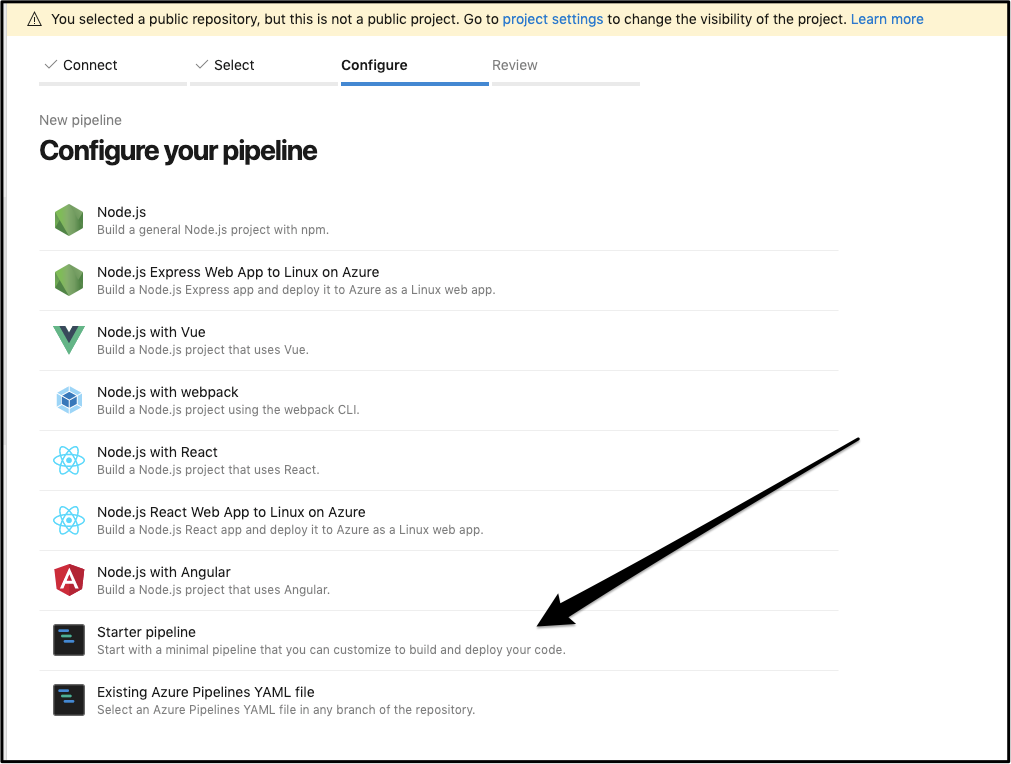
Lastly, we can pick Starter Pipeline for a basic helloworld one to modify:
Build Steps:
For the Docker build and push steps there are actually two perfectly good ways to do it. One is with a multi-line step and the other is with the plugin docker task with connection:
In the steps block you can either build and tag push manually:
steps:
- script: docker build -t idjohnson/node-demo .
 displayName: 'Docker Build'

- script: |
   echo $(docker-pass) | docker login -u $(docker-username) --password-stdin
   echo now tag
   docker tag idjohnson/node-demo idjohnson/idjdemo:$(Build.BuildId)
   docker tag idjohnson/node-demo idjohnson/idjdemo:$(Build.SourceVersion)
   docker tag idjohnson/node-demo idjohnson/idjdemo:latest
   docker push idjohnson/idjdemo
 displayName: 'Run a multi-line script'
Or use a Docker plugin and tag push that way:
- task: Docker@2
 inputs:
   containerRegistry: 'myDockerConnection'
   repository: 'idjohnson/idjdemo'
   command: 'buildAndPush'
   Dockerfile: '**/Dockerfile'
   tags: '$(Build.BuildId)-$(Build.SourceVersion)'
For now I’ll do the former.
We’ll need a docker-hub connection, so go to project settings and add a docker service connection:
AKV Variable Integration
Let’s also create some AKV secrets to use in a library step:
We’ll need to create the kubernetes yaml files at this point as well. We can do that from github itself.
apiVersion: v1
kind: Service
metadata:
  name: nodejs
  labels:
    app: nodejs
spec:
  selector:
    app: nodejs
  ports:
  - name: http
    port: 8080
---
apiVersion: apps/v1
kind: Deployment
metadata:
  name: nodejs
  labels:
    version: v1
spec:
  replicas: 1
  selector:
    matchLabels:
      app: nodejs
  template:
    metadata:
      labels:
        app: nodejs
        version: v1
    spec:
      containers:
      - name: nodejs
        image: idjohnson/idjdemo
        ports:
        - containerPort: 8080
Now we will need to include it in our build:
- task: CopyFiles@2
 inputs:
   SourceFolder: '$(Build.SourcesDirectory)'
   Contents: '**/*.yaml'
   TargetFolder: '$(Build.ArtifactStagingDirectory)'
   CleanTargetFolder: true
   OverWrite: true

- task: PublishBuildArtifacts@1
 inputs:
   PathtoPublish: '$(Build.ArtifactStagingDirectory)'
   ArtifactName: 'drop'
   publishLocation: 'Container'
We can test the job and see it zipped the yaml successfully:
This means the final CI job yaml (azure-pipelines.yml) should be this:
trigger:
- master

pool:
 vmImage: 'ubuntu-latest'

steps:
- script: docker build -t idjohnson/node-demo .
 displayName: 'Docker Build'

- script: |
   echo $(docker-pass) | docker login -u $(docker-username) --password-stdin
   echo now tag
   docker tag idjohnson/node-demo idjohnson/idjdemo:$(Build.BuildId)
   docker tag idjohnson/node-demo idjohnson/idjdemo:$(Build.SourceVersion)
   docker push idjohnson/idjdemo
 displayName: 'Run a multi-line script'

- task: CopyFiles@2
 inputs:
   SourceFolder: '$(Build.SourcesDirectory)'
   Contents: '**/*.yaml'
   TargetFolder: '$(Build.ArtifactStagingDirectory)'
   CleanTargetFolder: true
   OverWrite: true

- task: PublishBuildArtifacts@1
 inputs:
   PathtoPublish: '$(Build.ArtifactStagingDirectory)'
   ArtifactName: 'drop'
   publishLocation: 'Container'
Summary: At this point we should have a CI job that is triggered on commit to Github and builds our dockerfile. It then tags and pushes to Docker hub. Lastly it will copy and package the yaml file for our CD job which we will create next.
Let’s head back to our release job.
At this point it should look something like this:
_ Quick pro tip: say you want to experiment with some new logic in the pipeline but want to do it while saving your old stage in case you bungle it up. One way to do that is to clone a stage and disconnect it (set it to manual trigger). In my pipeline i’ll often have a few disconnected save points i can tie back in if i’m way off in some stage modifications._
Let’s go ahead and add a stage after our setup job (Launch a chart) which we modified to add Istio at the start of this post.
Then change the trigger step on the former helm stage (where we installed sonarqube) to come after our new Install Node App stage:
That should now have inserted the new stage in the release pipeline:
Go into the “Install Node App” stage and add a task to download build artifacts:
Next we are going to need to add the Istio Gateway and Virtual Service. We’ll do that from a local clone this time:
$ cat k8s-node-istio.yaml
apiVersion: networking.istio.io/v1alpha3
kind: Gateway
metadata:
  name: nodejs-gateway
spec:
  selector:
    istio: ingressgateway
  servers:
  - port:
      number: 80
      name: http
      protocol: HTTP
    hosts:
    - "*"
---
apiVersion: networking.istio.io/v1alpha3
kind: VirtualService
metadata:
  name: nodejs
spec:
  hosts:
  - "*"
  gateways:
  - nodejs-gateway
  http:
  - route:
    - destination:
        host: nodejs
We need to the same to route traffic to Grafana as well:
$ cat k8s-node-grafana.yaml
apiVersion: networking.istio.io/v1alpha3
kind: Gateway
metadata:
  name: grafana-gateway
  namespace: istio-system
spec:
  selector:
    istio: ingressgateway
  servers:
  - port:
      number: 15031
      name: http-grafana
      protocol: HTTP
    hosts:
    - "*"
---
apiVersion: networking.istio.io/v1alpha3
kind: VirtualService
metadata:
  name: grafana-vs
  namespace: istio-system
spec:
  hosts:
  - "*"
  gateways:
  - grafana-gateway
  http:
  - match:
    - port: 15031
    route:
    - destination:
        host: grafana
        port:
          number: 3000
We can then add and push them:
$ git add -A
$ git status
On branch master
Your branch is up to date with 'origin/master'.

Changes to be committed:
  (use "git reset HEAD <file>..." to unstage)

	new file: k8s-node-grafana.yaml
	new file: k8s-node-istio.yaml

$ git commit -m "Add routes to Node App and Grafana"
[master 9a0be8a] Add routes to Node App and Grafana
 2 files changed, 62 insertions(+)
 create mode 100644 k8s-node-grafana.yaml
 create mode 100644 k8s-node-istio.yaml

$ git push
Username for 'https://github.com': idjohnson
Password for 'https://idjohnson@github.com':
Enumerating objects: 5, done.
Counting objects: 100% (5/5), done.
Delta compression using up to 4 threads
Compressing objects: 100% (4/4), done.
Writing objects: 100% (4/4), 714 bytes | 714.00 KiB/s, done.
Total 4 (delta 2), reused 0 (delta 0)
remote: Resolving deltas: 100% (2/2), completed with 1 local object.
To https://github.com/idjohnson/nodejs-image-demo.git
   4f31a67..9a0be8a master -> master
And after a triggered build, they should exist in the drop zip:
Back in our release pipeline, we can make sure to set the node install stage to use Ubuntu (though technically this isn’t required, i tend to do my debug with find commands):
Then we need to add a Download Build Artifacts step:
Followed by kubectl apply steps to apply the yaml files we’ve now included:
(e.g. kubectl apply -f $(System.ArtifactsDirectory)/drop/k8s-node-app.yaml –kubeconfig=./_Terraform-CI-DO-K8s/drop/config )
The last step is so we can see the Load Balancers created:
The pipeline requires a bit of cajoling. I found istio and istio system at times had timeout issues. But it did run.
We can see from the logs the istio load balancer..
We can then load Grafana on that URL:
We can also get the istio ingress from the commandline. Downloading the config and storing it in ~/.kube/config
 kubectl get -n istio-system svc
NAME TYPE CLUSTER-IP EXTERNAL-IP PORT(S) AGE
grafana ClusterIP 10.245.246.143 <none> 3000/TCP 114m
istio-citadel ClusterIP 10.245.165.164 <none> 8060/TCP,15014/TCP 114m
istio-galley ClusterIP 10.245.141.249 <none> 443/TCP,15014/TCP,9901/TCP 114m
istio-ingressgateway LoadBalancer 10.245.119.155 165.227.252.224 15020:32495/TCP,80:31380/TCP,443:31390/TCP,31400:31400/TCP,15029:30544/TCP,15030:30358/TCP,15031:32004/TCP,15032:30282/TCP,15443:30951/TCP 114m
istio-pilot ClusterIP 10.245.13.209 <none> 15010/TCP,15011/TCP,8080/TCP,15014/TCP 114m
istio-policy ClusterIP 10.245.146.40 <none> 9091/TCP,15004/TCP,15014/TCP 114m
istio-sidecar-injector ClusterIP 10.245.16.3 <none> 443/TCP 114m
istio-telemetry ClusterIP 10.245.230.226 <none> 9091/TCP,15004/TCP,15014/TCP,42422/TCP 114m
prometheus ClusterIP 10.245.118.208 <none> 9090/TCP
We can also go to port 15031 for Grafana and go to Home/Istio for istio provided metrics:
Istio adds prometheus sidecars and envoy proxies for TLS encrypted routing, but it doesnt’t fundamentally change the underlying container. The NodeJS app we launched is still there in the pod serving traffic.
We can also access the pod outside of issue by routing to the port nodejs is serving on via kubectl port-forward (first i checked what port the nodejs app was serving - was assuming 80 or 8080):
$ kubectl describe pod nodejs-6b6ccc945f-v6kp8 8080
Name: nodejs-6b6ccc945f-v6kp8
Namespace: default
Priority: 0
PriorityClassName: <none>
….
Containers:
  nodejs:
    Container ID: docker://08f443ed63964b69ec837c29ffe0b0d1c15ee1b5e720c8ce4979d4d980484f22
    Image: idjohnson/idjdemo
    Image ID: docker-pullable://idjohnson/idjdemo@sha256:d1ab6f034cbcb942feea9326d112f967936a02ed6de73792a3c792d52f8e52fa
    Port: 8080/TCP
    Host Port: 0/TCP
...


$ kubectl port-forward nodejs-6b6ccc945f-v6kp8 8080
Forwarding from 127.0.0.1:8080 -> 8080
Forwarding from [::1]:8080 -> 8080
Handling connection for 8080
Handling connection for 8080
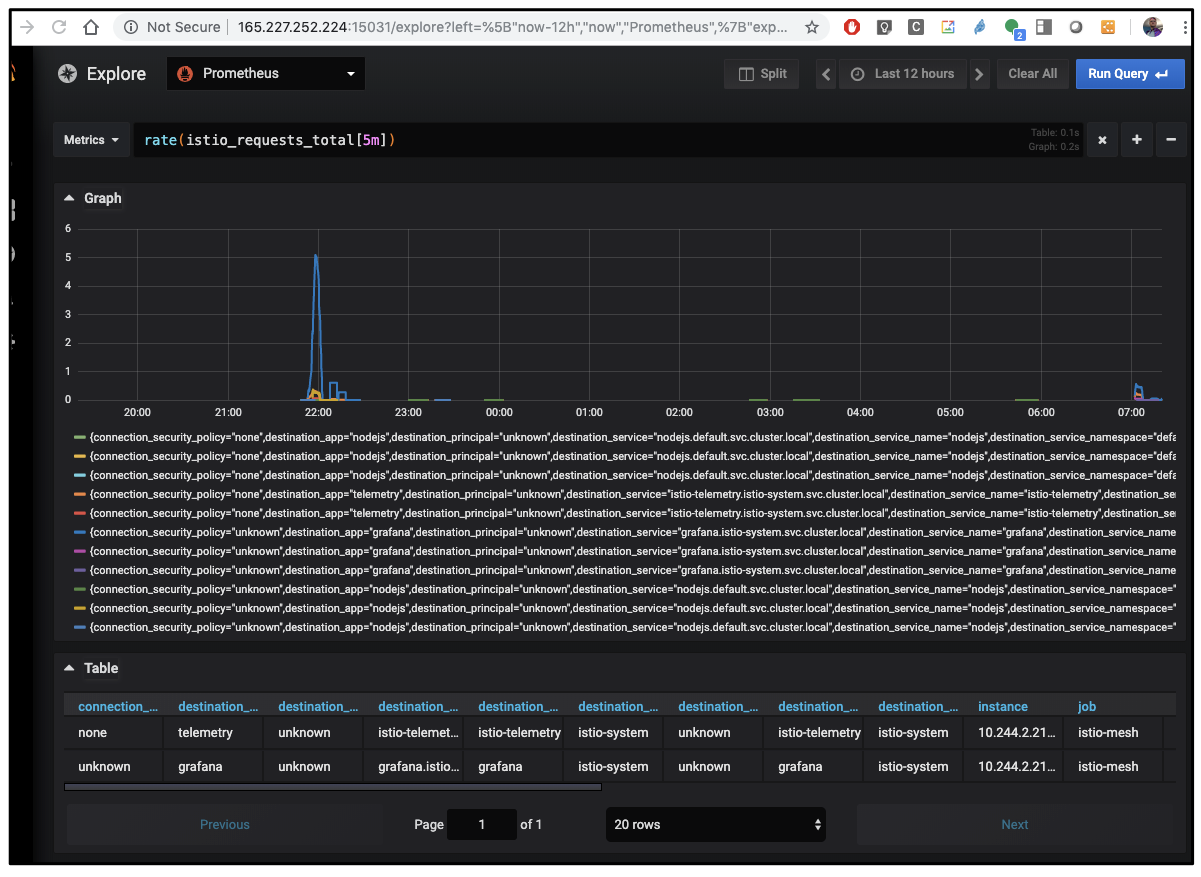
I also left it on for a while so we could see metrics over time. Here we can see the total istio requests by endpoint. It lines up for when i was working on this last night till 11p and again when i came online at 7a.
We can also see what ports are being routed by the istio-ingressgateway from the commandline:
$ kubectl get svc -n istio-system
NAME TYPE CLUSTER-IP EXTERNAL-IP PORT(S) AGE
grafana ClusterIP 10.245.246.143 <none> 3000/TCP 12h
istio-citadel ClusterIP 10.245.165.164 <none> 8060/TCP,15014/TCP 12h
istio-galley ClusterIP 10.245.141.249 <none> 443/TCP,15014/TCP,9901/TCP 12h
istio-ingressgateway LoadBalancer 10.245.119.155 165.227.252.224 15020:32495/TCP,80:31380/TCP,443:31390/TCP,31400:31400/TCP,15029:30544/TCP,15030:30358/TCP,15031:32004/TCP,15032:30282/TCP,15443:30951/TCP 12h
istio-pilot ClusterIP 10.245.13.209 <none> 15010/TCP,15011/TCP,8080/TCP,15014/TCP 12h
istio-policy ClusterIP 10.245.146.40 <none> 9091/TCP,15004/TCP,15014/TCP 12h
istio-sidecar-injector ClusterIP 10.245.16.3 <none> 443/TCP 12h
istio-telemetry ClusterIP 10.245.230.226 <none> 9091/TCP,15004/TCP,15014/TCP,42422/TCP 12h
prometheus ClusterIP 10.245.118.208 <none> 9090/TCP 12h
Summary:
We expanded on our DO k8s creation pipeline to add Istio on the fly. It now adds Istio with envoy proxy and grafana enabled. We used a sample NodeJS App (facts about sharks) to show how we route traffic and lastly we examined some of the metrics we could pull from Grafana.
A lot of this guide was an expansion on DigitalOceans own Istio Guide of which I tied into Azure DevOps and added more examples. Learn more on Istio Gateway from some good blogs like this Jayway Entry and the Istio Reference Documentation.
Also, you can get a sizable credit signing up for DigitalOcean with this link which is why i add it to the notes.


