Published: Mar 31, 2019 by Isaac Johnson
In our last post, we tackled Auto-Scaling AKS clusters which adjusts the size of our clusters based on load. However, we have yet to address monitoring. How can we monitor our clusters using both built-in Azure options, Kubernetes tooling and the Elastic-stack (EFK/ELK)?
First, let’s spin a fresh cluster up.
C:\Users\isaac>az login
Note, we have launched a browser for you to login. For old experience with device code, use "az login --use-device-code"
You have logged in. Now let us find all the subscriptions to which you have access...
[
  {
    "cloudName": "AzureCloud",
    "id": "abcdabcd-1234-1234-1234-abcdabcdab",
    "isDefault": true,
    "name": "Pay-As-You-Go",
    "state": "Enabled",
    "tenantId": "98769876-abcd-abcd-abcd-9876543210",
    "user": {
      "name": "isaac.johnson@cdc.com",
      "type": "user"
    }
  }
]

C:\Users\isaac>az group create --location eastus --name idj-aks-monitoring
{
  "id": "/subscriptions/abcdabcd-1234-1234-1234-abcdabcdab/resourceGroups/idj-aks-monitoring",
  "location": "eastus",
  "managedBy": null,
  "name": "idj-aks-monitoring",
  "properties": {
    "provisioningState": "Succeeded"
  },
  "tags": null
}

C:\Users\isaac>az aks create --resource-group idj-aks-monitoring --name idj-aks-monitoring-aks1 --kubernetes-version 1.12.6 --node-count 1 --enable-vmss --enable-cluster-autoscaler --min-count 1 --max-count 3 --generate-ssh-keys
NOTE : Don’t forget our quick-tip from before - if your az CLI is out of date, or doesn’t have preview features, you’ll get an error like this:
az: error: unrecognized arguments: --enable-vmss --enable-cluster-autoscaler --min-count 1 --max-count 3
usage: az [-h] [--verbose] [--debug] [--output {json,jsonc,table,tsv,yaml}]
          [--query JMESPATH]
          {aks} ...
          ```
Follow this guide (https://docs.microsoft.com/en-us/cli/azure/install-azure-cli?view=azure-cli-latest) to update to the latest. Then you can install the preview extensions:
az extension add --name aks-preview
The installed extension 'aks-preview' is in preview.
C:\Users\isaac>az aks create --resource-group idj-aks-monitoring --name idj-aks-monitoring-aks1 --kubernetes-version 1.12.6 --node-count 1 --enable-vmss --enable-cluster-autoscaler --min-count 1 --max-count 3 --generate-ssh-keys
The behavior of this command has been altered by the following extension: aks-preview
SSH key files 'C:\Users\isaac\.ssh\id_rsa' and 'C:\Users\isaac\.ssh\id_rsa.pub' have been generated under ~/.ssh to allow SSH access to the VM. If using machines without permanent storage like Azure Cloud Shell without an attached file share, back up your keys to a safe location
[K{- Finished ..principal creation[##################################] 100.0000%
  "aadProfile": null,
  "addonProfiles": null,
  "agentPoolProfiles": [
    {
      "availabilityZones": null,
      "count": 1,
      "enableAutoScaling": true,
      "maxCount": 3,
      "maxPods": 110,
      "minCount": 1,
      "name": "nodepool1",
      "orchestratorVersion": "1.12.6",
      "osDiskSizeGb": 100,
      "osType": "Linux",
      "provisioningState": "Succeeded",
      "type": "VirtualMachineScaleSets",
      "vmSize": "Standard_DS2_v2",
      "vnetSubnetId": null
    }
  ],
  "apiServerAuthorizedIpRanges": null,
  "dnsPrefix": "idj-aks-mo-idj-aks-monitori-d955c0",
  "enablePodSecurityPolicy": null,
  "enableRbac": true,
  "fqdn": "idj-aks-mo-idj-aks-monitori-d955c0-9f8a4d5e.hcp.eastus.azmk8s.io",
  "id": "/subscriptions/abcdabcd-1234-1234-1234-abcdabcdab/resourcegroups/idj-aks-monitoring/providers/Microsoft.ContainerService/managedClusters/idj-aks-monitoring-aks1",
  "kubernetesVersion": "1.12.6",
  "linuxProfile": {
    "adminUsername": "azureuser",
    "ssh": {
      "publicKeys": [
        {
          "keyData": "ssh-rsa AAAAB3NzaC1yc2EAAAADAQABAAABAQCpH3x4Tbjgr4DMtjO8jkq7p0EzDUCWM8doYoOgl/fedVHzQD/zSeVSxK6OlvcgtOck3IcS/Cvfm2RTtDGjYUhZej5wqrzfD4dyPIgRMo9lfNmmP68jwPT4faAUFSboFVr0xdXJhNME1cPzfsbQy0an5tkO0X8/7nF72JnlSsvAGArdfOTu8u/cUk3e0Ww/rNViNjUaS4WoDlh1BIyLysMJZfHNvu8U0kheals8PTaUymxxQkEAT1euoJuFAbvOJcZbpC/MOFY9WKFcVHExv/+YpK1iVEm31fjouNLoeI+oWAYp6h6zVzCJl9rCTZgTzIzbEF21qtuPIwSpE5fTram/"
        }
      ]
    }
  },
  "location": "eastus",
  "name": "idj-aks-monitoring-aks1",
  "networkProfile": {
    "dnsServiceIp": "10.0.0.10",
    "dockerBridgeCidr": "172.17.0.1/16",
    "networkPlugin": "kubenet",
    "networkPolicy": null,
    "podCidr": "10.244.0.0/16",
    "serviceCidr": "10.0.0.0/16"
  },
  "nodeResourceGroup": "MC_idj-aks-monitoring_idj-aks-monitoring-aks1_eastus",
  "provisioningState": "Succeeded",
  "resourceGroup": "idj-aks-monitoring",
  "servicePrincipalProfile": {
    "clientId": "f569cd83-e3a5-4d06-9d2d-28f1d4926c36",
    "secret": null
  },
  "tags": null,
  "type": "Microsoft.ContainerService/ManagedClusters"
}
Kubernetes Dashboard:
Because we use auto-scaling with RBAC, let’s do as we did in our last post and create the RBAC user then launch the dashboard:
C:\Users\isaac>az aks install-cli
Downloading client to "C:\Users\isaac\.azure-kubectl\kubectl.exe" from "https://storage.googleapis.com/kubernetes-releas
e/release/v1.14.0/bin/windows/amd64/kubectl.exe"
Please add "C:\Users\isaac\.azure-kubectl" to your search PATH so the `kubectl.exe` can be found. 2 options:
    1. Run "set PATH=%PATH%;C:\Users\isaac\.azure-kubectl" or "$env:path += 'C:\Users\isaac\.azure-kubectl'" for PowerSh
ell. This is good for the current command session.
    2. Update system PATH environment variable by following "Control Panel->System->Advanced->Environment Variables", an
d re-open the command window. You only need to do it once

C:\Users\isaac>set PATH=%PATH%;C:\Users\isaac\.azure-kubectl

C:\Users\isaac>vim dashboard-rbac.yaml

C:\Users\isaac>type dashboard-rbac.yaml
apiVersion: v1
kind: ServiceAccount
metadata:
  name: aks-dashboard-admin
  namespace: kube-system
---
apiVersion: rbac.authorization.k8s.io/v1
kind: ClusterRoleBinding
metadata:
  name: aks-dashboard-admin
roleRef:
  apiGroup: rbac.authorization.k8s.io
  kind: ClusterRole
  name: cluster-admin
subjects:
- kind: ServiceAccount
  name: aks-dashboard-admin
  namespace: kube-system
_ Pro-tip: if you ever get errors about localhost:8080, it likely means your kube config is missing our out of date (i find this happens more often then i like on Windows). Remove the config in your %USER_HOME%.kube (or ~/.kube on linux/mac) and re-login._
C:\Users\isaac>az aks get-credentials --resource-group idj-aks-monitoring --name idj-aks-monitoring-aks1
Merged "idj-aks-monitoring-aks1" as current context in C:\Users\isaac\.kube\config

C:\Users\isaac>kubectl apply -f dashboard-rbac.yaml
serviceaccount/aks-dashboard-admin created
clusterrolebinding.rbac.authorization.k8s.io/aks-dashboard-admin created

C:\Users\isaac>kubectl create clusterrolebinding kubernetes-dashboard -n kube-system --clusterrole=cluster-admin --serviceaccount=kube-system:kubernetes-dashboard
clusterrolebinding.rbac.authorization.k8s.io/kubernetes-dashboard created

C:\Users\isaac>kubectl get serviceaccount kubernetes-dashboard -n kube-system -o jsonpath="{.secrets[0].name}"
kubernetes-dashboard-token-92j6f


C:\Users\isaac>kubectl get secret kubernetes-dashboard-token-92j6f -n kube-system -o jsonpath="{.data.token}" > b64.enc

C:\Users\isaac>certutil -decode b64.enc b64.dec
Input Length = 1660
Output Length = 1245
CertUtil: -decode command completed successfully.

C:\Users\isaac>type b64.dec
eyJhbGciOiJSUzI1NiIsImtpZCI6IiJ9.eyJpc3MiOiJrdWJlcm5ldGVzL3NlcnZpY2VhY2NvdW50Iiwia3ViZXJuZXRlcy5pby9zZXJ2aWNlYWNjb3VudC9uYW1lc3BhY2UiOiJrdWJlLXN5c3RlbSIsImt1....
Now we should be able to login:
C:\Users\isaac>az aks browse --resource-group idj-aks-monitoring --name idj-aks-monitoring-aks1
Merged "idj-aks-monitoring-aks1" as current context in C:\Users\isaac\AppData\Local\Temp\tmpdblr4pab
Proxy running on http://127.0.0.1:8001/
Press CTRL+C to close the tunnel…

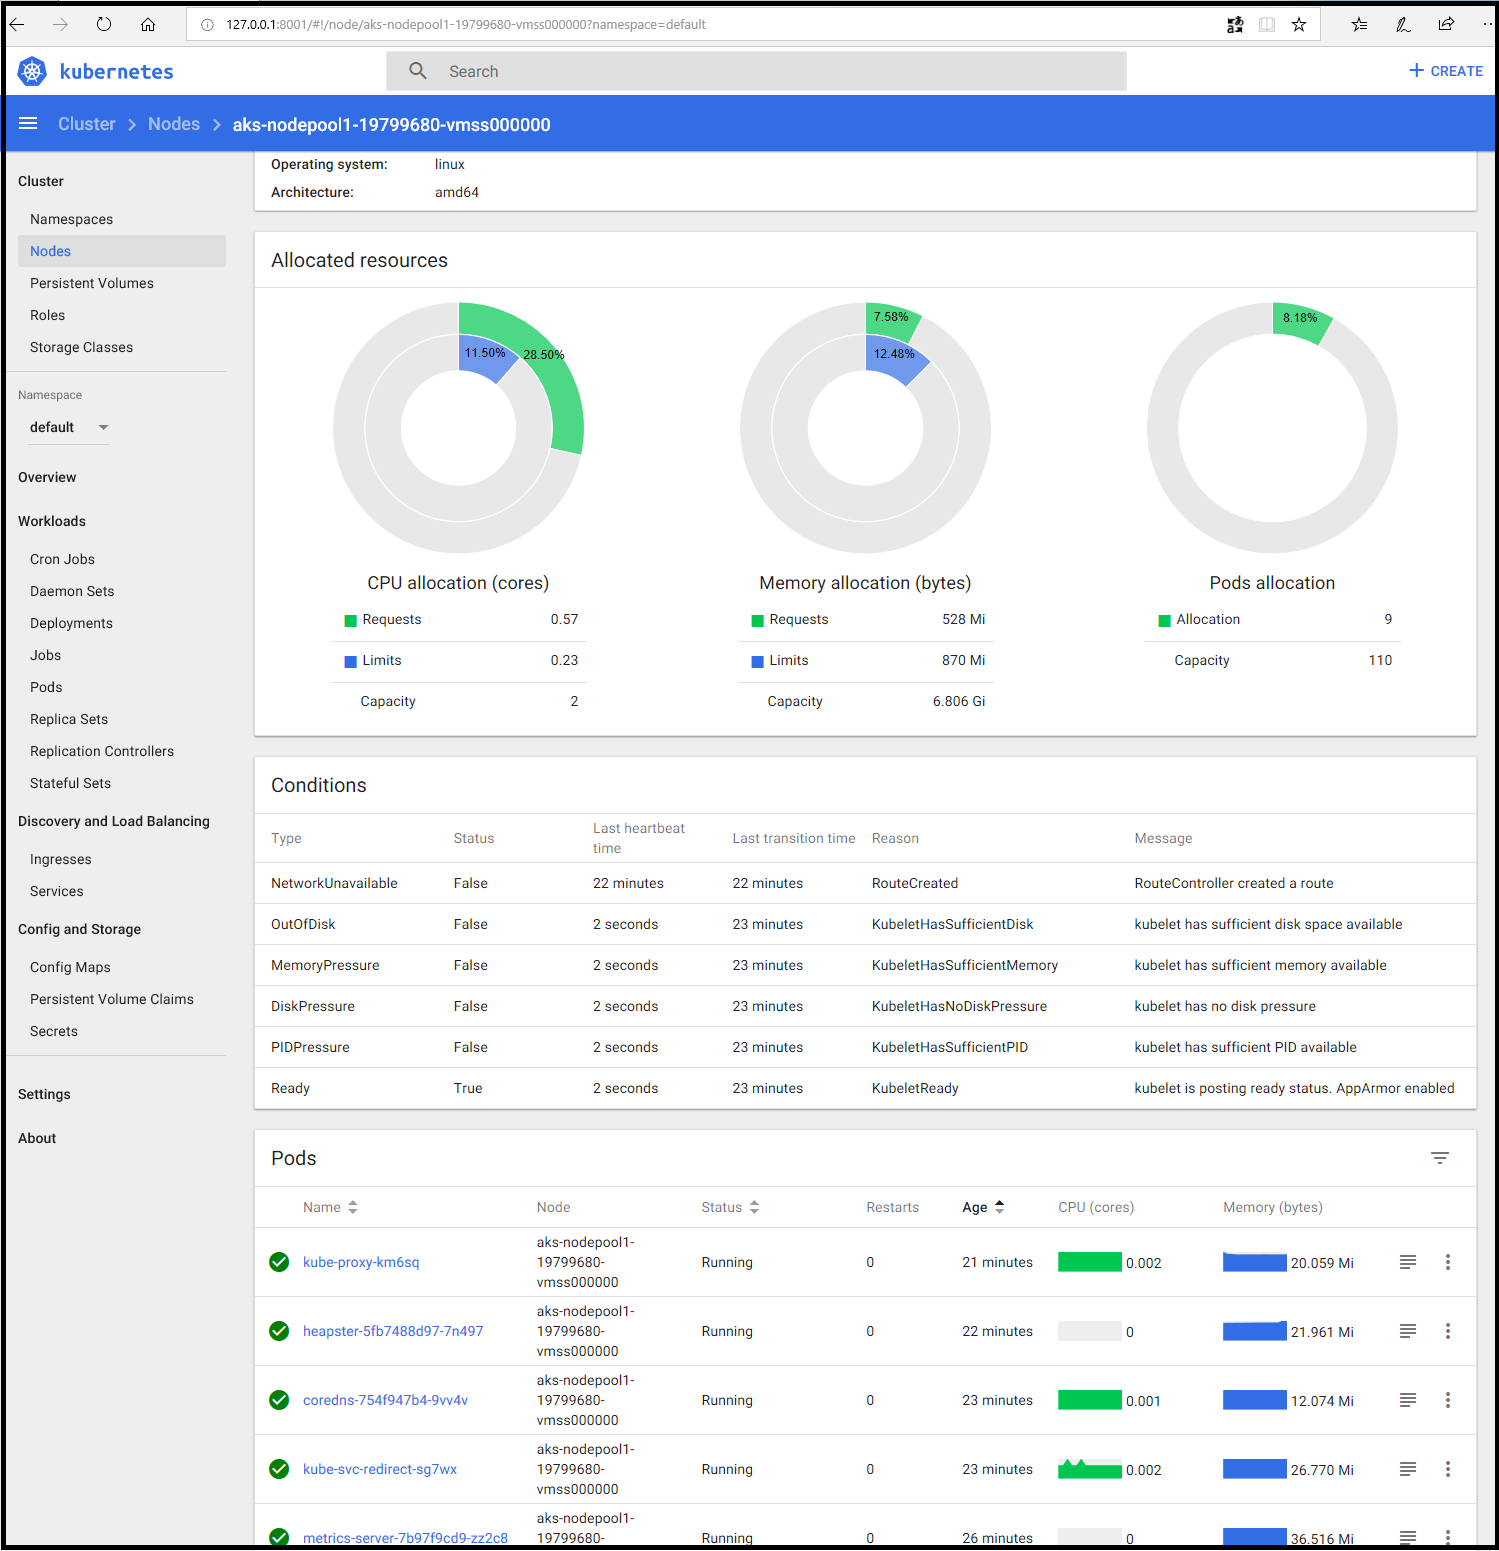
This can show us quite a lot of useful information. Click on a node for details that show utilization:
http://127.0.0.1:8001/#!/node/aks-nodepool1-19799680-vmss000000?namespace=default
Azure Monitor
However, we may wish to collect more details or examine our cluster with a powerful query engine. For those use cases, we can use Azure Monitor.
First, let’s install Helm and a guestbook chart to exercise the cluster (as you’ve surely bored of spinning Sonarqube by now).
If don’t have Helm, you can install it (get from here: https://github.com/helm/helm/releases). With helm installed, we can validate the existence of tiller (if following this guide, we haven’t installed it yet) and install it if needed.
C:\Users\isaac>D:\helm-v2.13.1-windows-amd64\windows-amd64\helm.exe version
Client: &version.Version{SemVer:"v2.13.1", GitCommit:"618447cbf203d147601b4b9bd7f8c37a5d39fbb4", GitTreeState:"clean"}
Error: could not find tiller
Installing tiller:
C:\Users\isaac>D:\helm-v2.13.1-windows-amd64\windows-amd64\helm.exe version
Client: &version.Version{SemVer:"v2.13.1", GitCommit:"618447cbf203d147601b4b9bd7f8c37a5d39fbb4", GitTreeState:"clean"}
Error: could not find tiller

C:\Users\isaac>D:\helm-v2.13.1-windows-amd64\windows-amd64\helm.exe init --service-account tiller --upgrade
Creating C:\Users\isaac\.helm
Creating C:\Users\isaac\.helm\repository
Creating C:\Users\isaac\.helm\repository\cache
Creating C:\Users\isaac\.helm\repository\local
Creating C:\Users\isaac\.helm\plugins
Creating C:\Users\isaac\.helm\starters
Creating C:\Users\isaac\.helm\cache\archive
Creating C:\Users\isaac\.helm\repository\repositories.yaml
Adding stable repo with URL: https://kubernetes-charts.storage.googleapis.com
Adding local repo with URL: http://127.0.0.1:8879/charts
$HELM_HOME has been configured at C:\Users\isaac\.helm.

Tiller (the Helm server-side component) has been installed into your Kubernetes Cluster.

Please note: by default, Tiller is deployed with an insecure 'allow unauthenticated users' policy.
To prevent this, run `helm init` with the --tiller-tls-verify flag.
For more information on securing your installation see: https://docs.helm.sh/using_helm/#securing-your-helm-installation
Happy Helming!
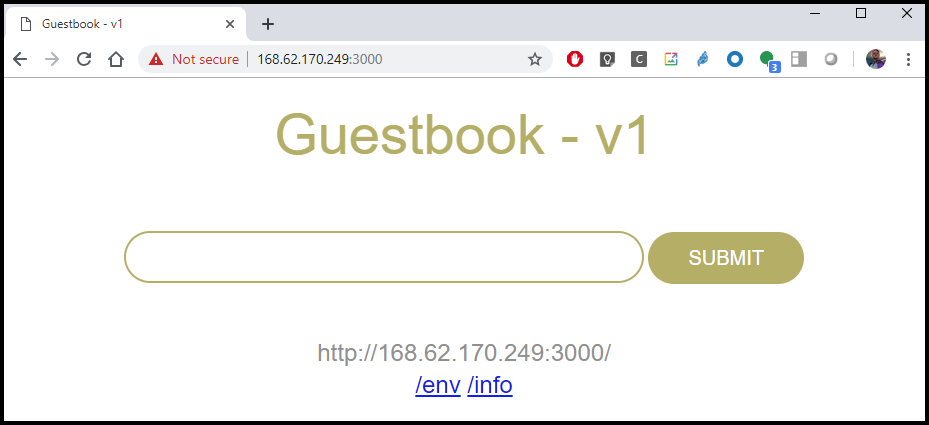
Now let’s install a nice little guestbook application:
C:\Users\isaac>helm repo add ibm-repo https://ibm.github.io/helm101/
"ibm-repo" has been added to your repositories

C:\Users\isaac>helm install ibm-repo/guestbook
NAME: mothy-goat
LAST DEPLOYED: Sun Mar 31 13:50:21 2019
NAMESPACE: default
STATUS: DEPLOYED

RESOURCES:
==> v1/Deployment
NAME READY UP-TO-DATE AVAILABLE AGE
mothy-goat-guestbook 0/2 2 0 0s
redis-master 0/1 1 0 0s
redis-slave 0/2 2 0 0s

==> v1/Pod(related)
NAME READY STATUS RESTARTS AGE
mothy-goat-guestbook-55f5477896-2l298 0/1 ContainerCreating 0 0s
mothy-goat-guestbook-55f5477896-gd6kv 0/1 ContainerCreating 0 0s
redis-master-7b5cc58fc8-jvmcd 0/1 ContainerCreating 0 0s
redis-slave-5db5dcfdfd-zsdc6 0/1 ContainerCreating 0 0s
redis-slave-5db5dcfdfd-zv57p 0/1 ContainerCreating 0 0s

==> v1/Service
NAME TYPE CLUSTER-IP EXTERNAL-IP PORT(S) AGE
mothy-goat-guestbook LoadBalancer 10.0.2.255 <pending> 3000:32722/TCP 0s
redis-master ClusterIP 10.0.228.84 <none> 6379/TCP 0s
redis-slave ClusterIP 10.0.109.2 <none> 6379/TCP 0s


NOTES:
1. Get the application URL by running these commands:
  NOTE: It may take a few minutes for the LoadBalancer IP to be available.
        You can watch the status of by running 'kubectl get svc -w mothy-goat-guestbook --namespace default'
  export SERVICE_IP=$(kubectl get svc --namespace default mothy-goat-guestbook -o jsonpath='{.status.loadBalancer.ingress[0].ip}')
  echo http://$SERVICE_IP:3000
We can see it running:
C:\Users\isaac>kubectl get svc --namespace default mothy-goat-guestbook -o jsonpath='{.status.loadBalancer.ingress[0].ip}'
'168.62.170.249'
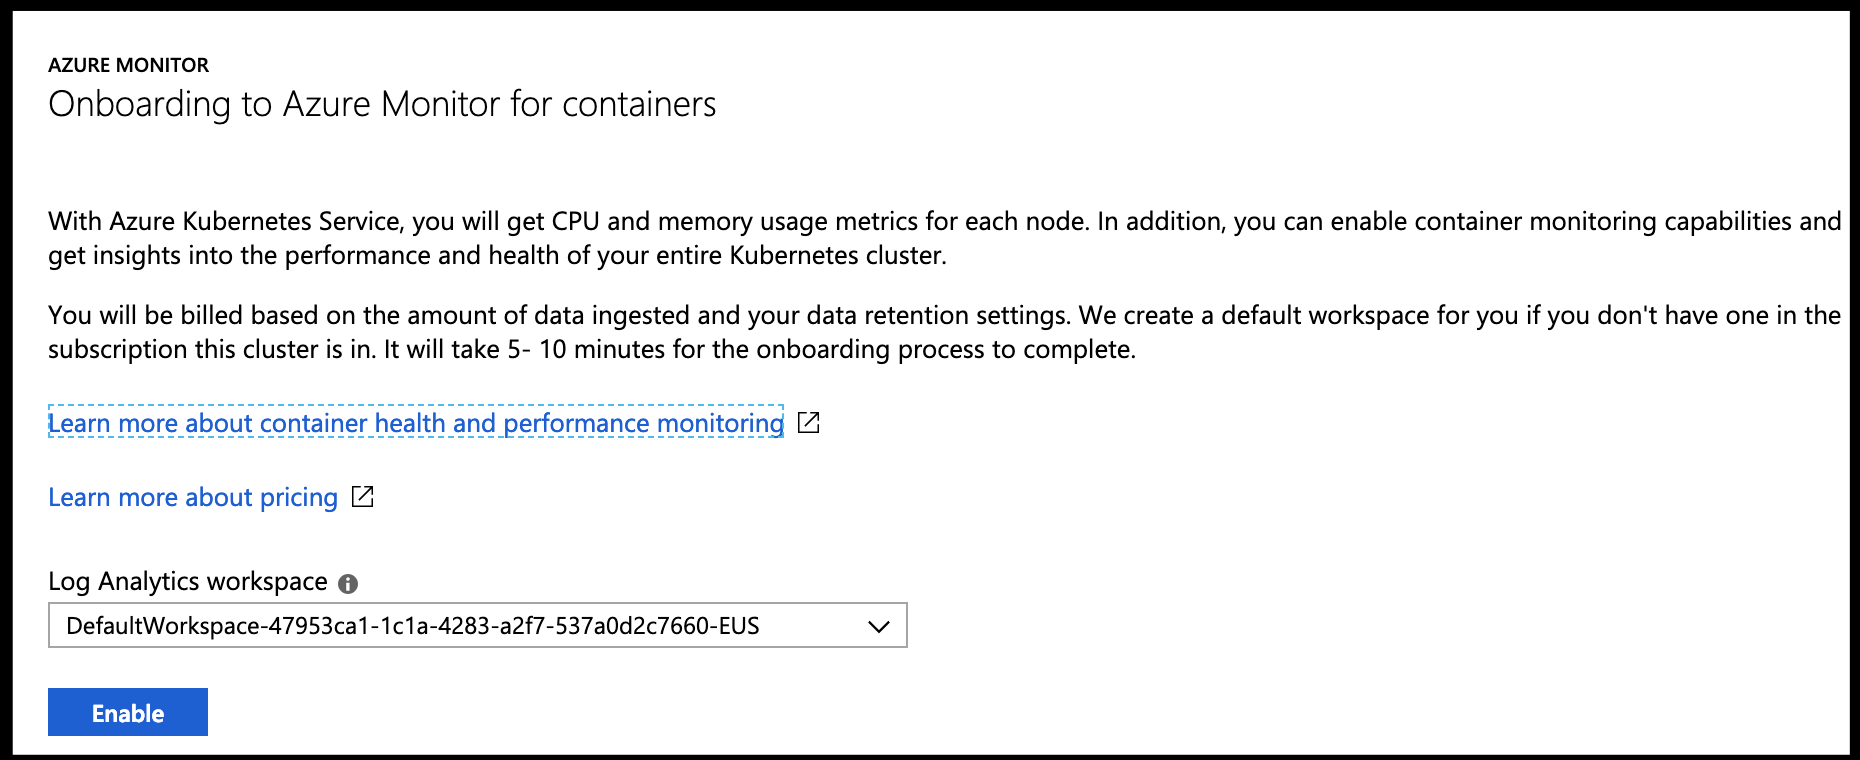
Azure Monitor
First, go to Logs on your Kubernetes instance in the Azure portal and enable Azure Monitor.
After enabling logs and giving some time, we can go back into the Azure Portal, to our cluster and click on logs for the Monitoring Logs:

This looks similar to many logging tools. We can use a query filter to check all the logs on a particular image, or node.
For instance, if we care to look up stdout on the guestbook container we launched, it’s easy to do by selecting the image and the LogEntry source:
ContainerLog
| where (Image == "ibmcom/guestbook:v1") and (LogEntrySource == "stdout")
| limit 50


Because we’ve enabled Azure Log Analytics, we have a few more powerful features that can help us monitor our cluster for things like performance, problems and cost.
Example: Alerting on container errors
Say we want an alert on stderr for our application pod? How might we accomplish this with Azure Log Analytics?
First lets define a query that finds stderr on our pod:
let startTimestamp = ago(1d);
KubePodInventory
| where TimeGenerated > startTimestamp
| where ClusterName =~ "idj-aks-monitoring-aks1"
| distinct ContainerID
| join
(
   ContainerLog
   | where TimeGenerated > startTimestamp
)
on ContainerID
| project LogEntrySource, LogEntry, TimeGenerated, Computer, Image, Name, ContainerID
| order by TimeGenerated desc
| render table
| where LogEntrySource == "stderr"
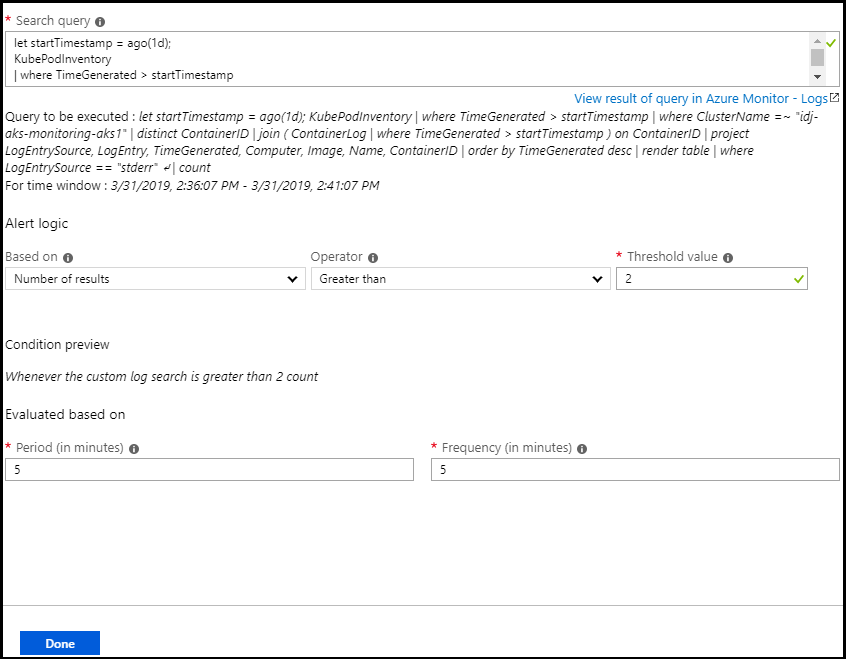
The key distinction is that last line (stderr vs stdout). Next, click on the “+New alert rule” in our log analytics window:

Next, you’ll need to set the condition:

For instance, I only care on 2 stderr in a 5 minute window:
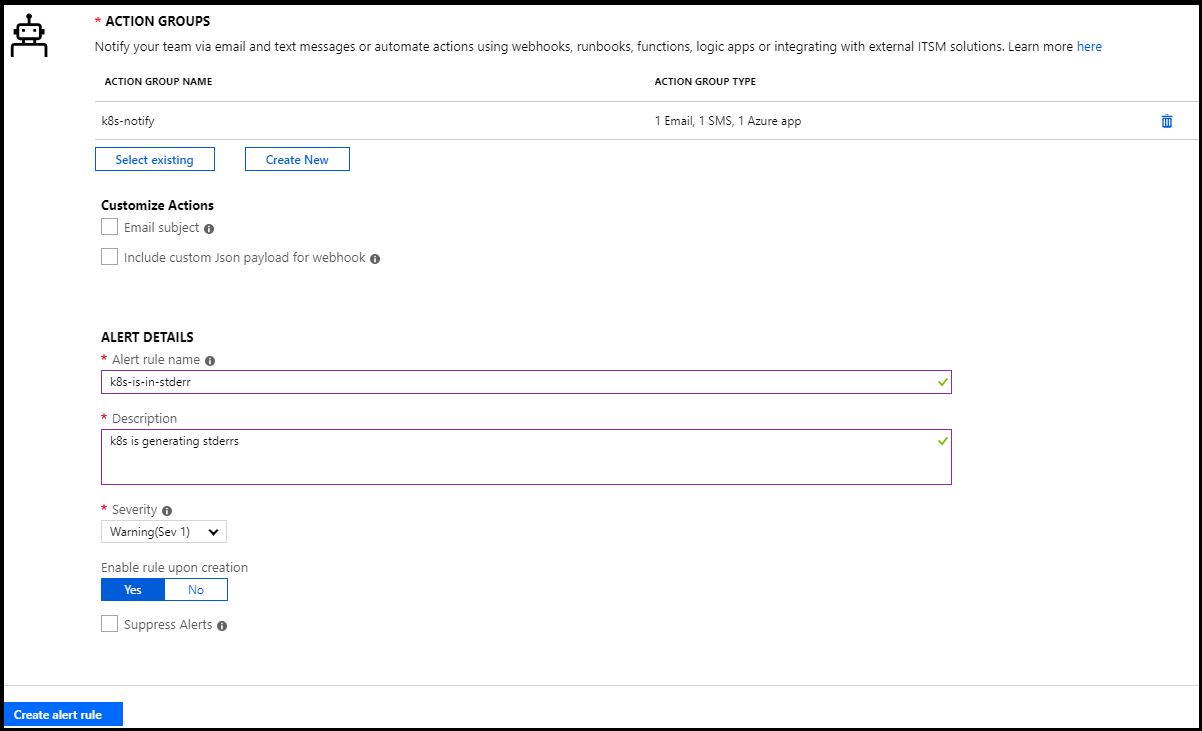
In the next section, you can define an action group. Here i’ll configure it to email and text myself:

Don’t forget to select the group after creation. Then finish creating the alert rule:
You’ll get a notification you’ve been added by the methods selected. For instance i got an email and text:


Pro-tip: To change or remove the Alert rules, you’ll need to go to Azure Monitor.
Go to the Portal, Monitor, then click “Manage alert rules”:

There you can disable or delete the rule.

Example Alert:


Insights:
As we enabled Monitoring and Insights, we can also use Insights to view the cluster health:

This can give us an easy way to check the health of our Pod:

Before we wrap up Azure’s built-in offerings, let’s look at the Metrics that Azure Monitor has collected via standard Resource Groups Metrics:
Here we can look up our Resource group then the AKS instance to look at things like Pods by phase:

Summary:
Azure offers many built-in options for monitoring our Kubernetes Clusters using Azure Monitor, specifically Azure Log Analytics and Azure Insights. When we combine that with out-of-the-box Kubernetes Dashboards we have many ways to monitor and invistage health and performance of our AKS Clusters.