Published: Jun 27, 2024 by Isaac Johnson
Grafana rolled out Alloy, their OpenTelemetry Collector in May. Today we will set up a GKE cluster with ASM, however we will collect OTel traces using both the OTel GCP Cloud Trace collector and Alloy to show how we can alternate.
We know Datadog has a great cluster agent, but for this demo, we will see APM collection using native OTLP via Alloy.
Earlier this week we covered Alloy in Docker and on-prem Kubernetes (k3s) through to GroundCover APM and NewRelic. This certainly allows use to pick our APM that most meets our need.
GKE Setup
A bit of house-keeping first. The GCloud CLI moves fast and it’s important to take a moment and perform any updates
$ gcloud auth login
Your browser has been opened to visit:

    https://accounts.google.com/o/oauth2/auth?response_type=code&client_id=32555940559.apps.googleusercontent.com&redirect_uri=http%3A%2F%2Flocalhost%3A8085%2F&scope=openid+https%3A%2F%2Fwww.googleapis.com%2Fauth%2Fuserinfo.email+https%3A%2F%2Fwww.googleapis.com%2Fauth%2Fcloud-platform+https%3A%2F%2Fwww.googleapis.com%2Fauth%2Fappengine.admin+https%3A%2F%2Fwww.googleapis.com%2Fauth%2Fsqlservice.login+https%3A%2F%2Fwww.googleapis.com%2Fauth%2Fcompute+https%3A%2F%2Fwww.googleapis.com%2Fauth%2Faccounts.reauth&state=AlnsM8rtVg6Jw63XBtAf4smcrN7eoL&access_type=offline&code_challenge=xo_lCcmpBStBRHZuhGKGpYcRXZxVWoiYnCe_CJuvm4s&code_challenge_method=S256


You are now logged in as [isaac.johnson@gmail.com].
Your current project is [myanthosproject2].  You can change this setting by running:
  $ gcloud config set project PROJECT_ID


To take a quick anonymous survey, run:
  $ gcloud survey

$ gcloud app update
Nothing to update.

$ gcloud components update
Beginning update. This process may take several minutes.
ERROR: (gcloud.components.update)
You cannot perform this action because the Google Cloud CLI component manager
is disabled for this installation. You can run the following command
to achieve the same result for this installation:

sudo apt-get update && sudo apt-get --only-upgrade install google-cloud-sdk-firestore-emulator google-cloud-sdk-harbourbridge google-cloud-sdk-cloud-run-proxy google-cloud-sdk-datalab google-cloud-sdk-app-engine-python-extras google-cloud-sdk-minikube google-cloud-sdk-config-connector google-cloud-sdk-anthos-auth google-cloud-sdk-kpt google-cloud-sdk-gke-gcloud-auth-plugin google-cloud-sdk google-cloud-sdk-app-engine-grpc google-cloud-sdk-app-engine-python google-cloud-sdk-nomos google-cloud-sdk-pubsub-emulator google-cloud-sdk-datastore-emulator google-cloud-sdk-package-go-module google-cloud-sdk-spanner-emulator google-cloud-sdk-terraform-tools kubectl google-cloud-sdk-bigtable-emulator google-cloud-sdk-app-engine-java google-cloud-sdk-local-extract google-cloud-sdk-cloud-build-local google-cloud-sdk-app-engine-go google-cloud-sdk-skaffold google-cloud-sdk-kubectl-oidc google-cloud-sdk-cbt

$ sudo apt-get update && sudo apt-get --only-upgrade install google-cloud-sdk-firestore-emulator google-cloud-sdk-harbourbridge google-cloud-sdk-cloud-run-proxy google-cloud-sdk-datalab google-cloud-sdk-app-engine-python-extras google-cloud-sdk-minikube google-cloud-sdk-config-connector google-cloud-sdk-anthos-auth google-cloud-sdk-kpt google-cloud-sdk-gke-gcloud-auth-plugin google-cloud-sdk google-cloud-sdk-app-engine-grpc google-cloud-sdk-app-engine-python google-cloud-sdk-nomos google-cloud-sdk-pubsub-emulator google-cloud-sdk-datastore-emulator google-cloud-sdk-package-go-module google-cloud-sdk-spanner-emulator google-cloud-sdk-terraform-tools kubectl google-cloud-sdk-bigtable-emulator google-cloud-sdk-app-engine-java google-cloud-sdk-local-extract google-cloud-sdk-cloud-build-local google-cloud-sdk-app-engine-go google-cloud-sdk-skaffold google-cloud-sdk-kubectl-oidc google-cloud-sdk-cbt
[sudo] password for builder:
Get:1 http://security.ubuntu.com/ubuntu focal-security InRelease [128 kB]
Get:2 https://apt.releases.hashicorp.com focal InRelease [12.9 kB]
Hit:3 https://packages.microsoft.com/repos/azure-cli focal InRelease
Hit:4 http://archive.ubuntu.com/ubuntu focal InRelease
Get:5 https://packages.microsoft.com/repos/microsoft-ubuntu-focal-prod focal InRelease [3632 B]
Get:6 http://archive.ubuntu.com/ubuntu focal-updates InRelease [128 kB]
Get:7 https://packages.microsoft.com/debian/11/prod bullseye InRelease [3650 B]
Err:2 https://apt.releases.hashicorp.com focal InRelease
  The following signatures couldn't be verified because the public key is not available: NO_PUBKEY AA16FCBCA621E701
Get:8 https://packages.cloud.google.com/apt cloud-sdk InRelease [1616 B]
Hit:9 http://ppa.launchpad.net/flatpak/stable/ubuntu focal InRelease
Hit:10 http://archive.ubuntu.com/ubuntu focal-backports InRelease
Hit:11 http://ppa.launchpad.net/ubuntu-toolchain-r/test/ubuntu focal InRelease
Get:12 https://packages.microsoft.com/repos/microsoft-ubuntu-focal-prod focal/main amd64 Packages [295 kB]
Get:13 https://packages.microsoft.com/debian/11/prod bullseye/main amd64 Packages [165 kB]
Get:14 https://packages.microsoft.com/debian/11/prod bullseye/main arm64 Packages [33.9 kB]
Get:15 https://packages.microsoft.com/debian/11/prod bullseye/main armhf Packages [28.9 kB]
Err:8 https://packages.cloud.google.com/apt cloud-sdk InRelease
  The following signatures couldn't be verified because the public key is not available: NO_PUBKEY C0BA5CE6DC6315A3
Get:16 http://security.ubuntu.com/ubuntu focal-security/main amd64 Packages [2985 kB]
Get:17 http://archive.ubuntu.com/ubuntu focal-updates/main amd64 Packages [3361 kB]
Get:18 http://download.opensuse.org/repositories/devel:/kubic:/libcontainers:/stable/xUbuntu_20.04  InRelease [1642 B]
Get:19 http://security.ubuntu.com/ubuntu focal-security/main Translation-en [447 kB]
Get:20 http://security.ubuntu.com/ubuntu focal-security/restricted amd64 Packages [2863 kB]
Get:21 http://security.ubuntu.com/ubuntu focal-security/restricted Translation-en [401 kB]
Err:18 http://download.opensuse.org/repositories/devel:/kubic:/libcontainers:/stable/xUbuntu_20.04  InRelease
  The following signatures were invalid: EXPKEYSIG 4D64390375060AA4 devel:kubic OBS Project <devel:kubic@build.opensuse.org>
Get:22 http://security.ubuntu.com/ubuntu focal-security/universe amd64 Packages [967 kB]
Get:23 http://security.ubuntu.com/ubuntu focal-security/universe Translation-en [205 kB]
Get:24 http://archive.ubuntu.com/ubuntu focal-updates/main Translation-en [528 kB]
Get:25 http://archive.ubuntu.com/ubuntu focal-updates/restricted amd64 Packages [2996 kB]
Get:26 http://archive.ubuntu.com/ubuntu focal-updates/restricted Translation-en [419 kB]
Get:27 http://archive.ubuntu.com/ubuntu focal-updates/universe amd64 Packages [1194 kB]
Get:28 http://archive.ubuntu.com/ubuntu focal-updates/universe Translation-en [287 kB]
Get:29 http://archive.ubuntu.com/ubuntu focal-updates/multiverse amd64 Packages [27.1 kB]
Get:30 http://archive.ubuntu.com/ubuntu focal-updates/multiverse Translation-en [7936 B]
Fetched 17.5 MB in 3s (6204 kB/s)
Reading package lists... Done
W: An error occurred during the signature verification. The repository is not updated and the previous index files will be used. GPG error: https://apt.releases.hashicorp.com focal InRelease: The following signatures couldn't be verified because the public key is not available: NO_PUBKEY AA16FCBCA621E701
W: An error occurred during the signature verification. The repository is not updated and the previous index files will be used. GPG error: https://packages.cloud.google.com/apt cloud-sdk InRelease: The following signatures couldn't be verified because the public key is not available: NO_PUBKEY C0BA5CE6DC6315A3
W: An error occurred during the signature verification. The repository is not updated and the previous index files will be used. GPG error: http://download.opensuse.org/repositories/devel:/kubic:/libcontainers:/stable/xUbuntu_20.04  InRelease: The following signatures were invalid: EXPKEYSIG 4D64390375060AA4 devel:kubic OBS Project <devel:kubic@build.opensuse.org>
W: Failed to fetch https://apt.releases.hashicorp.com/dists/focal/InRelease  The following signatures couldn't be verified because the public key is not available: NO_PUBKEY AA16FCBCA621E701
W: Failed to fetch http://download.opensuse.org/repositories/devel:/kubic:/libcontainers:/stable/xUbuntu_20.04/InRelease  The following signatures were invalid: EXPKEYSIG 4D64390375060AA4 devel:kubic OBS Project <devel:kubic@build.opensuse.org>
W: Failed to fetch https://packages.cloud.google.com/apt/dists/cloud-sdk/InRelease  The following signatures couldn't be verified because the public key is not available: NO_PUBKEY C0BA5CE6DC6315A3
W: Some index files failed to download. They have been ignored, or old ones used instead.
Reading package lists... Done
Building dependency tree
Reading state information... Done
Skipping google-cloud-sdk-anthos-auth, it is not installed and only upgrades are requested.
Skipping google-cloud-sdk-app-engine-grpc, it is not installed and only upgrades are requested.
Skipping google-cloud-sdk-app-engine-java, it is not installed and only upgrades are requested.
Skipping google-cloud-sdk-bigtable-emulator, it is not installed and only upgrades are requested.
Skipping google-cloud-sdk-cbt, it is not installed and only upgrades are requested.
Skipping google-cloud-sdk-cloud-run-proxy, it is not installed and only upgrades are requested.
Skipping google-cloud-sdk-config-connector, it is not installed and only upgrades are requested.
Skipping google-cloud-sdk-datalab, it is not installed and only upgrades are requested.
Skipping google-cloud-sdk-datastore-emulator, it is not installed and only upgrades are requested.
Skipping google-cloud-sdk-firestore-emulator, it is not installed and only upgrades are requested.
Skipping google-cloud-sdk-harbourbridge, it is not installed and only upgrades are requested.
Skipping google-cloud-sdk-kpt, it is not installed and only upgrades are requested.
Skipping google-cloud-sdk-kubectl-oidc, it is not installed and only upgrades are requested.
Skipping google-cloud-sdk-local-extract, it is not installed and only upgrades are requested.
Skipping google-cloud-sdk-minikube, it is not installed and only upgrades are requested.
Skipping google-cloud-sdk-nomos, it is not installed and only upgrades are requested.
Skipping google-cloud-sdk-package-go-module, it is not installed and only upgrades are requested.
Skipping google-cloud-sdk-skaffold, it is not installed and only upgrades are requested.
Skipping google-cloud-sdk-spanner-emulator, it is not installed and only upgrades are requested.
Skipping google-cloud-sdk-terraform-tools, it is not installed and only upgrades are requested.
Skipping kubectl, it is not installed and only upgrades are requested.
The following packages were automatically installed and are no longer required:
  libappstream-glib8 liblttng-ust-ctl4 liblttng-ust0 python3-crcmod
Use 'sudo apt autoremove' to remove them.
Suggested packages:
  google-cloud-sdk-app-engine-java google-cloud-sdk-bigtable-emulator google-cloud-sdk-datastore-emulator kubectl
The following packages will be upgraded:
  google-cloud-sdk google-cloud-sdk-app-engine-go google-cloud-sdk-app-engine-python
  google-cloud-sdk-app-engine-python-extras google-cloud-sdk-cloud-build-local
  google-cloud-sdk-gke-gcloud-auth-plugin google-cloud-sdk-pubsub-emulator
7 upgraded, 0 newly installed, 0 to remove and 389 not upgraded.
Need to get 223 MB of archives.
After this operation, 5294 kB disk space will be freed.
Do you want to continue? [Y/n] Y
Get:1 https://packages.cloud.google.com/apt cloud-sdk/main amd64 google-cloud-sdk all 412.0.0-0 [131 MB]
Get:2 https://packages.cloud.google.com/apt cloud-sdk/main amd64 google-cloud-sdk-app-engine-python all 412.0.0-0 [6054 kB]
Get:3 https://packages.cloud.google.com/apt cloud-sdk/main amd64 google-cloud-sdk-app-engine-go amd64 412.0.0-0 [1884 kB]
Get:4 https://packages.cloud.google.com/apt cloud-sdk/main amd64 google-cloud-sdk-app-engine-python-extras all 412.0.0-0 [15.0 MB]
Get:5 https://packages.cloud.google.com/apt cloud-sdk/main amd64 google-cloud-sdk-cloud-build-local amd64 412.0.0-0 [2719 kB]
Get:6 https://packages.cloud.google.com/apt cloud-sdk/main amd64 google-cloud-sdk-gke-gcloud-auth-plugin amd64 412.0.0-0 [3117 kB]
Get:7 https://packages.cloud.google.com/apt cloud-sdk/main amd64 google-cloud-sdk-pubsub-emulator all 412.0.0-0 [63.2 MB]
Fetched 223 MB in 25s (9060 kB/s)
(Reading database ... 234034 files and directories currently installed.)
Preparing to unpack .../0-google-cloud-sdk_412.0.0-0_all.deb ...
Unpacking google-cloud-sdk (412.0.0-0) over (397.0.0-0) ...
Preparing to unpack .../1-google-cloud-sdk-app-engine-python_412.0.0-0_all.deb ...
Unpacking google-cloud-sdk-app-engine-python (412.0.0-0) over (397.0.0-0) ...
Preparing to unpack .../2-google-cloud-sdk-app-engine-go_412.0.0-0_amd64.deb ...
Unpacking google-cloud-sdk-app-engine-go (412.0.0-0) over (397.0.0-0) ...
Preparing to unpack .../3-google-cloud-sdk-app-engine-python-extras_412.0.0-0_all.deb ...
Unpacking google-cloud-sdk-app-engine-python-extras (412.0.0-0) over (397.0.0-0) ...
Preparing to unpack .../4-google-cloud-sdk-cloud-build-local_412.0.0-0_amd64.deb ...
Unpacking google-cloud-sdk-cloud-build-local (412.0.0-0) over (397.0.0-0) ...
Preparing to unpack .../5-google-cloud-sdk-gke-gcloud-auth-plugin_412.0.0-0_amd64.deb ...
Unpacking google-cloud-sdk-gke-gcloud-auth-plugin (412.0.0-0) over (397.0.0-0) ...
Preparing to unpack .../6-google-cloud-sdk-pubsub-emulator_412.0.0-0_all.deb ...
Unpacking google-cloud-sdk-pubsub-emulator (412.0.0-0) over (397.0.0-0) ...
Setting up google-cloud-sdk-gke-gcloud-auth-plugin (412.0.0-0) ...
Setting up google-cloud-sdk (412.0.0-0) ...
Setting up google-cloud-sdk-app-engine-python (412.0.0-0) ...
Setting up google-cloud-sdk-cloud-build-local (412.0.0-0) ...
Setting up google-cloud-sdk-pubsub-emulator (412.0.0-0) ...
Processing triggers for man-db (2.9.1-1) ...
Processing triggers for google-cloud-sdk (412.0.0-0) ...
Processing triggers for google-cloud-sdk-gke-gcloud-auth-plugin (412.0.0-0) ...
Setting up google-cloud-sdk-app-engine-go (412.0.0-0) ...
Setting up google-cloud-sdk-app-engine-python-extras (412.0.0-0) ...
Processing triggers for google-cloud-sdk (412.0.0-0) ...
Processing triggers for google-cloud-sdk-gke-gcloud-auth-plugin (412.0.0-0) ...
I now have an up-to-date gcloud cli set up
$ gcloud version
Google Cloud SDK 412.0.0
alpha 2022.12.09
app-engine-go 1.9.72
app-engine-python 1.9.101
app-engine-python-extras 1.9.97
beta 2022.12.09
bq 2.0.83
bundled-python3-unix 3.9.12
core 2022.12.09
gcloud-crc32c 1.0.0
gke-gcloud-auth-plugin 0.4.0
gsutil 5.17
pubsub-emulator 0.7.2
I’ll use the following gcloud command to create an Autopilot cluster with public access
$ gcloud beta container --project "myanthosproject2" clusters create-auto "autopilot-cluster-1" --region "us-central1" --release-channel "regular" --network "projects/myanthosproject2/global/networks/default" --subnetwork "projects/myanthosproject2/regions/us-central1/subnetworks/default" --cluster-ipv4-cidr "/17" --binauthz-evaluation-mode=DISABLED --fleet-project=myanthosproject2

Note: The Pod address range limits the maximum size of the cluster. Please refer to https://cloud.google.com/kubernetes-engine/docs/how-to/flexible-pod-cidr to learn how to optimize IP address allocation.
Creating cluster autopilot-cluster-1 in us-central1... Cluster is being health-checked (master is healthy)...done.

Created [https://container.googleapis.com/v1beta1/projects/myanthosproject2/zones/us-central1/clusters/autopilot-cluster-1].
To inspect the contents of your cluster, go to: https://console.cloud.google.com/kubernetes/workload_/gcloud/us-central1/autopilot-cluster-1?project=myanthosproject2
kubeconfig entry generated for autopilot-cluster-1.
NAME                 LOCATION     MASTER_VERSION      MASTER_IP     MACHINE_TYPE  NODE_VERSION        NUM_NODES  STATUS
autopilot-cluster-1  us-central1  1.29.4-gke.1043002  34.45.152.39  e2-small      1.29.4-gke.1043002  3          RUNNING
Now we need to add the Datadog Agent collector which will receive our OTLP traces
$ helm repo add datadog https://helm.datadoghq.com
"datadog" already exists with the same configuration, skipping

$ helm repo update
Hang tight while we grab the latest from your chart repositories...
...Unable to get an update from the "freshbrewed" chart repository (https://harbor.freshbrewed.science/chartrepo/library):
        failed to fetch https://harbor.freshbrewed.science/chartrepo/library/index.yaml : 404 Not Found
...Unable to get an update from the "myharbor" chart repository (https://harbor.freshbrewed.science/chartrepo/library):
        failed to fetch https://harbor.freshbrewed.science/chartrepo/library/index.yaml : 404 Not Found
...Successfully got an update from the "kube-state-metrics" chart repository
...Successfully got an update from the "nfs" chart repository
...Successfully got an update from the "ngrok" chart repository
...Successfully got an update from the "dapr" chart repository
...Successfully got an update from the "akomljen-charts" chart repository
...Successfully got an update from the "btungut" chart repository
...Successfully got an update from the "portainer" chart repository
index.go:353: skipping loading invalid entry for chart "finops-policies" "" from https://charts.jetstack.io: validation: chart.metadata.version is required
index.go:353: skipping loading invalid entry for chart "limit-ranger" "" from https://charts.jetstack.io: validation: chart.metadata.version is required
...Successfully got an update from the "jetstack" chart repository
...Successfully got an update from the "openfunction" chart repository
...Successfully got an update from the "ingress-nginx" chart repository
...Successfully got an update from the "longhorn" chart repository
...Successfully got an update from the "adwerx" chart repository
...Successfully got an update from the "sonarqube" chart repository
...Successfully got an update from the "sumologic" chart repository
...Successfully got an update from the "open-telemetry" chart repository
...Successfully got an update from the "kiwigrid" chart repository
...Successfully got an update from the "openproject" chart repository
...Successfully got an update from the "kubecost" chart repository
...Successfully got an update from the "nginx-stable" chart repository
...Successfully got an update from the "spacelift" chart repository
...Successfully got an update from the "hashicorp" chart repository
...Successfully got an update from the "elastic" chart repository
...Successfully got an update from the "crossplane-stable" chart repository
...Successfully got an update from the "datadog" chart repository
...Successfully got an update from the "rhcharts" chart repository
...Successfully got an update from the "uptime-kuma" chart repository
...Successfully got an update from the "makeplane" chart repository
...Unable to get an update from the "epsagon" chart repository (https://helm.epsagon.com):
        Get "https://helm.epsagon.com/index.yaml": dial tcp: lookup helm.epsagon.com on 10.255.255.254:53: server misbehaving
...Successfully got an update from the "ananace-charts" chart repository
...Successfully got an update from the "newrelic" chart repository
...Successfully got an update from the "gitlab" chart repository
...Successfully got an update from the "argo-cd" chart repository
...Successfully got an update from the "prometheus-community" chart repository
...Successfully got an update from the "actions-runner-controller" chart repository
...Successfully got an update from the "confluentinc" chart repository
...Successfully got an update from the "azure-samples" chart repository
...Successfully got an update from the "kuma" chart repository
...Successfully got an update from the "bitwarden" chart repository
...Successfully got an update from the "jfelten" chart repository
...Successfully got an update from the "novum-rgi-helm" chart repository
...Successfully got an update from the "opencost" chart repository
...Successfully got an update from the "opencost-charts" chart repository
...Successfully got an update from the "zabbix-community" chart repository
...Successfully got an update from the "gitea-charts" chart repository
...Successfully got an update from the "lifen-charts" chart repository
...Successfully got an update from the "signoz" chart repository
...Successfully got an update from the "castai-helm" chart repository
...Successfully got an update from the "harbor" chart repository
...Successfully got an update from the "rook-release" chart repository
...Successfully got an update from the "openzipkin" chart repository
...Successfully got an update from the "rancher-latest" chart repository
...Successfully got an update from the "incubator" chart repository
...Successfully got an update from the "grafana" chart repository
...Successfully got an update from the "bitnami" chart repository
Update Complete. ⎈Happy Helming!⎈
I can now double check my cluster is up and healthy
$ kubectl get nodes
NAME                                                 STATUS   ROLES    AGE    VERSION
gk3-autopilot-cluster-1-default-pool-0d058200-nf54   Ready    <none>   110s   v1.29.4-gke.1043002
Then set a secret with my API Key that will be used in the Agent installer in a moment
$ kubectl create secret generic datadog-secret --from-literal api-key=5xxxxxxxxxxxxxxxxxxxxxxxxxxxx1
secret/datadog-secret created
We then need a values file to reference the secret as well as enable Otel Ports
$ cat datadog-values-gke.yaml
datadog:
  apiKeyExistingSecret: datadog-secret
  site: datadoghq.com
  otlp:
    logs:
      enabled: true
    receiver:
      protocols:
        grpc:
          enabled: true
          endpoint: 0.0.0.0:4317
        http:
          enabled: true
          endpoint: 0.0.0.0:4318
agents:
  priorityClassCreate: true
providers:
  gke:
    autopilot: true
Note: Those autopilot settings in the values are important. If you omit them, you might get admission hook errors like the below
Error: INSTALLATION FAILED: 1 error occurred:
        * admission webhook "warden-validating.common-webhooks.networking.gke.io" denied the request: GKE Warden rejected the request because it violates one or more constraints.
Violations details: {"[denied by autogke-disallow-hostnamespaces]":["enabling hostPID is not allowed in Autopilot."],"[denied by autogke-no-host-port]":["container agent specifies host ports [4317 4318], which are disallowed in Autopilot."],"[denied by autogke-no-write-mode-hostpath]":["hostPath volume dsdsocket in container agent is accessed in write mode; disallowed in Autopilot.","hostPath volume os-release-file used in container agent uses path /etc/os-release which is not allowed in Autopilot. Allowed path prefixes for hostPath volumes are: [/var/log/].","hostPath volume runtimesocketdir used in container agent uses path /var/run which is not allowed in Autopilot. Allowed path prefixes for hostPath volumes are: [/var/log/].","hostPath volume procdir used in container agent uses path /proc which is not allowed in Autopilot. Allowed path prefixes for hostPath volumes are: [/var/log/].","hostPath volume cgroups used in container agent uses path /sys/fs/cgroup which is not allowed in Autopilot. Allowed path prefixes for hostPath volumes are: [/var/log/].","hostPath volume dsdsocket in container trace-agent is accessed in write mode; disallowed in Autopilot.","hostPath volume procdir used in container trace-agent uses path /proc which is not allowed in Autopilot. Allowed path prefixes for hostPath volumes are: [/var/log/].","hostPath volume cgroups used in container trace-agent uses path /sys/fs/cgroup which is not allowed in Autopilot. Allowed path prefixes for hostPath volumes are: [/var/log/].","hostPath volume runtimesocketdir used in container trace-agent uses path /var/run which is not allowed in Autopilot. Allowed path prefixes for hostPath volumes are: [/var/log/].","hostPath volume dsdsocket in container process-agent is accessed in write mode; disallowed in Autopilot.","hostPath volume os-release-file used in container process-agent uses path /etc/os-release which is not allowed in Autopilot. Allowed path prefixes for hostPath volumes are: [/var/log/].","hostPath volume runtimesocketdir used in container process-agent uses path /var/run which is not allowed in Autopilot. Allowed path prefixes for hostPath volumes are: [/var/log/].","hostPath volume cgroups used in container process-agent uses path /sys/fs/cgroup which is not allowed in Autopilot. Allowed path prefixes for hostPath volumes are: [/var/log/].","hostPath volume passwd used in container process-agent uses path /etc/passwd which is not allowed in Autopilot. Allowed path prefixes for hostPath volumes are: [/var/log/].","hostPath volume procdir used in container process-agent uses path /proc which is not allowed in Autopilot. Allowed path prefixes for hostPath volumes are: [/var/log/].","hostPath volume procdir used in container init-config uses path /proc which is not allowed in Autopilot. Allowed path prefixes for hostPath volumes are: [/var/log/].","hostPath volume runtimesocketdir used in container init-config uses path /var/run which is not allowed in Autopilot. Allowed path prefixes for hostPath volumes are: [/var/log/]."]}
Requested by user: 'isaac.johnson@gmail.com', groups: 'system:authenticated'.
I can now install:
$ helm install datadog-agent -f datadog-values-gke.yaml datadog/datadog
W0621 06:51:38.154349    8176 warnings.go:70] autopilot-default-resources-mutator:Autopilot updated DaemonSet default/datadog-agent: defaulted unspecified 'cpu' resource for containers [init-volume, init-config, agent, process-agent] (see http://g.co/gke/autopilot-defaults).
W0621 06:51:38.316089    8176 warnings.go:70] autopilot-default-resources-mutator:Autopilot updated Deployment default/datadog-agent-cluster-agent: defaulted unspecified 'cpu' resource for containers [init-volume, cluster-agent] (see http://g.co/gke/autopilot-defaults).
NAME: datadog-agent
LAST DEPLOYED: Fri Jun 21 06:51:28 2024
NAMESPACE: default
STATUS: deployed
REVISION: 1
TEST SUITE: None
NOTES:
Datadog agents are spinning up on each node in your cluster. After a few
minutes, you should see your agents starting in your event stream:
    https://app.datadoghq.com/event/explorer
You disabled creation of Secret containing API key, therefore it is expected
that you create Secret named 'datadog-secret' which includes a key called 'api-key' containing the API key.

###########################################################################################
####   WARNING: Only one Datadog chart release allowed by namespace on GKE Autopilot   ####
###########################################################################################

On GKE Autopilot, only one "datadog" Helm chart release is allowed by Kubernetes namespace due to the following new constraints on the Agent DaemonSet:
* The serviceAccountName must be "datadog-agent".
* All ConfigMap names mounted must be hardcode.

###################################################################################
####   WARNING: dogstatsd with Unix socket is not supported on GKE Autopilot   ####
###################################################################################

##############################################################################
####   WARNING: APM with Unix socket is not supported on GKE Autopilot   ####
##############################################################################

###################################################################################
####   WARNING: Cluster-Agent should be deployed in high availability mode     ####
###################################################################################

The Cluster-Agent should be in high availability mode because the following features
are enabled:
* Admission Controller

To run in high availability mode, our recommendation is to update the chart
configuration with:
* set `clusterAgent.replicas` value to `2` replicas .
* set `clusterAgent.createPodDisruptionBudget` to `true`.
I can now see Datadog is up and running and has the OTLP ports for GRPC and HTTP enabled
$ kubectl get svc
NAME                                               TYPE        CLUSTER-IP       EXTERNAL-IP   PORT(S)                               AGE
datadog-agent                                      ClusterIP   34.118.238.6     <none>        8125/UDP,8126/TCP,4317/TCP,4318/TCP   99s
datadog-agent-cluster-agent                        ClusterIP   34.118.239.15    <none>        5005/TCP                              99s
datadog-agent-cluster-agent-admission-controller   ClusterIP   34.118.239.236   <none>        443/TCP                               99s
kubernetes                                         ClusterIP   34.118.224.1     <none>        443/TCP                               12m
Grafana Alloy
I will add the Grafana repo and update helm
$ helm repo add grafana https://grafana.github.io/helm-charts
"grafana" already exists with the same configuration, skipping
$ helm repo update
Hang tight while we grab the latest from your chart repositories...
Before we install, we want to create our alloy.config since we will pick that up via the helm values.
We will use the Datadog agent OTLP HTTP collector which, by default, runs on 4318
$ cat ./datadog-alloy-config-cm.yaml
apiVersion: v1
kind: ConfigMap
metadata:
  name: alloy-config
data:
  config.alloy: |
    logging {
      level = "info"
      format = "logfmt"
    }

    // Send to New Relic
    otelcol.exporter.otlphttp "datadog" {
      client {
        endpoint = "http://datadog-agent.default.svc.cluster.local:4318"
      }
    }

    // Collect OTLP
    otelcol.receiver.otlp "httpreceiver" {
      grpc {
        endpoint = "0.0.0.0:4317"
      }

      http {
        endpoint = "0.0.0.0:4318"
      }

      output {
        metrics = [otelcol.processor.batch.default.input]
        logs    = [otelcol.processor.batch.default.input]
        traces  = [otelcol.processor.batch.default.input]
      }
    }

    // Process and send
    otelcol.processor.batch "default" {

      output {
        metrics = [otelcol.exporter.otlphttp.datadog.input]
        logs    = [otelcol.exporter.otlphttp.datadog.input]
        traces  = [otelcol.exporter.otlphttp.datadog.input]
      }
    }
    discovery.kubernetes "podmetrics" {
      role = "pod"
    }

    discovery.kubernetes "nodes" {
      role = "node"
    }

    discovery.kubernetes "services" {
      role = "service"
    }

    discovery.kubernetes "endpoints" {
      role = "endpoints"
    }
I can now apply it
$ kubectl apply -f ./datadog-alloy-config-cm.yaml
configmap/alloy-config created
Next we just need to use Alloy Helm values that forward the same GRPC and HTTP ports into Alloy before sending them right on to Datadog’s agent
$ cat alloy-values.yaml
alloy:
  configMap:
    create: false
    key: config.alloy
    name: alloy-config
  extraPorts:
  - name: otelgrpc
    port: 4317
    protocol: TCP
    targetPort: 4317
  - name: otelhttp
    port: 4318
    protocol: TCP
    targetPort: 4318
  - name: zipkin
    port: 9411
    protocol: TCP
    targetPort: 9411
  listenPort: 12345
We can install
$ helm install -f ./alloy-values.yaml alloy grafana/alloy
W0621 07:00:30.693547   10319 warnings.go:70] autopilot-default-resources-mutator:Autopilot updated DaemonSet default/alloy: defaulted unspecified 'cpu' resource for containers [alloy] (see http://g.co/gke/autopilot-defaults).
NAME: alloy
LAST DEPLOYED: Fri Jun 21 07:00:27 2024
NAMESPACE: default
STATUS: deployed
REVISION: 1
TEST SUITE: None
NOTES:
Welcome to Grafana Alloy!
Some sample data
I’m going to setup Dapr as before so I can send some sample data in.
$ dapr init -k
⌛  Making the jump to hyperspace...
ℹ️  Note: To install Dapr using Helm, see here: https://docs.dapr.io/getting-started/install-dapr-kubernetes/#install-with-helm-advanced

ℹ️  Container images will be pulled from Docker Hub
↑  Deploying the Dapr control plane to your cluster... W0621 07:07:24.254638   11531 warnings.go:70] autopilot-default-resources-mutator:Autopilot updated Deployment dapr-system/dapr-sidecar-injector: defaulted unspecified 'cpu' resource for containers [dapr-sidecar-injector] (see http://g.co/gke/autopilot-defaults).
W0621 07:07:24.263240   11531 warnings.go:70] autopilot-default-resources-mutator:Autopilot updated Deployment dapr-system/dapr-operator: defaulted unspecified 'cpu' resource for containers [dapr-operator] (see http://g.co/gke/autopilot-defaults).
W0621 07:07:24.274439   11531 warnings.go:70] autopilot-default-resources-mutator:Autopilot updated Deployment dapr-system/dapr-sentry: defaulted unspecified 'cpu' resource for containers [dapr-sentry] (see http://g.co/gke/autopilot-defaults).
↘  Deploying the Dapr control plane to your cluster... W0621 07:07:24.540110   11531 warnings.go:70] autopilot-default-resources-mutator:Autopilot updated StatefulSet dapr-system/dapr-placement-server: defaulted unspecified 'cpu' resource for containers [dapr-placement-server] (see http://g.co/gke/autopilot-defaults).
↙  Deploying the Dapr control plane to your cluster... W0621 07:07:24.753679   11531 warnings.go:70] AdmissionWebhookController: mutated namespaceselector of the webhooks to enforce GKE Autopilot policies.
✅  Deploying the Dapr control plane to your cluster...
✅  Success! Dapr has been installed to namespace dapr-system. To verify, run `dapr status -k' in your terminal. To get started, go here: https://aka.ms/dapr-getting-started
It will need a Redis for our project
$ helm install redis bitnami/redis -n dapr-system
W0621 07:08:23.493225   11854 warnings.go:70] autopilot-default-resources-mutator:Autopilot updated StatefulSet dapr-system/redis-replicas: adjusted 'cpu' resource to meet requirements for containers [redis] (see http://g.co/gke/autopilot-defaults).
W0621 07:08:23.529606   11854 warnings.go:70] autopilot-default-resources-mutator:Autopilot updated StatefulSet dapr-system/redis-master: adjusted 'cpu' resource to meet requirements for containers [redis] (see http://g.co/gke/autopilot-defaults).
NAME: redis
LAST DEPLOYED: Fri Jun 21 07:08:10 2024
NAMESPACE: dapr-system
STATUS: deployed
REVISION: 1
TEST SUITE: None
NOTES:
CHART NAME: redis
CHART VERSION: 19.5.5
APP VERSION: 7.2.5

** Please be patient while the chart is being deployed **

Redis® can be accessed on the following DNS names from within your cluster:

    redis-master.dapr-system.svc.cluster.local for read/write operations (port 6379)
    redis-replicas.dapr-system.svc.cluster.local for read-only operations (port 6379)


To get your password run:

    export REDIS_PASSWORD=$(kubectl get secret --namespace dapr-system redis -o jsonpath="{.data.redis-password}" | base64 -d)

To connect to your Redis® server:

1. Run a Redis® pod that you can use as a client:

   kubectl run --namespace dapr-system redis-client --restart='Never'  --env REDIS_PASSWORD=$REDIS_PASSWORD  --image docker.io/bitnami/redis:7.2.5-debian-12-r0 --command -- sleep infinity

   Use the following command to attach to the pod:

   kubectl exec --tty -i redis-client \
   --namespace dapr-system -- bash

2. Connect using the Redis® CLI:
   REDISCLI_AUTH="$REDIS_PASSWORD" redis-cli -h redis-master
   REDISCLI_AUTH="$REDIS_PASSWORD" redis-cli -h redis-replicas

To connect to your database from outside the cluster execute the following commands:

    kubectl port-forward --namespace dapr-system svc/redis-master 6379:6379 &
    REDISCLI_AUTH="$REDIS_PASSWORD" redis-cli -h 127.0.0.1 -p 6379

WARNING: There are "resources" sections in the chart not set. Using "resourcesPreset" is not recommended for production. For production installations, please set the following values according to your workload needs:
  - replica.resources
  - master.resources
+info https://kubernetes.io/docs/concepts/configuration/manage-resources-containers/
I can now install that into the Dapr-system
$ cat ./redis_in_dapr.yaml
apiVersion: dapr.io/v1alpha1
kind: Component
metadata:
  name: statestore
spec:
  type: state.redis
  version: v1
  metadata:
  - name: redisHost
    value: redis-master:6379
  - name: redisPassword
    secretKeyRef:
      name: redis
      key: redis-password
auth:
  secretStore: kubernetes

$ kubectl apply -f ./redis_in_dapr.yaml -n dapr-system
component.dapr.io/statestore created
I’m now going to add the Dapr quickstart calculator app
builder@DESKTOP-QADGF36:~/Workspaces/quickstarts/tutorials/distributed-calculator/deploy$ kubectl apply -f .
configuration.dapr.io/appconfig created                                     True
Warning: autopilot-default-resources-mutator:Autopilot updated Deployment default/subtractapp: defaulted unspecified 'cpu' resource for containers [subtract] (see http://g.co/gke/autopilot-defaults).44afa1c6b31
deployment.apps/subtractapp createds/
Warning: autopilot-default-resources-mutator:Autopilot updated Deployment default/zipkin: defaulted unspecified 'cpu' resource for containers [zipkin] (see http://g.co/gke/autopilot-defaults).
deployment.apps/zipkin created
service/zipkin created
Warning: autopilot-default-resources-mutator:Autopilot updated Deployment default/addapp: defaulted unspecified 'cpu' resource for containers [add] (see http://g.co/gke/autopilot-defaults).
deployment.apps/addapp created
Warning: autopilot-default-resources-mutator:Autopilot updated Deployment default/divideapp: defaulted unspecified 'cpu' resource for containers [divide] (see http://g.co/gke/autopilot-defaults).
deployment.apps/divideapp created
Warning: autopilot-default-resources-mutator:Autopilot updated Deployment default/multiplyapp: defaulted unspecified 'cpu' resource for containers [multiply] (see http://g.co/gke/autopilot-defaults).
deployment.apps/multiplyapp created
service/calculator-front-end created
Warning: autopilot-default-resources-mutator:Autopilot updated Deployment default/calculator-front-end: defaulted unspecified 'cpu' resource for containers [calculator-front-end] (see http://g.co/gke/autopilot-defaults).
deployment.apps/calculator-front-end created
component.dapr.io/statestore created
error validating "test_span.json": error validating data: [apiVersion not set, kind not set]; if you choose to ignore these errors, turn validation off with --validate=false
Error from server (BadRequest): error when creating "cobol-adder.yaml": Deployment in version "v1" cannot be handled as a Deployment: strict decoding error: unknown field "spec.template.spec.containers[0].imagePullSecrets"
I have some noise in there from some left over local files. I’m just double checking my statestore stayed put:
$ kubectl get component statestore
NAME         AGE
statestore   106s
$ kubectl get component statestore -o yaml
apiVersion: dapr.io/v1alpha1
auth:
  secretStore: kubernetes
kind: Component
metadata:
  annotations:
    kubectl.kubernetes.io/last-applied-configuration: |
      {"apiVersion":"dapr.io/v1alpha1","auth":{"secretStore":"kubernetes"},"kind":"Component","metadata":{"annotations":{},"name":"statestore","namespace":"default"},"spec":{"metadata":[{"name":"redisHost","value":"redis-master:6379"},{"name":"redisPassword","secretKeyRef":{"key":"redis-password","name":"redis"}}],"type":"state.redis","version":"v1"}}
  creationTimestamp: "2024-06-21T12:12:05Z"
  generation: 1
  name: statestore
  namespace: default
  resourceVersion: "27277"
  uid: 9118837d-6e39-490b-ab2d-dd8a3628c9e5
spec:
  metadata:
  - name: redisHost
    value: redis-master:6379
  - name: redisPassword
    secretKeyRef:
      key: redis-password
      name: redis
  type: state.redis
  version: v1
The default appconfig sends traces to a zipkin:
$ kubectl get configuration appconfig -o yaml
apiVersion: dapr.io/v1alpha1
kind: Configuration
metadata:
  annotations:
    kubectl.kubernetes.io/last-applied-configuration: |
      {"apiVersion":"dapr.io/v1alpha1","kind":"Configuration","metadata":{"annotations":{},"name":"appconfig","namespace":"default"},"spec":{"tracing":{"samplingRate":"1","zipkin":{"endpointAddress":"http://zipkin.default.svc.cluster.local:9411/api/v2/spans"}}}}
  creationTimestamp: "2024-06-21T12:12:03Z"
  generation: 1
  name: appconfig
  namespace: default
  resourceVersion: "27181"
  uid: ee45755c-2929-427c-aa69-4656bd950d2b
spec:
  metric:
    enabled: true
  metrics:
    enabled: true
  tracing:
    samplingRate: "1"
    zipkin:
      endpointAddress: http://zipkin.default.svc.cluster.local:9411/api/v2/spans
I’m seeing some blocks on GCE quotas
$ kubectl describe pod zipkin-5cc4cf44b5-jl2ql
... snip ...
Events:
  Type     Reason            Age    From                                   Message
  ----     ------            ----   ----                                   -------
  Warning  FailedScheduling  3m37s  gke.io/optimize-utilization-scheduler  0/4 nodes are available: 1 node(s) had untolerated taint {autoscaling.gke.io/defrag-candidate: 1718971807}, 2 Insufficient memory, 3 Insufficient cpu. preemption: 0/4 nodes are available: 1 Preemption is not helpful for scheduling, 3 No preemption victims found for incoming pod.
  Normal   TriggeredScaleUp  49s    cluster-autoscaler                     pod triggered scale-up: [{https://www.googleapis.com/compute/v1/projects/myanthosproject2/zones/us-central1-a/instanceGroups/gk3-autopilot-cluster-1-pool-3-488636fe-grp 0->3 (max: 1000)}]
  Warning  FailedScaleUp     0s     cluster-autoscaler                     Node scale up in zones us-central1-a associated with this pod failed: GCE quota exceeded. Pod is at risk of not being scheduled.
Also seen in the GKE Cloud Console
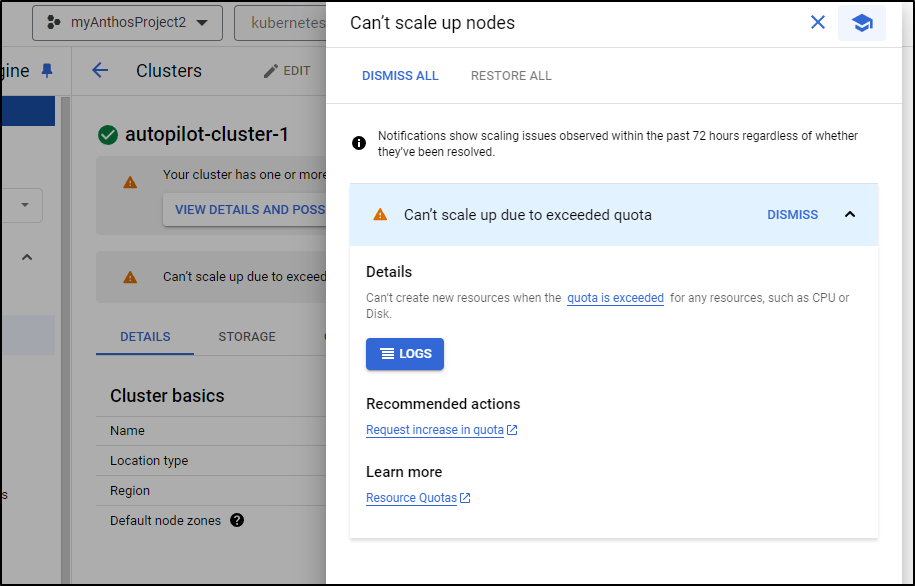
I can see the problem in my Quotas page
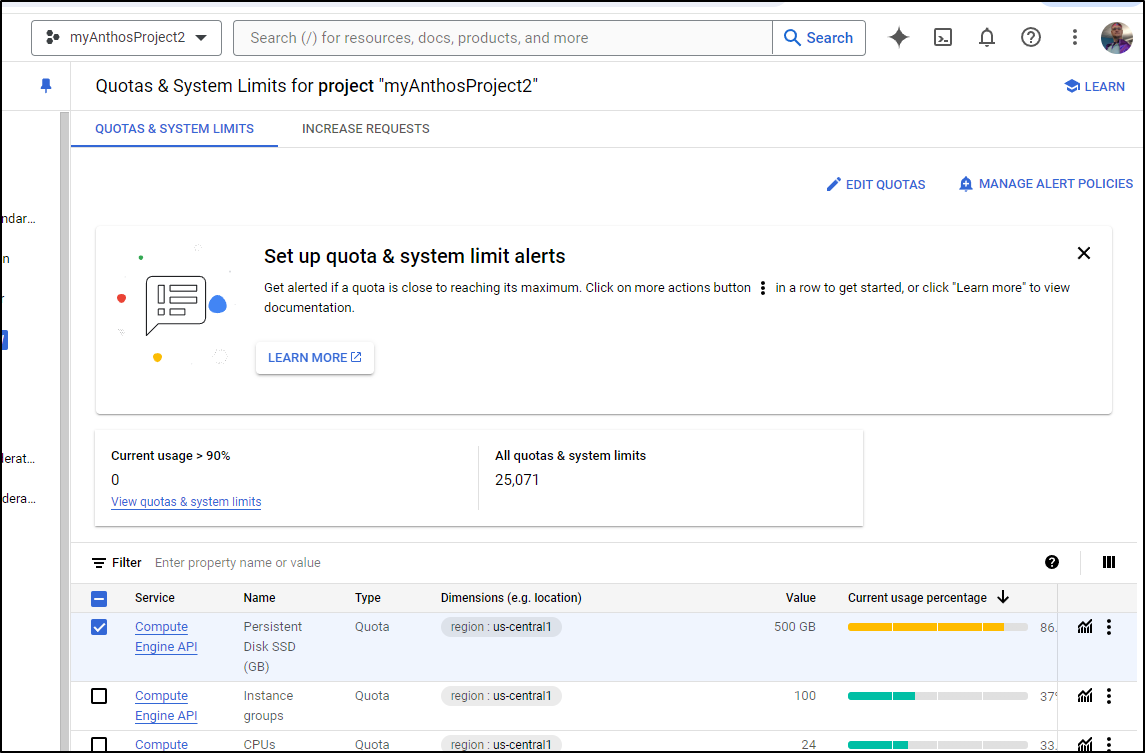
I can pick the strained service and up the quota
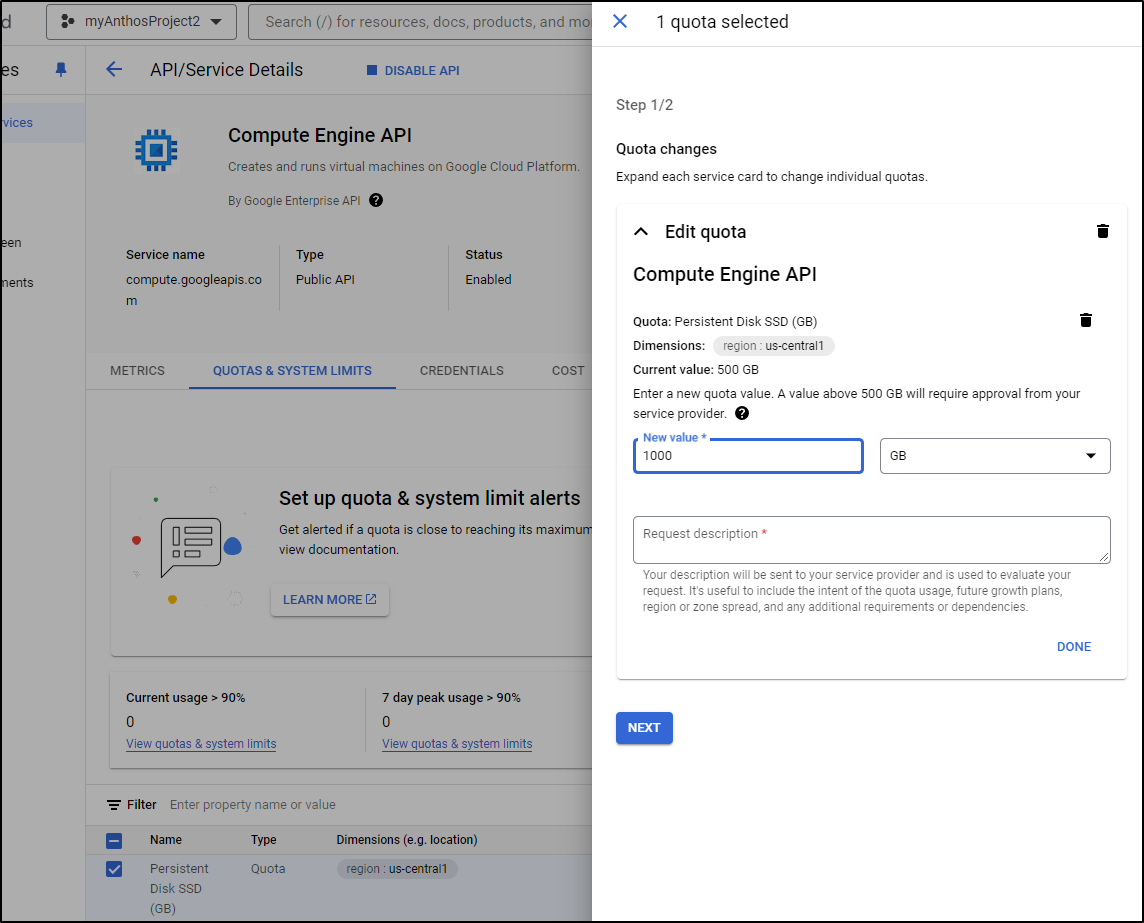
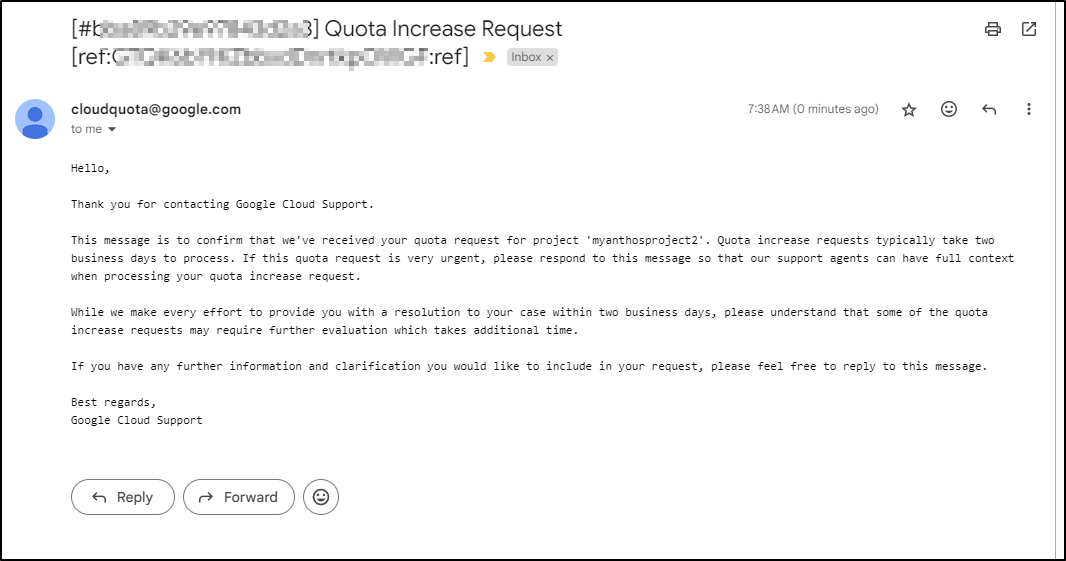
Initially I get a notice I have to wait for support to process this request
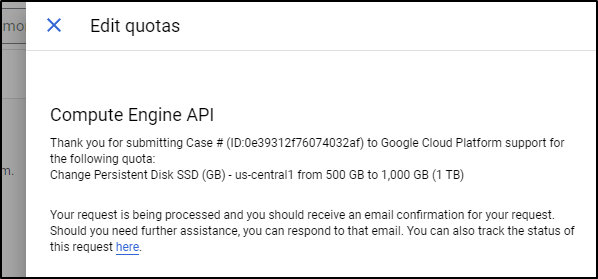
I was about to pivot to GKE Standard, but I soon saw new nodes coming up
$ kubectl get nodes
NAME                                                 STATUS   ROLES    AGE     VERSION
gk3-autopilot-cluster-1-nap-1561cjer-09a8c55a-jlw7   Ready    <none>   2m41s   v1.29.4-gke.1043002
gk3-autopilot-cluster-1-nap-1561cjer-09a8c55a-qh8x   Ready    <none>   2m46s   v1.29.4-gke.1043002
gk3-autopilot-cluster-1-nap-1561cjer-952cb7a6-lrkm   Ready    <none>   3m1s    v1.29.4-gke.1043002
gk3-autopilot-cluster-1-nap-1561cjer-952cb7a6-vmmw   Ready    <none>   2m52s   v1.29.4-gke.1043002
gk3-autopilot-cluster-1-nap-1561cjer-c5301944-2dll   Ready    <none>   2m54s   v1.29.4-gke.1043002
gk3-autopilot-cluster-1-pool-2-262db1f9-jqlg         Ready    <none>   15m     v1.29.4-gke.1043002
gk3-autopilot-cluster-1-pool-2-321acb38-tgs5         Ready    <none>   15m     v1.29.4-gke.1043002
gk3-autopilot-cluster-1-pool-2-5cf6fffd-wvkb         Ready    <none>   14m     v1.29.4-gke.1043002
gk3-autopilot-cluster-1-pool-2-e86fbe9a-9w69         Ready    <none>   38m     v1.29.4-gke.1043002
I’m seeing some errors in the pods about redis
$ kubectl logs divideapp-7b8b8985cf-r8mkz -c daprd | tail -n2
time="2024-06-21T12:24:41.690957931Z" level=info msg="Dapr runtime stopped" app_id=divideapp instance=divideapp-7b8b8985cf-r8mkz scope=dapr.runtime type=log ver=1.13.4
time="2024-06-21T12:24:41.691168633Z" level=fatal msg="Fatal error from runtime: failed to load components: rpc error: code = Unknown desc = Secret \"redis\" not found" app_id=divideapp instance=divideapp-7b8b8985cf-r8mkz scope=dapr.runtime type=log ver=1.13.4
I suspect the issue is that I put Redis in dapr-system instead of the workspace where my workloads are running.
I can fix that quick
$ helm delete redis -n dapr-system
release "redis" uninstalled
$ helm install redis bitnami/redis
W0621 07:27:35.502564   16278 warnings.go:70] autopilot-default-resources-mutator:Autopilot updated StatefulSet default/redis-master: adjusted 'cpu' resource to meet requirements for containers [redis] (see http://g.co/gke/autopilot-defaults).
W0621 07:27:35.515557   16278 warnings.go:70] autopilot-default-resources-mutator:Autopilot updated StatefulSet default/redis-replicas: adjusted 'cpu' resource to meet requirements for containers [redis] (see http://g.co/gke/autopilot-defaults).
NAME: redis
LAST DEPLOYED: Fri Jun 21 07:27:32 2024
NAMESPACE: default
STATUS: deployed
REVISION: 1
TEST SUITE: None
NOTES:
CHART NAME: redis
CHART VERSION: 19.5.5
APP VERSION: 7.2.5

** Please be patient while the chart is being deployed **

Redis® can be accessed on the following DNS names from within your cluster:

    redis-master.default.svc.cluster.local for read/write operations (port 6379)
    redis-replicas.default.svc.cluster.local for read-only operations (port 6379)


To get your password run:

    export REDIS_PASSWORD=$(kubectl get secret --namespace default redis -o jsonpath="{.data.redis-password}" | base64 -d)

To connect to your Redis® server:

1. Run a Redis® pod that you can use as a client:

   kubectl run --namespace default redis-client --restart='Never'  --env REDIS_PASSWORD=$REDIS_PASSWORD  --image docker.io/bitnami/redis:7.2.5-debian-12-r0 --command -- sleep infinity

   Use the following command to attach to the pod:

   kubectl exec --tty -i redis-client \
   --namespace default -- bash

2. Connect using the Redis® CLI:
   REDISCLI_AUTH="$REDIS_PASSWORD" redis-cli -h redis-master
   REDISCLI_AUTH="$REDIS_PASSWORD" redis-cli -h redis-replicas

To connect to your database from outside the cluster execute the following commands:

    kubectl port-forward --namespace default svc/redis-master 6379:6379 &
    REDISCLI_AUTH="$REDIS_PASSWORD" redis-cli -h 127.0.0.1 -p 6379

WARNING: There are "resources" sections in the chart not set. Using "resourcesPreset" is not recommended for production. For production installations, please set the following values according to your workload needs:
  - replica.resources
  - master.resources
+info https://kubernetes.io/docs/concepts/configuration/manage-resources-containers/
Let me rotate the Dapr app pods
$ kubectl delete pods -l app=subtract & kubectl delete pods -l app=multiply & kubectl delete pods -l app=add & kubectl delete pods -l app=divide & kubectl delete pod -l app=calculator-front-end &
[1] 16519
[2] 16520
[3] 16521
[4] 16522
[5] 16523
My zipkin pod was stuck because I forgot I modified it to use GCP Stackdriver as a backend
I’ll flip that back to the off-the-shelf zipkin
$ kubectl delete -f ./gcp-zipkin-agent.yaml
deployment.apps "zipkin" deleted
service "zipkin" deleted
$ kubectl create deployment zipkin --image openzipkin/zipkin
Warning: autopilot-default-resources-mutator:Autopilot updated Deployment default/zipkin: defaulted unspecified 'cpu' resource for containers [zipkin] (see http://g.co/gke/autopilot-defaults).
deployment.apps/zipkin created
At this point all but my multiple app is running. I approved the Quota request via an email link but it suggests it might take 2 more days
Even with some crashing agents and a stuck multiply app, let’s try anyhow
$ kubectl get pods
NAME                                           READY   STATUS             RESTARTS         AGE
addapp-55bc7b897-n4lnk                         2/2     Running            0                12m
alloy-29fx9                                    2/2     Running            0                40m
alloy-8q2lg                                    2/2     Running            0                30m
alloy-9rwtl                                    2/2     Running            0                31m
alloy-fksh4                                    1/2     CrashLoopBackOff   7 (2m1s ago)     18m
alloy-fn52x                                    2/2     Running            1 (17m ago)      18m
alloy-ps26c                                    2/2     Running            4 (15m ago)      18m
alloy-qjnq6                                    2/2     Running            6 (5m38s ago)    30m
alloy-x4m2j                                    2/2     Running            0                18m
alloy-xs54z                                    2/2     Running            1 (17m ago)      18m
calculator-front-end-779895b444-k7ls8          2/2     Running            0                12m
datadog-agent-7ntt4                            1/2     CrashLoopBackOff   6 (58s ago)      18m
datadog-agent-b9fm2                            1/2     CrashLoopBackOff   6 (2m17s ago)    18m
datadog-agent-cluster-agent-84b8c95486-cg4gj   1/1     Running            0                32m
datadog-agent-fcb8l                            1/2     CrashLoopBackOff   6 (2m42s ago)    18m
datadog-agent-fq46q                            1/2     CrashLoopBackOff   7 (3m16s ago)    31m
datadog-agent-g7xhr                            1/2     CrashLoopBackOff   11 (3m27s ago)   49m
datadog-agent-gzk9t                            1/2     CrashLoopBackOff   8 (3m31s ago)    31m
datadog-agent-j24mv                            1/2     Running            5 (2m23s ago)    19m
datadog-agent-np22r                            1/2     Running            8 (5m14s ago)    30m
datadog-agent-pdst4                            1/2     Running            6 (37s ago)      18m
divideapp-7b8b8985cf-5tlq4                     2/2     Running            0                12m
multiplyapp-c8c6bfb58-vwwxg                    0/2     Pending            0                12m
redis-master-0                                 1/1     Running            0                13m
redis-replicas-0                               1/1     Running            0                13m
redis-replicas-1                               1/1     Running            0                12m
redis-replicas-2                               1/1     Running            0                11m
subtractapp-86cdfccd9d-9lnbb                   2/2     Running            0                12m
zipkin-798769ffc6-t2d4r                        1/1     Running            0                5m14s
To Zipkin
Let’s first see traces going to zipkin
$ kubectl get configuration appconfig -o yaml
apiVersion: dapr.io/v1alpha1
kind: Configuration
metadata:
  annotations:
    kubectl.kubernetes.io/last-applied-configuration: |
      {"apiVersion":"dapr.io/v1alpha1","kind":"Configuration","metadata":{"annotations":{},"name":"appconfig","namespace":"default"},"spec":{"tracing":{"samplingRate":"1","zipkin":{"endpointAddress":"http://zipkin.default.svc.cluster.local:9411/api/v2/spans"}}}}
  creationTimestamp: "2024-06-21T12:12:03Z"
  generation: 1
  name: appconfig
  namespace: default
  resourceVersion: "27181"
  uid: ee45755c-2929-427c-aa69-4656bd950d2b
spec:
  metric:
    enabled: true
  metrics:
    enabled: true
  tracing:
    samplingRate: "1"
    zipkin:
      endpointAddress: http://zipkin.default.svc.cluster.local:9411/api/v2/spans
Since we pivoted to the quick zipkin deployment, i need to create the service
$ cat zipkin.svc.yaml
kind: Service
apiVersion: v1
metadata:
  name: zipkin
  labels:
    app: zipkin
spec:
  selector:
    app: zipkin
  ports:
  - protocol: TCP
    port: 9411
    targetPort: 9411
  type: ClusterIP
$ kubectl apply -f ./zipkin.svc.yaml
service/zipkin created
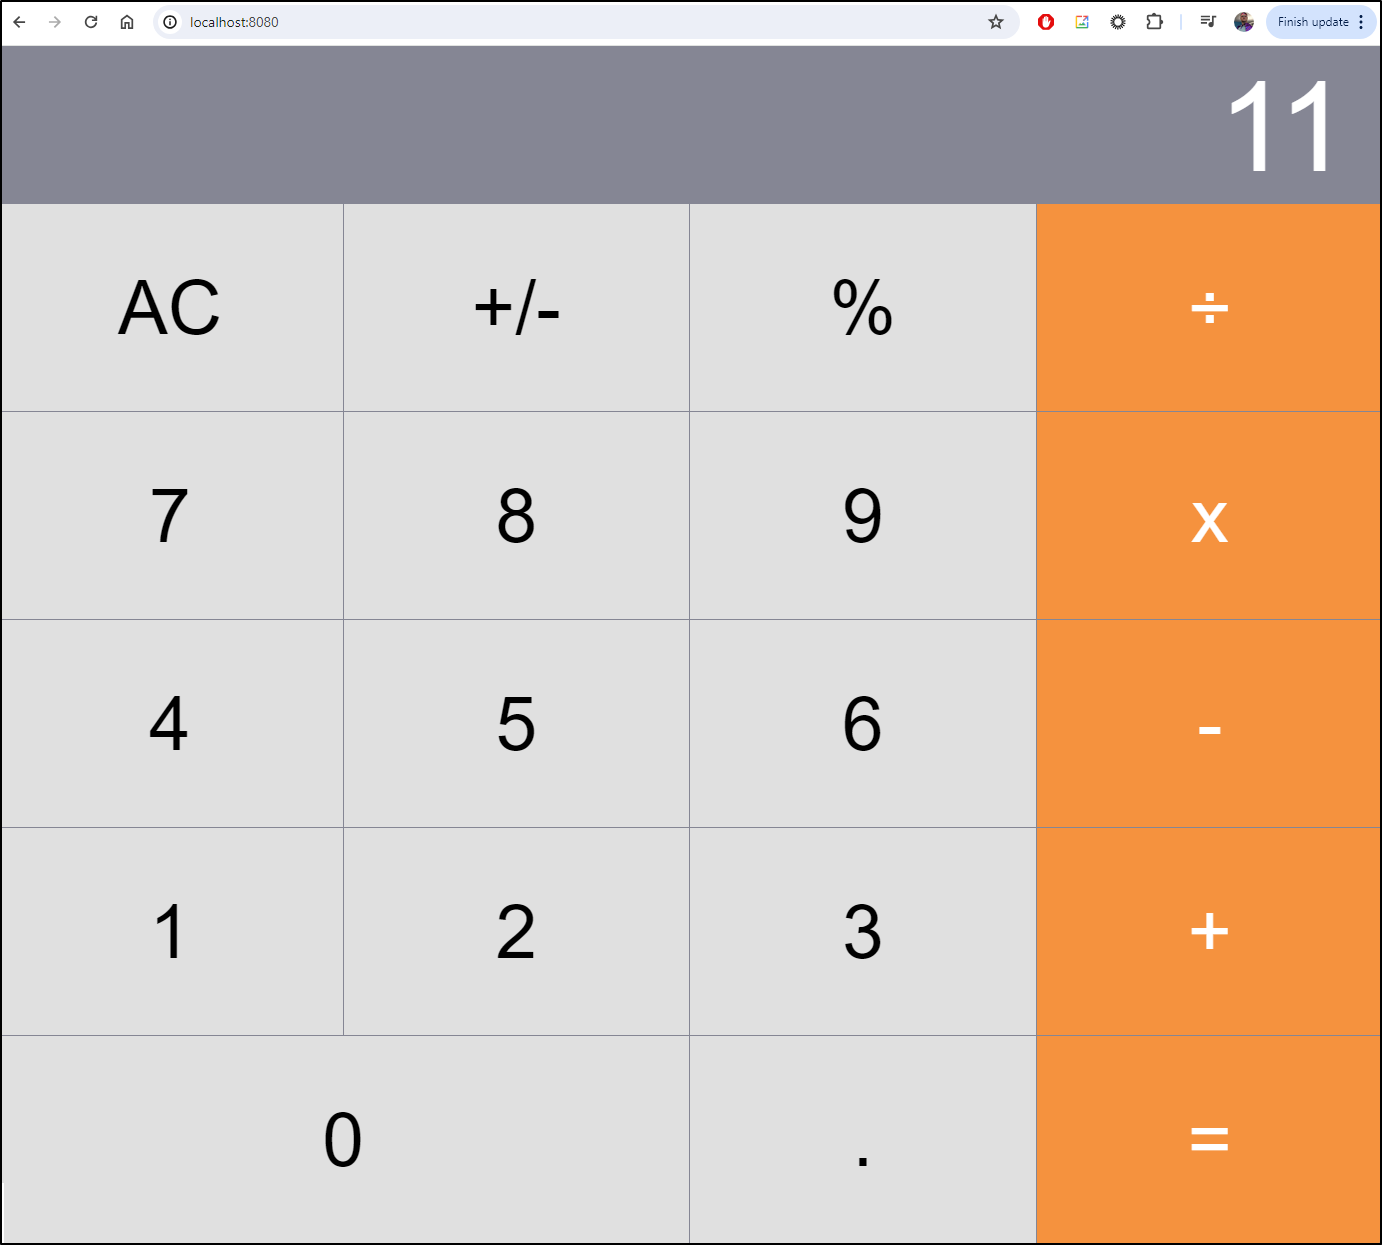
I can port-forward and do some calculations
$ kubectl port-forward `kubectl get pod -l app=calculator-front-end -o go-template='{{range .items}}{{.metadata.name}}{{end}}'` 8080:8080
Forwarding from 127.0.0.1:8080 -> 8080
Forwarding from [::1]:8080 -> 8080
Handling connection for 8080
Handling connection for 8080
Handling connection for 8080
Handling connection for 8080
Handling connection for 8080
Let’s now port-forward over to Zipkin and see our traces
$ kubectl port-forward svc/zipkin 19111:9411
Forwarding from 127.0.0.1:19111 -> 9411
Forwarding from [::1]:19111 -> 9411
Handling connection for 19111
Handling connection for 19111
Handling connection for 19111
Handling connection for 19111
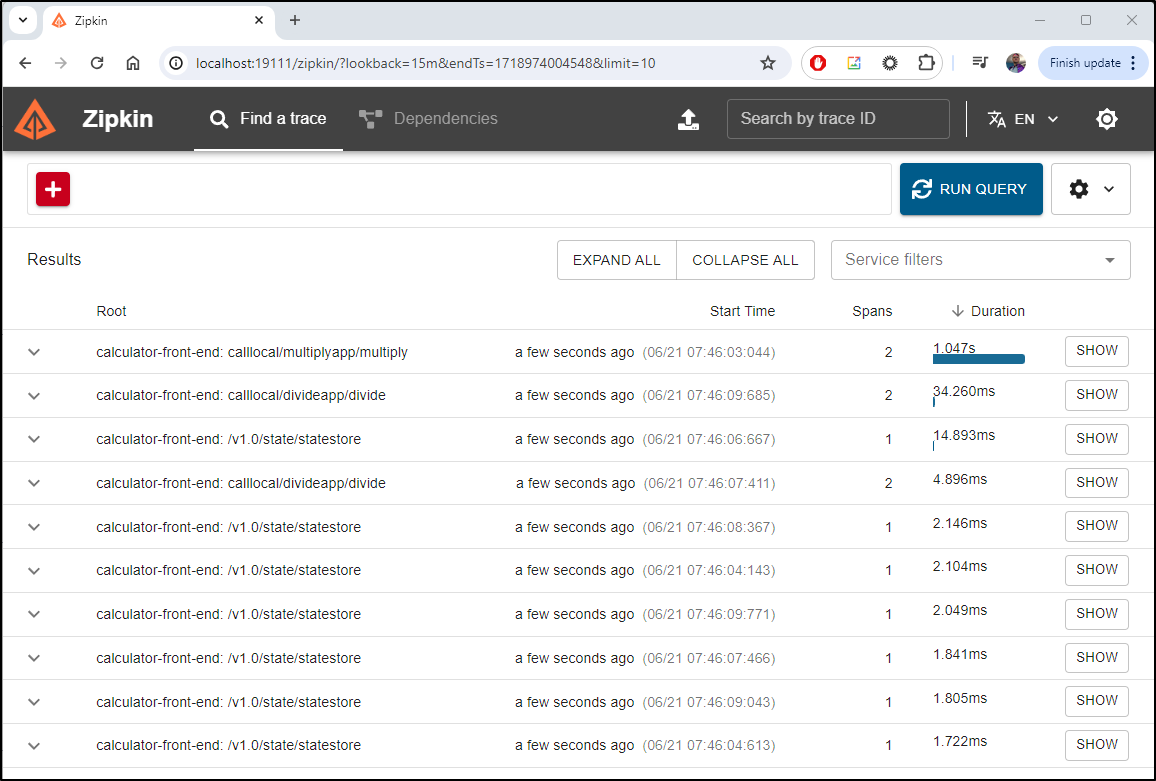
We can see some of the traces and maps (multiplyapp did come up so I could get some traces in)
Sending to Alloy
Now let’s see if Alloy will properly send on to Datadog.
We verify the service is there and named alloy
$ kubectl get svc alloy
NAME    TYPE        CLUSTER-IP       EXTERNAL-IP   PORT(S)                                AGE
alloy   ClusterIP   34.118.226.131   <none>        12345/TCP,4317/TCP,4318/TCP,9411/TCP   52m
I can view the existing configuration
$ kubectl get configuration appconfig -o yaml
apiVersion: dapr.io/v1alpha1
kind: Configuration
metadata:
  annotations:
    kubectl.kubernetes.io/last-applied-configuration: |
      {"apiVersion":"dapr.io/v1alpha1","kind":"Configuration","metadata":{"annotations":{},"name":"appconfig","namespace":"default"},"spec":{"tracing":{"samplingRate":"1","zipkin":{"endpointAddress":"http://zipkin.default.svc.cluster.local:9411/api/v2/spans"}}}}
  creationTimestamp: "2024-06-21T12:12:03Z"
  generation: 1
  name: appconfig
  namespace: default
  resourceVersion: "27181"
  uid: ee45755c-2929-427c-aa69-4656bd950d2b
spec:
  metric:
    enabled: true
  metrics:
    enabled: true
  tracing:
    samplingRate: "1"
    zipkin:
      endpointAddress: http://zipkin.default.svc.cluster.local:9411/api/v2/spans
Then pull down the existing appconfig and edit it
$ kubectl get configuration appconfig -o yaml > appconfig.yaml.new11
$ vi appconfig.yaml.new11
$ cat appconfig.yaml.new11
apiVersion: dapr.io/v1alpha1
kind: Configuration
metadata:
  annotations:
    kubectl.kubernetes.io/last-applied-configuration: |
      {"apiVersion":"dapr.io/v1alpha1","kind":"Configuration","metadata":{"annotations":{},"name":"appconfig","namespace":"default"},"spec":{"tracing":{"samplingRate":"1","zipkin":{"endpointAddress":"http://zipkin.default.svc.cluster.local:9411/api/v2/spans"}}}}
  creationTimestamp: "2024-06-21T12:12:03Z"
  generation: 1
  name: appconfig
  namespace: default
  resourceVersion: "27181"
  uid: ee45755c-2929-427c-aa69-4656bd950d2b
spec:
  metric:
    enabled: true
  metrics:
    enabled: true
  tracing:
    otel:
      endpointAddress: alloy.default.svc.cluster.local:4318
      isSecure: false
      protocol: http
    samplingRate: "1"
    stdout: true
Since Dapr loads at startup, I’ll update the CM and then rotate the pods
$ kubectl apply -f ./appconfig.yaml.new11 && sleep 2 && kubectl delete pods -l app=subtract & kubectl delete pods -l app=multiply & kubectl delete pods -l app=add & kubectl delete pods -l app=divide & kubectl delete pod -l app=calculator-front-end &
[1] 22911
[2] 22912
[3] 22914
[4] 22915
[5] 22916
I can again port-forward and do some calculations
$ kubectl port-forward `kubectl get pod -l app=calculator-front-end -o go-template='{{range .items}}{{.metadata.name}}{{end}}'` 8080:8080
Forwarding from 127.0.0.1:8080 -> 8080
Forwarding from [::1]:8080 -> 8080
Handling connection for 8080
Handling connection for 8080
Handling connection for 8080
Handling connection for 8080
Handling connection for 8080
I can see traces are going out of Dapr
$ kubectl logs subtractapp-86cdfccd9d-jxzqh -c daprd | tail -n 2
time="2024-06-21T12:55:16.240479736Z" level=info msg="Placement tables updated, version: 0" app_id=subtractapp instance=subtractapp-86cdfccd9d-jxzqh scope=dapr.runtime.actors.placement type=log ver=1.13.4
time="2024-06-21T12:57:00.686032383Z" level=info msg="[CallLocal/subtractapp/subtract] Trace: 97edbf2c471198346c11c3562089b90e Span: 7337ebf248b2828b/26f3a245f92066aa Time: [2024-06-21 12:56:56.660352726 +0000 UTC m=+101.676466051 ->  2024-06-21 12:56:56.847493588 +0000 UTC m=+101.863606913] Annotations: []" instance=subtractapp-86cdfccd9d-jxzqh scope=dapr.runtime.trace type=log ver=1.13.4
None of the Alloy nodes really shows me much, but I do see they are listening
$ kubectl logs alloy-fn52x
ts=2024-06-21T12:23:36.08881963Z level=info "boringcrypto enabled"=false
ts=2024-06-21T12:23:36.088867079Z level=info msg="running usage stats reporter"
ts=2024-06-21T12:23:36.088875493Z level=info msg="starting complete graph evaluation" controller_path=/ controller_id="" trace_id=f008df4bb39c0f086fd9a54b44070b16
ts=2024-06-21T12:23:36.088907828Z level=info msg="finished node evaluation" controller_path=/ controller_id="" trace_id=f008df4bb39c0f086fd9a54b44070b16 node_id=logging duration=134.206µs
ts=2024-06-21T12:23:36.088940473Z level=info msg="applying non-TLS config to HTTP server" service=http
ts=2024-06-21T12:23:36.088954079Z level=info msg="finished node evaluation" controller_path=/ controller_id="" trace_id=f008df4bb39c0f086fd9a54b44070b16 node_id=http duration=25.42µs
ts=2024-06-21T12:23:36.088975665Z level=info msg="finished node evaluation" controller_path=/ controller_id="" trace_id=f008df4bb39c0f086fd9a54b44070b16 node_id=cluster duration=1.672µs
ts=2024-06-21T12:23:36.088989915Z level=info msg="finished node evaluation" controller_path=/ controller_id="" trace_id=f008df4bb39c0f086fd9a54b44070b16 node_id=ui duration=1.462µs
ts=2024-06-21T12:23:36.089290959Z level=info msg="Using pod service account via in-cluster config" component_path=/ component_id=discovery.kubernetes.services
ts=2024-06-21T12:23:36.089955639Z level=info msg="finished node evaluation" controller_path=/ controller_id="" trace_id=f008df4bb39c0f086fd9a54b44070b16 node_id=discovery.kubernetes.services duration=926.4µs
ts=2024-06-21T12:23:36.090207289Z level=info msg="Using pod service account via in-cluster config" component_path=/ component_id=discovery.kubernetes.nodes
ts=2024-06-21T12:23:36.090512043Z level=info msg="finished node evaluation" controller_path=/ controller_id="" trace_id=f008df4bb39c0f086fd9a54b44070b16 node_id=discovery.kubernetes.nodes duration=508.864µs
ts=2024-06-21T12:23:36.090720066Z level=info msg="Using pod service account via in-cluster config" component_path=/ component_id=discovery.kubernetes.podmetrics
ts=2024-06-21T12:23:36.091012101Z level=info msg="finished node evaluation" controller_path=/ controller_id="" trace_id=f008df4bb39c0f086fd9a54b44070b16 node_id=discovery.kubernetes.podmetrics duration=458.617µs
ts=2024-06-21T12:23:36.187379874Z level=info msg="finished node evaluation" controller_path=/ controller_id="" trace_id=f008df4bb39c0f086fd9a54b44070b16 node_id=otelcol.exporter.otlphttp.datadog duration=96.317589ms
ts=2024-06-21T12:23:36.187903326Z level=info msg="finished node evaluation" controller_path=/ controller_id="" trace_id=f008df4bb39c0f086fd9a54b44070b16 node_id=otelcol.processor.batch.default duration=456.769µs
ts=2024-06-21T12:23:36.188348296Z level=info msg="finished node evaluation" controller_path=/ controller_id="" trace_id=f008df4bb39c0f086fd9a54b44070b16 node_id=otelcol.receiver.otlp.httpreceiver duration=397.191µs
ts=2024-06-21T12:23:36.18841512Z level=info msg="finished node evaluation" controller_path=/ controller_id="" trace_id=f008df4bb39c0f086fd9a54b44070b16 node_id=tracing duration=37.297µs
ts=2024-06-21T12:23:36.188467331Z level=info msg="finished node evaluation" controller_path=/ controller_id="" trace_id=f008df4bb39c0f086fd9a54b44070b16 node_id=labelstore duration=20.412µs
ts=2024-06-21T12:23:36.188498044Z level=info msg="finished node evaluation" controller_path=/ controller_id="" trace_id=f008df4bb39c0f086fd9a54b44070b16 node_id=otel duration=12.802µs
ts=2024-06-21T12:23:36.188785287Z level=info msg="Using pod service account via in-cluster config" component_path=/ component_id=discovery.kubernetes.endpoints
ts=2024-06-21T12:23:36.18910082Z level=info msg="finished node evaluation" controller_path=/ controller_id="" trace_id=f008df4bb39c0f086fd9a54b44070b16 node_id=discovery.kubernetes.endpoints duration=583.458µs
ts=2024-06-21T12:23:36.189216746Z level=info msg="finished node evaluation" controller_path=/ controller_id="" trace_id=f008df4bb39c0f086fd9a54b44070b16 node_id=remotecfg duration=87.944µs
ts=2024-06-21T12:23:36.189238713Z level=info msg="finished complete graph evaluation" controller_path=/ controller_id="" trace_id=f008df4bb39c0f086fd9a54b44070b16 duration=101.341426ms
ts=2024-06-21T12:23:36.19108843Z level=info msg="scheduling loaded components and services"
ts=2024-06-21T12:23:36.191734655Z level=warn msg="Using the 0.0.0.0 address exposes this server to every network interface, which may facilitate Denial of Service attacks. Enable the feature gate to change the default and remove this warning." component_path=/ component_id=otelcol.receiver.otlp.httpreceiver documentation=https://github.com/open-telemetry/opentelemetry-collector/blob/main/docs/security-best-practices.md#safeguards-against-denial-of-service-attacks "feature gate ID"=component.UseLocalHostAsDefaultHost
ts=2024-06-21T12:23:36.192003454Z level=info msg="Starting GRPC server" component_path=/ component_id=otelcol.receiver.otlp.httpreceiver endpoint=0.0.0.0:4317
ts=2024-06-21T12:23:36.192486604Z level=warn msg="Using the 0.0.0.0 address exposes this server to every network interface, which may facilitate Denial of Service attacks. Enable the feature gate to change the default and remove this warning." component_path=/ component_id=otelcol.receiver.otlp.httpreceiver documentation=https://github.com/open-telemetry/opentelemetry-collector/blob/main/docs/security-best-practices.md#safeguards-against-denial-of-service-attacks "feature gate ID"=component.UseLocalHostAsDefaultHost
ts=2024-06-21T12:23:36.192578438Z level=info msg="Starting HTTP server" component_path=/ component_id=otelcol.receiver.otlp.httpreceiver endpoint=0.0.0.0:4318
ts=2024-06-21T12:23:36.290697046Z level=info msg="now listening for http traffic" service=http addr=0.0.0.0:12345
ts=2024-06-21T12:23:36.299715024Z level=info msg="starting cluster node" peers="" advertise_addr=127.0.0.1:12345
ts=2024-06-21T12:23:36.386277875Z level=info msg="peers changed" new_peers=alloy-fn52x
ts=2024-06-21T12:42:15.409563125Z level=warn msg="No node address found" component_path=/ component_id=discovery.kubernetes.nodes role=node err="host address unknown"
ts=2024-06-21T12:42:15.451319414Z level=warn msg="No node address found" component_path=/ component_id=discovery.kubernetes.nodes role=node err="host address unknown"
ts=2024-06-21T12:42:15.565374601Z level=warn msg="No node address found" component_path=/ component_id=discovery.kubernetes.nodes role=node err="host address unknown"
ts=2024-06-21T12:42:16.586348957Z level=warn msg="No node address found" component_path=/ component_id=discovery.kubernetes.nodes role=node err="host address unknown"
ts=2024-06-21T12:42:16.747126425Z level=warn msg="No node address found" component_path=/ component_id=discovery.kubernetes.nodes role=node err="host address unknown"
ts=2024-06-21T12:42:16.944391856Z level=warn msg="No node address found" component_path=/ component_id=discovery.kubernetes.nodes role=node err="host address unknown"
ts=2024-06-21T12:42:17.057814619Z level=warn msg="No node address found" component_path=/ component_id=discovery.kubernetes.nodes role=node err="host address unknown"
ts=2024-06-21T12:42:17.181480722Z level=warn msg="No node address found" component_path=/ component_id=discovery.kubernetes.nodes role=node err="host address unknown"
ts=2024-06-21T12:42:17.36967912Z level=warn msg="No node address found" component_path=/ component_id=discovery.kubernetes.nodes role=node err="host address unknown"
However, I do not see traces getting into Datadog
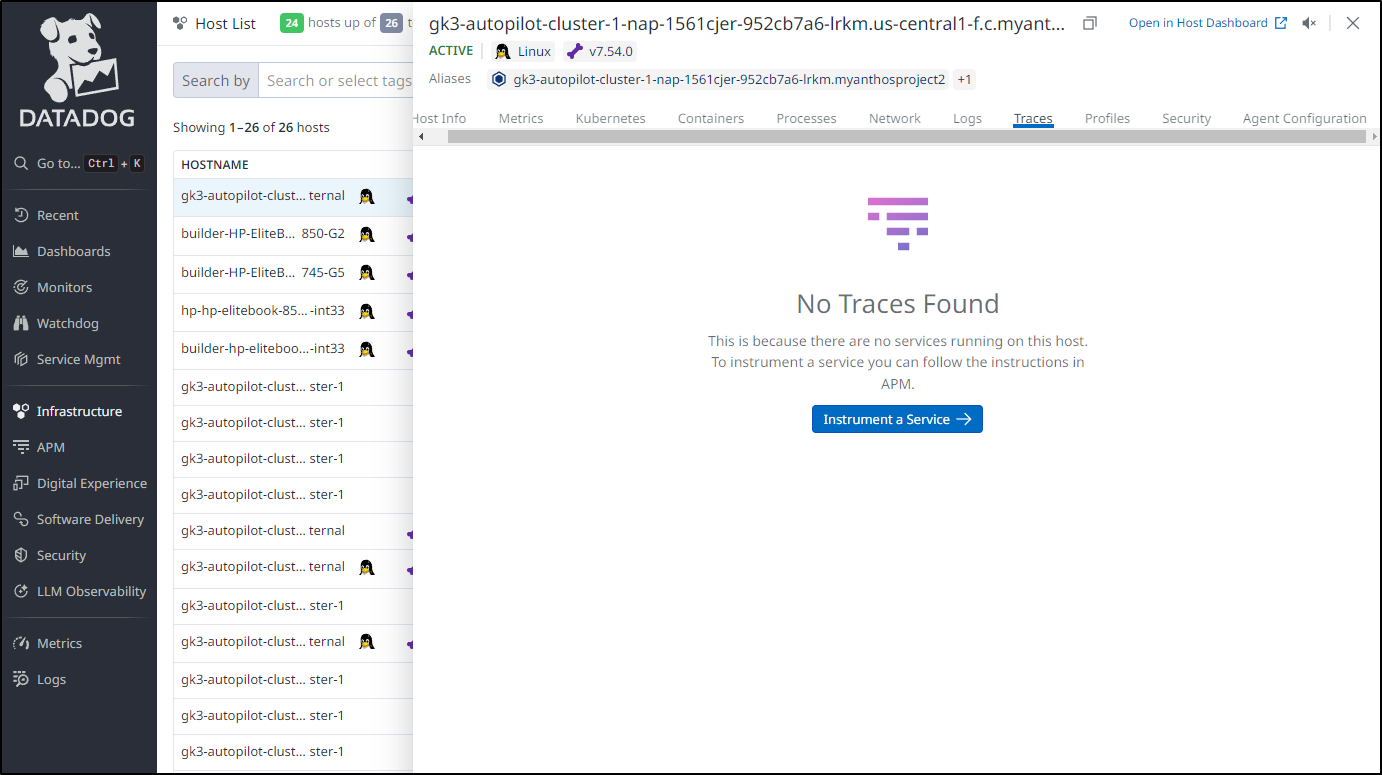
Which is seconded by the lack of services showing in my APM section
I wanted to test with a curl but GKE Warden blocks connecting
$ kubectl port-forward svc/datadog-agent 4318:4318
error: error upgrading connection: admission webhook "warden-validating.common-webhooks.networking.gke.io" denied the request: GKE Warden rejected the request because it violates one or more constraints.
Violations details: {"[denied by autogke-no-pod-connect-limitation]":["Cannot connect to pod default/datadog-agent-f7wgh, with annotation \"autopilot.gke.io/no-connect\": \"true\"."]}
Requested by user: 'isaac.johnson@gmail.com', groups: 'system:authenticated'.
Let me skip the warden on pods, see if that helps
$ kubectl annotate pods --all 'autopilot.gke.io/no-connect'=false
pod/addapp-55bc7b897-hcmxl annotate
pod/alloy-29fx9 annotate
pod/alloy-5t5lx annotate
pod/alloy-8q2lg annotate
pod/alloy-9rwtl annotate
pod/alloy-fksh4 annotate
pod/alloy-fn52x annotate
pod/alloy-ps26c annotate
pod/alloy-qjnq6 annotate
pod/alloy-x4m2j annotate
pod/alloy-xs54z annotate
pod/calculator-front-end-779895b444-zscgs annotate
pod/datadog-agent-cluster-agent-84b8c95486-cg4gj annotate
pod/divideapp-7b8b8985cf-mmsl8 annotate
pod/multiplyapp-c8c6bfb58-fj246 annotate
pod/redis-master-0 annotate
pod/redis-replicas-0 annotate
pod/redis-replicas-1 annotate
pod/redis-replicas-2 annotate
pod/subtractapp-86cdfccd9d-jxzqh annotate
pod/zipkin-798769ffc6-t2d4r annotate
--overwrite is false but found the following declared annotation(s): 'autopilot.gke.io/no-connect' already has a value (true)
--overwrite is false but found the following declared annotation(s): 'autopilot.gke.io/no-connect' already has a value (true)
--overwrite is false but found the following declared annotation(s): 'autopilot.gke.io/no-connect' already has a value (true)
--overwrite is false but found the following declared annotation(s): 'autopilot.gke.io/no-connect' already has a value (true)
--overwrite is false but found the following declared annotation(s): 'autopilot.gke.io/no-connect' already has a value (true)
--overwrite is false but found the following declared annotation(s): 'autopilot.gke.io/no-connect' already has a value (true)
--overwrite is false but found the following declared annotation(s): 'autopilot.gke.io/no-connect' already has a value (true)
--overwrite is false but found the following declared annotation(s): 'autopilot.gke.io/no-connect' already has a value (true)
--overwrite is false but found the following declared annotation(s): 'autopilot.gke.io/no-connect' already has a value (true)
--overwrite is false but found the following declared annotation(s): 'autopilot.gke.io/no-connect' already has a value (true)
Nope:
$ kubectl port-forward svc/datadog-agent 4318:4318
error: error upgrading connection: admission webhook "warden-validating.common-webhooks.networking.gke.io" denied the request: GKE Warden rejected the request because it violates one or more constraints.
Violations details: {"[denied by autogke-no-pod-connect-limitation]":["Cannot connect to pod default/datadog-agent-f7wgh, with annotation \"autopilot.gke.io/no-connect\": \"true\"."]}
Requested by user: 'isaac.johnson@gmail.com', groups: 'system:authenticated'.
I’m not giving up just yet. Let’s test sending Dapr right to the Datadog Agent
builder@DESKTOP-QADGF36:~/Workspaces/quickstarts/tutorials/distributed-calculator/deploy$ kubectl get configuration appconfig -o yaml > appconfig.yaml.new12
builder@DESKTOP-QADGF36:~/Workspaces/quickstarts/tutorials/distributed-calculator/deploy$ vi appconfig.yaml.new12
builder@DESKTOP-QADGF36:~/Workspaces/quickstarts/tutorials/distributed-calculator/deploy$ cat appconfig.yaml.new12
apiVersion: dapr.io/v1alpha1
kind: Configuration
metadata:
  annotations:
    kubectl.kubernetes.io/last-applied-configuration: |
      {"apiVersion":"dapr.io/v1alpha1","kind":"Configuration","metadata":{"annotations":{},"creationTimestamp":"2024-06-21T12:12:03Z","generation":1,"name":"appconfig","namespace":"default","resourceVersion":"27181","uid":"ee45755c-2929-427c-aa69-4656bd950d2b"},"spec":{"metric":{"enabled":true},"metrics":{"enabled":true},"tracing":{"otel":{"endpointAddress":"alloy.default.svc.cluster.local:4318","isSecure":false,"protocol":"http"},"samplingRate":"1","stdout":true}}}
  creationTimestamp: "2024-06-21T12:12:03Z"
  generation: 2
  name: appconfig
  namespace: default
  resourceVersion: "67509"
  uid: ee45755c-2929-427c-aa69-4656bd950d2b
spec:
  metric:
    enabled: true
  metrics:
    enabled: true
  tracing:
    otel:
      endpointAddress: datadog-agent.default.svc.cluster.local:4318
      isSecure: false
      protocol: http
    samplingRate: "1"
    stdout: true
builder@DESKTOP-QADGF36:~/Workspaces/quickstarts/tutorials/distributed-calculator/deploy$ kubectl apply -f ./appconfig.yaml.new12 && sleep 2 && kubectl delete pods -l app=subtract & kubectl delete pods -l app=multiply & kubectl del
ete pods -l app=add & kubectl delete pods -l app=divide & kubectl delete pod -l app=calculator-front-end &
[1] 27435
[2] 27436
[3] 27438
[4] 27439
[5] 27440
builder@DESKTOP-QADGF36:~/Workspaces/quickstarts/tutorials/distributed-calculator/deploy$ pod "divideapp-7b8b8985cf-mmsl8" deleted
pod "calculator-front-end-779895b444-zscgs" deleted
pod "multiplyapp-c8c6bfb58-fj246" deleted
pod "addapp-55bc7b897-hcmxl" deleted
configuration.dapr.io/appconfig configured
pod "subtractapp-86cdfccd9d-jxzqh" deleted
Then do some calcs
$ kubectl port-forward `kubectl get pod -l app=calculator-front-end -o go-template='{{range .items}}{{.metadata.name}}{{end}}'` 8080:8080
Forwarding from 127.0.0.1:8080 -> 8080
Forwarding from [::1]:8080 -> 8080
Handling connection for 8080
Handling connection for 8080
Handling connection for 8080
Handling connection for 8080
Handling connection for 8080
Seems Dapr is getting timeouts which leads me to believe Warden is still being a jerk
$ kubectl logs subtractapp-86cdfccd9d-tljsz -c daprd | tail -n2
time="2024-06-21T13:16:58.676803427Z" level=info msg="[CallLocal/subtractapp/subtract] Trace: 9a5a4b6b20d4b23f558fcd5f9a523e2f Span: 94499dd8f4d7c9cc/5e639c1e19e6e85c Time: [2024-06-21 13:16:55.169092471 +0000 UTC m=+46.832651686 ->  2024-06-21 13:16:55.320095563 +0000 UTC m=+46.983654778] Annotations: []" instance=subtractapp-86cdfccd9d-tljsz scope=dapr.runtime.trace type=log ver=1.13.4
2024/06/21 13:17:28 traces export: context deadline exceeded: retry-able request failure
Maybe I can edit that annotation out
$ kubectl edit ds datadog-agent
daemonset.apps/datadog-agent edited
$ kubectl get ds datadog-agent -o yaml | grep no-connect
        autopilot.gke.io/no-connect: "true"
Nope, just comes right back.
Maybe if I disable “Security Posture” since this stupid Warden is gumming up the works
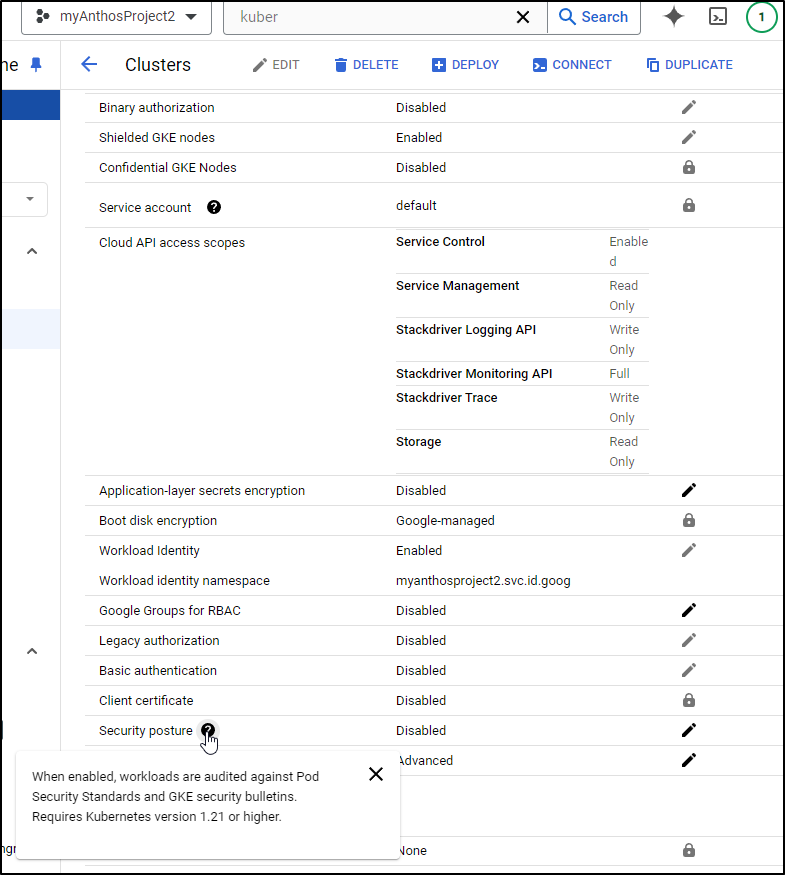
But even after disabling that I still see
$ kubectl port-forward svc/datadog-agent 4318:4318
error: error upgrading connection: admission webhook "warden-validating.common-webhooks.networking.gke.io" denied the request: GKE Warden rejected the request because it violates one or more constraints.
Violations details: {"[denied by autogke-no-pod-connect-limitation]":["Cannot connect to pod default/datadog-agent-f7wgh, with annotation \"autopilot.gke.io/no-connect\": \"true\"."]}
Requested by user: 'isaac.johnson@gmail.com', groups: 'system:authenticated'.
And removing or setting to false does not take
$ kubectl edit ds datadog-agent
daemonset.apps/datadog-agent edited

$ kubectl get ds datadog-agent -o yaml | grep no-connect
        autopilot.gke.io/no-connect: "true"
I’m paying for this cluster so I’m going to stop now and delete it. Perhaps i can come back later, but if it blocks routing services to the Datadog agent, I’m rather stuck (unless I move to a Dockerized agent on a different host)
I’ll try that as one last shot
builder@builder-T100:~$ docker run -d --cgroupns host --pid host --name dd-agent -v /var/run/docker.sock:/var/run/docker.sock:ro -v /proc/:/host/proc/:ro -v /sys/fs/cgroup/:/host/sys/fs/cgroup:ro -e DD_SITE=datadoghq.com -e DD_API_KEY=5asdfasdfasdfasdfasdfasdfasdfasdfasdfasdfsadfas1 -e DD_OTLP_CONFIG_RECEIVER_PROTOCOLS_GRPC_ENDPOINT=0.0.0.0:4317 -e DD_OTLP_CONFIG_RECEIVER_PROTOCOLS_HTTP_ENDPOINT=0.0.0.0:4318 -e DD_LOGS_ENABLED=true -e DD_OTLP_CONFIG_LOGS_ENABLED=true -p 54318:4318 -p 54317:4317 gcr.io/datadoghq/agent:7
locally 7: Pulling from datadoghq/agent
46a396a64134: Pull complete
Digest: sha256:58d53ba7fa4a7c291602fd69f983417f000142a6a78fa0ebf9bf0f9c67a62c0e
Status: Downloaded newer image for gcr.io/datadoghq/agent:7
7f2923602bbb1e2ae08078e4b7b1a4b95f518aa1e2b29ececb0f4acdad1d2d56
Now, GKE is clearly external, So I’ll try the insane thing of exposign OTLP HTTPS through my firewall on to this host
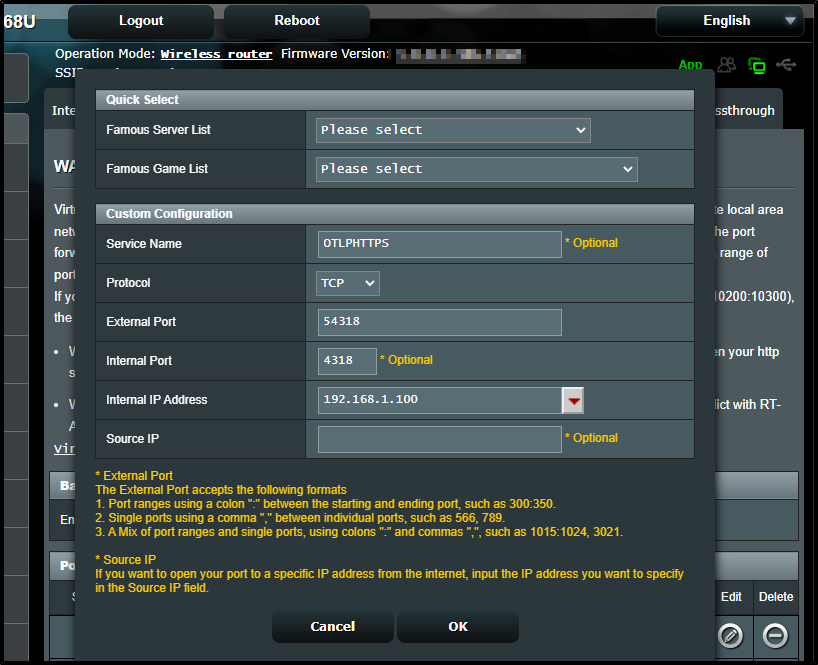
I’ll now try to route from GKE back through to my docker host which hopefully will take those OTLP traces and send them back to Datadog
builder@DESKTOP-QADGF36:~/Workspaces/quickstarts/tutorials/distributed-calculator/deploy$ kubectl get configuration appconfig -o yaml > appconfig.yaml.new13
builder@DESKTOP-QADGF36:~/Workspaces/quickstarts/tutorials/distributed-calculator/deploy$ vi appconfig.yaml.new13
builder@DESKTOP-QADGF36:~/Workspaces/quickstarts/tutorials/distributed-calculator/deploy$ cat appconfig.yaml.new13
apiVersion: dapr.io/v1alpha1
kind: Configuration
metadata:
  annotations:
    kubectl.kubernetes.io/last-applied-configuration: |
      {"apiVersion":"dapr.io/v1alpha1","kind":"Configuration","metadata":{"annotations":{},"creationTimestamp":"2024-06-21T12:12:03Z","generation":2,"name":"appconfig","namespace":"default","resourceVersion":"67509","uid":"ee45755c-2929-427c-aa69-4656bd950d2b"},"spec":{"metric":{"enabled":true},"metrics":{"enabled":true},"tracing":{"otel":{"endpointAddress":"datadog-agent.default.svc.cluster.local:4318","isSecure":false,"protocol":"http"},"samplingRate":"1","stdout":true}}}
  creationTimestamp: "2024-06-21T12:12:03Z"
  generation: 3
  name: appconfig
  namespace: default
  resourceVersion: "86109"
  uid: ee45755c-2929-427c-aa69-4656bd950d2b
spec:
  metric:
    enabled: true
  metrics:
    enabled: true
  tracing:
    otel:
      endpointAddress: 75.73.224.240:54318
      isSecure: false
      protocol: http
    samplingRate: "1"
    stdout: true
builder@DESKTOP-QADGF36:~/Workspaces/quickstarts/tutorials/distributed-calculator/deploy$ kubectl apply -f ./appconfig.yaml.new13 && sleep 2 && kubectl delete pods -l app=subtract & kubectl delete pods -l app=multiply & kubectl delete pods -l app=add & kubectl delete pods -l app=divide & kubectl delete pod -l app=calculator-front-end &
[1] 32679
[2] 32680
[3] 32681
[4] 32683
[5] 32684
builder@DESKTOP-QADGF36:~/Workspaces/quickstarts/tutorials/distributed-calculator/deploy$ pod "multiplyapp-c8c6bfb58-s5nh8" deleted
pod "divideapp-7b8b8985cf-62tcw" deleted
pod "addapp-55bc7b897-ns5sj" deleted
pod "calculator-front-end-779895b444-zb8kz" deleted
configuration.dapr.io/appconfig configured
pod "subtractapp-86cdfccd9d-tljsz" deleted
I’ll fire some calcs again
$ kubectl port-forward `kubectl get pod -l app=calculator-front-end -o go-template='{{range .items}}{{.metadata.name}}{{end}}'` 8080:8080
Forwarding from 127.0.0.1:8080 -> 8080
Forwarding from [::1]:8080 -> 8080
Handling connection for 8080
Handling connection for 8080
Handling connection for 8080
Handling connection for 8080
Handling connection for 8080
Sadly my dockerhost couldnt keep up and took a nose dive
I’ll come back later….
$ gcloud container clusters delete autopilot-cluster-1 --project=myanthosproject2 --zone=us-central1
The following clusters will be deleted.
 - [autopilot-cluster-1] in [us-central1]

Do you want to continue (Y/n)?  Y

Deleting cluster autopilot-cluster-1...⠼
GKE Standard
I’m going to pivot to create a GKE Standard cluster with the hops this doesnt have the same troubles with “Warden”.
$ gcloud container clusters create my-gke-cluster --project myanthosproject2 --zone us-central1-a   --num-nodes 3   --machine-type n1-standard-4 --cluster-version=latest
Default change: VPC-native is the default mode during cluster creation for versions greater than 1.21.0-gke.1500. To create advanced routes based clusters, please pass the `--no-enable-ip-alias` flag
Note: Your Pod address range (`--cluster-ipv4-cidr`) can accommodate at most 1008 node(s).
Creating cluster my-gke-cluster in us-central1-a... Cluster i
When done
$ gcloud container clusters create my-gke-cluster --project myanthosproject2 --zone us-central1-a   --num-nodes 3   --machine-type n1-standard-4 --cluster-version=latest
Default change: VPC-native is the default mode during cluster creation for versions greater than 1.21.0-gke.1500. To create advanced routes based clusters, please pass the `--no-enable-ip-alias` flag
Note: Your Pod address range (`--cluster-ipv4-cidr`) can accommodate at most 1008 node(s).
Creating cluster my-gke-cluster in us-central1-a... Cluster is being health-checked (master is healthy)...done.
Created [https://container.googleapis.com/v1/projects/myanthosproject2/zones/us-central1-a/clusters/my-gke-cluster].
To inspect the contents of your cluster, go to: https://console.cloud.google.com/kubernetes/workload_/gcloud/us-central1-a/my-gke-cluster?project=myanthosproject2
kubeconfig entry generated for my-gke-cluster.
NAME            LOCATION       MASTER_VERSION      MASTER_IP     MACHINE_TYPE   NODE_VERSION        NUM_NODES  STATUS
my-gke-cluster  us-central1-a  1.29.4-gke.1043002  34.44.82.217  n1-standard-4  1.29.4-gke.1043002  3          RUNNING
We can login
$ gcloud container clusters get-credentials my-gke-cluster --zone us-central1-a --project myanthosproject2
Fetching cluster endpoint and auth data.
kubeconfig entry generated for my-gke-cluster.
I always like to check nodes in the cluster as a last step
$ kubectl get nodes
NAME                                            STATUS   ROLES    AGE     VERSION
gke-my-gke-cluster-default-pool-26739230-5g61   Ready    <none>   3m29s   v1.29.4-gke.1043002
gke-my-gke-cluster-default-pool-26739230-gf30   Ready    <none>   3m29s   v1.29.4-gke.1043002
gke-my-gke-cluster-default-pool-26739230-x0mb   Ready    <none>   3m29s   v1.29.4-gke.1043002
As I’m on a new laptop, I’ll again add the Datadog Helm repo and update
$ helm repo add datadog https://helm.datadoghq.com
"datadog" has been added to your repositories

$ helm repo update
Hang tight while we grab the latest from your chart repositories...
...Successfully got an update from the "datadog" chart repository
...Successfully got an update from the "nicholaswilde" chart repository
...Successfully got an update from the "bitnami" chart repository
Update Complete. ⎈Happy Helming!⎈
I’ll add that Datadog API key as a secret
$ kubectl create secret generic datadog-secret --from-literal api-key=5asdfasdfasdfasdfasdfasdfasdfasdfasdfasdfsadfas1
secret/datadog-secret created
Then create a new values file. I do not need the GKE Autopilot settings this time
$ cat dd-values.yaml
datadog:
  apiKeyExistingSecret: datadog-secret
  site: datadoghq.com
  otlp:
    logs:
      enabled: true
    receiver:
      protocols:
        grpc:
          enabled: true
          endpoint: 0.0.0.0:4317
        http:
          enabled: true
          endpoint: 0.0.0.0:4318
Lastly, I can helm install the Datadog agent
$ helm install datadog-agent -f dd-values.yaml datadog/datadog
NAME: datadog-agent
LAST DEPLOYED: Sat Jun 22 08:48:17 2024
NAMESPACE: default
STATUS: deployed
REVISION: 1
TEST SUITE: None
NOTES:
Datadog agents are spinning up on each node in your cluster. After a few
minutes, you should see your agents starting in your event stream:
    https://app.datadoghq.com/event/explorer
You disabled creation of Secret containing API key, therefore it is expected
that you create Secret named 'datadog-secret' which includes a key called 'api-key' containing the API key.

###################################################################################
####   WARNING: Cluster-Agent should be deployed in high availability mode     ####
###################################################################################

The Cluster-Agent should be in high availability mode because the following features
are enabled:
* Admission Controller

To run in high availability mode, our recommendation is to update the chart
configuration with:
* set `clusterAgent.replicas` value to `2` replicas .
* set `clusterAgent.createPodDisruptionBudget` to `true`.
This is looking way better than before
$ kubectl get pods
NAME                                           READY   STATUS    RESTARTS   AGE
datadog-agent-8mgpt                            3/3     Running   0          82s
datadog-agent-cluster-agent-586974cb94-qktbf   1/1     Running   0          82s
datadog-agent-q4j8c                            3/3     Running   0          82s
datadog-agent-vmlcr                            3/3     Running   0          82s
As before, I’ll want the Grafana Alloy configmap setup first
$ cat ./datadog-alloy-config-cm.yaml
apiVersion: v1
kind: ConfigMap
metadata:
  name: alloy-config
data:
  config.alloy: |
    logging {
      level = "info"
      format = "logfmt"
    }

    // Send to New Relic
    otelcol.exporter.otlphttp "datadog" {
      client {
        endpoint = "http://datadog-agent.default.svc.cluster.local:4318"
      }
    }

    // Collect OTLP
    otelcol.receiver.otlp "httpreceiver" {
      grpc {
        endpoint = "0.0.0.0:4317"
      }

      http {
        endpoint = "0.0.0.0:4318"
      }

      output {
        metrics = [otelcol.processor.batch.default.input]
        logs    = [otelcol.processor.batch.default.input]
        traces  = [otelcol.processor.batch.default.input]
      }
    }

    // Process and send
    otelcol.processor.batch "default" {

      output {
        metrics = [otelcol.exporter.otlphttp.datadog.input]
        logs    = [otelcol.exporter.otlphttp.datadog.input]
        traces  = [otelcol.exporter.otlphttp.datadog.input]
      }
    }
    discovery.kubernetes "podmetrics" {
      role = "pod"
    }

    discovery.kubernetes "nodes" {
      role = "node"
    }

    discovery.kubernetes "services" {
      role = "service"
    }

    discovery.kubernetes "endpoints" {
      role = "endpoints"
    }

$ kubectl apply -f ./datadog-alloy-config-cm.yaml
configmap/alloy-config created
Then add Grafana Alloy helm repo and update
$ helm repo add grafana https://grafana.github.io/helm-charts
h"grafana" has been added to your repositories

$ helm repo update
Hang tight while we grab the latest from your chart repositories...
...Successfully got an update from the "datadog" chart repository
...Successfully got an update from the "nicholaswilde" chart repository
...Successfully got an update from the "grafana" chart repository
...Successfully got an update from the "bitnami" chart repository
Update Complete. ⎈Happy Helming!⎈
And install
$ helm install -f ./datadog-alloy-config-cm.yaml alloy grafana/alloy
NAME: alloy
LAST DEPLOYED: Sat Jun 22 08:54:44 2024
NAMESPACE: default
STATUS: deployed
REVISION: 1
TEST SUITE: None
NOTES:
Welcome to Grafana Alloy!
I’ll add Dapr
$ dapr init -k
⌛  Making the jump to hyperspace...
ℹ️  Note: To install Dapr using Helm, see here: https://docs.dapr.io/getting-started/install-dapr-kubernetes/#install-with-helm-advanced

ℹ️  Container images will be pulled from Docker Hub
✅  Deploying the Dapr control plane with latest version to your cluster...
✅  Deploying the Dapr dashboard with latest version to your cluster...
✅  Success! Dapr has been installed to namespace dapr-system. To verify, run `dapr status -k' in your terminal. To get started, go here: https://aka.ms/dapr-getting-started
then Redis (which we use for our example statestore)
$ helm install redis bitnami/redis
NAME: redis
LAST DEPLOYED: Sat Jun 22 08:56:13 2024
NAMESPACE: default
STATUS: deployed
REVISION: 1
TEST SUITE: None
NOTES:
CHART NAME: redis
CHART VERSION: 19.5.5
APP VERSION: 7.2.5

** Please be patient while the chart is being deployed **

Redis® can be accessed on the following DNS names from within your cluster:

    redis-master.default.svc.cluster.local for read/write operations (port 6379)
    redis-replicas.default.svc.cluster.local for read-only operations (port 6379)


To get your password run:

    export REDIS_PASSWORD=$(kubectl get secret --namespace default redis -o jsonpath="{.data.redis-password}" | base64 -d)

To connect to your Redis® server:

1. Run a Redis® pod that you can use as a client:

   kubectl run --namespace default redis-client --restart='Never'  --env REDIS_PASSWORD=$REDIS_PASSWORD  --image docker.io/bitnami/redis:7.2.5-debian-12-r0 --command -- sleep infinity

   Use the following command to attach to the pod:

   kubectl exec --tty -i redis-client \
   --namespace default -- bash

2. Connect using the Redis® CLI:
   REDISCLI_AUTH="$REDIS_PASSWORD" redis-cli -h redis-master
   REDISCLI_AUTH="$REDIS_PASSWORD" redis-cli -h redis-replicas

To connect to your database from outside the cluster execute the following commands:

    kubectl port-forward --namespace default svc/redis-master 6379:6379 &
    REDISCLI_AUTH="$REDIS_PASSWORD" redis-cli -h 127.0.0.1 -p 6379

WARNING: There are "resources" sections in the chart not set. Using "resourcesPreset" is not recommended for production. For production installations, please set the following values according to your workload needs:
  - replica.resources
  - master.resources
+info https://kubernetes.io/docs/concepts/configuration/manage-resources-containers/
I want to prove things out with zipkin (the app) first, so lets launch that
$ kubectl create deployment zipkin --image openzipkin/zipkin
deployment.apps/zipkin created

# Create service as well
$ kubectl expose deployment zipkin --type=ClusterIP --port=9411 --target-port=9411
service/zipkin exposed
I’ll now add the calculator app from the Dapr quickstarts
builder@LuiGi:~/Workspaces/quickstarts/tutorials/distributed-calculator/deploy$ kubectl apply -f .
configuration.dapr.io/appconfig created
deployment.apps/subtractapp created
deployment.apps/addapp created
deployment.apps/divideapp created
deployment.apps/multiplyapp created
service/calculator-front-end created
deployment.apps/calculator-front-end created
component.dapr.io/statestore created
At this point we should have a full stack
$ kubectl get pods
NAME                                           READY   STATUS    RESTARTS   AGE
addapp-dcff99c45-zz8ms                         2/2     Running   0          20m
alloy-kz69h                                    2/2     Running   0          77m
alloy-lw2fv                                    2/2     Running   0          77m
alloy-ssjtc                                    2/2     Running   0          77m
calculator-front-end-8d968cff6-tcbxj           2/2     Running   0          20m
datadog-agent-8mgpt                            3/3     Running   0          83m
datadog-agent-cluster-agent-586974cb94-qktbf   1/1     Running   0          83m
datadog-agent-q4j8c                            3/3     Running   0          83m
datadog-agent-vmlcr                            3/3     Running   0          83m
divideapp-54565fdfb7-dz2kn                     2/2     Running   0          20m
multiplyapp-cb9f469f4-qwhwt                    2/2     Running   0          20m
redis-master-0                                 1/1     Running   0          75m
redis-replicas-0                               1/1     Running   0          75m
redis-replicas-1                               1/1     Running   0          75m
redis-replicas-2                               1/1     Running   0          74m
subtractapp-5b6d4cd9db-gfshv                   2/2     Running   0          20m
zipkin-7dc6bbcb-wcm5k                          1/1     Running   0          65m
Let’s port-forward and do some calculations
$ kubectl port-forward `kubectl get pod -l app=calculator-front-end -o go-template='{{range .items}}{{.metadata.name}}{{end}}'` 8080:8080
Forwarding from 127.0.0.1:8080 -> 8080
Forwarding from [::1]:8080 -> 8080
Handling connection for 8080
Handling connection for 8080
Handling connection for 8080
Handling connection for 8080
Handling connection for 8080
I’ll now port-forward to Zipkin
$ kubectl port-forward `kubectl get pod -l app=zipkin -o go-template='{{range .items}}{{.metadata.name}}{{end}}'` 9411:9411
Forwarding from 127.0.0.1:9411 -> 9411
Forwarding from [::1]:9411 -> 9411
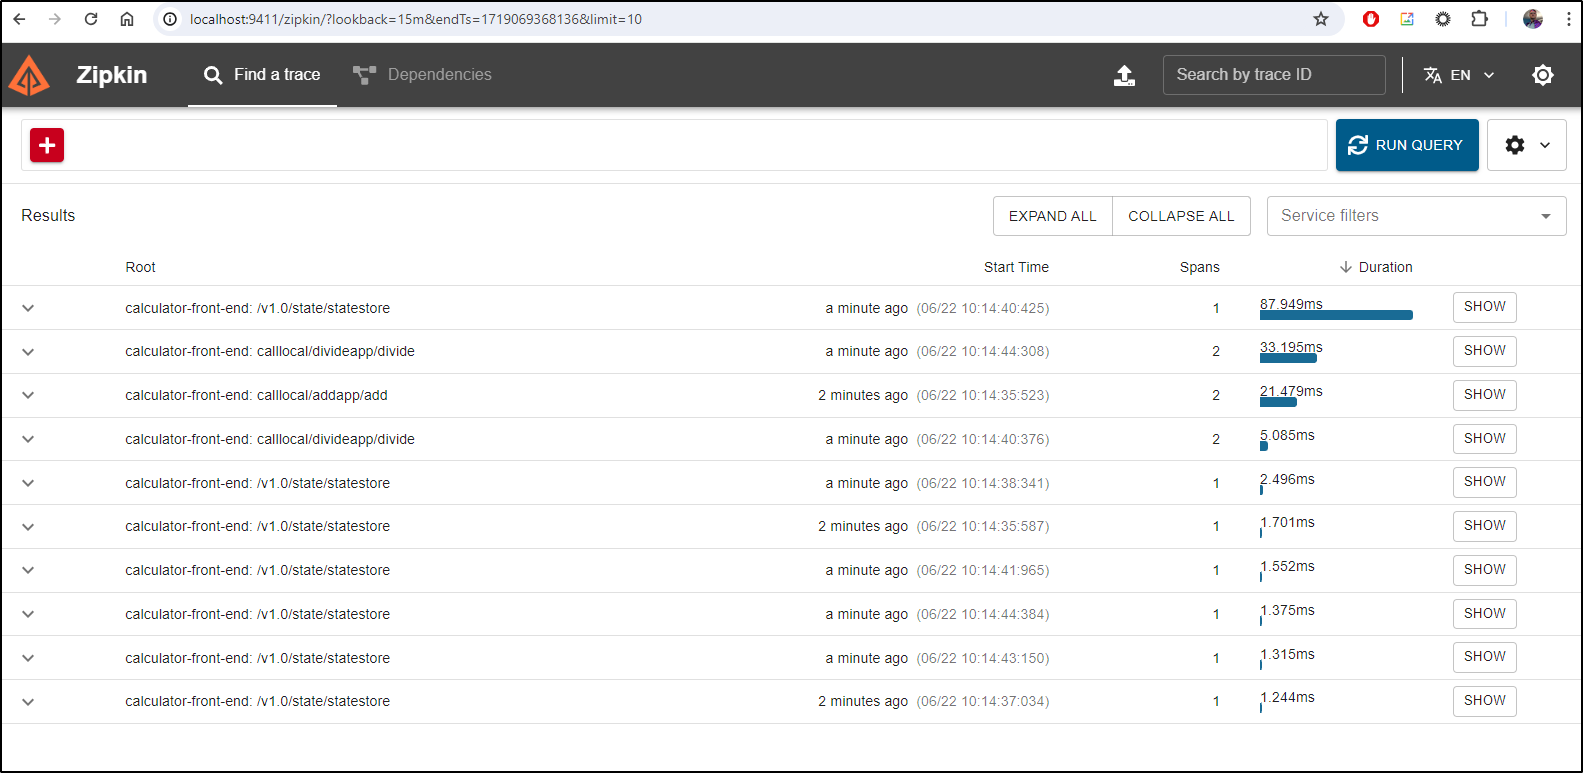
I can browse traces in the Zipkin app
Sending traces to Alloy
Next, I’ll make an appconfig that sends to the alloy collector service (which should send on to Datadog)
$ diff appconfig.toalloy.yaml ./deploy/appconfig.yaml
6,9d5
<   metric:
<     enabled: true
<   metrics:
<     enabled: true
11,14d6
<     otel:
<       endpointAddress: alloy.default.svc.cluster.local:4318
<       isSecure: false
<       protocol: http
16c8,9
<     stdout: true
---
>     zipkin:
>       endpointAddress: "http://zipkin.default.svc.cluster.local:9411/api/v2/spans"
We can see the file:
$ cat ./appconfig.toalloy.yaml
apiVersion: dapr.io/v1alpha1
kind: Configuration
metadata:
  name: appconfig
spec:
  metric:
    enabled: true
  metrics:
    enabled: true
  tracing:
    otel:
      endpointAddress: alloy.default.svc.cluster.local:4318
      isSecure: false
      protocol: http
    samplingRate: "1"
    stdout: true
I’ll now swap them out
$ kubectl delete configuration appconfig && kubec
tl apply -f /home/builder/Workspaces/quickstarts/tutorials/distributed-calculator/appconfig.toalloy.yaml
And rotate the pods
$ kubectl delete pods -l app=subtract & kubectl delete pods -l app=multiply & kubectl delete pods -l app=add & kubectl delete pods -l app=divide & kubectl delete pod -l app=calculator-front-end
I now see them rotated
$ kubectl get pods
NAME                                           READY   STATUS    RESTARTS   AGE
addapp-dcff99c45-h6qks                         2/2     Running   0          67s
alloy-kz69h                                    2/2     Running   0          93m
alloy-lw2fv                                    2/2     Running   0          93m
alloy-ssjtc                                    2/2     Running   0          93m
calculator-front-end-8d968cff6-lnbdx           2/2     Running   0          67s
datadog-agent-8mgpt                            3/3     Running   0          100m
datadog-agent-cluster-agent-586974cb94-qktbf   1/1     Running   0          100m
datadog-agent-q4j8c                            3/3     Running   0          100m
datadog-agent-vmlcr                            3/3     Running   0          100m
divideapp-54565fdfb7-zd942                     2/2     Running   0          67s
multiplyapp-cb9f469f4-lwsmk                    2/2     Running   0          67s
redis-master-0                                 1/1     Running   0          92m
redis-replicas-0                               1/1     Running   0          92m
redis-replicas-1                               1/1     Running   0          91m
redis-replicas-2                               1/1     Running   0          91m
subtractapp-5b6d4cd9db-b4fbk                   2/2     Running   0          67s
zipkin-7dc6bbcb-wcm5k                          1/1     Running   0          82m
Again, port-forward and do some calculations
$ kubectl port-forward `kubectl get pod -l app=calculator-front-end -o go-template='{{range .items}}{{.metadata.name}}{{end}}'` 8080:8080
Forwarding from 127.0.0.1:8080 -> 8080
Forwarding from [::1]:8080 -> 8080
Handling connection for 8080
Handling connection for 8080
Handling connection for 8080
Handling connection for 8080
Handling connection for 8080
I’m not seeing traces, but I also note that the cluster agent shows “inactive”
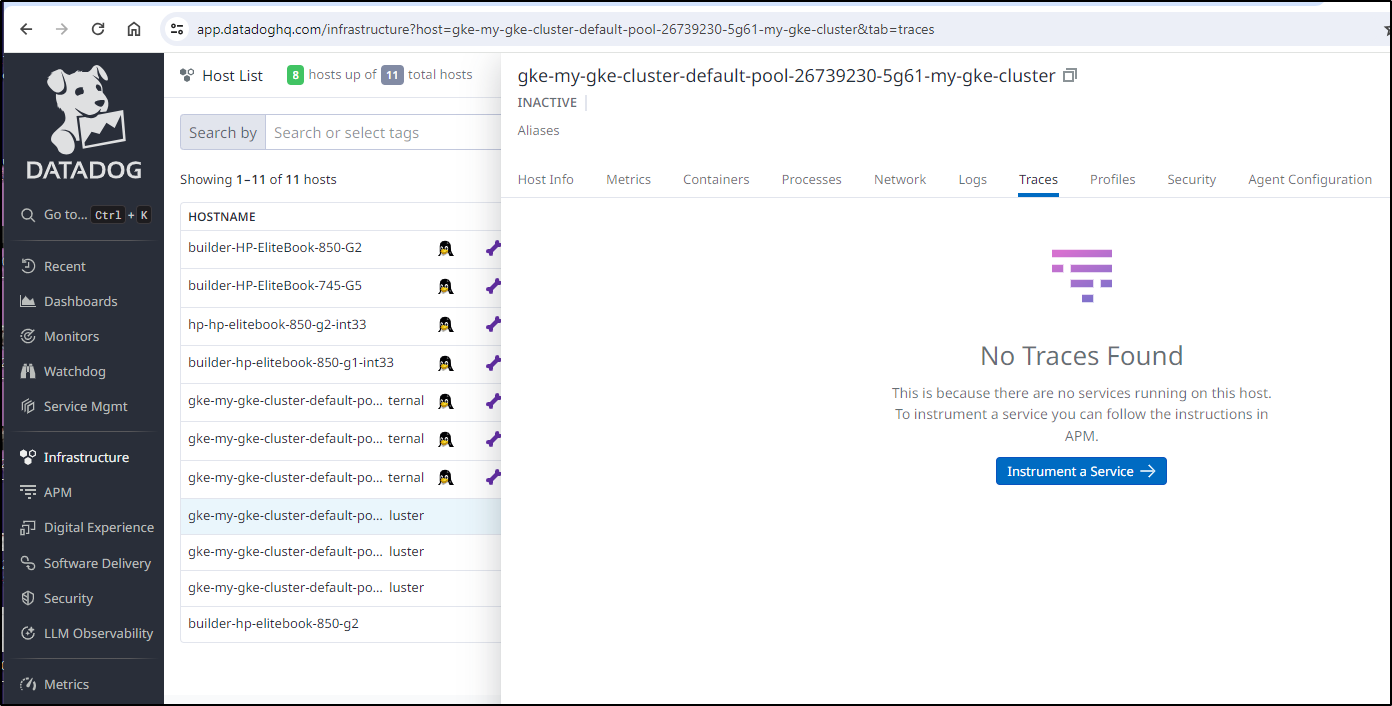
soon I did see them active
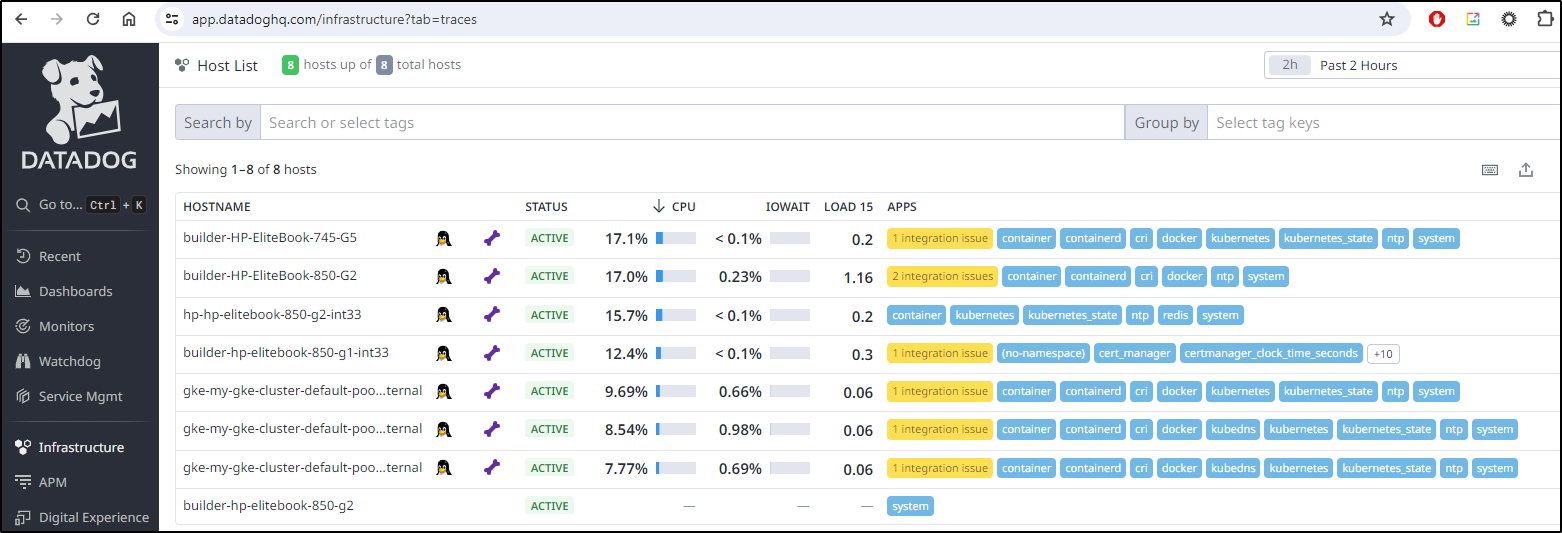
I tried some more calculations, however I saw nothing the Datadog agent. Alloy looks off to me too - I’m not seeing the OTLP ports listed
$ kubectl logs alloy-ssjtc | tail -n 5
ts=2024-06-22T13:55:08.436789571Z level=info msg="finished complete graph evaluation" controller_path=/ controller_id="" trace_id=0d464479ee71284701c1cac789776cad duration=2.931115ms
ts=2024-06-22T13:55:08.436916304Z level=info msg="scheduling loaded components and services"
ts=2024-06-22T13:55:08.437679204Z level=info msg="starting cluster node" peers="" advertise_addr=127.0.0.1:12345
ts=2024-06-22T13:55:08.437962801Z level=info msg="now listening for http traffic" service=http addr=0.0.0.0:12345
ts=2024-06-22T13:55:08.438116857Z level=info msg="peers changed" new_peers=alloy-ssjtc
What did I do? I think I goofed and gave Alloy Helm the config map values by accident!
$ helm get values alloy
USER-SUPPLIED VALUES:
apiVersion: v1
data:
  config.alloy: |
    logging {
      level = "info"
      format = "logfmt"
    }

    // Send to New Relic
    otelcol.exporter.otlphttp "datadog" {
      client {
        endpoint = "http://datadog-agent.default.svc.cluster.local:4318"
      }
    }

    // Collect OTLP
    otelcol.receiver.otlp "httpreceiver" {
      grpc {
        endpoint = "0.0.0.0:4317"
      }

      http {
        endpoint = "0.0.0.0:4318"
      }

      output {
        metrics = [otelcol.processor.batch.default.input]
        logs    = [otelcol.processor.batch.default.input]
        traces  = [otelcol.processor.batch.default.input]
      }
    }

    // Process and send
    otelcol.processor.batch "default" {

      output {
        metrics = [otelcol.exporter.otlphttp.datadog.input]
        logs    = [otelcol.exporter.otlphttp.datadog.input]
        traces  = [otelcol.exporter.otlphttp.datadog.input]
      }
    }
    discovery.kubernetes "podmetrics" {
      role = "pod"
    }

    discovery.kubernetes "nodes" {
      role = "node"
    }

    discovery.kubernetes "services" {
      role = "service"
    }

    discovery.kubernetes "endpoints" {
      role = "endpoints"
    }
kind: ConfigMap
metadata:
  name: alloy-config
Let’s fix that
$ cat alloy-values.yaml
alloy:
  configMap:
    create: false
    key: config.alloy
    name: alloy-config
  extraPorts:
  - name: otelgrpc
    port: 4317
    protocol: TCP
    targetPort: 4317
  - name: otelhttp
    port: 4318
    protocol: TCP
    targetPort: 4318
  - name: zipkin
    port: 9411
    protocol: TCP
    targetPort: 9411
  listenPort: 12345

$ helm upgrade alloy -f ./alloy-values.yaml grafana/alloy
Release "alloy" has been upgraded. Happy Helming!
NAME: alloy
LAST DEPLOYED: Sat Jun 22 11:17:05 2024
NAMESPACE: default
STATUS: deployed
REVISION: 2
TEST SUITE: None
NOTES:
Welcome to Grafana Alloy!
Once I saw the pods rotate, then I did some more calculations to generate some traces
$ kubectl port-forward `kubectl get pod -l app=calculator-front-end -o go-template='{{range .items}}{{.metadata.name}}{{end}}'` 8080:8080
Forwarding from 127.0.0.1:8080 -> 8080
Forwarding from [::1]:8080 -> 8080
Handling connection for 8080
Handling connection for 8080
Handling connection for 8080
Handling connection for 8080
Handling connection for 8080
I can check a pod and see the Dapr sidecar is sending traces
$ kubectl logs subtractapp-5b6d4cd9db-b4fbk -c daprd | tail -n5
time="2024-06-22T16:07:13.879189845Z" level=info msg="[CallLocal/subtractapp/subtract] Trace: c6536275e6f4f0c0ba2f0db714d9798f Span: 15ec6b752f79ea2c/b93b2d7be954fae6 Time: [2024-06-22 16:07:12.492122926 +0000 UTC m=+2359.364770756 ->  2024-06-22 16:07:12.494560101 +0000 UTC m=+2359.367207931] Annotations: []" instance=subtractapp-5b6d4cd9db-b4fbk scope=dapr.runtime.trace type=log ver=1.13.4
2024/06/22 16:07:38 traces export: context deadline exceeded: retry-able request failure
2024/06/22 16:08:13 traces export: context deadline exceeded: retry-able request failure
time="2024-06-22T16:19:28.971160508Z" level=info msg="[CallLocal/subtractapp/subtract] Trace: 2f3dfc0ef725dcba9bb750dc60e1f7c8 Span: dbd234e8aa8db4ba/8d093c2e184715a8 Time: [2024-06-22 16:19:24.793231741 +0000 UTC m=+3091.665879571 ->  2024-06-22 16:19:24.796697132 +0000 UTC m=+3091.669344962] Annotations: []" instance=subtractapp-5b6d4cd9db-b4fbk scope=dapr.runtime.trace type=log ver=1.13.4
time="2024-06-22T16:19:28.97122049Z" level=info msg="[CallLocal/subtractapp/subtract] Trace: bea5aad8b7afe77cfd280768181dfa75 Span: fa8b3c03081eec08/2f3f9c9ec7cdf494 Time: [2024-06-22 16:19:27.237883366 +0000 UTC m=+3094.110531226 ->  2024-06-22 16:19:27.240841534 +0000 UTC m=+3094.113489394] Annotations: []" instance=subtractapp-5b6d4cd9db-b4fbk scope=dapr.runtime.trace type=log ver=1.13.4
However, the Alloy service seems to not be able to reach the datadog agent
$ kubectl logs alloy-74dgm | tail -n4
ts=2024-06-22T16:21:22.683537452Z level=info msg="Exporting failed. Will retry the request after interval." component_path=/ component_id=otelcol.exporter.otlphttp.datadog error="failed to make an HTTP request: Post \"http://datadog-agent.default.svc.cluster.local:4318/v1/traces\": dial tcp 34.118.237.234:4318: connect: connection refused" interval=31.332955855s
ts=2024-06-22T16:21:27.699726702Z level=info msg="Exporting failed. Will retry the request after interval." component_path=/ component_id=otelcol.exporter.otlphttp.datadog error="failed to make an HTTP request: Post \"http://datadog-agent.default.svc.cluster.local:4318/v1/traces\": dial tcp 34.118.237.234:4318: connect: connection refused" interval=34.493289318s
ts=2024-06-22T16:21:29.804823655Z level=info msg="Exporting failed. Will retry the request after interval." component_path=/ component_id=otelcol.exporter.otlphttp.datadog error="failed to make an HTTP request: Post \"http://datadog-agent.default.svc.cluster.local:4318/v1/traces\": dial tcp 34.118.237.234:4318: connect: connection refused" interval=21.768145438s
ts=2024-06-22T16:21:30.634512087Z level=info msg="Exporting failed. Will retry the request after interval." component_path=/ component_id=otelcol.exporter.otlphttp.datadog error="failed to make an HTTP request: Post \"http://datadog-agent.default.svc.cluster.local:4318/v1/traces\": dial tcp 34.118.237.234:4318: connect: connection refused" interval=32.806618111s
I can see the service
$ kubectl get svc datadog-agent
NAME            TYPE        CLUSTER-IP       EXTERNAL-IP   PORT(S)                               AGE
datadog-agent   ClusterIP   34.118.237.234   <none>        8125/UDP,8126/TCP,4317/TCP,4318/TCP   153m
Let’s force a local trace
$ kubectl port-forward svc/datadog-agent 4318:431
8
Forwarding from 127.0.0.1:4318 -> 4318
Forwarding from [::1]:4318 -> 4318
I tried twice (once when remote and again at home on wifi), but both times I tried to push a curl payload it killed the port-forward
$ kubectl port-forward svc/datadog-agent 4318:4318
Forwarding from 127.0.0.1:4318 -> 4318
Forwarding from [::1]:4318 -> 4318
Handling connection for 4318
E0622 12:36:18.836496   96268 portforward.go:409] an error occurred forwarding 4318 -> 4318: error forwarding port 4318 to pod 3bbd4d24c343f6620b63fc9ee44d9b04b388b4e282092d7e2c3217aefacabb91, uid : failed to execute portforward in network namespace "/var/run/netns/cni-c660f0a9-8cfb-781e-aca5-cf847ce8b745": failed to connect to localhost:4318 inside namespace "3bbd4d24c343f6620b63fc9ee44d9b04b388b4e282092d7e2c3217aefacabb91", IPv4: dial tcp4 127.0.0.1:4318: connect: connection refused IPv6 dial tcp6 [::1]:4318: connect: cannot assign requested address
error: lost connection to pod
I then port-foward’ed to a pod and pushed a trace
$ kubectl port-forward alloy-h55tx 4318:4318
Forwarding from 127.0.0.1:4318 -> 4318
Forwarding from [::1]:4318 -> 4318
Handling connection for 4318

# another window
$ curl -i http://localhost:4318/v1/traces -X POST -H "Content-Type: application/json" -d @test_span.json
HTTP/1.1 200 OK
Content-Type: application/json
Date: Sat, 22 Jun 2024 17:38:07 GMT
Content-Length: 21

{"partialSuccess":{}}
However, from the logs, we see rejection
$ kubectl logs alloy-h55tx | tail -n 2
ts=2024-06-22T17:38:36.61598189Z level=info msg="Exporting failed. Will retry the request after interval." component_path=/ component_id=otelcol.exporter.otlphttp.datadog error="failed to make an HTTP request: Post \"http://datadog-agent.default.svc.cluster.local:4318/v1/traces\": dial tcp 34.118.237.234:4318: connect: connection refused" interval=20.635253505s
ts=2024-06-22T17:38:57.268904846Z level=info msg="Exporting failed. Will retry the request after interval." component_path=/ component_id=otelcol.exporter.otlphttp.datadog error="failed to make an HTTP request: Post \"http://datadog-agent.default.svc.cluster.local:4318/v1/traces\": dial tcp 34.118.237.234:4318: connect: connection refused" interval=35.316618214s
I tried going direct to the datadog agent service
$ kubectl port-forward svc/datadog-agent 4318:4318
Forwarding from 127.0.0.1:4318 -> 4318
Forwarding from [::1]:4318 -> 4318
Handling connection for 4318
E0622 12:40:00.424566   97231 portforward.go:409] an error occurred forwarding 4318 -> 4318: error forwarding port 4318 to pod 3bbd4d24c343f6620b63fc9ee44d9b04b388b4e282092d7e2c3217aefacabb91, uid : failed to execute portforward in network namespace "/var/run/netns/cni-c660f0a9-8cfb-781e-aca5-cf847ce8b745": failed to connect to localhost:4318 inside namespace "3bbd4d24c343f6620b63fc9ee44d9b04b388b4e282092d7e2c3217aefacabb91", IPv4: dial tcp4 127.0.0.1:4318: connect: connection refused IPv6 dial tcp6 [::1]:4318: connect: cannot assign requested address
error: lost connection to pod

$ curl -i http://localhost:4318/v1/traces -X POST -H "Content-Type: application/json" -d @test_span.json
curl: (52) Empty reply from server
Lastly, going right to the pod failed
$ kubectl port-forward datadog-agent-8mgpt 4318:4
318
Forwarding from 127.0.0.1:4318 -> 4318
Forwarding from [::1]:4318 -> 4318
Handling connection for 4318
E0622 12:41:52.320710   97740 portforward.go:409] an error occurred forwarding 4318 -> 4318: error forwarding port 4318 to pod 7ded8de93e61efebc6469d3381f6961a561c813e0a8531a0fed1948dd470a81d, uid : failed to execute portforward in network namespace "/var/run/netns/cni-1f3899e5-4ae9-d9ea-2e40-a9aaa49c6cc9": failed to connect to localhost:4318 inside namespace "7ded8de93e61efebc6469d3381f6961a561c813e0a8531a0fed1948dd470a81d", IPv4: dial tcp4 127.0.0.1:4318: connect: connection refused IPv6 dial tcp6 [::1]:4318: connect: cannot assign requested address
error: lost connection to pod
My last attempt will be to try and route Dapr to the Datadog Agent
$ cat appconfig.todd.yaml
apiVersion: dapr.io/v1alpha1
kind: Configuration
metadata:
  name: appconfig
spec:
  metric:
    enabled: true
  metrics:
    enabled: true
  tracing:
    otel:
      endpointAddress: datadog-agent.default.svc.cluster.local:4318
      isSecure: false
      protocol: http
    samplingRate: "1"
    stdout: true
Then update it and rotate pods
$ kubectl delete configuration appconfig && kubectl apply -f /home/builder/Workspaces/quickstarts/tutorials/distributed-calculator/appconfig.todd.yaml && sleep 5 && kubectl delete pods -l app=subtract & kubectl delete pods -l app=multiply & kubectl delete pods -l app=add & kubectl delete pods -l app=divide & kubectl delete pod -l app=calculator-front-end
[1] 98514
[2] 98515
[3] 98517
[4] 98518
configuration.dapr.io "appconfig" deleted
pod "addapp-dcff99c45-h6qks" deleted
pod "calculator-front-end-8d968cff6-lnbdx" deleted
pod "multiplyapp-cb9f469f4-lwsmk" deleted
pod "divideapp-54565fdfb7-zd942" deleted
configuration.dapr.io/appconfig created
do some calcs
$ !2023
kubectl port-forward `kubectl get pod -l app=calculator-front-end -o go-template='{{range .items}}{{.metadata.name}}{{end}}'` 8080:8080
Forwarding from 127.0.0.1:8080 -> 8080
Forwarding from [::1]:8080 -> 8080
Handling connection for 8080
Handling connection for 8080
Handling connection for 8080
And yet another confirmation the datadog-agent service is rejecting traffic
$ kubectl logs -c daprd subtractapp-5b6d4cd9db-tsltd | tail -n2
time="2024-06-22T17:46:13.212888122Z" level=info msg="[CallLocal/subtractapp/subtract] Trace: 20c1715a90d0cafabf9f283b0565f4d8 Span: 169be6fb2cfb5fe7/bb6f9627e899d657 Time: [2024-06-22 17:46:10.018815981 +0000 UTC m=+87.013673098 ->  2024-06-22 17:46:10.024512768 +0000 UTC m=+87.019369885] Annotations: []" instance=subtractapp-5b6d4cd9db-tsltd scope=dapr.runtime.trace type=log ver=1.13.4
2024/06/22 17:46:13 traces export: Post "http://datadog-agent.default.svc.cluster.local:4318/v1/traces": dial tcp 34.118.237.234:4318: connect: connection refused
The more I search and search the more I just don’t see a way to send OTel to Datadog outside the standard OpenTelemetry collector. I found a current 3 week old issue seeking an exporter (Isssue #714).
This seems a bit nutty, but I refuse to concede defeat.
I’ll fire up an OTel Collector. I could use a [pre-baked k8s example(https://github.com/open-telemetry/opentelemetry-collector-contrib/tree/main/exporter/datadogexporter/examples/k8s-chart)].
Actually, let’s start with a simple example I used a couple years back
$ cat ./test.yaml
apiVersion: v1
data:
  otel-collector-config: |
    receivers:
      otlp:
        protocols:
          grpc:
            endpoint: 0.0.0.0:4317
          http:
            endpoint: 0.0.0.0:4318
      zipkin:
        endpoint: 0.0.0.0:9411
      prometheus:
        config:
          scrape_configs:
            - job_name: 'otel-collector'
              scrape_interval: 10s
              static_configs:
                - targets: [ '0.0.0.0:8888' ]
    extensions:
      health_check:
      pprof:
        endpoint: :1888
      zpages:
        endpoint: :55679
    exporters:
      zipkin:
        endpoint: "http://zipkin.default.svc.cluster.local:9411/api/v2/spans"
      # Depending on where you want to export your trace, use the
      # correct OpenTelemetry trace exporter here.
      #
      # Refer to
      # https://github.com/open-telemetry/opentelemetry-collector/tree/main/exporter
      # and
      # https://github.com/open-telemetry/opentelemetry-collector-contrib/tree/main/exporter
      # for full lists of trace exporters that you can use, and how to
      # configure them.
      datadog:
        api:
          key: "5asdfasdfasdfasdfasdfasdfasdfasdfasdfasdfsadfas1"

    service:
      extensions: [pprof, zpages, health_check]
      pipelines:
        traces:
          receivers: [zipkin]
          # List your exporter here.
          exporters: [datadog, zipkin]
        metrics:
          receivers: [prometheus]
          exporters: [datadog]
kind: ConfigMap
metadata:
  labels:
    app: opentelemetry
    component: otel-collector-conf
  name: otel-collector-conf
---
apiVersion: v1
kind: Service
metadata:
  name: otel-collector
  labels:
    app: opentelemetry
    component: otel-collector
spec:
  ports:
  - name: otlphttp
    port: 4318
    protocol: TCP
    targetPort: 4318
  selector:
    component: otel-collector
---
apiVersion: apps/v1
kind: Deployment
metadata:
  name: otel-collector
  labels:
    app: opentelemetry
    component: otel-collector
spec:
  replicas: 1  # scale out based on your usage
  selector:
    matchLabels:
      app: opentelemetry
  template:
    metadata:
      labels:
        app: opentelemetry
        component: otel-collector
    spec:
      containers:
      - name: otel-collector
        image: otel/opentelemetry-collector-contrib-dev:latest
        command:
          - "/otelcontribcol"
          - "--config=/conf/otel-collector-config.yaml"
        resources:
          limits:
            cpu: 1
            memory: 2Gi
          requests:
            cpu: 200m
            memory: 400Mi
        ports:
          - containerPort: 9411 # Default endpoint for Zipkin receiver.
        volumeMounts:
          - name: otel-collector-config-vol
            mountPath: /conf
        livenessProbe:
          httpGet:
            path: /
            port: 13133
        readinessProbe:
          httpGet:
            path: /
            port: 13133
      volumes:
        - configMap:
            name: otel-collector-conf
            items:
              - key: otel-collector-config
                path: otel-collector-config.yaml
          name: otel-collector-config-vol

$ kubectl apply -f ./test.yaml
configmap/otel-collector-conf created
service/otel-collector created
deployment.apps/otel-collector created
We can see the service created
$ kubectl get svc otel-collector
NAME             TYPE        CLUSTER-IP      EXTERNAL-IP   PORT(S)    AGE
otel-collector   ClusterIP   34.118.237.16   <none>        4318/TCP   14m
I should now be able to have Alloy send to the Otel Collector (which will act as my forwarder to Datadog)
$ cat alloy.cm.tootel.yaml
apiVersion: v1
kind: ConfigMap
metadata:
  name: alloy-config
data:
  config.alloy: |
    logging {
      level = "info"
      format = "logfmt"
    }

    // Send to New Relic
    otelcol.exporter.otlphttp "datadog" {
      client {
        endpoint = "http://otel-collector.default.svc.cluster.local:4318"
      }
    }

    // Collect OTLP
    otelcol.receiver.otlp "httpreceiver" {
      grpc {
        endpoint = "0.0.0.0:4317"
      }

      http {
        endpoint = "0.0.0.0:4318"
      }

      output {
        metrics = [otelcol.processor.batch.default.input]
        logs    = [otelcol.processor.batch.default.input]
        traces  = [otelcol.processor.batch.default.input]
      }
    }

    // Process and send
    otelcol.processor.batch "default" {

      output {
        metrics = [otelcol.exporter.otlphttp.datadog.input]
        logs    = [otelcol.exporter.otlphttp.datadog.input]
        traces  = [otelcol.exporter.otlphttp.datadog.input]
      }
    }
    discovery.kubernetes "podmetrics" {
      role = "pod"
    }

    discovery.kubernetes "nodes" {
      role = "node"
    }

    discovery.kubernetes "services" {
      role = "service"
    }

    discovery.kubernetes "endpoints" {
      role = "endpoints"
    }
I can now update the CM and rotate the pods
$ kubectl delete cm alloy-config && kubectl apply -f ./alloy.cm.tootel.yaml && kubectl delete pod -l app.kubernetes.io/instance=alloy,app.kubernetes.io/name=alloy
configmap "alloy-config" deleted
configmap/alloy-config created
pod "alloy-74dgm" deleted
pod "alloy-h55tx" deleted
pod "alloy-kdhml" deleted
I can see the new pods up and ready to receive traffic
$ kubectl logs alloy-29cgr | tail -n2
ts=2024-06-22T21:44:30.976059329Z level=warn msg="Using the 0.0.0.0 address exposes this server to every network interface, which may facilitate Denial of Service attacks. Enable the feature gate to change the default and remove this warning." component_path=/ component_id=otelcol.receiver.otlp.httpreceiver documentation=https://github.com/open-telemetry/opentelemetry-collector/blob/main/docs/security-best-practices.md#safeguards-against-denial-of-service-attacks "feature gate ID"=component.UseLocalHostAsDefaultHost
ts=2024-06-22T21:44:30.976160944Z level=info msg="Starting HTTP server" component_path=/ component_id=otelcol.receiver.otlp.httpreceiver endpoint=0.0.0.0:4318
Once I saw all the alloy pods rotate, I did some more calculations to generate some traces
$ kubectl port-forward `kubectl get pod -l app=calculator-front-end -o go-template='{{range .items}}{{.metadata.name}}{{end}}'` 8080:8080
Forwarding from 127.0.0.1:8080 -> 8080
Forwarding from [::1]:8080 -> 8080
Handling connection for 8080
Handling connection for 8080
Handling connection for 8080
Oops.. Dapr is still aimed at Datadog Agent
$ kubectl logs subtractapp-5b6d4cd9db-tsltd -c daprd | tail -n4
time="2024-06-22T21:48:30.029289481Z" level=info msg="[CallLocal/subtractapp/subtract] Trace: ac7829aee104d251a3d5d3affc1bd2bf Span: 7174e891b9f6df5d/597b04a786b22976 Time: [2024-06-22 21:48:26.507344391 +0000 UTC m=+14623.502201517 ->  2024-06-22 21:48:26.513915579 +0000 UTC m=+14623.508772705] Annotations: []" instance=subtractapp-5b6d4cd9db-tsltd scope=dapr.runtime.trace type=log ver=1.13.4
2024/06/22 21:48:30 traces export: Post "http://datadog-agent.default.svc.cluster.local:4318/v1/traces": dial tcp 34.118.237.234:4318: connect: connection refused
time="2024-06-22T21:48:45.029971244Z" level=info msg="[CallLocal/subtractapp/subtract] Trace: 05eca339f05688a67905985a5532ad61 Span: a3c33e6202a23c20/cdef98c3c063c183 Time: [2024-06-22 21:48:40.89717557 +0000 UTC m=+14637.892033046 ->  2024-06-22 21:48:40.900410315 +0000 UTC m=+14637.895267791] Annotations: []" instance=subtractapp-5b6d4cd9db-tsltd scope=dapr.runtime.trace type=log ver=1.13.4
2024/06/22 21:48:45 traces export: Post "http://datadog-agent.default.svc.cluster.local:4318/v1/traces": dial tcp 34.118.237.234:4318: connect: connection refused
Let’s use that Alloy appconfig
$ cat ./appconfig.to.alloy.yaml
apiVersion: dapr.io/v1alpha1
kind: Configuration
metadata:
  name: appconfig
spec:
  metric:
    enabled: true
  metrics:
    enabled: true
  tracing:
    otel:
      endpointAddress: alloy.default.svc.cluster.local:4318
      isSecure: false
      protocol: http
    samplingRate: "1"
    stdout: true
Then apply
$ kubectl delete configuration appconfig && kubectl apply -f ./appconfig.to.alloy.yaml && sleep 5 && kubectl delete pods -l app=subtract & kubectl delete pods -l app=multiply & kubectl delete pods -l app=add & kubectl delete pods -l app=divide & kubectl delete pod -l app=calculator-front-end
[1] 16175
[2] 16176
[3] 16178
[4] 16179
configuration.dapr.io "appconfig" deleted
pod "addapp-dcff99c45-9rrmx" deleted
pod "divideapp-54565fdfb7-tw9fh" deleted
pod "multiplyapp-cb9f469f4-vzs54" deleted
pod "calculator-front-end-8d968cff6-8c9mm" deleted
configuration.dapr.io/appconfig created
The pods are rotated
$ kubectl get pods
NAME                                           READY   STATUS    RESTARTS   AGE
addapp-dcff99c45-scxmk                         2/2     Running   0          79s
alloy-29cgr                                    2/2     Running   0          8m28s
alloy-d87hs                                    2/2     Running   0          8m28s
alloy-nmnbh                                    2/2     Running   0          8m28s
calculator-front-end-8d968cff6-l75mx           2/2     Running   0          79s
datadog-agent-8mgpt                            3/3     Running   0          8h
datadog-agent-cluster-agent-586974cb94-qktbf   1/1     Running   0          8h
datadog-agent-q4j8c                            3/3     Running   0          8h
datadog-agent-vmlcr                            3/3     Running   0          8h
divideapp-54565fdfb7-z4t8p                     2/2     Running   0          79s
multiplyapp-cb9f469f4-wkv5m                    2/2     Running   0          79s
otel-collector-5bfdb8d894-wb8wc                1/1     Running   0          25m
redis-master-0                                 1/1     Running   0          7h56m
redis-replicas-0                               1/1     Running   0          7h56m
redis-replicas-1                               1/1     Running   0          7h55m
redis-replicas-2                               1/1     Running   0          7h55m
subtractapp-5b6d4cd9db-jvdg6                   2/2     Running   0          73s
zipkin-7dc6bbcb-wcm5k                          1/1     Running   0          7h46m
So yet again, some calculations to generate some traces
$ kubectl port-forward `kubectl get pod -l app=calculator-front-end -o go-template='{{range .items}}{{.metadata.name}}{{end}}'` 8080:8080
Forwarding from 127.0.0.1:8080 -> 8080
Forwarding from [::1]:8080 -> 8080
Handling connection for 8080
Handling connection for 8080
Handling connection for 8080
I can see Dapr is sending traces
$ kubectl logs subtractapp-5b6d4cd9db-jvdg6 -c daprd | tail -n2
time="2024-06-22T21:53:59.196629021Z" level=info msg="[CallLocal/subtractapp/subtract] Trace: 73204a4f225856f9d5f877013ca36282 Span: 4dd4ea0dc8fcfab4/36e959fc03c70142 Time: [2024-06-22 21:53:58.154364168 +0000 UTC m=+129.193583787 ->  2024-06-22 21:53:58.156853221 +0000 UTC m=+129.196072840] Annotations: []" instance=subtractapp-5b6d4cd9db-jvdg6 scope=dapr.runtime.trace type=log ver=1.13.4
time="2024-06-22T21:54:14.198150391Z" level=info msg="[CallLocal/subtractapp/subtract] Trace: 51b825e67ef28ed60b956ebe531f5d3b Span: f7c826a1817f3fb4/9e29960e1c60eb06 Time: [2024-06-22 21:54:11.967475743 +0000 UTC m=+143.006695385 ->  2024-06-22 21:54:11.970025378 +0000 UTC m=+143.009245020] Annotations: []" instance=subtractapp-5b6d4cd9db-jvdg6 scope=dapr.runtime.trace type=log ver=1.13.4
I see it is rejected from sending to the Otel Collector
$ kubectl logs alloy-d87hs | tail -n3
ts=2024-06-22T21:55:21.712734841Z level=info msg="Exporting failed. Will retry the request after interval." component_path=/ component_id=otelcol.exporter.otlphttp.datadog error="failed to make an HTTP request: Post \"http://otel-collector.default.svc.cluster.local:4318/v1/traces\": dial tcp 34.118.237.16:4318: connect: connection refused" interval=18.448448749s
ts=2024-06-22T21:55:30.539183283Z level=info msg="Exporting failed. Will retry the request after interval." component_path=/ component_id=otelcol.exporter.otlphttp.datadog error="failed to make an HTTP request: Post \"http://otel-collector.default.svc.cluster.local:4318/v1/traces\": dial tcp 34.118.237.16:4318: connect: connection refused" interval=37.418263228s
ts=2024-06-22T21:55:34.206823284Z level=info msg="Exporting failed. Will retry the request after interval." component_path=/ component_id=otelcol.exporter.otlphttp.datadog error="failed to make an HTTP request: Post \"http://otel-collector.default.svc.cluster.local:4318/v1/traces\": dial tcp 34.118.237.16:4318: connect: connection refused" interval=43.239892629s
I’ll try a test span
$ cat test_span.json
{
 "resourceSpans": [
   {
     "resource": {
       "attributes": [
         {
           "key": "service.name",
           "value": {
             "stringValue": "test-with-curl"
           }
         }
       ]
     },
     "scopeSpans": [
       {
         "scope": {
           "name": "manual-test"
         },
         "spans": [
           {
             "traceId": "71699b6fe85982c7c8995ea3d9c95df2",
             "spanId": "3c191d03fa8be065",
             "name": "spanitron",
             "kind": 2,
             "droppedAttributesCount": 0,
             "events": [],
             "droppedEventsCount": 0,
             "status": {
               "code": 1
             }
           }
         ]
       }
     ]
   }
 ]
}
I’m getting the same rejection
$ kubectl port-forward svc/otel-collector 4318:4318
Forwarding from 127.0.0.1:4318 -> 4318
Forwarding from [::1]:4318 -> 4318
Handling connection for 4318
E0622 16:58:33.796047   17888 portforward.go:409] an error occurred forwarding 4318 -> 4318: error forwarding port 4318 to pod 6541a1127b7e9eef41e989c17b0d077fbcbde7c9d2d8007fc08ef36d0ea7a108, uid : failed to execute portforward in network namespace "/var/run/netns/cni-77dc17f7-669f-4452-2b0d-c60aea2a0682": failed to connect to localhost:4318 inside namespace "6541a1127b7e9eef41e989c17b0d077fbcbde7c9d2d8007fc08ef36d0ea7a108", IPv4: dial tcp4 127.0.0.1:4318: connect: connection refused IPv6 dial tcp6 [::1]:4318: connect: cannot assign requested address
error: lost connection to pod
I think this issue is because i left the Zipkin port in the deployment
$ kubectl describe pod otel-collector-5bfdb8d894-wb8wc | grep Port
    Port:          9411/TCP
    Host Port:     0/TCP
I did a quick edit of the deployment to fix
builder@DESKTOP-QADGF36:~/Workspaces/otel$ kubectl edit deployment otel-collector
deployment.apps/otel-collector edited
builder@DESKTOP-QADGF36:~/Workspaces/otel$ kubectl get pods | grep otel-coll
otel-collector-755f68fc47-cmxwq                1/1     Running   0          12s
builder@DESKTOP-QADGF36:~/Workspaces/otel$ kubectl describe pod otel-collector-755f68fc47-cmxwq | grep Port
    Port:          4318/TCP
    Host Port:     0/TCP
I’ll rotate my Alloy pods so I can see logs a bit easier
$ kubectl delete pod -l app.kubernetes.io/instance=alloy,app.kubernetes.io/name=alloy
pod "alloy-29cgr" deleted
pod "alloy-d87hs" deleted
pod "alloy-nmnbh" deleted
I port-forwarded to the calculator, did some tests.
I then checked an Alloy pod
$ kubectl logs alloy-5spgj | tail -n2
ts=2024-06-22T22:05:32.14865805Z level=info msg="Exporting failed. Will retry the request after interval." component_path=/ component_id=otelcol.exporter.otlphttp.datadog error="failed to make an HTTP request: Post \"http://otel-collector.default.svc.cluster.local:4318/v1/traces\": dial tcp 34.118.237.16:4318: connect: connection refused" interval=16.448400923s
ts=2024-06-22T22:05:34.047006951Z level=info msg="Exporting failed. Will retry the request after interval." component_path=/ component_id=otelcol.exporter.otlphttp.datadog error="failed to make an HTTP request: Post \"http://otel-collector.default.svc.cluster.local:4318/v1/traces\": dial tcp 34.118.237.16:4318: connect: connection refused" interval=21.647051497s
And same rejection
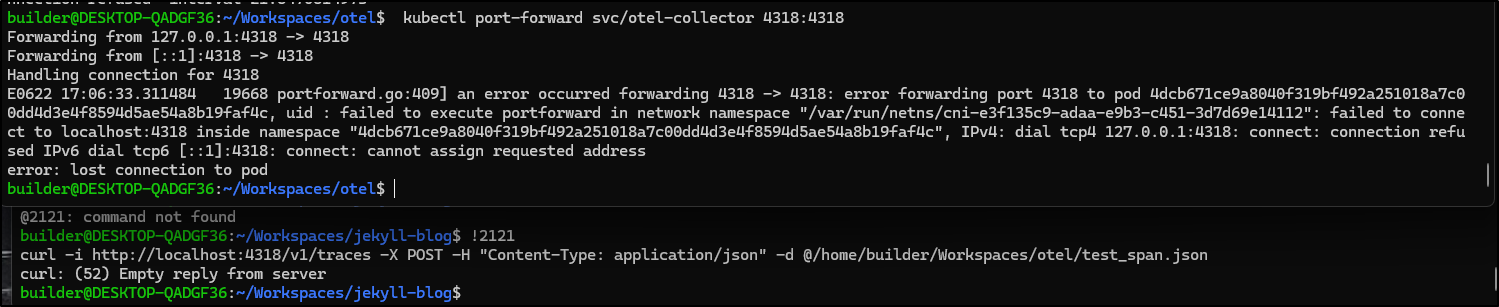
Same with port-forwarding to a pod
$ kubectl port-forward otel-collector-755f68fc47-cmxwq 4318:4318
Forwarding from 127.0.0.1:4318 -> 4318
Forwarding from [::1]:4318 -> 4318
Handling connection for 4318
E0622 17:08:03.079827   20044 portforward.go:409] an error occurred forwarding 4318 -> 4318: error forwarding port 4318 to pod 4dcb671ce9a8040f319bf492a251018a7c00dd4d3e4f8594d5ae54a8b19faf4c, uid : failed to execute portforward in network namespace "/var/run/netns/cni-e3f135c9-adaa-e9b3-c451-3d7d69e14112": failed to connect to localhost:4318 inside namespace "4dcb671ce9a8040f319bf492a251018a7c00dd4d3e4f8594d5ae54a8b19faf4c", IPv4: dial tcp4 127.0.0.1:4318: connect: connection refused IPv6 dial tcp6 [::1]:4318: connect: cannot assign requested address
error: lost connection to pod
I’m just going to try a new deployment from the Datadog contrib area
I’ll clone it down and go to the chart
builder@DESKTOP-QADGF36:~/Workspaces$ git clone https://github.com/open-telemetry/opentelemetry-collector-contrib.git opentelemetry-collector-contrib2
Cloning into 'opentelemetry-collector-contrib2'...
remote: Enumerating objects: 572152, done.
remote: Counting objects: 100% (2428/2428), done.
remote: Compressing objects: 100% (1342/1342), done.
remote: Total 572152 (delta 1556), reused 1629 (delta 1078), pack-reused 569724
Receiving objects: 100% (572152/572152), 453.26 MiB | 24.39 MiB/s, done.
Resolving deltas: 100% (469197/469197), done.
builder@DESKTOP-QADGF36:~/Workspaces$ cd opentelemetry-collector-contrib2/exporter/datadogexporter/examples/k8s-chart/
builder@DESKTOP-QADGF36:~/Workspaces/opentelemetry-collector-contrib2/exporter/datadogexporter/examples/k8s-chart$
I’ll add the API key to the CM
builder@DESKTOP-QADGF36:~/Workspaces/opentelemetry-collector-contrib2/exporter/datadogexporter/examples/k8s-chart$ vi configmap.yaml

builder@DESKTOP-QADGF36:~/Workspaces/opentelemetry-collector-contrib2/exporter/datadogexporter/examples/k8s-chart$ git diff configmap.yaml
diff --git a/exporter/datadogexporter/examples/k8s-chart/configmap.yaml b/exporter/datadogexporter/examples/k8s-chart/configmap.yaml
index 94379cedff..866a1e5820 100644
--- a/exporter/datadogexporter/examples/k8s-chart/configmap.yaml
+++ b/exporter/datadogexporter/examples/k8s-chart/configmap.yaml
@@ -56,7 +56,7 @@ data:
     exporters:
       datadog:
         api:
-          key: <YOUR_API_KEY_HERE>
+          key: 5asdfasdfasdfasdfasdfasdfasdfasdfasdfasdfsadfas1
           site: datadoghq.com # Change this to your site if not using the default
     processors:
       resourcedetection:
I’ll remove my last stab at it
builder@DESKTOP-QADGF36:~/Workspaces/opentelemetry-collector-contrib2/exporter/datadogexporter/examples/k8s-chart$ kubectl delete deployment otel-collector
deployment.apps "otel-collector" deleted
builder@DESKTOP-QADGF36:~/Workspaces/opentelemetry-collector-contrib2/exporter/datadogexporter/examples/k8s-chart$ kubectl delete svc otel-collector
service "otel-collector" deleted
I’ll now create the components
builder@DESKTOP-QADGF36:~/Workspaces/opentelemetry-collector-contrib2/exporter/datadogexporter/examples/k8s-chart$ kubectl apply -f ./serviceaccount.yaml
serviceaccount/otel-collector-account created
builder@DESKTOP-QADGF36:~/Workspaces/opentelemetry-collector-contrib2/exporter/datadogexporter/examples/k8s-chart$ kubectl apply -f ./roles.yaml
clusterrole.rbac.authorization.k8s.io/otel-collector-role created
clusterrolebinding.rbac.authorization.k8s.io/otel-collector created
builder@DESKTOP-QADGF36:~/Workspaces/opentelemetry-collector-contrib2/exporter/datadogexporter/examples/k8s-chart$ kubectl apply -f ./configmap.yaml
configmap/otel-agent-conf created
builder@DESKTOP-QADGF36:~/Workspaces/opentelemetry-collector-contrib2/exporter/datadogexporter/examples/k8s-chart$ kubectl apply -f ./daemonset.yaml
daemonset.apps/otel-agent created
The pods got stuck because they were trying to hold a host-port
          ports:
            - containerPort: 4318 # default port for OpenTelemetry HTTP receiver.
              hostPort: 4318
            - containerPort: 4317 # default port for OpenTelemetry gRPC receiver.
              hostPort: 4317
            - containerPort: 8888 # Default endpoint for querying metrics.

$ kubectl describe pod otel-agent-bzsr7 | tail -n
4
Events:
  Type     Reason            Age   From               Message
  ----     ------            ----  ----               -------
  Warning  FailedScheduling  101s  default-scheduler  0/3 nodes are available: 1 node(s) didn't have free ports for the requested pod ports. preemption: 0/3 nodes are available: 3 No preemption victims found for incoming pod.
I’ll use some unique ports
          ports:
            - containerPort: 4318 # default port for OpenTelemetry HTTP receiver.
              hostPort: 54318
            - containerPort: 4317 # default port for OpenTelemetry gRPC receiver.
              hostPort: 54317
            - containerPort: 8888 # Default endpoint for querying metrics.
That time worked
otel-agent-4zqf2                               1/1     Running   0          7s
otel-agent-df2lf                               1/1     Running   0          7s
otel-agent-z9b88                               1/1     Running   0          7s
Now we cannot expose a daemonset as a service
$ kubectl expose daemonset otel-agent --type=ClusterIP --port=4318 --target-port=9411
error: cannot expose a DaemonSet.apps
I do know we have 54318 working on the nodes so I just need to grab a node IP
$ kubectl get nodes gke-my-gke-cluster-default-pool-26739230-5g61 -o yaml | grep address:
  - address: 10.128.0.47
  - address: 35.223.17.110
I’ll pack that into the Alloy config
builder@DESKTOP-QADGF36:~/Workspaces/otel$ vi alloy.cm.tootel.yaml
builder@DESKTOP-QADGF36:~/Workspaces/otel$ cat alloy.cm.tootel.yaml | grep 4318
        endpoint = "http://10.128.0.47:54318"
        endpoint = "0.0.0.0:4318"
I’ll rotate the alloy pods
$ kubectl delete cm alloy-config && kubectl apply -f ./alloy.cm.tootel.yaml && kubectl delete pod -l app.kubernetes.io/instance=alloy,app.kubernetes.io/name=alloy
configmap "alloy-config" deleted
configmap/alloy-config created
pod "alloy-5spgj" deleted
pod "alloy-wxhdh" deleted
pod "alloy-xd8qj" deleted
And do some calculations
$ kubectl port-forward `kubectl get pod -l app=calculator-front-end -o go-template='{{range .items}}{{.metadata.name}}{{end}}'` 8080:8080
Forwarding from 127.0.0.1:8080 -> 8080
Forwarding from [::1]:8080 -> 8080
Handling connection for 8080
No errors in Alloy
builder@DESKTOP-QADGF36:~/Workspaces/otel$ kubectl logs alloy-9vr8b | tail -n5
ts=2024-06-22T22:47:16.191320007Z level=warn msg="Using the 0.0.0.0 address exposes this server to every network interface, which may facilitate Denial of Service attacks. Enable the feature gate to change the default and remove this warning." component_path=/ component_id=otelcol.receiver.otlp.httpreceiver documentation=https://github.com/open-telemetry/opentelemetry-collector/blob/main/docs/security-best-practices.md#safeguards-against-denial-of-service-attacks "feature gate ID"=component.UseLocalHostAsDefaultHost
ts=2024-06-22T22:47:16.191890705Z level=info msg="Starting GRPC server" component_path=/ component_id=otelcol.receiver.otlp.httpreceiver endpoint=0.0.0.0:4317
ts=2024-06-22T22:47:16.19213633Z level=warn msg="Using the 0.0.0.0 address exposes this server to every network interface, which may facilitate Denial of Service attacks. Enable the feature gate to change the default and remove this warning." component_path=/ component_id=otelcol.receiver.otlp.httpreceiver documentation=https://github.com/open-telemetry/opentelemetry-collector/blob/main/docs/security-best-practices.md#safeguards-against-denial-of-service-attacks "feature gate ID"=component.UseLocalHostAsDefaultHost
ts=2024-06-22T22:47:16.192349572Z level=info msg="Starting HTTP server" component_path=/ component_id=otelcol.receiver.otlp.httpreceiver endpoint=0.0.0.0:4318
ts=2024-06-22T22:47:16.192146048Z level=info msg="now listening for http traffic" service=http addr=0.0.0.0:12345
builder@DESKTOP-QADGF36:~/Workspaces/otel$ kubectl logs alloy-gmxxj | tail -n5
ts=2024-06-22T22:47:16.543693135Z level=info msg="now listening for http traffic" service=http addr=0.0.0.0:12345
ts=2024-06-22T22:47:16.543894319Z level=info msg="peers changed" new_peers=alloy-gmxxj
ts=2024-06-22T22:47:16.543896866Z level=info msg="Starting GRPC server" component_path=/ component_id=otelcol.receiver.otlp.httpreceiver endpoint=0.0.0.0:4317
ts=2024-06-22T22:47:16.544215825Z level=warn msg="Using the 0.0.0.0 address exposes this server to every network interface, which may facilitate Denial of Service attacks. Enable the feature gate to change the default and remove this warning." component_path=/ component_id=otelcol.receiver.otlp.httpreceiver documentation=https://github.com/open-telemetry/opentelemetry-collector/blob/main/docs/security-best-practices.md#safeguards-against-denial-of-service-attacks "feature gate ID"=component.UseLocalHostAsDefaultHost
ts=2024-06-22T22:47:16.544297567Z level=info msg="Starting HTTP server" component_path=/ component_id=otelcol.receiver.otlp.httpreceiver endpoint=0.0.0.0:4318
builder@DESKTOP-QADGF36:~/Workspaces/otel$ kubectl logs alloy-jzgrc | tail -n5
ts=2024-06-22T22:47:16.33741219Z level=warn msg="Using the 0.0.0.0 address exposes this server to every network interface, which may facilitate Denial of Service attacks. Enable the feature gate to change the default and remove this warning." component_path=/ component_id=otelcol.receiver.otlp.httpreceiver documentation=https://github.com/open-telemetry/opentelemetry-collector/blob/main/docs/security-best-practices.md#safeguards-against-denial-of-service-attacks "feature gate ID"=component.UseLocalHostAsDefaultHost
ts=2024-06-22T22:47:16.337511447Z level=info msg="Starting HTTP server" component_path=/ component_id=otelcol.receiver.otlp.httpreceiver endpoint=0.0.0.0:4318
ts=2024-06-22T22:47:16.337598824Z level=info msg="starting cluster node" peers="" advertise_addr=127.0.0.1:12345
ts=2024-06-22T22:47:16.337979667Z level=info msg="peers changed" new_peers=alloy-jzgrc
ts=2024-06-22T22:47:16.338287773Z level=info msg="now listening for http traffic" service=http addr=0.0.0.0:12345
Finally! Success
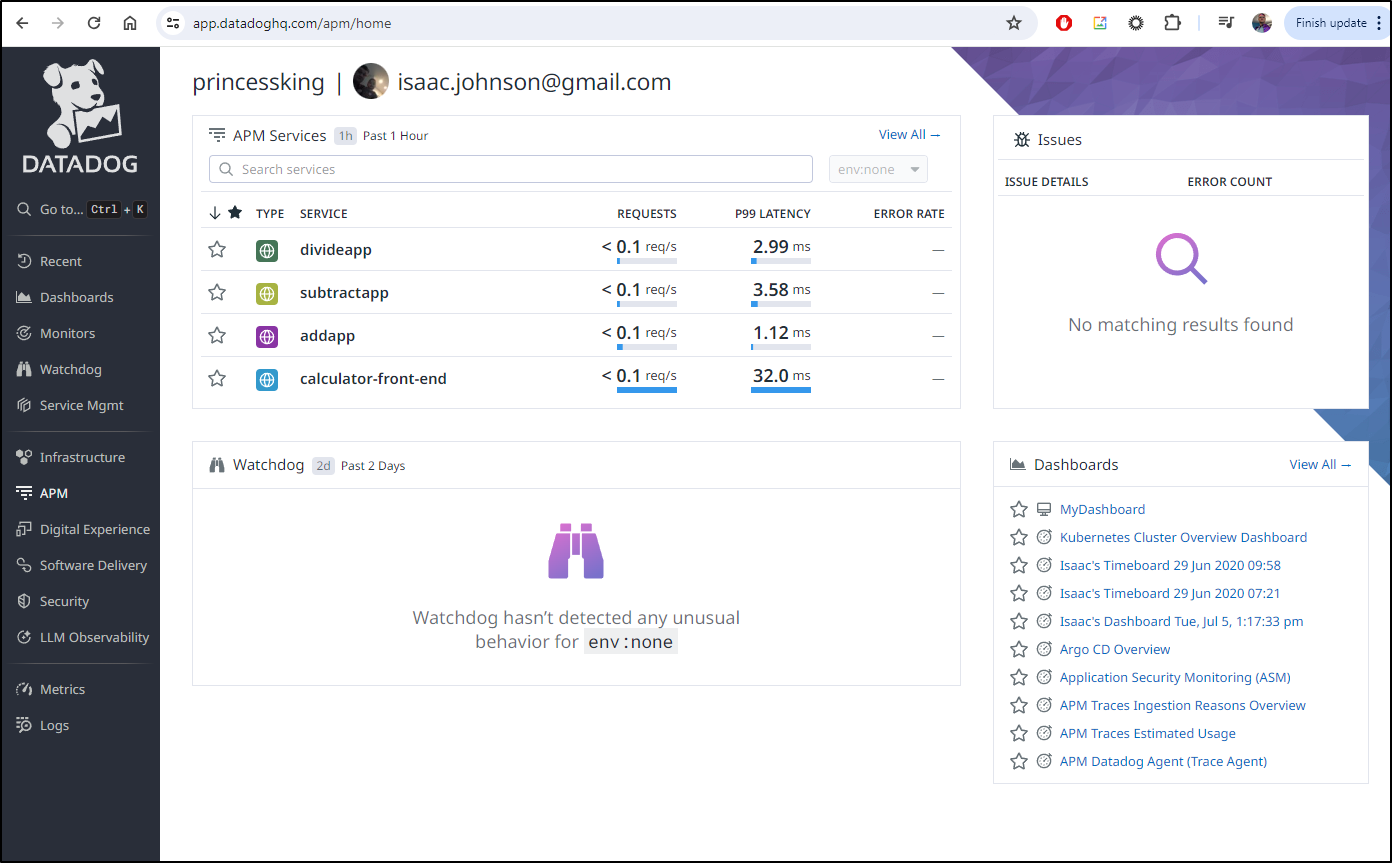
The daemonset isn’t setup to send traces to Zipkin or we would see them as well
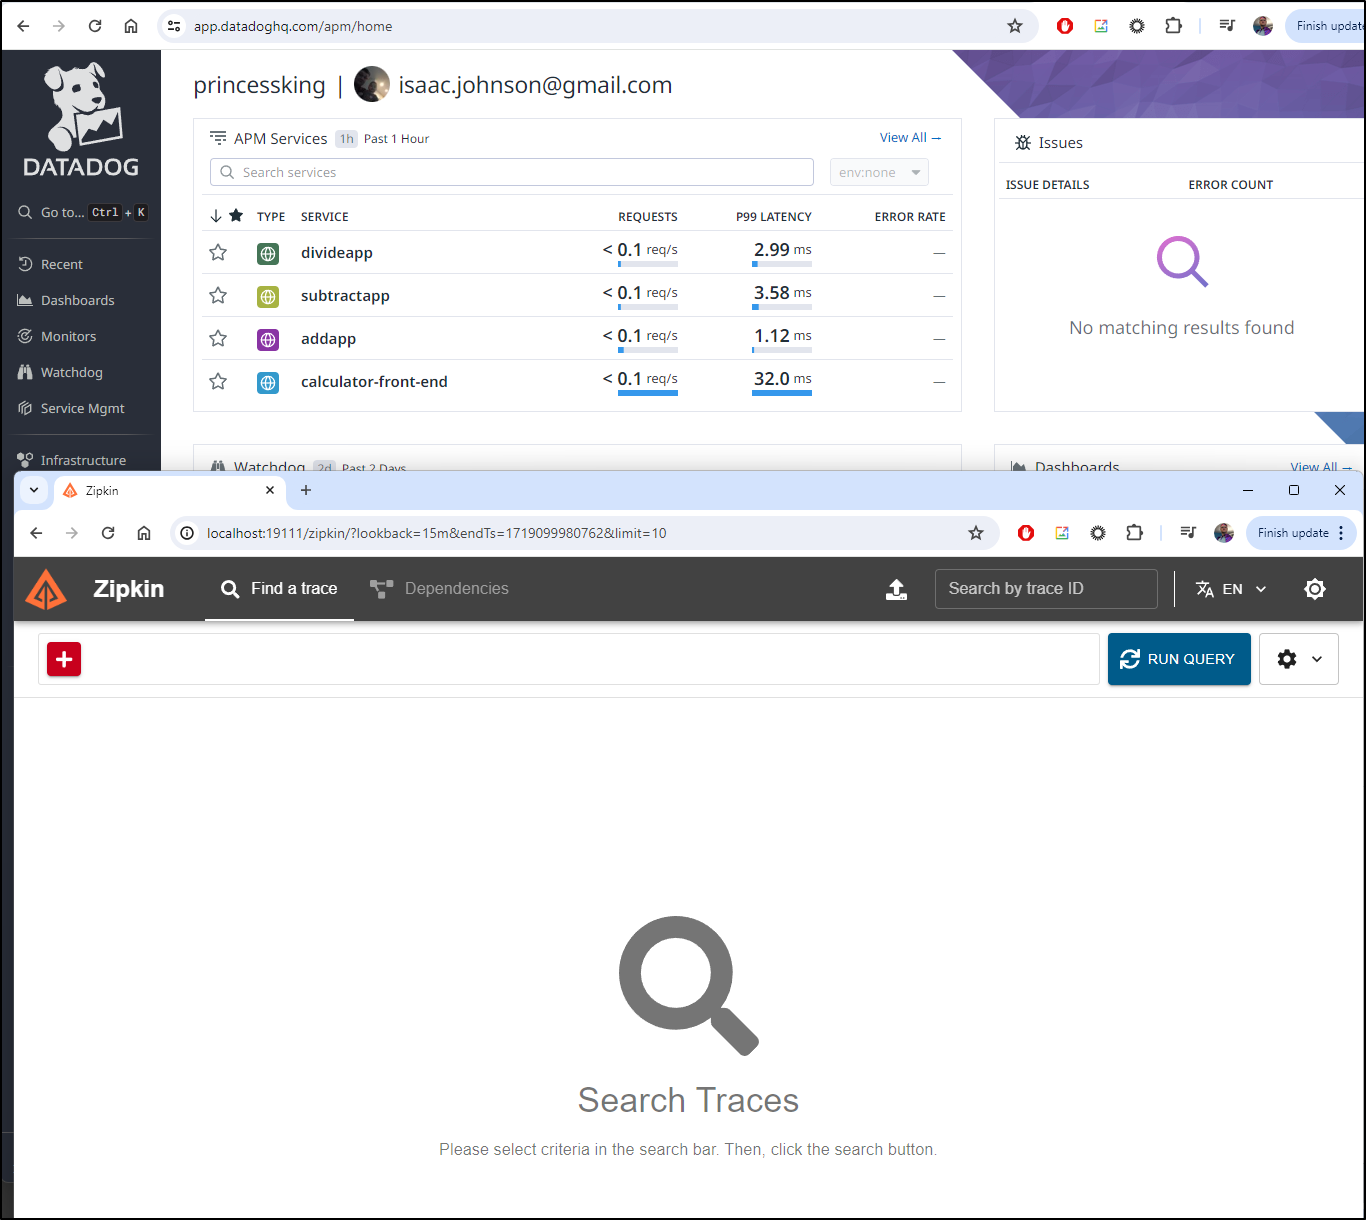
However, if I wanted to, I could add zipkin via the OTel collector
$ cat configmap.yaml | grep -C 4 zipkin
      datadog:
        api:
          key: 5asdfasdfasdfasdfasdfasdfasdfasdfasdfasdfsadfas1
          site: datadoghq.com # Change this to your site if not using the default
      zipkin:
        endpoint: "http://zipkin.default.svc.cluster.local:9411/api/v2/spans"
    processors:
      resourcedetection:
        # ensures host.name and other important resource tags
        # get picked up
--
          exporters: [datadog]
        traces:
          receivers: [otlp]
          processors: [resourcedetection, k8sattributes, batch]
          exporters: [datadog,zipkin]
        logs:
          receivers: [filelog]
          processors: [batch]
          exporters: [datadog]
I can then apply the CM and rotate pods
$ kubectl delete cm otel-agent-conf && kubectl apply -f ./configmap.yaml && kubectl delete pod -l app=opentelemetry
configmap "otel-agent-conf" deleted
configmap/otel-agent-conf created
pod "otel-agent-4zqf2" deleted
pod "otel-agent-df2lf" deleted
pod "otel-agent-z9b88" deleted
Run some calcs
$ !2096
kubectl port-forward `kubectl get pod -l app=calculator-front-end -o go-template='{{range .items}}{{.metadata.name}}{{end}}'` 8080:8080
Forwarding from 127.0.0.1:8080 -> 8080
Forwarding from [::1]:8080 -> 8080
Handling connection for 8080
Handling connection for 8080
Handling connection for 8080
Handling connection for 8080
Handling connection for 8080
I can then port-forward to zipkin
$ !2162
kubectl port-forward svc/zipkin 19111:9411
Forwarding from 127.0.0.1:19111 -> 9411
Forwarding from [::1]:19111 -> 9411
Handling connection for 19111
and view both traces
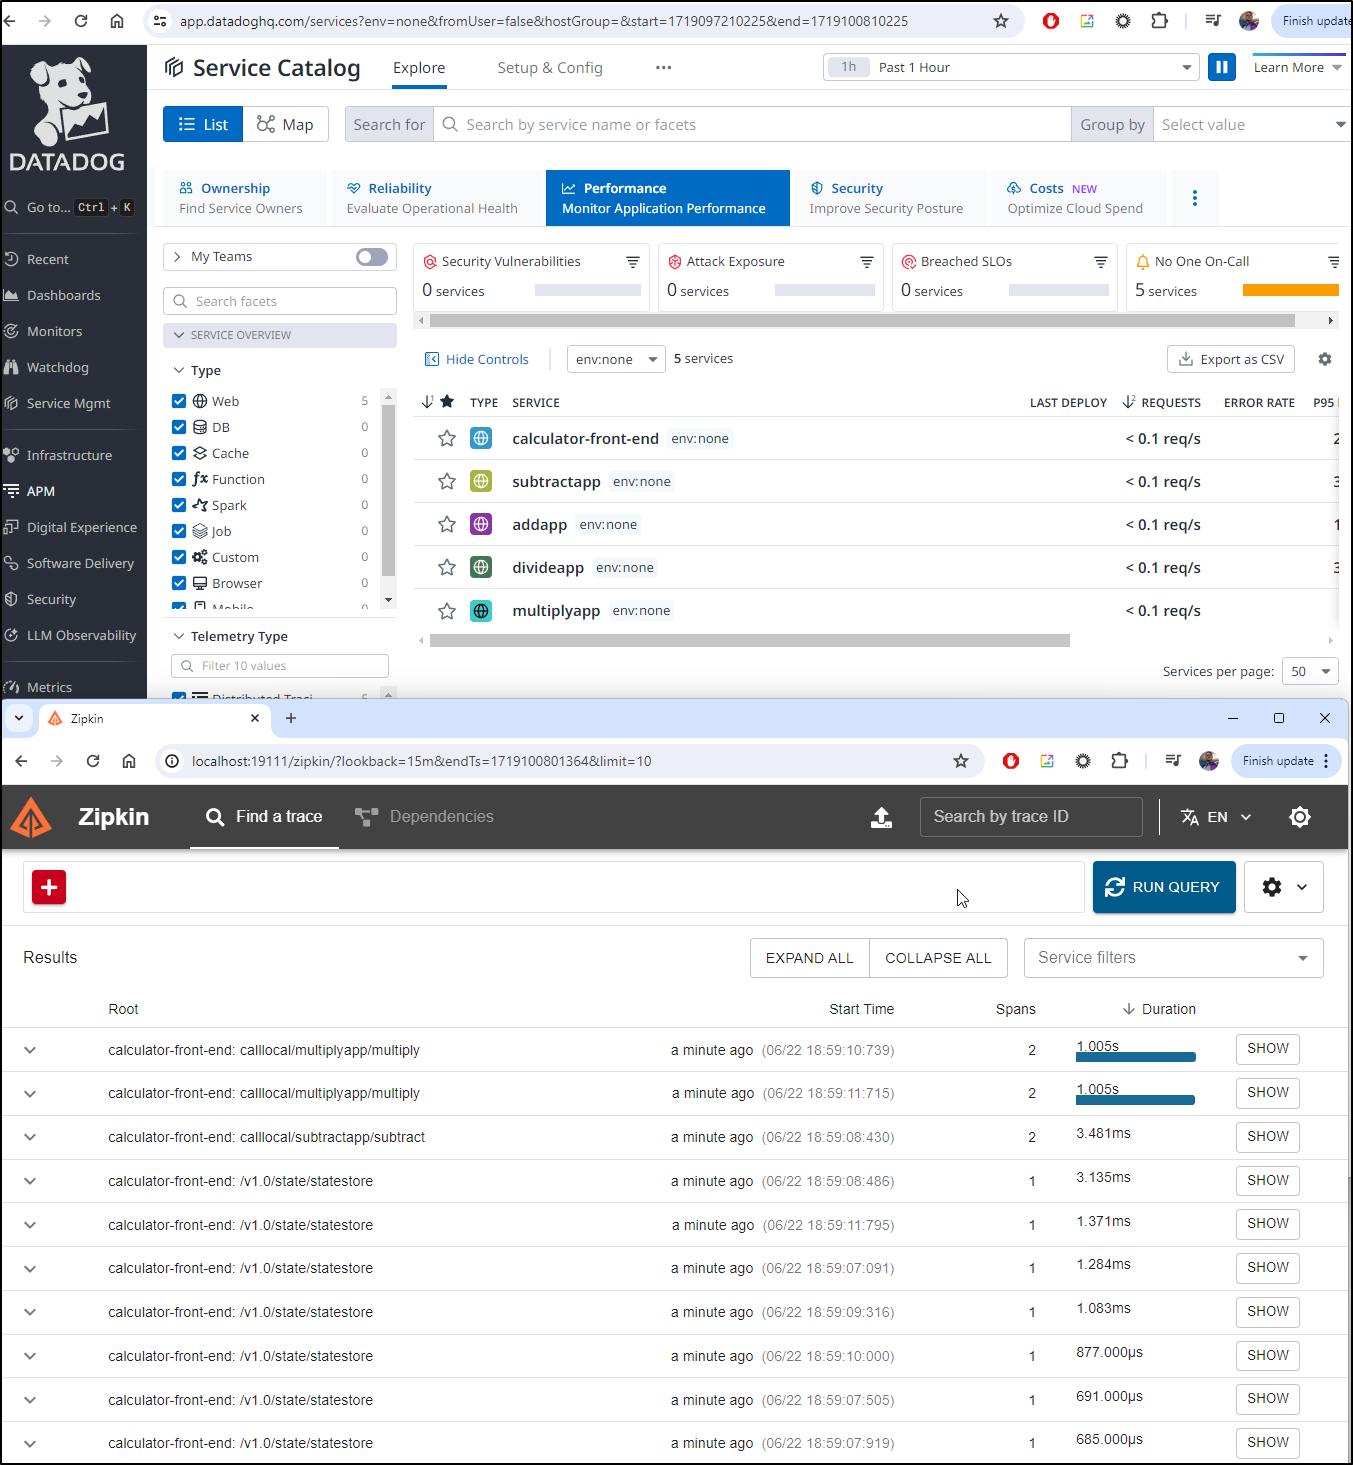
Review
Let’s review our settings. We have a Daemonset that is serving up OpenTelemetry and it uses the following OTel config to send to Datadog as well as a local Zipkin
$ kubectl get cm otel-agent-conf -o yaml
apiVersion: v1
data:
  otel-agent-config: |
    receivers:
      otlp:
        protocols:
          grpc:
          http:
      # The hostmetrics receiver is required to get correct infrastructure metrics in Datadog.
      hostmetrics:
        collection_interval: 10s
        scrapers:
          paging:
            metrics:
              system.paging.utilization:
                enabled: true
          cpu:
            metrics:
              system.cpu.utilization:
                enabled: true
          disk:
          filesystem:
            metrics:
              system.filesystem.utilization:
                enabled: true
          load:
          memory:
          network:
          processes:

      filelog:
        include_file_path: true
        poll_interval: 500ms
        include:
          # This will ensure that logs from the following path are collected.
          - /var/log/**/*otel-collector*/*.log
      # # Uncomment this block below to get access to system metrics regarding
      # # the OpenTelemetry Collector and its environment, such as spans or metrics
      # # processed, running and sent, queue sizes, uptime, k8s information
      # # and much more.
      #
      # # The prometheus receiver scrapes essential metrics regarding the OpenTelemetry Collector.
      # prometheus:
      #   config:
      #     scrape_configs:
      #     - job_name: 'otelcol'
      #       scrape_interval: 10s
      #       static_configs:
      #       - targets: ['0.0.0.0:8888']
    exporters:
      datadog:
        api:
          key: 5asdfasdfasdfasdfasdfasdfasdfasdfasdfasdfsadfas1
          site: datadoghq.com # Change this to your site if not using the default
      zipkin:
        endpoint: "http://zipkin.default.svc.cluster.local:9411/api/v2/spans"
    processors:
      resourcedetection:
        # ensures host.name and other important resource tags
        # get picked up
        detectors: [system, env, docker]
        timeout: 5s
        override: false
      # adds various tags related to k8s
      k8sattributes:
        passthrough: false
        auth_type: "serviceAccount"

        pod_association:
        - sources:
          - from: resource_attribute
            name: k8s.pod.ip

        extract:
          metadata:
            - k8s.pod.name
            - k8s.pod.uid
            - k8s.deployment.name
            - k8s.node.name
            - k8s.namespace.name
            - k8s.pod.start_time
            - k8s.replicaset.name
            - k8s.replicaset.uid
            - k8s.daemonset.name
            - k8s.daemonset.uid
            - k8s.job.name
            - k8s.job.uid
            - k8s.cronjob.name
            - k8s.statefulset.name
            - k8s.statefulset.uid
            - container.image.name
            - container.image.tag
            - container.id
            - k8s.container.name
            - container.image.name
            - container.image.tag
            - container.id

          labels:
          - tag_name: kube_app_name
            key: app.kubernetes.io/name
            from: pod
          - tag_name: kube_app_instance
            key: app.kubernetes.io/instance
            from: pod
          - tag_name: kube_app_version
            key: app.kubernetes.io/version
            from: pod
          - tag_name: kube_app_component
            key: app.kubernetes.io/component
            from: pod
          - tag_name: kube_app_part_of
            key: app.kubernetes.io/part-of
            from: pod
          - tag_name: kube_app_managed_by
            key: app.kubernetes.io/managed-by
            from: pod

      batch:
        # Datadog APM Intake limit is 3.2MB. Let's make sure the batches do not
        # go over that.
        send_batch_max_size: 1000
        send_batch_size: 100
        timeout: 10s
    service:
      # This will make the collector output logs in JSON format
      telemetry:
        logs:
          encoding: "json"
          initial_fields:
            # Add the service field to every log line. It can be used for filtering in Datadog.
            - service: "otel-collector"
      pipelines:
        metrics:
          receivers: [hostmetrics, otlp]
          processors: [resourcedetection, k8sattributes, batch]
          exporters: [datadog]
        traces:
          receivers: [otlp]
          processors: [resourcedetection, k8sattributes, batch]
          exporters: [datadog,zipkin]
        logs:
          receivers: [filelog]
          processors: [batch]
          exporters: [datadog]
kind: ConfigMap
metadata:
  annotations:
    kubectl.kubernetes.io/last-applied-configuration: |
      {"apiVersion":"v1","data":{"otel-agent-config":"receivers:\n  otlp:\n    protocols:\n      grpc:\n      http:\n  # The hostmetrics receiver is required to get correct infrastructure metrics in Datadog.\n  hostmetrics:\n    collection_interval: 10s\n    scrapers:\n      paging:\n        metrics:\n          system.paging.utilization:\n            enabled: true\n      cpu:\n        metrics:\n          system.cpu.utilization:\n            enabled: true\n      disk:\n      filesystem:\n        metrics:\n          system.filesystem.utilization:\n            enabled: true\n      load:\n      memory:\n      network:\n      processes:\n\n  filelog:\n    include_file_path: true\n    poll_interval: 500ms\n    include:\n      # This will ensure that logs from the following path are collected.\n      - /var/log/**/*otel-collector*/*.log\n  # # Uncomment this block below to get access to system metrics regarding\n  # # the OpenTelemetry Collector and its environment, such as spans or metrics\n  # # processed, running and sent, queue sizes, uptime, k8s information\n  # # and much more.\n  #\n  # # The prometheus receiver scrapes essential metrics regarding the OpenTelemetry Collector.\n  # prometheus:\n  #   config:\n  #     scrape_configs:\n  #     - job_name: 'otelcol'\n  #       scrape_interval: 10s\n  #       static_configs:\n  #       - targets: ['0.0.0.0:8888']\nexporters:\n  datadog:\n    api:\n      key: 5asdfasdfasdfasdfasdfasdfasdfasdfasdfasdfsadfas1\n      site: datadoghq.com # Change this to your site if not using the default\n  zipkin:\n    endpoint: \"http://zipkin.default.svc.cluster.local:9411/api/v2/spans\"\nprocessors:\n  resourcedetection:\n    # ensures host.name and other important resource tags\n    # get picked up\n    detectors: [system, env, docker]\n    timeout: 5s\n    override: false\n  # adds various tags related to k8s\n  k8sattributes:\n    passthrough: false\n    auth_type: \"serviceAccount\"\n\n    pod_association:\n    - sources:\n      - from: resource_attribute\n        name: k8s.pod.ip\n\n    extract:\n      metadata:\n        - k8s.pod.name\n        - k8s.pod.uid\n        - k8s.deployment.name\n        - k8s.node.name\n        - k8s.namespace.name\n        - k8s.pod.start_time\n        - k8s.replicaset.name\n        - k8s.replicaset.uid\n        - k8s.daemonset.name\n        - k8s.daemonset.uid\n        - k8s.job.name\n        - k8s.job.uid\n        - k8s.cronjob.name\n        - k8s.statefulset.name\n        - k8s.statefulset.uid\n        - container.image.name\n        - container.image.tag\n        - container.id\n        - k8s.container.name\n        - container.image.name\n        - container.image.tag\n        - container.id\n\n      labels:\n      - tag_name: kube_app_name\n        key: app.kubernetes.io/name\n        from: pod\n      - tag_name: kube_app_instance\n        key: app.kubernetes.io/instance\n        from: pod\n      - tag_name: kube_app_version\n        key: app.kubernetes.io/version\n        from: pod\n      - tag_name: kube_app_component\n        key: app.kubernetes.io/component\n        from: pod\n      - tag_name: kube_app_part_of\n        key: app.kubernetes.io/part-of\n        from: pod\n      - tag_name: kube_app_managed_by\n        key: app.kubernetes.io/managed-by\n        from: pod\n\n  batch:\n    # Datadog APM Intake limit is 3.2MB. Let's make sure the batches do not\n    # go over that.\n    send_batch_max_size: 1000\n    send_batch_size: 100\n    timeout: 10s\nservice:\n  # This will make the collector output logs in JSON format\n  telemetry:\n    logs:\n      encoding: \"json\"\n      initial_fields:\n        # Add the service field to every log line. It can be used for filtering in Datadog.\n        - service: \"otel-collector\"\n  pipelines:\n    metrics:\n      receivers: [hostmetrics, otlp]\n      processors: [resourcedetection, k8sattributes, batch]\n      exporters: [datadog]\n    traces:\n      receivers: [otlp]\n      processors: [resourcedetection, k8sattributes, batch]\n      exporters: [datadog,zipkin]\n    logs:\n      receivers: [filelog]\n      processors: [batch]\n      exporters: [datadog]\n"},"kind":"ConfigMap","metadata":{"annotations":{},"labels":{"app":"opentelemetry","component":"otel-agent-conf"},"name":"otel-agent-conf","namespace":"default"}}
  creationTimestamp: "2024-06-22T23:57:03Z"
  labels:
    app: opentelemetry
    component: otel-agent-conf
  name: otel-agent-conf
  namespace: default
  resourceVersion: "397145"
  uid: 9b8e5345-6295-4f44-9fed-2563c246bec4
We get to the standard OTel collector by way of Grafana Alloy which is using that Deamonset port for http OTLP
$ kubectl get cm alloy-config -o yaml
apiVersion: v1
data:
  config.alloy: |
    logging {
      level = "info"
      format = "logfmt"
    }

    otelcol.exporter.otlphttp "datadog" {
      client {
        endpoint = "http://10.128.0.47:54318"
      }
    }

    // Collect OTLP
    otelcol.receiver.otlp "httpreceiver" {
      grpc {
        endpoint = "0.0.0.0:4317"
      }

      http {
        endpoint = "0.0.0.0:4318"
      }

      output {
        metrics = [otelcol.processor.batch.default.input]
        logs    = [otelcol.processor.batch.default.input]
        traces  = [otelcol.processor.batch.default.input]
      }
    }

    // Process and send
    otelcol.processor.batch "default" {

      output {
        metrics = [otelcol.exporter.otlphttp.datadog.input]
        logs    = [otelcol.exporter.otlphttp.datadog.input]
        traces  = [otelcol.exporter.otlphttp.datadog.input]
      }
    }
    discovery.kubernetes "podmetrics" {
      role = "pod"
    }

    discovery.kubernetes "nodes" {
      role = "node"
    }

    discovery.kubernetes "services" {
      role = "service"
    }

    discovery.kubernetes "endpoints" {
      role = "endpoints"
    }
kind: ConfigMap
metadata:
  annotations:
    kubectl.kubernetes.io/last-applied-configuration: |
      {"apiVersion":"v1","data":{"config.alloy":"logging {\n  level = \"info\"\n  format = \"logfmt\"\n}\n\notelcol.exporter.otlphttp \"datadog\" {\n  client {\n    endpoint = \"http://10.128.0.47:54318\"\n  }\n}\n\n// Collect OTLP\notelcol.receiver.otlp \"httpreceiver\" {\n  grpc {\n    endpoint = \"0.0.0.0:4317\"\n  }\n\n  http {\n    endpoint = \"0.0.0.0:4318\"\n  }\n\n  output {\n    metrics = [otelcol.processor.batch.default.input]\n    logs    = [otelcol.processor.batch.default.input]\n    traces  = [otelcol.processor.batch.default.input]\n  }\n}\n\n// Process and send\notelcol.processor.batch \"default\" {\n\n  output {\n    metrics = [otelcol.exporter.otlphttp.datadog.input]\n    logs    = [otelcol.exporter.otlphttp.datadog.input]\n    traces  = [otelcol.exporter.otlphttp.datadog.input]\n  }\n}\ndiscovery.kubernetes \"podmetrics\" {\n  role = \"pod\"\n}\n\ndiscovery.kubernetes \"nodes\" {\n  role = \"node\"\n}\n\ndiscovery.kubernetes \"services\" {\n  role = \"service\"\n}\n\ndiscovery.kubernetes \"endpoints\" {\n  role = \"endpoints\"\n}\n"},"kind":"ConfigMap","metadata":{"annotations":{},"name":"alloy-config","namespace":"default"}}
  creationTimestamp: "2024-06-22T22:47:14Z"
  name: alloy-config
  namespace: default
  resourceVersion: "352796"
  uid: 7849c599-1d5f-4a34-8bfe-a92d725111a9
Lastly, it is our Dapr appconfig that sends traces on to Alloy
$ kubectl get configuration appconfig -o yaml
apiVersion: dapr.io/v1alpha1
kind: Configuration
metadata:
  annotations:
    kubectl.kubernetes.io/last-applied-configuration: |
      {"apiVersion":"dapr.io/v1alpha1","kind":"Configuration","metadata":{"annotations":{},"name":"appconfig","namespace":"default"},"spec":{"metric":{"enabled":true},"metrics":{"enabled":true},"tracing":{"otel":{"endpointAddress":"alloy.default.svc.cluster.local:4318","isSecure":false,"protocol":"http"},"samplingRate":"1","stdout":true}}}
  creationTimestamp: "2024-06-22T21:51:38Z"
  generation: 1
  name: appconfig
  namespace: default
  resourceVersion: "317229"
  uid: a585904d-7405-407f-ba15-843271234078
spec:
  metric:
    enabled: true
  metrics:
    enabled: true
  tracing:
    otel:
      endpointAddress: alloy.default.svc.cluster.local:4318
      isSecure: false
      protocol: http
    samplingRate: "1"
    stdout: true
I’ve been running this cluster for the day which is going to get progressively more expensive
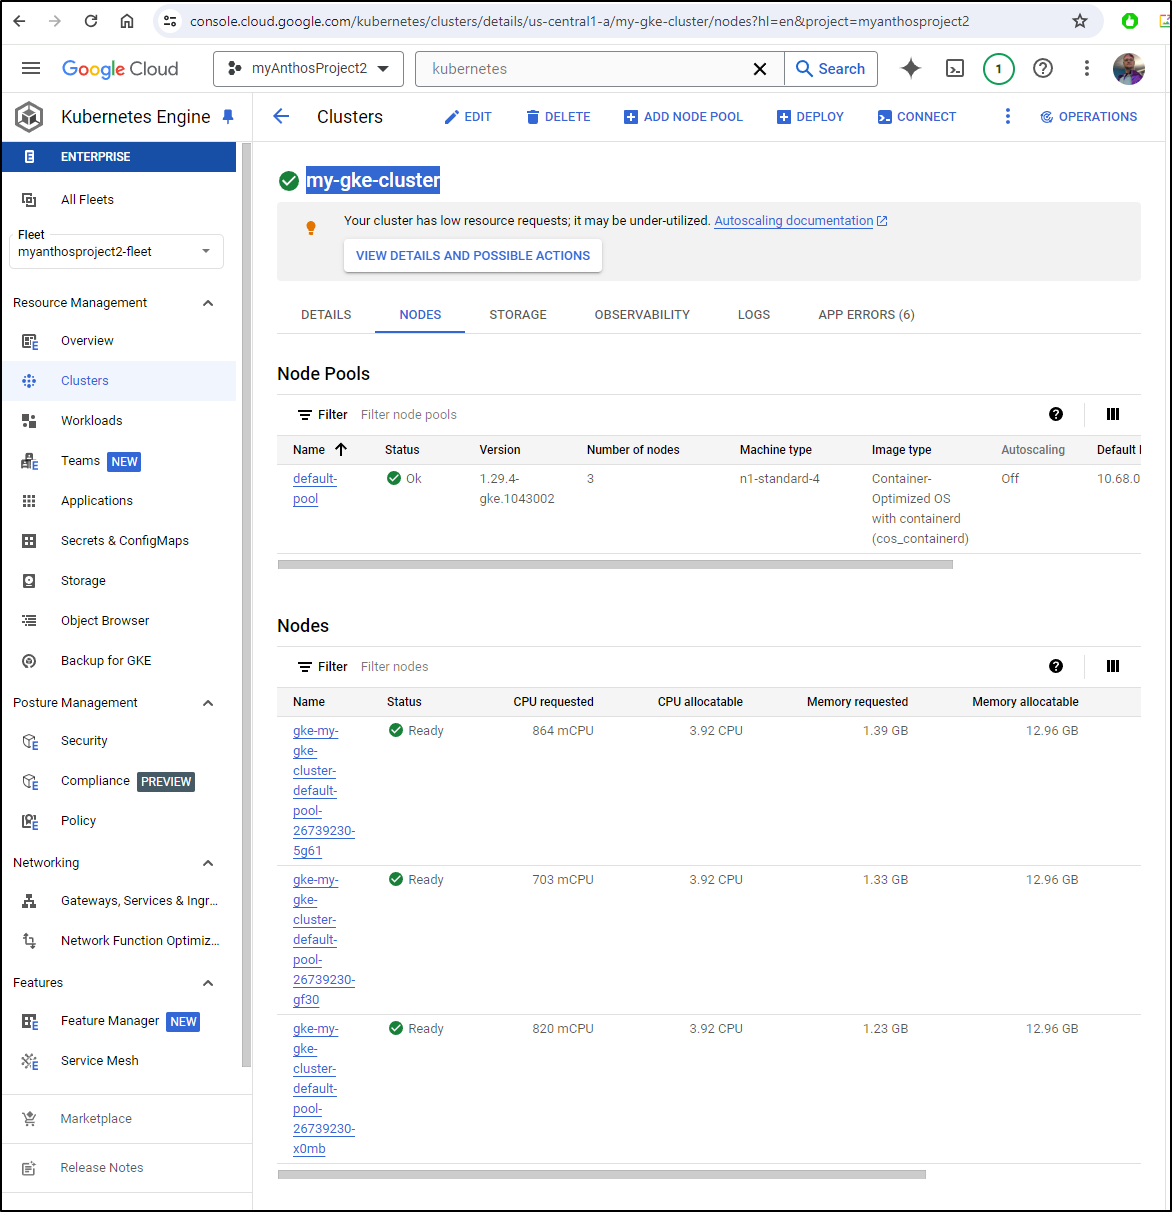
so let’s delete that now
$ gcloud container clusters delete my-gke-cluster --project=myanthosproject2 --region=us-central1-a
The following clusters will be deleted.
 - [my-gke-cluster] in [us-central1-a]

Do you want to continue (Y/n)?  Y

Deleting cluster my-gke-cluster...done.
Deleted [https://container.googleapis.com/v1/projects/myanthosproject2/zones/us-central1-a/clusters/my-gke-cluster].
Summary
We tried a lot of things. Not including GKE Autopilot which blocked us on Warden, with GKE Standard, you can see below all the paths we tried:
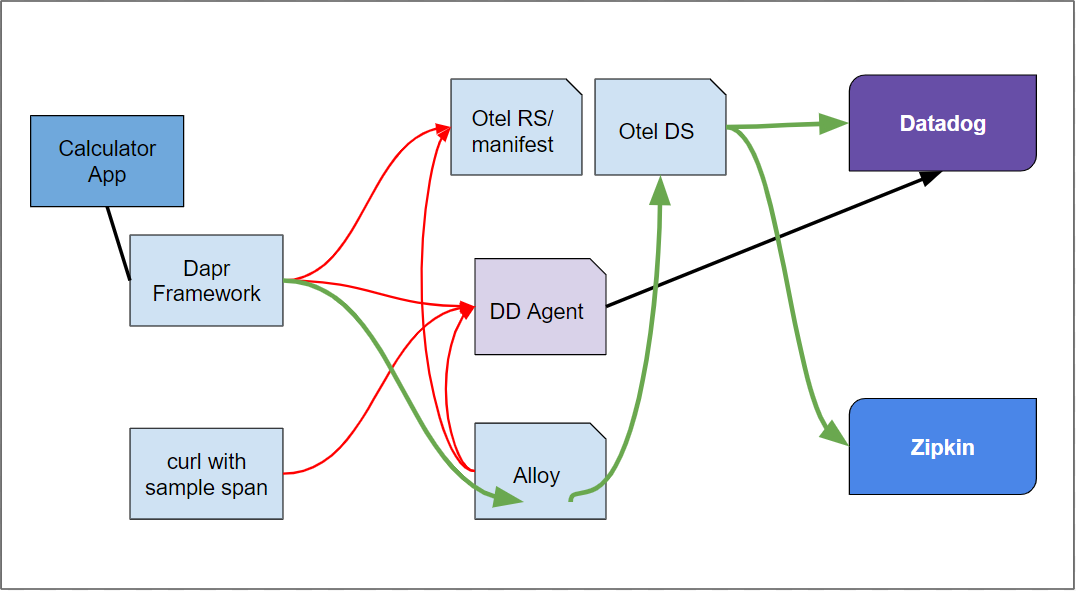
In the end, the working path was Dapr to Alloy on through to the standard OpenTelemetry collector (with Datadog contrib enabled) to Datadog.
We know that there is an outstanding request for a Datadog contrib plugin for Grafana Alloy. One of my challenges in even searching for information was that looking for “Datadog”, “plugin” and “Grafana” invariably pulls out plug-ins to pull data FROM Datadog into Grafana which is not our goal.
I suspect that there is some nested configuration in the Datadog chart or containerized agent I am just missing. I do plan to reach out to my Datadog friends to see if there is just some absent setting. From what I can see in all the tests, as it stands with my configuration, the pods just reject OTLP traces to 4317 and 4318 (though I focused on HTTP/4318 over GRPC/4317).
Since that request in the Github repo for Alloy is just 3 weeks old as of this writing, it could be satisfied by the time you read this. Until then, if I’m trying to pull OTel traces through to Datadog, I would focus on pulling in traces via eBPF using Datadog Network Monitoring or focusing on the standard OpenTelemetry collector with contrib and Datadog settings.